Time series prediction problems are a difficult type of predictive modeling problem.
Unlike regression predictive modeling, time series also adds the complexity of a sequence dependence among the input variables.
A powerful type of neural network designed to handle sequence dependence is called a recurrent neural network. The Long Short-Term Memory network or LSTM network is a type of recurrent neural network used in deep learning because very large architectures can be successfully trained.
In this post, you will discover how to develop LSTM networks in Python using the Keras deep learning library to address a demonstration time-series prediction problem.
After completing this tutorial, you will know how to implement and develop LSTM networks for your own time series prediction problems and other more general sequence problems. You will know:
About the International Airline Passengers time-series prediction problem
How to develop LSTM networks for regression, window, and time-step-based framing of time series prediction problems
How to develop and make predictions using LSTM networks that maintain state (memory) across very long sequences
In this tutorial, we will develop a number of LSTMs for a standard time series prediction problem. The problem and the chosen configuration for the LSTM networks are for demonstration purposes only; they are not optimized.
These examples will show exactly how you can develop your own differently structured LSTM networks for time series predictive modeling problems.
Kick-start your project with my new book Deep Learning for Time Series Forecasting, including step-by-step tutorials and the Python source code files for all examples.
Let’s get started.
Jul/2016: First published
Update Oct/2016: There was an error in how RMSE was calculated in each example. Reported RMSEs were just plain wrong. Now, RMSE is calculated directly from predictions, and both RMSE and graphs of predictions are in the units of the original dataset. Models were evaluated using Keras 1.1.0, TensorFlow 0.10.0, and scikit-learn v0.18. Thanks to all those that pointed out the issue and to Philip O’Brien for helping to point out the fix.
Update Mar/2017: Updated example for Keras 2.0.2, TensorFlow 1.0.1 and Theano 0.9.0
Time series prediction with LSTM recurrent neural networks in Python with Keras Photo by Margaux-Marguerite Duquesnoy, some rights reserved.
Problem Description
The problem you will look at in this post is the International Airline Passengers prediction problem.
This is a problem where, given a year and a month, the task is to predict the number of international airline passengers in units of 1,000. The data ranges from January 1949 to December 1960, or 12 years, with 144 observations.
Below is a sample of the first few lines of the file.
1
2
3
4
5
6
"Month","Passengers"
"1949-01",112
"1949-02",118
"1949-03",132
"1949-04",129
"1949-05",121
You can load this dataset easily using the Pandas library. You are not interested in the date, given that each observation is separated by the same interval of one month. Therefore, when you load the dataset, you can exclude the first column.
Once loaded, you can easily plot the whole dataset. The code to load and plot the dataset is listed below.
You can see an upward trend in the dataset over time.
You can also see some periodicity in the dataset that probably corresponds to the Northern Hemisphere vacation period.
Plot of the airline passengers dataset
Let’s keep things simple and work with the data as-is.
Normally, it is a good idea to investigate various data preparation techniques to rescale the data and make it stationary.
Need help with Deep Learning for Time Series?
Take my free 7-day email crash course now (with sample code).
Click to sign-up and also get a free PDF Ebook version of the course.
Long Short-Term Memory Network
The Long Short-Term Memory network, or LSTM network, is a recurrent neural network trained using Backpropagation Through Time that overcomes the vanishing gradient problem.
As such, it can be used to create large recurrent networks that, in turn, can be used to address difficult sequence problems in machine learning and achieve state-of-the-art results.
Instead of neurons, LSTM networks have memory blocks connected through layers.
A block has components that make it smarter than a classical neuron and a memory for recent sequences. A block contains gates that manage the block’s state and output. A block operates upon an input sequence, and each gate within a block uses the sigmoid activation units to control whether it is triggered or not, making the change of state and addition of information flowing through the block conditional.
There are three types of gates within a unit:
Forget Gate: conditionally decides what information to throw away from the block
Input Gate: conditionally decides which values from the input to update the memory state
Output Gate: conditionally decides what to output based on input and the memory of the block
Each unit is like a mini-state machine where the gates of the units have weights that are learned during the training procedure.
You can see how you may achieve sophisticated learning and memory from a layer of LSTMs, and it is not hard to imagine how higher-order abstractions may be layered with multiple such layers.
LSTM Network for Regression
You can phrase the problem as a regression problem.
That is, given the number of passengers (in units of thousands) this month, what is the number of passengers next month?
You can write a simple function to convert the single column of data into a two-column dataset: the first column containing this month’s (t) passenger count and the second column containing next month’s (t+1) passenger count to be predicted.
Before you start, let’s first import all the functions and classes you will use. This assumes a working SciPy environment with the Keras deep learning library installed.
1
2
3
4
5
6
7
8
9
import numpy asnp
import matplotlib.pyplot asplt
import pandas aspd
import tensorflow astf
from tensorflow.keras.models import Sequential
from tensorflow.keras.layers import Dense
from tensorflow.keras.layers import LSTM
from sklearn.preprocessing import MinMaxScaler
from sklearn.metrics import mean_squared_error
Before you do anything, it is a good idea to fix the random number seed to ensure your results are reproducible.
1
2
# fix random seed for reproducibility
tf.random.set_seed(7)
You can also use the code from the previous section to load the dataset as a Pandas dataframe. You can then extract the NumPy array from the dataframe and convert the integer values to floating point values, which are more suitable for modeling with a neural network.
LSTMs are sensitive to the scale of the input data, specifically when the sigmoid (default) or tanh activation functions are used. It can be a good practice to rescale the data to the range of 0-to-1, also called normalizing. You can easily normalize the dataset using the MinMaxScaler preprocessing class from the scikit-learn library.
1
2
3
# normalize the dataset
scaler=MinMaxScaler(feature_range=(0,1))
dataset=scaler.fit_transform(dataset)
After you model the data and estimate the skill of your model on the training dataset, you need to get an idea of the skill of the model on new unseen data. For a normal classification or regression problem, you would do this using cross validation.
With time series data, the sequence of values is important. A simple method that you can use is to split the ordered dataset into train and test datasets. The code below calculates the index of the split point and separates the data into the training datasets, with 67% of the observations used to train the model, leaving the remaining 33% for testing the model.
Now, you can define a function to create a new dataset, as described above.
The function takes two arguments: the dataset, which is a NumPy array you want to convert into a dataset, and the look_back, which is the number of previous time steps to use as input variables to predict the next time period—in this case, defaulted to 1.
This default will create a dataset where X is the number of passengers at a given time (t), and Y is the number of passengers at the next time (t + 1).
It can be configured by constructing a differently shaped dataset in the next section.
1
2
3
4
5
6
7
8
# convert an array of values into a dataset matrix
def create_dataset(dataset,look_back=1):
dataX,dataY=[],[]
foriinrange(len(dataset)-look_back-1):
a=dataset[i:(i+look_back),0]
dataX.append(a)
dataY.append(dataset[i+look_back,0])
returnnp.array(dataX),np.array(dataY)
Let’s take a look at the effect of this function on the first rows of the dataset (shown in the unnormalized form for clarity).
1
2
3
4
5
6
X Y
112 118
118 132
132 129
129 121
121 135
If you compare these first five rows to the original dataset sample listed in the previous section, you can see the X=t and Y=t+1 pattern in the numbers.
Let’s use this function to prepare the train and test datasets for modeling.
1
2
3
4
# reshape into X=t and Y=t+1
look_back=1
trainX,trainY=create_dataset(train,look_back)
testX,testY=create_dataset(test,look_back)
The LSTM network expects the input data (X) to be provided with a specific array structure in the form of [samples, time steps, features].
Currently, the data is in the form of [samples, features], and you are framing the problem as one time step for each sample. You can transform the prepared train and test input data into the expected structure using numpy.reshape() as follows:
1
2
3
# reshape input to be [samples, time steps, features]
You are now ready to design and fit your LSTM network for this problem.
The network has a visible layer with 1 input, a hidden layer with 4 LSTM blocks or neurons, and an output layer that makes a single value prediction. The default sigmoid activation function is used for the LSTM blocks. The network is trained for 100 epochs, and a batch size of 1 is used.
Once the model is fit, you can estimate the performance of the model on the train and test datasets. This will give you a point of comparison for new models.
Note that you will invert the predictions before calculating error scores to ensure that performance is reported in the same units as the original data (thousands of passengers per month).
Finally, you can generate predictions using the model for both the train and test dataset to get a visual indication of the skill of the model.
Because of how the dataset was prepared, you must shift the predictions so that they align on the x-axis with the original dataset. Once prepared, the data is plotted, showing the original dataset in blue, the predictions for the training dataset in green, and the predictions on the unseen test dataset in red.
Note: Your results may vary given the stochastic nature of the algorithm or evaluation procedure, or differences in numerical precision. Consider running the example a few times and compare the average outcome.
Running the example produces the following output.
You can see that the model has an average error of about 23 passengers (in thousands) on the training dataset and about 49 passengers (in thousands) on the test dataset. Not that bad.
LSTM for Regression Using the Window Method
You can also phrase the problem so that multiple, recent time steps can be used to make the prediction for the next time step.
This is called a window, and the size of the window is a parameter that can be tuned for each problem.
For example, given the current time (t) to predict the value at the next time in the sequence (t+1), you can use the current time (t), as well as the two prior times (t-1 and t-2) as input variables.
When phrased as a regression problem, the input variables are t-2, t-1, and t, and the output variable is t+1.
The create_dataset() function created in the previous section allows you to create this formulation of the time series problem by increasing the look_back argument from 1 to 3.
A sample of the dataset with this formulation is as follows:
1
2
3
4
5
6
X1 X2 X3 Y
112 118 132 129
118 132 129 121
132 129 121 135
129 121 135 148
121 135 148 148
You can re-run the example in the previous section with the larger window size. The whole code listing with just the window size change is listed below for completeness.
1
2
3
4
5
6
7
8
9
10
11
12
13
14
15
16
17
18
19
20
21
22
23
24
25
26
27
28
29
30
31
32
33
34
35
36
37
38
39
40
41
42
43
44
45
46
47
48
49
50
51
52
53
54
55
56
57
58
59
60
61
62
63
64
65
66
67
68
69
70
# LSTM for international airline passengers problem with window regression framing
import numpy asnp
import matplotlib.pyplot asplt
import tensorflow astf
from pandas import read_csv
from keras.models import Sequential
from keras.layers import Dense
from keras.layers import LSTM
from sklearn.preprocessing import MinMaxScaler
from sklearn.metrics import mean_squared_error
# convert an array of values into a dataset matrix
Note: Your results may vary given the stochastic nature of the algorithm or evaluation procedure, or differences in numerical precision. Consider running the example a few times and compare the average outcome.
Running the example provides the following output:
You can see that the error was increased slightly compared to that of the previous section. The window size and the network architecture were not tuned: This is just a demonstration of how to frame a prediction problem.
LSTM trained on window method formulation of passenger prediction problem
LSTM for Regression with Time Steps
You may have noticed that the data preparation for the LSTM network includes time steps.
Some sequence problems may have a varied number of time steps per sample. For example, you may have measurements of a physical machine leading up to the point of failure or a point of surge. Each incident would be a sample of observations that lead up to the event, which would be the time steps, and the variables observed would be the features.
Time steps provide another way to phrase your time series problem. Like above in the window example, you can take prior time steps in your time series as inputs to predict the output at the next time step.
Instead of phrasing the past observations as separate input features, you can use them as time steps of the one input feature, which is indeed a more accurate framing of the problem.
You can do this using the same data representation as in the previous window-based example, except when you reshape the data, you set the columns to be the time steps dimension and change the features dimension back to 1. For example:
1
2
3
# reshape input to be [samples, time steps, features]
Note: Your results may vary given the stochastic nature of the algorithm or evaluation procedure, or differences in numerical precision. Consider running the example a few times and compare the average outcome.
Running the example provides the following output:
You can see that the results are slightly better than the previous example, although the structure of the input data makes a lot more sense.
LSTM trained on time step formulation of passenger prediction problem
LSTM with Memory Between Batches
The LSTM network has memory capable of remembering across long sequences.
Normally, the state within the network is reset after each training batch when fitting the model, as well as each call to model.predict() or model.evaluate().
You can gain finer control over when the internal state of the LSTM network is cleared in Keras by making the LSTM layer “stateful.” This means it can build a state over the entire training sequence and even maintain that state if needed to make predictions.
It requires that the training data not be shuffled when fitting the network. It also requires explicit resetting of the network state after each exposure to the training data (epoch) by calls to model.reset_states(). This means that you must create your own outer loop of epochs and within each epoch call model.fit() and model.reset_states(). For example:
Finally, when the LSTM layer is constructed, the stateful parameter must be set to True. Instead of specifying the input dimensions, you must hard code the number of samples in a batch, the number of time steps in a sample, and the number of features in a time step by setting the batch_input_shape parameter. For example:
Note: Your results may vary given the stochastic nature of the algorithm or evaluation procedure, or differences in numerical precision. Consider running the example a few times and compare the average outcome.
Running the example provides the following output:
You do see that results are better than some, worse than others. The model may need more modules and may need to be trained for more epochs to internalize the structure of the problem.
Stateful LSTM trained on regression formulation of passenger prediction problem
Stacked LSTMs with Memory Between Batches
Finally, let’s take a look at one of the big benefits of LSTMs: the fact that they can be successfully trained when stacked into deep network architectures.
LSTM networks can be stacked in Keras in the same way that other layer types can be stacked. One addition to the configuration that is required is that an LSTM layer prior to each subsequent LSTM layer must return the sequence. This can be done by setting the return_sequences parameter on the layer to True.
You can extend the stateful LSTM in the previous section to have two layers, as follows:
Note: Your results may vary given the stochastic nature of the algorithm or evaluation procedure, or differences in numerical precision. Consider running the example a few times and compare the average outcome.
Running the example produces the following output.
The predictions on the test dataset are again worse. This is more evidence to suggest the need for additional training epochs.
Stacked stateful LSTMs trained on regression formulation of passenger prediction problem
Summary
In this post, you discovered how to develop LSTM recurrent neural networks for time series prediction in Python with the Keras deep learning network.
Specifically, you learned:
About the international airline passenger time series prediction problem
How to create an LSTM for a regression and a window formulation of the time series problem
How to create an LSTM with a time step formulation of the time series problem
How to create an LSTM with state and stacked LSTMs with state to learn long sequences
Do you have any questions about LSTMs for time series prediction or about this post?
Ask your questions in the comments below, and I will do my best to answer.
Updated LSTM Time Series Forecasting Posts:
The example in this post is quite dated. See these better examples available for using LSTMs on time series:
I just don’t get one thing… If you’d like to predict 1 step in the future, why does the red line stop before the blue line does?
So for example, we have the testset untill end of the year 1960. How can i predict the future year? Or passangers at the 1/1/1961 (if dataset ends at 12/31/1960).
I have the same question about the future prediction. The “testPredict” has two fewer rows that the “test” once the algorithm is done running, how would I obtain the values for the a prediction 1 or 2 days ahead from the end date of the time series? Thanks.
I think in the ”create_dataset” function, the range should be “len(dataset)-look_back” but not “len(dataset)-look_back-1”. No “1”should be subtracted here.
excellent lecture! but I still feel somehow cofused about lstm. I think the timesteps of 1 and feature_size of 3 have made a great job. However, when exchange them, with 3 timesteps in lstm, the prediction at time t+1 seems like a value a little lower than the ground truth value at time t, which make the prediction curve shift to the right of the true value. It seems that lstm only learn memory from last step and makes it a little delay.
Please, could you explain to us why the prediction (red) is shifted by one step from the blue plot, because when we try to predict 4 of 8 steps the plot is shifted by 4 or 8 steps too. Note that the test set construction is correct. The plot is correct.
Hi Robin,
Are you up with a solution for the bug? as you rightly said, the testpredict is smaller than test. How do you modify the code so that it predicts the value on 1/1/1961?
Thanks for sharing this great tutorial! Can you please also suggest the way to get the forward forecast based on the LSTM method. For example, if we want to forecast the value of the series for the next few weeks (ahead of current time–As we usually do for the any time series data), then what would be process to do that.
Can you elaborate a bit on what is the use of modeling a time-series without being able to make predictions of future time? I ask because I’m learning LSTMs and I’m facing the same issue as the person above: I can model a time series and make accurate predictions for data that I already have, but have difficulty predicting future observations.
Thanks for this great tutorial Jason. I’m still having trouble figuring out what kind of graph do you get when you do this:
# create and fit the LSTM network
model = Sequential()
model.add(LSTM(4, input_shape=(1, look_back)))
model.add(Dense(1))
for instance if your lookback=1: the input is one value xt, and the target output is xt+1. How is “LSTM(4, input_shape=(1, look_back))” linking your LSTM blocks with the input?
Or do you have 1 input => 1 LSTM block which hidden value (output of the LSTM) is fed to a 4X1 dense MLP? So that the output of the LSTM is actually the input of a 1x4x1 MLP…
And if your input is [xt-1, xt] with target xt+1 (lookback=2), you have two LSTMs blocks (fed with xt-1 and xt respectively) and the hidden value of the second block is the input of a 1x4x1 MLP.
I hope I’m being clear, I really have troubles answering this question. Your tutorial helps though!
I want to know how to use four variable like latitude,longitude,altitude and weather parameter for aircraft trajectory prediction using LSTM and HMM(Hidden Marcov Model). thanks.
Thanks for your sharing. I am still struggling how to do a real future 30 days prediction based on the current program. I am thinking to loop it as tomorrow prediction is based on latest 60 days in history. Then, the day after tomorrow is the latest 59 days plus the prediction of tomorrow.
How do it implement it & extend it? The current one is not applicable to real world application. Please suggest whether I am on the right track.
Wow thiis is a very interesting algorithm for time series prediction. Who came up with this formula, whoever did should get some credit for it. I would really like to thank them.
It’s of the order “I have data like this…, what is the best way to model this problem”. It’s a tough StackOverflow question because it’s an open question rather than a specific technical question.
Generally, my answer would be “no idea, try lots of stuff and see what works best”.
I think your notion of online might also be confused (or I’m confused). Have you seen online implementations of LSTM? Keras does not support it as far as I know. You train your model then you make predictions. Unless of course you mean the maintained state of the model – but this is not online learning, it is just static model with state, the weights are not updated in an online manner unless you re-train your model frequently.
It might be worth stepping back from the code and taking some time to clearly define I/O of the problem and requirements to then figure out the right kind of algorithm/setup you need to solve it.
Hello Dr. Brownlee,
I have a question about the difference between the Time Steps and Windows method. Am I correct in understanding that the only difference is the shape of the data you feeding into the model? If so, can you give some intuition why the Time Steps method works better? If I have two sequences (For example, if I have 2 noisy signals, one noisier than the other), and I’m using them both to predict a sequence, which method do you think is better?
Hi Dr Brownlee
First thanks for your brilliant website. You mentioned that new lags are new features so in this particular what is the best number of lags for multivariate multi-target forecasting by lstm? Should I apply correlation in series or test randomly??? Does it affect the result if I consider the lag number too high?
Interesting post and a very useful website! Can I use LSTMS for time series classification, for a binary supervised problem? My data is arranged as time steps of 1 hr sequences leading up to an event and the occurrence and non-occurrence of the event are labelled in each instance. I have done a bit of research and have not seen many use cases in the literature. Do you think a different recurrent neural net or simpler MLP might work better in this case? Most of my the research done in my area has got OK results(70% accuracy) from feed forward neural networks and i thought to try out recurrent neural nets, specifically LSTMs to improve my accuracy.
I would suggest using a standard MLP with the window method as the baseline, then develop some LSTMs for comparison. I would expect LSTMs to generally perform better if there is information in the long sequences.
Thanks for this example. I ran the first code example (lookback=1) by just copying the code and can reproduce your train and test scores precisely, however my graph looks differently. Specifically for me the predicted graph (green and red lines) looks as if it is shifted by one to the right in comparison to what I see on this page. It also looks like the predicted graph starts at x=0 in your example, but my predicted graph starts at 1. So in my case it looks like the prediction is almost like predicting identity? Is there a way for me to verify what I could have done wrong?
when outputting the train and test score, you scale the output of the model.evaluate with the minmaxscaler to match into the original scale. I am not sure if I understand that correctly. The data values are between 104 and 622, the trainScore (which is the mean squared error) will be scaled into that range using a linear mapping, right? So your transformed trainscore can never be lower than the minimum of the dataset, i.e. 104. Shouldn’t the square root of the trainScore be transformed and then the minimum of the range be subtracted and squared again to get the mean square error in the original domain range? Like numpy.square(scalar.inverse_transform([[nump.sqrt(trainScore)]])-scaler.data_min_)
I believe I thought the default evaluation metric was RMSE rather than MSE and I was using the scaler to transform the RMSE score back into original units.
I will update the examples ASAP.
Update: All estimates of model error were updated to first convert the error score to RMSE and then invert scale transform back to original units.
I have one question.
In your examples, you are discussing a predictor such as {x(t-2),x(t-1),x(t)} -> x(t+1).
I want to know how to implement a predictor like {x(t-2),x(t-1),x(t)} -> {x(t+1), x(t+2)}.
Could you tell me how to do so?
First of all thanks for the tutorial. An excellent one at that.
However, I do have some questions regarding the underlying architecture that I’m trying to reconcile with what I’ve done learnt about. I posted a question here: http://stackoverflow.com/questions/38714959/understanding-keras-lstms which I felt was too long to post in this forum.
I would really appreciate your input, especially the question on time_steps vs features argument.
If I understand correctly, you want more elaboration on time steps vs features?
Features are your input variables. In this airline example we only have one input variable, but we can contrive multiple input variables using past time steps in what is called the window method. Normally, multiple features would be a multivariate time series.
Timesteps are the sequence through time for a give attribute. As we comment in the tutorial, this is the natural mapping of the problem onto LSTMs for this airline problem.
You always need a 3D array as input for LSTMs [samples, features, timesteps], but you can reduce each dimension to one if needed. We explore this ability in reframe the problem in the tutorial above.
You also ask about the point of stateful. It is helpful to have memory between batches over one training run. If we keep all of out time series samples in order, the method can learn the relationships between values across batches. If we did not enable the stateful parameter, the algorithm we no knowledge beyond each batch, much like a MLP.
I hope that helps, I’m happy to dig into a specific topic further if you have more questions.
Dr. Jason,
I think this is a good place to bring this question. Suppose if I have X_train, X_test, y_train and y_test, should I transform all the values into a np.array? If I have in this format, should I still use ‘create_dataset’ function to create X and y?
Dr Jason,
I have an hourly time series with multiple predictor variables. I skipped create_dataset and just converted all my X_train, X_test, y_train and y_test into np arrays. The reason is, ex: I use past three months as my training and I would like to predict for next 7 days, which will be about 168 observations. If this is the case, if I happen to prepare consistent, would my ‘look_back = 168’ in create_dataset function?
After a deep thought and research I am thinking to just use my X_train, y_train, X_test and y_test without doing a look back. The reason is, y_train is dependent on on my X_train features. Therefore, my gut feeling is not use look back or sliding window. I just wanted to confirm with you and please let me know if I am on right track. BTW, when are you planning on doing a multivariate time series analysis? if you can educate us on that, it will be great. Thank you sir!
So does that mean (in reference to the LSTM diagram in http://colah.github.io/posts/2015-08-Understanding-LSTMs/) that the cell memory is not passed between consecutive lstms if stateful=false (i.e. set to zero)? Or do you mean cell memory is reset to zero between consecutive batches (In this tutorial batch_size is 1). Although I guess I should point out that the hidden layer values are passed on, so it will still be different to a MLP (wouldn’t it?)
On a side note, the fact that the output has to be a factor of batch_size seems to be confounding. Feels like it limits me to using a batch_size of one.
If stateful is set to false (the default), then I understand according to the Keras documentation that the state within each LSTM node is reset after each batch, either for prediction or training.
This is useful if you do not want to use LSTMs in a stateful manner of you want to train with all of the required memory to learn from within each batch.
This does tie into the limit on batch size for prediction. The TF/Theano structures created from this network definition are optimized for the batch size.
I’m super confused here. If the LSTM node is reset after each batch (in this case batch_size 1), does that mean in each forward-backprop session, the LSTM starts with a fresh state without any memory of previous inputs, and it’s only input is a single value? If that’s the case, how could it possibly learn anything?
E.g., let’s say on both time step 10 and 15 the input value is 150, how does the network predict step (10+1) to be 180 and step (15+1) to be 130 while the only input is 150 and the LSTM start with a fresh state?
Hi Mango, I think you’re right. If the number of time-steps is one and the LSTM is not stateful, then I don’t think he is using the recurrent property of the LSTM at all.
I have just one small question: For some research work i am working on, I need to make a prediction, so I’ve been looking for the best possible solution and I am guessing its LSTM…
The app. that I am developing is used in a learning environment, so to predict is the probability of a certain student will submit one solution for a certain assignment…
I have data from previous years in this format:
A1 A2 A3 A4 …
Student 1 – Y Y Y Y N Y Y N
Student 2 – N N N N N Y Y Y
…
Where Y means that the student has submitted, and N otherwise…
From what I understood, the best to achieve what I need is by using the solution described in the section “LSTM For Regression Using the Window Method” where my data will be something like
I1 I2 I3 O
N N N N
Y Y Y Y
And when I present a new case like Y N N the “LSTM” will make a prediction according to what has been learnt in the training moment.
Did I understand it right? Do you suggest another way?
Hi Jason,
Very interesting. Is there a function to descale the scaled data (0-1)? You show the data from 0-1. I want to see the original scale data. This is a easy question. But, it is better to show the original scale data, I suppose.
Yes, you can save the MinMaxScaler used to scale the training data and use it later to scale new input data and in turn descale predictions. The call is scaler.inverse_transform() from memory.
Hi Jason, thanks for the tutorial. Is it because the input features or hyperparameter are not tuned so the prediction (t+1) is only using the input (t)? Thanks
I tried your code for time series prediction. On passing either univariate or multivariate data, the predictions of the target variable are same. Should’nt there be a difference in the predicted values. I expect the predictions to improve with the multivariate data. Please shed some light on this.
Thanks for the wonderful tutorial. It felt great following your code and implementing my first LSTM network. Looking forward to learning a lot more!!
Can we extend time series forecasting problems to multiple time series? I have the following problem in my mind. Suppose we have stock prices of 100 companies (instead of one) and we wanna forecast what happens in the next month for all the companies? Is it possible to use LSTMs and RNNs for such multiple time series problems?
Forecasting stock prices is not my area of expertise. Nevertheless, LSTMs can be used for multiple regression as well as sequence prediction (if you want to predict multiple steps ahead). Give it a shot.
i guess i have the same idea in mind as Madhav..^^ i want to predict multiple time series, each one represent the flow of one grid in the city(since i assume that the neighboured grids influence each other to some extend).. have you done your stock prediction with LSTM?? will you share me some tricks or experience? Thankyou~
If it is truly learning the dynamics of the pattern, the prediction should not look like a strict line. At least the previous information before the 400 values will pull down the curve a little bit.
Clarification: Of course what I said may not be correct. But I think this is an alarming concern to interrupt what the LSTM is really learning behind the scene.
A key to the examples is that the LSTM is capable of learning the sequence, not just the input-output pairs. From the sequence, it is able to predict the next step.
after investigating a bit, I have concluded that the 1 time-step LSTM is indeed the trivial identity function (you can convince yourself by reducing the layer to 1 neuron, and adding ad-hoc data to the test set, as you have). But if we think about it, this makes alot of sense that the ‘mimic’ function would minimize MSE for such a simple network – it doesn’t see enough time steps to learn the sequence, anyways.
However, if you increase the number of timesteps, you will see that it can reach lower MSE on the test set by slowly moving away from the mimic function to actually learning the sequence, although for low #’s of neurons the approximation will be rougher-looking. I recommend experimenting with the look_back amount, and adding more layers to see how the MSE can be reduced further!
It means it is feeding sequence of length 1 to the network in each training. Therefore, the RNN/LSTM is not unrolled. The updated internal state is not used anywhere (as it is also resetting the states of the machine in each batch).
I agree with what you said. But by setting timestep and look_back to be 1 as in the first example, it is not learning a sequence at all.
This is a very good point, thanks for mentioning it.
I have implemented an LSTM on a 1,500 points sample size and indeed sometimes I was wondering whether there really was a big difference with a “mimic” function.
A lot of work to predict the value t+1 while value at t would have been a good enough predictor!
hey Liu, it’s a very good observation. I still on the basics and I think these sort of information is really important if we want to build something with quality. Thanks.
Thanks for the tutorial as well.
Thanks for this amazing tut, could you please tell me about what is the main role of batch_size in model.fit() and output shape of LSTM layer parameter ?
I read somewhere that using batch_size is depend on our dataset why you chose batch_size = 1 for fitting model and what is the effect of choosing it’s value on calculating gradient of the model?
The batch_size is the number of samples from your train dataset shown to the model at a time. After batch_size samples are run through the network and error calculated, an update to the weights is performed. Too many and the updates are too big, too few, and the updates are too noisy. The hardware you use is also a factor for batch_size and you want to ensure you can fit the batch of samples in memory (e.g. so your GPU can get at them).
I chose a batch_size of 1 because I want to explore and demonstrate LSTMs on time series working with only one sample at a time, but potentially vary the number of features or time steps.
Thanks for this series. I have a question for you.
I want to apply a multi-classification problem for videos using LSTM. also, video samples have a different number of frames.
Dataset: samples of videos for actions like boxing, jumping, hand waving, etc.. (Dataset like UCF1101) . each class of action has one label.
so, each video has a label.
Really, I do not know how to describe the data set to LSTM when a number of frames sequence are different from one action to another and I do not know how to use it when a number of frames are fixed as well.
if you have any example of how to use:
LSTM, stacked of LSTM, or CNN with LSTM with this problem this will help me too much.
I wait for your recommendations
Thanks
Hi Jason. Thanks for such a wonderful tutorial. it helped me a lot to get an insight on LSTM’s. I too have a similar question. Can you please comment on this question.
Thanks for this great tutorial! I would like to ask, suppose I have a set of X points : X1, X2, .. Xn that contributes to the total sales of the day represented by Y, and I have 60 days data (Y1 until Y60), how do I do time series forecast using these data? Assuming that I would like to predict Y65. Do you have any sample or coding references?
I just found out the question that I have is a multi step ahead prediction, where all the X contributes to Y, and I would like to predict ahead the value of Y n days ahead. Is the example that you gave in this tutorial still relevant?
Thanks for your reply. I still would like to clarify after looking at the sequence to sequence concept. Assuming I would like to predict the daily total sales (Y), given x1 such as the total number of customers, total item A sold as x2, total item B sold as x3 and so on for the next few items, is sequence to sequence suitable for this?
I have another question. Looking at your example for the Window method, on line 35:
# reshape input to be [samples, time steps, features]
trainX = numpy.reshape(trainX, (trainX.shape[0], 1, trainX.shape[1]))
testX = numpy.reshape(testX, (testX.shape[0], 1, testX.shape[1]))
what if I would like to change the time steps to more than 1? What other parts of codes I would need to change? Currently when I change it, it says
ValueError: total size of new array must be unchanged.
For using stateful LSTM, to predict multiple steps, I came across suggestions to feed the output vector back into the model for the next timestep’s prediction. May I know how to get an output vector from based on your LSTM stateful example?
The LSTM will maintain internal state so that you only need to provide the next input pattern. The LSTM implementation in Keras does require that you provide your data in consistent batch sizes, but when experimenting with this you could reduce the batch size down to 1.
Dear Dr Jason,
I was following the instructions line-by-line. I too have this valueerror problem.
I refer to the section:
# create and fit the LSTM network
model = Sequential()
model.add(LSTM(4, input_shape=(1, look_back)))
model.add(Dense(1))
model.compile(loss=’mean_squared_error’, optimizer=’adam’)
model.fit(trainX, trainY, epochs=100, batch_size=1, verbose=2)
As soon as I enter the following code, REGARDLESS of the the size of the epochs, eg, epochs = 10, I get a very large error statement. The following is just some of the error.
ValueError: (‘The following error happened while compiling the node’, forall_inplace,cpu,scan_fn}(Elemwise{maximum,no_inplace}.0, Subtensor{int64:int64:int8}.0, IncSubtensor{InplaceSet;:int64:}.0, IncSubtensor{InplaceSet;:int64:}.0, Elemwise{Maximum}[(0, 0)].0, Subtensor{::, int64:int64:}.0, InplaceDimShuffle{x,0}.0, Subtensor{::, int64:int64:}.0, Subtensor{::, :int64:}.0, InplaceDimShuffle{x,0}.0, Subtensor{::, :int64:}.0, Subtensor{::, int64:int64:}.0, InplaceDimShuffle{x,0}.0, Subtensor{::, int64:int64:}.0, Subtensor{::, int64::}.0, InplaceDimShuffle{x,0}.0, Subtensor{::, int64::}.0), ‘\n’, ‘The following error happened while compiling the node’, Dot22(, ), ‘\n’, ‘invalid token “=” in ldflags_str: “-LC:openblas -lopenblas;gcc.cxxflags = -shared -Ic:ming64winclude -Lc:python34libs -lpython34 -DMS_WIN64″‘)
I have uninstalled Theano, then reinstalled Theano.
My Theano version is 1.0.1, and keras is version ‘2.1.5’
Theano is the not going to be upgraded according to team that ‘created’ it at the Uni of Montreal.
Should I downgrade the keras version and what do I need to do to downgrade.
I uninstalled Theano and used the following command to install Theano via the git program on my Windows pc:
pip install git+https://github.com/Theano/Theano.git#egg=Theano
Sucessful installatation.
But again as soon as I enter the following line:
model.fit(trainX, trainY, epochs=100, batch_size=1, verbose=2)
I get the following (cut-down) errors:
TypeError: c_compile_args() takes 1 positional argument but 2 were given
During handling of the above exception, another exception occurred:
Traceback (most recent call last):
File “C:\Python34\lib\site-packages\theano\tensor\blas.py”, line 443, in _ldflags
t0, t1, t2 = t[0:3]
ValueError: need more than 1 value to unpack
During handling of the above exception, another exception occurred:
lots of files from the Theano package were mentioned (cut out of the edit)
ValueError: (‘The following error happened while compiling the node’, forall_inplace,cpu,scan_fn}(Elemwise{maximum,no_inplace}.0, Subtensor{int64:int64:int8}.0, IncSubtensor{InplaceSet;:int64:}.0, IncSubtensor{InplaceSet;:int64:}.0, Elemwise{Maximum}[(0, 0)].0, Subtensor{::, int64:int64:}.0, InplaceDimShuffle{x,0}.0, Subtensor{::, int64:int64:}.0, Subtensor{::, :int64:}.0, InplaceDimShuffle{x,0}.0, Subtensor{::, :int64:}.0, Subtensor{::, int64:int64:}.0, InplaceDimShuffle{x,0}.0, Subtensor{::, int64:int64:}.0, Subtensor{::, int64::}.0, InplaceDimShuffle{x,0}.0, Subtensor{::, int64::}.0), ‘\n’, ‘The following error happened while compiling the node’, Dot22(, ), ‘\n’, ‘invalid token “=” in ldflags_str: “-LC:openblas -lopenblas;gcc.cxxflags = -shared -Ic:ming64winclude -Lc:python34libs -lpython34 -DMS_WIN64″‘)
Any idea, would be appreciated,
Anthony of Belfield, NSW 2191
Dear Dr Jason,
I did the following in the conda window:
activiate python34
conda update theano
# During this time, there were other packages which were installed including variations of gcc.
conda update keras. # Did not work, package does not exist
conda search -t conda keras # It told me that there was a package under some other directory, which is anaconda/keras.
conda install -c anaconda keras #unsuccessful – need Python v3.6.
When I am in python34 I run the lstm example and still get the same problem.
When I run in conda’s python34, I run the lstm but get different kind of compilation errors.
Conclusion: whether I use an external python34 or conda’s python34, the lstm example does not work. The kinds of errors are different.
Conclusion II: I may go to my alma mater’s wifi (very fast) and download the python36 and reinstall all packages to python36.
Dear Dr Jason,
I will be transitioning from py3.4.4 to 3.6.
I had another attempt to try the lstm example.
Today, 27/03/2018, I did one more attempt using the anaconda shell.
I either ‘pipped’ or ‘conded’ the most up-to-date files of keras, scikit-learn and theano within the anaconda dos prompt.
So I tried the LSTM example and got the same ‘value error’ that I had under py3.4 which is a separate installation.
In sum, whether I used my independently installed py3.4 or used the anaconda’s py3.4 through the anaconda shell, with all necessary packages updated, the result was the same: run the example, eg in the anaconda shell, python lstmexample.py OR on my independently installed py3.4, python lstexample.py or using my independently installed py3.4 ‘Idle, exec(open(‘lstmexample.py’).read()), THE RESULT WAS THE SAME.
Conclusion: I will be transitioning from py3.4.4 to py3.6. The py3.6 installation will be an independent installation because I have had success with independently installing other python packages and I feel I have a sense of control.
On top of that, since Theano will cease being updated source http://www.i-programmer.info/news/105-artificial-intelligence/11183-theano-to-step-down-after-version-10.html , I will go to Tensorflow which appears to be a going concern. ‘Hopefully’ that should work. Fortunately my laptop’s NVIDIA GPU is suitable for the cuda, I may try that. Ultimately I would like to program on the RPi which does not have an NVIDIA GPU and live within the confines of the RPi’s performance.
I’ll keep you in touch, when my ‘alma mater’ is ‘student-free’ during the Easter holiday season and I can use their very fast wifi.
Hang in there Anthony. I’m surprised at all the issues you are having. I believe the example works fine with Python 2 and Python 3 and regardless of the Keras backend. Ensure you have copied all of the code required and maintained the indenting.
Dear Dr Jason,
After trying so many attempts at ‘hand-coding’ directly into the Python interpreter I got the “valueerror” problem.
Despite highlighting and saving the code below the sentence “For completeness, below is the entire code example,” I still got the “valueerror” problem. That is I copied the identical code and pasted the copied code in the Notepad++ editor. Indenting was no problem in situation otherwise the interpreter would cease.
I saved the copied code as lstmexample.py.
Execution:
In the Idle interpreter: exec(open(‘c:\python34\lstmexample.py’).read())
via a dos shell: python c:\python34\lstmexample.py
Result same even when I use either the anaconda shell or the dossshell.
So I’ll be resuming my activity when I go to my ‘alma mater’ during the Easter break.
Dear Dr Jason,
Thank you for your reply:
I saved the above 70 lines as ‘lstmexample2.py’
Based on your above listing of the relevant python packages, with the exception of py3.6, here they are:
python: 3.4.4, Dr Jason’s is v3.6.
scipy: 1.0.1
numpy: 1.14.2
matplotlib: 2.2.2
pandas: 0.22.0
statsmodels: 0.8.0
sklearn: 0.19.1
nltk: 3.2.1 Dr Jason’s 3.2.4 – to pip, updated to 3.2.5
gensim: 0.13.4.1 Dr Jason’s 3.4.0 – to pip, updated to 3.4.0
xgboost: 0.6
tensorflow: n/a since only available for python >= 3.5, Dr Jason’s 1.6
theano: 1.0.1
keras: 2.1.5
In other words, the necessary packages were updated today 29/03/2018 at 0738
Restarted Python either the shell version (in DOS) or Idle version.
Result: with the exception of python3.4.4 and tensorflow (for python >=3.5), all other relevant packages have been updated. The python shell (c:> python c:\python34\lstmexample2.py’) or the Idle (exec(open(‘c:\python34\lstmexample2.py’).read()) produced the same output, “ValueError”
ValueError: (‘The following error happened while compiling the node’, forall_inplace,cpu,scan_fn}(Elemwise{maximum,no_inplace}.0, Subtensor{int64:int64:int8}.0, IncSubtensor{InplaceSet;:int64:}.0, IncSubtensor{InplaceSet;:int64:}.0, Elemwise{Maximum}[(0, 0)].0, Subtensor{::, int64:int64:}.0, InplaceDimShuffle{x,0}.0, Subtensor{::, int64:int64:}.0, Subtensor{::, :int64:}.0, InplaceDimShuffle{x,0}.0, Subtensor{::, :int64:}.0, Subtensor{::, int64:int64:}.0, InplaceDimShuffle{x,0}.0, Subtensor{::, int64:int64:}.0, Subtensor{::, int64::}.0, InplaceDimShuffle{x,0}.0, Subtensor{::, int64::}.0), ‘\n’, ‘The following error happened while compiling the node’, Dot22(, ), ‘\n’, ‘invalid token “=” in ldflags_str: “-LC:openblas -lopenblas;gcc.cxxflags = -shared -Ic:ming64winclude -Lc:python34libs -lpython34 -DMS_WIN64″‘)
>>>
Still puzzled.
Will eventually be transferring to v3.6 during the Easter break.
Dear Dr Jason,
I have transitioned Python3.4.4 to 3.6.5. I reinstalled the latest scipy, numpy, keras, tensorflow, etc.
I installed tensoflow and ensured that keras ran tensorflow as the background. Incidentally,
I forgot about installing xgboost,
Despite that, I successfully ran the above LSTM example without problem. Went through 100 epochs. The matplotlib’s plot of the predicted and original data was the same.
So the example worked.
Thank you,
Anthony of Belfield
Apparently, when using the tensor flow backend, you have to specify input_length in the LTSM constructor. Otherwise, you get an exception. I assume it would just be input_length=1
Hi Jason,
I applied your technique on stock prediction:
But, I am having some issues.
I take all the historical prices of a stock and frame it the same way the airline passenger prices are in a .csv file.
I use a look_back=20 and I get the following image:
First off, thanks again for this great blog, without you I would be nowhere, with LSTM, and life!
I am running a LSTM model that works, but when I make predictions with “model.predict” it spits out 4000 predictions, which look fine. However, when I run “model.predict” again and save those 4000 predictions again, they are different. From prediction 50 onward, they are all essentially the same, but the first few (that are very important to me) are very different. To give you an idea, the correlation between the first 10 predictions of both rounds is 0.11.
The problem wasn’t with numpy.random.seed(0) as I originally thought. I’ve tested this over and over, and even if on the exact same data, predictions are always different/inconsistent for the first few predictions, and only “converge” to some consistent predictions after about 50 predictions have been made previously (on the same or different input data).
Correct me if I’m wrong, but you don’t want to reset_state in the last training iteration do you? Basically my logic is that you want to carry through the last ‘state’ onto the test set because they occur right after the other.
Am I correct if I was to use Recurrent Neural Networks to predict Dengue Incidences against data on temperature, rainfall, humidity, and dengue incidences.. If so, how would I go about in the processing of my data. I already have the aforementioned data at hand and I have tried using a feed forward neural network using pybrain. It doesn’t seem to get the trend hence my trying of Recurrent Neural Network.
I am a little bit confused regarding the “statefulness”.
If I use a Sequential Model with LSTM layers and stateful set to false. Will this still be a recurrent network that feeds back into my nodes? How would I compare it to the standard LSTM model proposed by Hochreiter et al. (1997)? Do I have to use the stateful layers to mimic the behaviour presented in the original paper?
In essence, I have a simple time series of sales forecasts that show a weekly and partly a yearly pattern. It was easy to create a simple MLP with the Dense layer and the time window method. I put some sales values from the last week, the same week day a few weeks back and the sales of the days roughly a year before into my feature vector. Results are pretty good so far.
I now want to compare it to an LSTM approach. I am however not sure how I can model the weekly and yearly pattern correctly and if I need to use the stateful LSTM or not. Basically I want to use the power of an LSTM to predict a sequence of a longer period of time and hope that the forecasts will be better than with a standard (and much faster) MLP.
# reshape input to be [samples, time steps, features]
trainX = numpy.reshape(trainX, (trainX.shape[0], 1, trainX.shape[1]))
testX = numpy.reshape(testX, (testX.shape[0], 1, testX.shape[1]))
Isn’t it [samples, fetaures, timesteps] ?
When you switch to lookback = 3, you still use trainX.shape[0], 1, trainX.shape[1] as your reshape, and aren’t the timesteps the lookback? I noticed the Keras model doesn’t work unless you reshape in this way, which is really strange to me. Why do we have to have a matrix full of 1×1 vectors which hold another vector inside of them? Is this in case we have more features or something? Are there ever any cases where the ‘1’ in the reshape would be any other number?
I think the example given here is wrong in the sense, that each data point represents a sample with one single timestep. This doesn’t make sense at all if you think about the strengths of recurrent networks and especially LSTM. How is the LSTM going to memorize if there’s only one timestep for each sample?
Since we are working on a single time series, it should probably be the other way around, with one sample and n timesteps. One could also try and reduce the number of timesteps and split the time series up into samples of a week or a month depending on the data.
Not sure if this is all correct what I just said, but I get the feeling that this popular tutorial isn’t a 100% correct and therefore a bit misleading for the community.
I do provide multiple examples just so you can compare the methods, both learning by single sample, by window and by timestep.
For this specific problem, the timestep approach is probably the best way to model it, but if you want to use some of these examples as a template for your own problem, you have a few options to choose from.
If I want to predict t+1 in a test set with t, the prediction doesn’t make sense. If I shift the prediction, it make sense but I end up predicting t with t, using a next-step model that learnt the sequence. Nice exercise to get used with the implementation, but what’s the point in real life? I really want a t+1 prediction that match t+1 (not t) in the test set, What I’m missing?
This is an excellent tutuorial. I have a question. You have one LSTM (hidden) layer with 4 neurons. What if I construct a LSTM layer with only 1 neuron. Why should I have 4 neurons ? I suppose this is different from having two or layers (depth) ? Depth in my understanding is if you have more layers of LSTM.
If you have 4 LSTM neurons in first layers, does input get fed to all the 4 neurons in a fully connected fashion ? Can you explain that ?
If we reduce the number of neurons BELOW the number of features fed into an RNN, then does the model simply use as many features as the neuron number allows ?
For example, if I have 10 features but define a model with only 5 neurons in the initial layer(s), would the model only use the FIRST 5 features ?
Hi I have found when running your raw example on the data, the training data seems to be shifted to the right of the true plot and not the same as your graph in your first example, why could this be?
As far as I can tell (and you’ll have to excuse me if I’m being naive) this isn’t predicting the next timestep at all? Merely doing a good job at mimicking the previous timestep?
For example the with the first example, if we take the first timestep of trainX (trainX[0]) the prediction from the model doesn’t seem to be trying to predict what t+1 (trainX[1]) is, but merely mimics what it thinks fits the model at that particular timestep (trainX[0]) i.e. tries to copy the current timestep. Same for trainX[1], the prediction is not a prediction of trainX[2] but a guess at trainX[1]… Hence which the graphs in the post (which as you mentioned above you need to update) look like they’re forwardlooking, but running the code actually produces graphs which have the predictions shifted t+look_back.
How would you make this a forward looking graph? Hence also, I tried to predict multiple future timesteps with your first model by initialising the first prediction with testX[0] and then feeding the next predictions with the prior predictions but the predictions just plummeted downwards into a downwards curve. Not predicting the next timesteps at all.
Am I being naive to the purpose of this blog post here?
I have tried these methods on many different time series and the same mimicking behavior occurs – the training loss is somehow minimized by outputting the previous timestep.
A similar mimicking behavior occurs when predicting multiple time steps ahead as well (for example, if predicting two steps ahead, the model learns to output the previous two timesteps).
There is a small discussion on this issue found here – https://github.com/fchollet/keras/issues/2856 – but besides that I haven’t discovered any ways to combat this (or if there is some underlying problem with Keras, my code, etc.).
I am in the process of writing a blog to uncover this phenomenon in more detail. Will follow up when I am done.
Any other advancements or suggestions would be greatly appreciated!
I have been trying to play around with the code for a few days now and all I get is a curve plummeting to zero after a while.
I start to believe that we are using the wrong tool to do what we would like to, although it works for sine waves. We may want to try with stationary time series then, this is the last card I can play.
Are you simply using t-1 to predict t+1 in the time window, if so I don’t think there is enough data being fed into the neural network to learn effectively. with a bigger time window I notice that the model does start to fit better.
Hi, Jason
Thank you for your post.
I am still confused about LSTM for regression with window method and time steps.
Could you explain more about this point. Could you use some figures to show the difference between them?
Many thanks!
As my understanding, the LSTM for regression with window method is the same as a standard MLP method, which has 3 input features and one output as the example. Is this correct? What’s the difference?
Me too will be interested in using multivariate(numerical) data !
Been trying for a few days , but the “reshaping/shaping/data-format-blackmagic” always breaks
Purely cause I don’t yet understand it !
Otherwise great example !
I am very interested in cross-sectional time series estimation… How can that be done?
I am starting your Python track, but will eventually target data with say 50 explanatory variables, with near infinite length of time series observations available on each one. Since the explanatory variables are not independent normal OLS is useless and wish to learn your methods.
I would be most interested in your approach to deriving an optimal sampling temporal window and estimation procedure.
As you mentioned before, you will prepare the tutorial for multiple input features for multiple regression. Could you provide us the link to that tutorial?
Hi Bob, it might be a problem with your backend. Try reinstalling Theano or Tensorflow – whichever you are using. Try switching up the one you are using.
Excellent article, really insightful. Do you have an article which expands on this to forecast data? An approach that would mimic that of say arima.predict in statsmodels? So ideally we train/fit the model on historical data, but then attempt to predict future values?
Hi,Mr.Brownlee!
I don’t see future values on your plots, as I understand your model don’t predict the Future, only describe History. Can you give advice, how can I do this? And how I can print predictive values?
Thanks a lot!
Great article Jason.
I was just wondering if there was any way I could input more than 1 feature , and have 1 output, which is what I am trying to predict? I am trying to build a stock market predictor. And yes I know, it is nearly impossible to predict the stock market, but I am just testing this, so lets say we live in a perfect world and it can be predicted. How would I do this?
The input structure for LSTMS is [samples, time steps, features], as explained above. In fact, there are examples of what you are looking for above (see the section on the window method).
Just specify the features (e.g. different indicators) in the third dimension. You may have 1 or more timesteps for each feature (second dimension).
I did what you said, but now it wants to output 2 sequences out of the activation layer, but I only wanted it to have a final output of 1. Basically what I am doing is trying to use open and close stock data, and use it to predict tomorrow’s close. So I need to input 2 sequences and have an output of 1. I hope I explained that right. What should I do?
Jason, you mentioned that LSTMs input shape must be [samples, time stamps, features]. What if my time series is sampled (t, x), i.e. each sample has its own time stamp, and the time stamps are NOT evenly spaced. Do I have to generate another time series in which all samples are evenly spaced? Is there any way to handle the original time series?
Really good question Joe. Thanks. I have not thought about this.
My instinct would be to pad the time series, fill in the spaces with zeros and make the time series steps equidistant. At least, I would try that against not doing it and evaluate the effect on performance.
What an excellent article!
Recently I used LSTM to predict stock market index where the data is fluctuating and has no seasonal pattern like the air passanger data. I was just wondering about how does LSTM (or every gate) decide when to forget or keep a certain value of this type of series data. Any explanation about this? Thank you.
I am currently working with lstm recurrent neural networks and I am curious how you calculated R-squared. Are you willing to share your code about the R-squared calculation with me? Thank you very much!
Hi, Jason
First of all, this is really a fantastic post and thank you so much!
I’ve got confused on the “model.predict(x,batch_size)”.
I can’t figure what it means “predict in a batched way” on the keras official website.
My situation is like:
batch_size=10
I have a test sample [x_1] \in R^{2}, and I put it into the function,
[x_2] = model.predict([x_1],batch_size=batch_size)
(Let’s skip the numpy form issue)
Then, subsequently, I put [x_2] into it, similarly, and I get [x_3] = model.predict([x_2],batch_size=batch_size), and so on, till x_10.
I don’t know if the function “predict” treats [x_1],[x_2],…[x_3] as in a batch ?
I guess it does.(although I didn’t put them into the function at one time)
Otherwise, I’ve tried another way to compute [x_2],…[x_10] and I got the same as above.
Another strategy is like:
[x_2] = model.predict([x_1],batch_size=batch_size)
[x_3] = model.predict([[x_1],[x_2],batch_size=batch_size)
[x_4] = model.predict([[x_1],[x_2],[x_3]],batch_size=batch_size)
…
What’s the difference between the two ways?
Thanks!
btw, I am also confused at “batch”.
If batch_size=1, does that mean there’s no relation between samples? I mean the state s_t won’t be sent to affect the next step s_(t+1).
So, why we need RNN?
We need RNN because the state they can maintain gives results better than methods that do not maintain state.
As for batch_size=1 during calls to model.predict() I have not tested whether indeed state is lost as in training, but I expect it may be. I expect one would need batch_size=n_samples and replay data each time a prediction is needed.
This is a great post! Thanks for the guidance. I’m wondering about performance. I’ve setup my network very similarly to yours, just have a larger data set (about 2500 samples, each with 218 features). Up to about 20 epochs runs in a reasonable amount of time, but anything over that seems to take forever.
I’ve set-up random forests and MLPs, and nothing has run so slowly. I can see all CPUs are being used, so am wondering whether Keras and/or LSTM has performance issues with larger data sets.
I am confusing about deep learning and machine learning in Stock Market , forex . There are a lot of models which analyses via chart using amibroker or metastock which redraw the history price and take the prediction in that model . Does it call the machine learning or deep learning ?
How is it when we could do farther to make better prediction via deep learning if it’s right ?
These models do not predict, they extrapolate current value 1 step ahead in more or less obscured way. As seen on the pictures, prediction is just shifted original data. For this data one can achieve much better RMSE 33.7 without neural net, in just one line of code:
This is good motivation for me/community to go beyond making LSTMs “just work” for time series and dive into how to train LSTMs effectively and even competitively on even very simple problems.
However, I have some concerns about the create_dataset function. I think it just make a simple problem complicated (or even wrong).
When look_back=1, the function is simply equivalent to: dataX = dataset[:len(dataset)-look_back], dataY = dataset[look_back:].
When look_back is larger than 1, the function is wrong: after each iteration, dataX is appended by more than 1 data, but dataY is appended by just 1 data. Finally, dataX will be look_back times larger than dataY.
Is that what create_dataset supposed to do?
def create_dataset(dataset, look_back=1):
dataX, dataY = [], []
for i in range(len(dataset)-look_back-1):
a = dataset[i:(i+look_back), 0]
dataX.append(a)
dataY.append(dataset[i + look_back, 0])
return numpy.array(dataX), numpy.array(dataY)
Thanks for your great article! I have a question that when I use the model “Stacked LSTMs With Memory Between Batches” with my own data, I found that cpu is much faster than gpu.
May data contains many files and each files’ size is about 3M. I put each file into the model to
trian one by one. I guess that the data is too small so the gpu is useless, but I can’t sure. I use thano backend and I can sure that the type of the data is float32. So I want to know what reason would make this happen, or the only reason is the data too small? Thank you very much and best wishes to you.
Excellent tutorial. I am new to time series prediction. I have a basic question. In this example(international-airline-passengers) model predicted the values on test data from 1957-01 to 1960-12 time period.
How to predict the passengers in next one year from 1961-01 – 1961-12.
How to pass input values to model, so it will predict the passengers count in each month for next one year.
Great article on LSTM and keras. I was really struggling with this, until I read through your examples. Now I have a much better understanding and can use LSTM on my own data.
One thing I’d like to point out. The reuse of trainY and trainX on lines 55 & 57.
Line 55 trainY = scaler.inverse_transform([trainY])
This confused me a lot, because the model can’t run fit() or predict() again, after this is done. I was struggling to understand why it could not do a second predict or fit. Until i very carefully read each line of code.
I think renaming the above variables would make the example code clearer.
Unless I am missing something….. and being a novice programmer that’s very possible.
Hi, Jason, thank you for the example.
I have used the method on my own data. The data is about the prediction of the average temperature per month. I want to predict more than one month. But I can only predict one month now. Because the inputs are X1 X2 X3, the result is only y. I want to kown how to modify the code to use ,like, X1 X2 X3 X4 X5 X6 to predict Y1 Y2 Y3.
I don’t know if I have made it clear. I hope you will help me.
Thank you very much.
Nice post Jason!
I read that GRU has a less complex architecture than the LSTM has, but many people still use LSTM for forecasting. I’d like to ask, what are the advantages LSTM compared to GRU? Thank you
Hi Nida, I would defer to model skill in most circumstances, rather than concerns of computational complexity – unless that is a requirement of your project.
Agreed, we do want the simplest and best performing model possible, so perhaps evaluate GRUs and then see of LSTMs can out perform them on your problem.
I’m a total newbie to Keras and LSTM and most things NN, but if you’ll excuse that, I’d like to run this idea past you just to see if I’m talking the same language let alone on the same page… :
I’m interested in time-series prediction, mostly stocks / commodities etc, and have encountered the same problem as others in these comments, namely, how is it prediction if it’s mostly constrained to within the time-span for which we already have data?
With most ML algorithms I could train the model and implement a shuffle, ie get the previous day’s prediction for today and append it in the input-variable column, get another prediction, … repeat. The worst that would happen is a little fudge around the last day in the learning dataset.
That seems rather laborious if we want to predict how expensive gold is going to be in 6 months’ time.
(Doubly so, since in other worlds (R + RSNNS + elman or jordan), the prediction is bound-up with training so a prediction would involve rebuilding the entire NN for every day’s result, but we digress.)
I saw somewhere Keras has a notion of “masking”, assigning a dummy value that tells the training the values are missing. Would it be possible to use this with LSTM, just append a bunch of 180 mask zeroes, let it train itself on this and then use the testing phase to impute the last values, thereby filling in the blanks for the next 6 months?
It would also be possible to run an ensemble of these models and draw a pretty graph similar to arima.predict with varying degrees of confidence as to what might happen.
My thoughts go more towards updating the model. A great thing about neural nets is that they are updatable. This means that you can prepare just some additional training data for today/this week and update the weights with the new knowledge, rather than training them from scratch.
Again, the devil is in the detail and often updating may require careful tuning and perhaps balance of old data to avoid overfitting.
I am trying to implement your code in order to make forecasting on a time-series that i am receiving from a server. My only problem is that the length of my dataset is continuously increasing. Is there any way to read the last N rows from my csv file? What changes do i have to make in code below in order to succeed it.
def create_dataset(dataset, look_back=1):
dataX, dataY = [], []
for i in range(len(dataset)-look_back-1):
a = dataset[i:(i+look_back), 0]
dataX.append(a)
dataY.append(dataset[i + look_back, 0])
return numpy.array(dataX), numpy.array(dataY)
# fix random seed for reproducibility
numpy.random.seed(7)
# load the dataset
dataframe = pandas.read_csv(‘timeseries.csv’, usecols=[1], engine=’python’, skipfooter=3)
dataset = dataframe.values
dataset = dataset.astype(‘float32’)
Hello, I would like to use that your model. But the problem I am using sliding window size greater than one. Type {[x-2], [x-1], [x]} ==> [x + 1]. But I found several problems in training. For example, when I turn your trainX in {[x-2], [x-1], [x]} and trainY in [x + 1], the keras tells me that the input and the target must have same size. Can you help me with this?
Thaks, Jason. I was able to solve my problem. But see, the use of the ReLu function in the memory cell and the sigmoid function on the output showed strange behavior. You have some experience with this setting.
Congratulations on the work, this page has helped me a lot.
Don’t worry about small differences. It is hard to get 100% reproducible results with Keras/Theano/TensorFlow at the moment. I hope the community can work something out soon.
great post ! thank you so much. I was wondering how can be adapt the code to make multiple-step-ahead prediction. One of the commenters suggested defining the out-put like [x(t+1),x(t+2),x(t+3),…x(t+n)] , but is there a way to make prediction recursively ? More specifically, to build an LSTM with only one output. We first predict x(t+1), then use the predicted x(t+1) as the input for the next time step to predict x(t+2) and continue doing so ‘n’ times.
I am wondering how to apply LSTM to real time data. The first change I can see is the data normalisation. Concretely, a new sample could be well out of min max among previous observations. How would you go about this problem?
Hi jason, i got a question,that have stacked me for many days,how can i add hidden layer into the LSTM model(By using model.add(LSTM()).what i tried : say ,in your first code example, I assume ‘model.add(LSTM(4, input_dim=look_back))’ this line was to create a hidden layer in the LSTM model. So i thought:oh , 1 hidden layer is so easy , why don’t add one hidden layer into it .So i try to add one layer. After the code:’model.add(LSTM(4, input_dim=look_back))’ , i try many ways to insert one hidden layer , such as : just copy model.add(LSTM(4,input_dim=look_back)) and insert after it . I try many ways ,but it always got the error that got the wrong input _ dimension. So can you show me how to add one hidden layer in example 1st . Or , i don’t got the LSTM model right ,it can’t be inserted ?
I would not agree, these are just demonstration projects and were not optimized for top performance.
These examples show how LSTMs could be used for time series projects (and how to use MLPs for time series projects), but not optimally tuned for the problem.
How could I set the input if I have several observations (time series) with same length of the same feature and I want to predict t+1? Would I concatenate them all? In that case the last sample of one observation would predict the first one of the next.. Or should I explicitly assign the length of each time series to the batch_size?
This is a great example. I am quite new in deep learning and keras. But this website has been very helpful. I want to learn more.
Like many commenters, I am also requesting to find out: how to predict future time periods. Is that possible? How can I achieve this using the example above? If there are multiple series or Ys and there are categorical predictors, how can I accomodate that?
Please help, and am very keen to learn this via other channels in this website if required. Please let me know.
You can adapt the example and call model.predict to make a prediction for new data, rather than just evaluate the performance of predictions on new data as in the example.
thanks Jason. I tried various things with no luck. for me some part of the tutorial (like the reshape part / scaling ) are pure magic 🙂 trying to get some help from the keras community on gitter 🙂
Which book gives complete examples/codes with time series keras? I want to predict future time periods ahead and want add other predictor variables? Is that achievable?
Please let me know if you have any resources / book that I can purchase.
(from LSTM for Regression with Time Steps section), since this is exactly what I need.
Let’s say I have 4 videos (prefix v) , of different lengths (say, 2,3,1 sec) (prefix t) , and for every 1 sec, I get a feature vector of length 3 (prefix f).
So, as I understand my trainX would be like this, right? –>
If I make my ‘v1′,’v2′,v3′ ..’v19’ as np arrays, and trainX as a list =[ v1, v2, v3…v19 ] using trainX.append(vn) –> and eventually outside of for loop: trainX=np.array(trainX), I get following error.
File “/usr/local/lib/python2.7/dist-packages/keras/engine/training.py”, line 100, in standardize_input_data
str(array.shape))
Exception: Error when checking model input: expected lstm_input_1 to have 3 dimensions, but got array with shape (19, 1)
Which makes sense since, Keras must be expecting input to have 3 dimensions = (sample,tstep, features).
Guestion about the stateful data representation.
If I understood correctly prepare_data makes repeats the previous look_back sequences.
For example the original data
1
2
3
4
5
6
will become
1 2 3 -> 4
2 3 4 ->5
3 4 5 ->6
Then when you reshape for the stateful LSTM don’t you feed these sequences like this ?
batch 1 sequences [ 1, 2, 3] -> predict 4
batch 2 sequences [ 2, 3, 4] -> predict 5
batch 3 sequences [ 3, 4, 5] -> predict 6
In the stateful RNN shouldn’t it be two batches only that continue one from the next:
batch 1 sequences [ 1, 2, 3] -> predict 4
batch 2 sequences [ 3, 4, 5] -> predict 6
Or alternatively you can have it to return the full state and predict all of them
batch 1 sequences [ 1, 2, 3] -> predict [2, 3, 4]
batch 2 sequences [ 3, 4, 5] -> predict [4, 5, 6]
Hi!
First of all, thanks for the tutorial. I’m trying to predict data that are very similar to the example ones. I was playing with the code you gave, but then something very strange happened: if I fit a model using the flight data and i use those hyper parameters to predict white noise I receive a very accurate results. Example:
oh, it is not about videos.. Question is about ‘instances/samples’ in general…
I am saying,
Instance1 through instance4 correspond to 2,3,1,5 feature vectors in time respectively, each of dimension 3. How do I shape these to train LSTM?
That is the whole idea behind the section “LSTM for Regression with Time Steps” above, right?
Features of instance1 should not be considered when training LSTM on instance2! Just as your paragraph says:
“Some sequence problems may have a varied number of time steps per sample. For example, you may have measurements of a physical machine leading up to a point of failure or a point of surge. Each incident would be a sample the observations that lead up to the event would be the time steps, and the variables observed would be the features.”
I don’t need *examples of working with video data.* Kindly advise only on how to shape trainX I mentioned above.
look careful, isn’t there +1 shift in your white noise prediction? )))
same as in charts in tutorial?
best prediction for weather tomorrow is: it’ll be exact the same as today. see?
Hi Jason,
When I try your “Stacked LSTMs with Memory Between Batches” example as it is, I found the following error. I wonder if you could help to explain what went wrong and how to rectify it please?
Thank you.
/home/nbuser/anaconda3_410/lib/python3.5/site-packages/keras/models.py in add(self, layer)
322 output_shapes=[self.outputs[0]._keras_shape])
323 else:
–> 324 output_tensor = layer(self.outputs[0])
325 if type(output_tensor) is list:
326 raise Exception(‘All layers in a Sequential model ‘
/home/nbuser/anaconda3_410/lib/python3.5/site-packages/keras/engine/topology.py in __call__(self, x, mask)
515 if inbound_layers:
516 # This will call layer.build() if necessary.
–> 517 self.add_inbound_node(inbound_layers, node_indices, tensor_indices)
518 # Outputs were already computed when calling self.add_inbound_node.
519 outputs = self.inbound_nodes[-1].output_tensors
/home/nbuser/anaconda3_410/lib/python3.5/site-packages/keras/engine/topology.py in add_inbound_node(self, inbound_layers, node_indices, tensor_indices)
569 # creating the node automatically updates self.inbound_nodes
570 # as well as outbound_nodes on inbound layers.
–> 571 Node.create_node(self, inbound_layers, node_indices, tensor_indices)
572
573 def get_output_shape_for(self, input_shape):
/home/nbuser/anaconda3_410/lib/python3.5/site-packages/keras/engine/topology.py in create_node(cls, outbound_layer, inbound_layers, node_indices, tensor_indices)
153
154 if len(input_tensors) == 1:
–> 155 output_tensors = to_list(outbound_layer.call(input_tensors[0], mask=input_masks[0]))
156 output_masks = to_list(outbound_layer.compute_mask(input_tensors[0], input_masks[0]))
157 # TODO: try to auto-infer shape if exception is raised by get_output_shape_for.
/home/nbuser/anaconda3_410/lib/python3.5/site-packages/keras/layers/recurrent.py in call(self, x, mask)
225 constants=constants,
226 unroll=self.unroll,
–> 227 input_length=input_shape[1])
228 if self.stateful:
229 updates = []
/home/nbuser/anaconda3_410/lib/python3.5/site-packages/tensorflow/python/ops/control_flow_ops.py in _BuildLoop(self, pred, body, original_loop_vars, loop_vars, shape_invariants)
2448 for m_var, n_var in zip(merge_vars, next_vars):
2449 if isinstance(m_var, ops.Tensor):
-> 2450 _EnforceShapeInvariant(m_var, n_var)
2451
2452 # Exit the loop.
/home/nbuser/anaconda3_410/lib/python3.5/site-packages/tensorflow/python/ops/control_flow_ops.py in _EnforceShapeInvariant(merge_var, next_var)
584 “Provide shape invariants using either the shape_invariants ”
585 “argument of tf.while_loop or set_shape() on the loop variables.”
–> 586 % (merge_var.name, m_shape, n_shape))
587 else:
588 if not isinstance(var, (ops.IndexedSlices, sparse_tensor.SparseTensor)):
ValueError: The shape for while_2/Merge_2:0 is not an invariant for the loop. It enters the loop with shape (1, 4), but has shape (?, 4) after one iteration. Provide shape invariants using either the shape_invariants argument of tf.while_loop or set_shape() on the loop variables.
Hi, Jason.
Thank you for your LSTM tutorial! I would like to use it to do some predictions, however, the input_dim is two variables, and the output_dim is one, just like: input: x(t) y(t) output: y(t+1) .I have known that you answered it with the window method. I still have no idea, any suggestions?
# Simple ARIMA vs. NN has RMSE = 8.83/26.47 vs. 22.61/51.58 for train/test
ModelMetrics::rmse(ts.train, fcast$fitted)
ModelMetrics::rmse(ts.test, y_hat)
# ETS is even better ... RMSE 7.25/23.05
ets.fcast <- forecast(ets.fit, 4*12)
ModelMetrics::rmse(ts.train, ets.fcast$fitted)
ModelMetrics::rmse(ts.test, ets.fcast$mean)
`
More layers offer more “levels of abstraction” or indirection, depending on how you want to conceptualize.
More nodes/modules in a layer offers more “capacity” at one level of abstraction.
Increasing the capacity of the network in terms of layers or neurons in a layer will both require more learning (epochs) or faster learning (learning rate).
What is the magic bullet for a given problem? There’s none. Find a big computer with lots of CPU/RAM and grind away a suite of ideas on a sample of the dataset to see what works well.
Hi Jason,
Many thanks for the tutorial. Very useful indeed.
Following up the question from Aubrey Li and your response to that, does it mean that if I double the number of LSTM nodes (from four to eight), it will perform better?. In other words, how did you decide that number of LSTM nodes to be of 4 and not 6 or 8?
It may perform better but may require a lot more training.
It may also not converge or it may overfit the problem.
Sadly, there is no magic bullet, just a ton of trial and error. This is why we must develop a strong test harness for a given problem and a strong baseline performance for models to out-perform.
I’ve been struggling with a particular problem and I am hoping you can assist. Basically, I’m running a stateful LSTM following the same logic and code as you’ve discussed above and in addition I’ve played around a bit by adding for example a convolutional layer. My issue is with the mean squared error given at the last epoch (where verbose=2 in model.fit) compared to the mean squared error calculated from trainPredict as in the formula you provide above. Please correct me if I am wrong, but my intuition tells me that these two mean square errors should be the same or at least approximately equal because we are predicting on the training set. However, in my case the mean square error calculated from trainPredict is nearly 50% larger than the mean square error at the last epoch of model.fit. Initially, I thought this had something to do with the resetting of states, but this seems not to be the case with only small differences noticed through my investigation. Does anything come to mind of why this may be? I feel like there is something obvious I’m missing here.
model.compile(loss=’mean_squared_error’, optimizer=ada)
for i in range(500):
XXm = model.fit(trainX, trainY, nb_epoch=1, batch_size=bats, verbose=0,
shuffle=False)
model.reset_states()
print(XXm.history)
I agree with your intuition, I would expect the last reported MSE to match a manually calculated MSE. Also, it is not obvious from a quick scan where you might be going wrong.
Start off by confirming this expectation on a standalone small network with a contrived or well understand dataset. Say one hidden layer MLP on the normalized boston house price dataset.
This is a valuable exercise because it cuts out all of the problem specific and technique specific code and concerns and gets right to the heart of the matter.
Once achieved, now come back to your project and cut it back to the bone until it achieves the same outcome.
Thank you for an excellent introduction to using LSTM networks for time series prediction; I learned a great deal from this article. One question I did have: if I wanted to plot the difference between the data and prediction, would it be correct to use something like (in the case of the training data):
For the codes with stacked ltsm, I’m getting the following error. Copy paste the whole thing doesn’t work either. Any help?
The shape for while_1/Merge_2:0 is not an invariant for the loop. It enters the loop with shape (1, 4), but has shape (?, 4) after one iteration. Provide shape invariants using either the shape_invariants argument of tf.while_loop or set_shape() on the loop variables.
Hi Jason,
Another question towards the normalisation. Here, we are lucky to have all the data for training and testing. And this has enabled us to normalise the data (MinMaxScaler). However, in real-life, we may not have all the data in one go and in fact it is very likely the case that we will be receiving data from streams. In such cases, we will never has the max or min or even the sum. How do we handle this case (so that we can feed the RNN with the normalised values?).
One obvious solution, perhaps, is calculating this over the running data. But that will be an expensive approach. Or something to do with stochastic sampling strategy ? Any help Jason?
For normalization we need to estimate the expected extremes of the data (min/max). For standardization we need to estimate the expected mean and standard deviation. These can be stored and used any time to validate and prepare data.
Hi Jason, I am here again. I have achieved my goal to predict more than one day in this period of time. But now I have another question. I make X=[x1,x2…x30] and Y=[y1,y2…y7], which means I use 30 days to predict 7 days. When predicting y2, actually I used the real value. So here is the question. How can I put my predicted number,like y2,to the X sequence to predict y3? I am looking forward to your answer.
Thank you very much
Hi Jason, a great tutorial. I’m a newbie, and trying to understand this code. My understanding of Keras is that time steps refers to the number of hidden nodes that the system back propagates to through time, and input dimensions refers to the number of ‘features’ for a given input datum (e.g. if we had 2 categorical values, the input dimensions would be 2). So what confuses me about the code is that it tries to model past values (look back) as the number of input dimensions. Timesteps is always set to 1. In that case isn’t the system not behaving like a recurrent network at all but more like an MLP? Thanks!
Hi Jason, I am looking for a machine learning algorithm that can learn the timing issues like debounce and flip flops in logic circuits and predict an output.
LSTM Trained on Regression Formulation of Passenger Prediction Problem
is the most confusing part of the article.
The red line is NOT the actual prediction for 1,2,3, etc. steps ahead. As we can see from the data, you need to know the REAL value just at the time T to predict T+1, it is not based on your prediction in this setup.
If you need to do a prediction for more steps ahead a different approach is needed.
I am still grateful for the parts of the code you have provided, but this part led me way away from my goal.
Hi,
I would control the input of the internal gate of the cell memory. is it a possible thing to do?
In case of yes, what are the function that allow it? Thanks!
I have a small question. I dont see how look_back feature is relevant. If I put look_back to zero or one but increase memory units to lets say 20, I get much better results because the network itself “learns” to look back as much as its needed. Can you replicate that? Isn’t that the whole point of LSTM?
Thanks Jason for a wonderful post. Your code uses keras which has tensorflow working in the background. Tensorflow is not available under Windows platform. Is there any way one could run this code in windows?
I am using Anaconda.
I’ve updated your example so that a real prediction is possible.
What I did:
set look_back to 25
add a linear activation to the Dense layer
and changed trainings settings like batch size
optionally I added detrending and stationarity of signal (Currently it’s commented out)
Here is the code:
import numpy
import math
import matplotlib.pyplot as plt
import pandas
from keras.models import Sequential
from keras.layers import Dense
from keras.layers import LSTM
from keras.layers import Activation
from sklearn.preprocessing import MinMaxScaler
from sklearn.metrics import mean_squared_error
# fix random seed for reproducibility
numpy.random.seed(7)
# normalize the dataset
#dataset = numpy.log10(dataset) # stationary signal
#dataset = numpy.diff(dataset, n=1, axis=0) # detrended signal
dataset = (dataset – numpy.min(dataset)) / (numpy.max(dataset) – numpy.min(dataset)) # normalized signal
#plt.plot(dataset);
#plt.show();
# split into train and test sets
train_size = int(len(dataset) * 0.67)
test_size = len(dataset) – train_size
train, test = dataset[:train_size,:], dataset[train_size:len(dataset),:]
print(len(train), len(test))
# convert an array of values into a dataset matrix
def create_dataset(dataset, look_back=1):
dataX, dataY = [], []
for i in range(len(dataset)-look_back-1):
a = dataset[i:(i+look_back), 0]
dataX.append(a)
dataY.append(dataset[i + look_back, 0])
return numpy.array(dataX), numpy.array(dataY)
# reshape into X=t and Y=t+1
look_back = 25
trainX, trainY = create_dataset(train, look_back)
testX, testY = create_dataset(test, look_back)
# reshape input to be [samples, time steps, features]
trainX = numpy.reshape(trainX, (trainX.shape[0], 1, trainX.shape[1]))
testX = numpy.reshape(testX, (testX.shape[0], 1, testX.shape[1]))
# create and fit the LSTM network
model = Sequential()
model.add(LSTM(100, input_dim = look_back))
model.add(Dense(1))
model.add(Activation(“linear”))
Would you please explain what’s the point of plotting the ‘dataset’, ‘trainPredictPlot’, and ‘testPredictPlot’ together?
I see that they are not single vectors;
trainPredictPlot.shape = (num_samples, num_variables)
testPredictPlot.shape = (num_samples, num_variables)
num_points: What does it represent here?
num_variables: is the number of both input variables and the output variable.
but I’m getting the new forecasting curve as a flat line, although the training and validation steps were very good. Would you please take a look at my code here and tell me how can I fix the problem of the forecasting? https://github.com/MohamedNedal/lstm/tree/master
Thank you for this excellent post. I have reproduce the example and also used a real time-series data set successfully. But I have a simple question:
How I can generate a sequence of predict new values? I mean future values (no the test values), for example, the six first months of the year 1961; values for 1961-01, 1961-02,…1961-06.
Hi Jason,
I hope I don’t ask for something already in the comments, but at least I did not see it. All my apologizes else.
Based on your dataset, let’s assume that we have more features than only the number of passengers per unit of time, for example the “current” weather, fuel price,… whatever.
If I want to use them in the training, the idea is the same, for each one I “copy” the n loopback values for each sample ?
I too notice the predictions to be simply mimicking the last known value.
Thanks for posting your code.
I had a couple questions on your post:
1. How did you set the batch_size ? It appears that matches the lookback.
Is that intentional ?
2. Similarly, how did you know how to set the number of neurons to 100 via this line:
model.add(LSTM(100, input_dim = look_back)) ?
That appears to be 4*look_back ?
Short, you devide your time series into pieces for training. In this case:
Training_set_size = (data_size * train_size – forecast_amount) / look_back
That is the set for training your network. Now you devide it by the batch_size.
Each batch should have more or less the same size.
In the link above you will see pros and cons about the size of each batch.
To 2.:
Try and error, like almost everything with neuronal networks. That’s parameter optimization. There is no true config for all problems. The more neurons you have, the more powerful your network can be. The problem is you also need a larger trainingset.
Normally you iterate through the number of neurons. E.g. you start at 2 and go up till 100 in a step size of 2 neurons. For each step you calculate at least 35 networks (statistical expression) and calculate the mean and variance over the error of train- and testset.
Plot all the results in a graph and take the network with less complexity and best TEST rate (not train!). Consider variance and mean!!!
I’m currently trying to use this LSTM RNN to predict monthly stock returns.
Again though I cannot beat the naive benchmark of simply predicting
t+1 = t or predicting the future return is simply the last known/given return at time t.
I’m wondering what else I can tune /change in the LSTM RNN to remove
the” mimicking” effect ?
The major difficulty here is that the time series is non stationary – it is both mean trending and the variance is exploding as well. It is very hard to forecast using this time series.
You get around this by scaling using the entire dataset, therefore violating the in-sample out-of-sample separation. In other words, you are looking into the future, i.e. your test set, for scaling – which unfortunately is not possible in real life.
I believe I have made the stock data in my dataset stationary by taking the first difference of the log of the prices.
However, if I want to include additional features such as
volatility, a moving average, etc… would those be computed
on the ORIGINAL stock prices or on the newly calculated
log differences, which are stationary ?
Another question I had was on performing 2 or more day ahead forecasts on a stationary time series
with first differences.
For example, if we want to forecast 5 days ahead of day (instead of 1 day), would we instead use
the differences between t and t-5 ?
Forecasts would be made one time step at a time. The differences can then be inverted from the last known observation across each of the predicted time steps.
If we want to forecast what the price will be on January 8th STARTING from January 3rd (a 5 day horizon),
how would build the differences to make the series stationary? If we continue with first differences, then I believe we would only be forecasting the change from Jan 7th to Jan 8, which is still
a 1 day change, not a 5 day ?
Off the cuff: The LSTM can forecast a 5-day horizon by having 5 neurons in the output layer and learn from differenced data. The difference inverse can be applied from the last know observation and propagated along the forecast to get back to domain values.
Alright, so if I understand correctly, the 5 outputs from the output layer
would correspond to the differences between days 0-1,1 -2, 2-3,3-4, 4-5 respectively?
One more question on that:
Would I also need to modify the target values (trainY) so they
contained 5 targets per sample, instead of just one ? That is to match up the
5 RNN outputs ?
Hi, Jason
It’s a great tutorial. I have learnt a lot from it. Thank you very much.
By the way, is it possible to use the LSTM-RNN to obtain the predictions with a probability distribution? I think it will be even better if LSTM-RNN can do this.
Please let me know if I have the wrong thinking.
Thank you for your quickly reply.
Maybe I have asked in a wrong way. I mean like the example above, is it possible we get the probability distributions of the predicted future passengers at the same time? In other words, how confident we are sure about the prediction accuracies.
Thank you for this, it has been a great help in debugging my own keras RNN code. A suggestion for your root LSTM for Regression with Time Steps model, as examples of what else you could do:
First, incorporate the month number as a predictor. This helps with the obvious seasonality in the time series. You can do this by creating an N-by-lookback shaped matrix where the value equals the month number (0 for January, …, 11 for December). I did it by adjusting the create_dataset function to look like
def create_dataset(dataset, look_back=1):
dataX, dataY, dataT = [], [], []
for i in range(len(dataset)-look_back-1):
a = dataset[i:(i+look_back), 0]
dataX.append(a)
dataY.append(dataset[i + look_back, 0])
b = [x % (12) for x in range(i, i+(look_back))] #12 because that’s how many months are in a year
dataT.append(b)
return numpy.array(dataX), numpy.array(dataY), numpy.array(dataT)
Then, feed this into an embedding layer to create a one-hot vector of 12 dimensions. Your model will now have two branches (one for the time series and one for the vector of month indicators), that merge into a single model containing the RNN. F. Chollet has some examples at https://keras.io/getting-started/sequential-model-guide/. I did it with
month_model = Sequential()
month_model.add(Embedding(12, 12, input_length=look_back))
month_model.add(GRU(output_dim=4, return_sequences=True))
month_model.add(TimeDistributed(Dense(look_back)))
Lastly, I used a callback to ensure that the model didn’t overfit during the 100 epochs. Specifically, if the loss on the validation set stopped decreasing, the model would early terminate. I found I didn’t really need even half of the epochs, thus saving some time. E.g.,
early_stopping = EarlyStopping(monitor=’val_loss’, patience=3)
model.fit([np.array(trainT.squeeze()),trainX], trainY.squeeze(), validation_data=([np.array(testT.squeeze()),testX],testY.squeeze()), nb_epoch=100, batch_size=1, verbose=2, callbacks=[early_stopping])
Using a lookback of 3, my training set had a RMSE of 7.38, and 17.69 for the validation set. Which I think is a pretty decent improvement with minimal additional work.
I think you are missing some Keras dependencies. Make sure you have:
from keras.models import Sequential
from keras.layers import Dense
from keras.layers import Embedding
from keras.layers import GRU
from keras.layers import Merge
from keras.layers import TimeDistributed
from keras.callbacks import EarlyStopping
I have a lot of measurements of solar pannels’ production sampled every 10 minutes.
I would like to use these samples to predict the production for the next timestep.
Since the pannels are in different places, I am confident I can use the past measurements to predict a pannels future production.
I have used your tutorial so far, so use a few pannels’ production at T-1 to predict one pannel’s production at T.
Time would also be a very valuabe information to add to my model, since I have daytime related periodicity.
I am glad I found Amw’s post to handle this problem.
I am not really sure I fully understand how you use time in this model. Can you explain a little further what is happenning here when merging the two models ?
I also have a problem wih dimension. Do I need to provide a ‘time’ feature at each step that has the same length as my productions ?
Since I use several pannels’ productions at T-1, do I need to provide the model a vector with n_features times the same hour of the day ?
I very much like your idea of improving this solution, but I cannot make it work. I got the same error as Dan, but instead of removing trainY I added also trainT.
But then I got another error: The model expects 2 arrays, but only received one array.
Is there any change you could upload the entire code, please?
Great illustration of merging! As a note to future readers, the Merge layer is deprecated and was scheduled to be removed in August 2017. Recommended usage is now through keras.layers.merge.
It didn’t work for me. I’ve done: train_size = int(len(dataset) * 1)
and removed all the test data but still it does predict inside the samples.
Is there a function that I should add ?
Thank you for this great post.
I just have two questions:
1) What would be the code to add to show the accuracy in percentage?
2) How can I code the red line to show the next prediction at the end of the chart?
It is a regression problem so accuracy does not make sense. If it were a classification problem, the activation function in the output layer would have to be changed to sigmoid or similar.
You can predict the next out of sample value by training the model on all available data and calling model.predict()
I really appreciate the time you put into this very detailed explanation of time series prediction. I think there are a couple of errors in your code, which appear to be confusing a lot of people:
1. When you read the file, skipfooter should = 2, not 3, as there are only two lines of data after the last value. The existing code prevents the last value from being added to dataset.
2. Similarly, in create_dataset, you should not subtract 1 in the range of the for loop. Again, this prevents the last value from being added to dataX and dataY.
3. Finally, you should not use the the shift train prediction, and the shift test prediction is incorrect. This has the effect of making it appear that the prediction at t=0 instead of t+1. I think this is why many people have been asking how to predict the last value.
Here is my code which both demonstrates and fixes these issues. Please feel free to tell me I’m wrong.
# Stacked LSTM for international airline passengers problem with memory
import numpy
import matplotlib.pyplot as plt
import pandas
import math
from keras.models import Sequential
from keras.layers import Dense
from keras.layers import LSTM
from sklearn.preprocessing import MinMaxScaler
from sklearn.metrics import mean_squared_error
# convert an array of values into a dataset matrix
def create_dataset(dataset, look_back=1):
dataX, dataY = [], []
for i in range(len(dataset)-look_back): # – 1 IS WRONG. IT PREVENTS LAST VALUE OF DATASET FROM BEING USED FOR dataX AND dataY
a = dataset[i:(i+look_back), 0]
dataX.append(a)
dataY.append(dataset[i + look_back, 0])
return numpy.array(dataX), numpy.array(dataY)
# fix random seed for reproducibility
numpy.random.seed(7)
# load the dataset
# No header on data
dataframe = pandas.read_csv(‘international-airline-passengers.csv’, usecols=[1], engine=’python’, skipfooter=2) # 3 IS WRONG AS THERE ARE ONLY TWO LINES IN THE FOOTER. THIS PREVENTS THE LAST VALUE FROM BEING READ.
dataset = dataframe.values
dataset = dataset.astype(‘float32’)
# split into train and test sets
train_size = int(len(dataset) * 0.67)
test_size = len(dataset) – train_size
train, test = dataset[0:train_size,:], dataset[train_size:len(dataset),:]
# reshape into X=t and Y=t+1
look_back = 1
trainX, trainY = create_dataset(train, look_back)
testX, testY = create_dataset(test, look_back)
# reshape input to be [samples, time steps, features]
trainX = numpy.reshape(trainX, (trainX.shape[0], trainX.shape[1], 1))
testX = numpy.reshape(testX, (testX.shape[0], testX.shape[1], 1))
# create and fit the LSTM network
batch_size = 1
model = Sequential()
model.add(LSTM(12, batch_input_shape=(batch_size, look_back, 1), stateful=True, return_sequences=True))
model.add(LSTM(12, stateful=True))
model.add(Dense(1))
model.compile(loss=’mean_squared_error’, optimizer=’adam’)
for i in range(1):
model.fit(trainX, trainY, nb_epoch=1, batch_size=batch_size, verbose=0, shuffle=False) # I JUST SET VERBOSE=0 SO IT IS EASIER TO SEE THE PRINTED DATA
model.reset_states()
# shift test predictions for plotting THIS IS ALSO WRONG
testPredictPlot = numpy.empty_like(dataset)
testPredictPlot[:, :] = numpy.nan
testPredictPlot[len(trainPredict) + (look_back):len(dataset) – 1, :] = testPredict
Jason,
I have looked through most of the comments, and not seen this pointed out, but in the “Memory Between Batches” examples, you should not do the reset_state() in between doing predict on the training and test sets. The beginning of your test set should know that it is at the “end” of the training set, rather than at null.
Thank you very much for all this, by the way, it’s been super helpful.
Quote:
It requires that the training data not be shuffled when fitting the network. It also requires explicit resetting of the network state after each exposure to the training data (epoch) by calls to model.reset_states(). This means that we must create our own outer loop of epochs and within each epoch call model.fit() and model.reset_states().
I’d appreciate it if you would delete the code from my post on February 23, 2017 at 3:29 pm. I’ve made a couple of improvements to it, so it will make your comments section a lot shorter if people don’t have to read through all that old code.
The improvements are:
look_back = look_back + 1, ie. if the look_back is set to 1, each X will contain t-1 & t, rather than just the current value (t). If you just want one value, set look_back = 0.
The look_back is added to x before it is split into trainX and trainY. This allows predictions to be made on testX[0], instead of testX[look_back]. One might argue that this is letting the model use data in the training set to make predictions, but since that is only time series data, I don’t see that as a problem.
The final value in the dataset is added to testX, so the model makes a prediction for 1961-01.
There are a lot of commented out print statements to allow people to see exactly what the data looks like.
Here is the updated code:
# Stacked LSTM for international airline passengers problem with memory
import numpy
import matplotlib.pyplot as plt
import pandas
import math
from keras.models import Sequential
from keras.layers import Dense
from keras.layers import LSTM
from sklearn.preprocessing import MinMaxScaler
from sklearn.metrics import mean_squared_error
# convert an array of values into a dataset matrix
def create_dataset(dataset, look_back):
dataX, dataY = [], []
for i in range(len(dataset)- look_back):
dataX.append(dataset[i:(i + look_back), 0])
dataY.append(dataset[i + look_back, 0])
return numpy.array(dataX), numpy.array(dataY)
# fix random seed for reproducibility
numpy.random.seed(7)
”’
# this can be deleted
# print first and last values from dataset to verify data
print()
print(‘First 15 values from dataset:’)
for i in range(15):
print(dataset[i])
print()
print(‘Last 15 values from dataset:’)
for i in range(dataset.shape[0] – 15, dataset.shape[0]):
print(dataset[i])
”’
# reshape into X=t and Y=t+1
look_back = 10
look_back += 1
trainX, trainY = create_dataset(dataset, look_back)
# split into train and test sets
train_size = int(len(dataset) * 0.67)
test_size = len(dataset) – train_size
trainX, testX = trainX[0:train_size,:], trainX[train_size:len(trainX),:]
trainY, testY = trainY[0:train_size], trainY[train_size:len(trainY)]
”’
# this can be deleted
# print trainX and trainY to verify data
print()
print(‘trainX + trainY’)
for i in range(trainX.shape[0]):
print(i + look_back, end=’ ‘)
for c in range(look_back):
print(trainX[i,c], end=’ ‘)
print(trainY[i],” “)
print()
print(‘testX + testY’)
for i in range(testX.shape[0]):
print(i+ look_back + trainX.shape[0], end=’ ‘)
for c in range(look_back):
print(testX[i,c], end=’ ‘)
print(testY[i],” “)
”’
# reshape input to be [samples, time steps, features]
trainX = numpy.reshape(trainX, (trainX.shape[0], trainX.shape[1], 1))
testX = numpy.reshape(testX, (testX.shape[0], testX.shape[1], 1))
# create and fit the LSTM network
batch_size = 1
model = Sequential()
model.add(LSTM(4, batch_input_shape=(batch_size, look_back, 1), stateful=True, return_sequences=True))
model.add(LSTM(4, stateful=True)) # There is no need for an batch_input_shape in the second layer
model.add(Dense(1))
model.compile(loss=’mean_squared_error’, optimizer=’adam’)
for i in range(100):
model.fit(trainX, trainY, nb_epoch=1, batch_size=batch_size, verbose=0, shuffle=False) # I JUST SET VERBOSE=0 SO IT IS EASIER TO SEE THE PRINTED DATA
model.reset_states()
# make predictions
trainPredict = model.predict(trainX, batch_size=batch_size)
model.reset_states()
# add last entry from dataset to be able to predict unknown testY
a = dataset[len(dataset) – look_back:len(dataset), 0]
a = numpy.reshape(a, (1, a.shape[0]))
a = numpy.reshape(a, (a.shape[0], a.shape[1], 1))
testX = numpy.append(testX, a, 0)
# THIS HAS BEEN REMOVED, BECAUSE WHEN THE LAST ENTRY IS ADDED TO testX,
# testPredict HAS MORE VALUES THAN testY, WHICH WILL THROW AN EXCEPTION
#testScore = math.sqrt(mean_squared_error(testY[0], testPredict[:,0]))
#print('Test Score: %.2f RMSE' % (testScore))
# shift train predictions for plotting
trainPredictPlot = numpy.empty_like(dataset) # create array with same shape as dataset
trainPredictPlot[:, :] = numpy.nan # fill with nan
trainPredictPlot[look_back:len(trainPredict) + look_back, :] = trainPredict
# shift test predictions for plotting
testPredictPlot = numpy.empty_like(dataset) # create array with same shape as dataset
testPredictPlot[:, :] = numpy.nan # fill with nan
test = ['nan']
test = numpy.reshape(test, (len(test), 1))
testPredictPlot = numpy.append(testPredictPlot, test, 0)
testPredictPlot[len(trainPredict) + look_back:len(dataset) + 1, :] = testPredict
# zoom in on the test predictions
plt.figure(figsize=(10,4))
plt.title('Test Predictions')
'''
# the next two lines plot the data set to confirm that testY is the same as the dataset
# this can be deleted
datasetPlot = dataset[len(dataset) – len(testPredict) + 1:len(dataset),:] # subtract 24, because dataset has one less value than testPredict
plt.plot(scaler.inverse_transform(datasetPlot), color='y', label='dataset')
'''
testYPlot = numpy.reshape(testY, [testY.shape[1], 1]) # testY is [0, 47] need to change shape to [47, 0] to plot it
testYPlot = testYPlot[testYPlot.shape[0] – len(testPredict) + 1:testYPlot.shape[0]] # subtract 24, because testY has one less value than testPredict
plt.plot(testYPlot, color='b', label='testY')
testPredictPlot = testPredict[len(testPredict) – len(testPredict):len(testPredict), :]
plt.plot(testPredictPlot, color='r', label='Prediction')
plt.grid(True)
plt.grid(b=True, which='minor', axis='both')
plt.minorticks_on()
plt.legend()
plt.show()
Thanks for the awesome tutorial, Jason, and for being so helpful in the comments!
I’d like to predict into the future using time series data that has multiple observations from each date (and goes beyond a single year), and that also has multiple other features besides just the date and the label. I would also like to predict more than 1 step into the future, and to predict multiple dependent variables simultaneously if possible. I saw how to use additional features from other comments. I also think I saw how to predict more than 1 step into the future.
Could you explain how I can use data with multiple observations from the same date? I’m really stuck on understanding that. If you have the time, could you also explain how to simultaneously predict multiple dependent variables?
One other thing…how do I normalize the data when I have multiple variables, not all of which are numbers?
Great question. I’m working on more examples like this at the moment.
Generally, multiple input features is multiple multivariate time series forecasting. You can structure you data so that each column is a new feature in the LSTM format of [samples, timesteps, features].
A time-horizon of more than one timestep is called multi-step time series forecasting. Again, you can structure your data so that the output has multiple columns and then specify the output layer of your network with that many neurons.
If my input file have multiple columns “open, high, low, close, volume”, how can I adapt the script to use all columns for training and then make prediction for “close” column?
Nice tutorial. I recently used an LSTM forecasting.
I have a couple of questions.
1. When we are providing the training set is the LSTM which is being trained equal to the length of the training data size. For example if the training data is a sequence of 10000 values then is the LSTM equal to a 10000 length unrolled recurrent net like in this blog http://colah.github.io/posts/2015-08-Understanding-LSTMs/
2. I see that you are normalizing the entire dataset, and the data seems to be a monotonically increasing one. So any future data may not be scaled within that range .
How will you deal with such a case, where future data value is not within the range of observed data.
I’d recommend trying many different representations for a given perdiction problem. Try breaking it into sub-sequences, try using lag obs as features and time steps, see what works best for your problem.
It is a good idea to difference a dataset with a trend (changing level). Also, it is a good idea to power transform a dataset with an increasing variance (e.g. ideally boxcox or log). The dataset in this example could use both transforms.
I have a multivariate time series in which I have fields such as business days, holidays, product launch data etc. in addition to the Y (variable to forecast). How can I implement this model using a LSTM?
I tried to modify the data such that my Nxm training set (trainX) contains m lags for N rows (using ‘create_dataset’ method from the code), and then concatenated the additional information ( business days, holidays, product launch data etc.) as columns. However, I realize that , it does not make sense. I will somehow have to pass a data vector in place of every Y value and its m lags ( containing the additional information: holidays, product launch data and other info). If this makes sense to you, please advise how to go about with this. Thanks
However, in your example. Why don’t you consider preprocessing methods such as: log and difference dataset? Most of research papers showed that preprocessing data can improve prediction performance.
I agree, the example would be better if the data was made stationary first (log transform and differenced). I hope to cover this with fuller examples in upcoming blog posts.
Hi Jason, does this means, even though we’re making forecasting of time series using machine learning method, the pre-processing such as making the data stationary is necessary?
Thanks for great article!!!! I now probably can practice LSTM in code! 🙂
I got one question when I try to define my LSTM network. Say if I have some different datas, dataX, dataY, dataZ and try to predict/mimic dataA. Shall I use different batches or different features? (I know feature is designed for this, but it seems batch can also do the samething, am I right?)
dataX, dataY, dataZ, dataA all hold scalar value.
Another question is practical (basically python related). Say I have dataX and try to predcit dataA. dataX = [1,2,3,…n], is there any efficient way to build training dataset like [3,2, ].
There are many ways to represent time series data with LSTMs.
I’d recommend using a stateful LSTM with 1 lag variable as input and let it learn the sequence. Then try all other structures (timesteps/features) you can think of to see if you can out-perform your baseline.
Yes, consider using the Pandas shift() function. I offer examples in my recent time series blog posts.
What I’d like to know from this is if one could try to predict *one* signal given *n* other signals?
That would mean that the network learns about non-linear correlations between multiple signals and outputs a desired target signal. Can this be done using LSTM networks?
I have a similar dataset. However when trying to reshape the X array into the LSTM required format i receive an error : “lstm tuple index out of range”. Searched on Google but can’t find the solution that works. Any suggestions?
I feel like there is a delay effect happening. The shifted predicted values are closer to the value at current timestamp. Do you think there is an explanation of why that particular effect is being observed?
Would it be possible to learn to predict more than one steps ahead at once? For example, instead for giving past 3 data, learn to predict the future 3 data. (instead of only one future datum, as in your example)
Dear Jason Brownlee
Thanks for your useful tutorial
The topic of my master’s thesis is network bandwidth forecasting using LSTM. Can you help me with that?
In this tutorial you always give 4 output dimensions
model.add(LSTM(4, input_dim=look_back))
When I set the output dimension = 1, like:
model.add(LSTM(1, input_dim=look_back))
it returned error maessage:
TypeError: Cannot convert Type TensorType(float32, 3D) (of Variable Subtensor{:int64:}.0) into Type TensorType(float32, (False, False, True)). You can try to manually convert Subtensor{:int64:}.0 into a TensorType(float32, (False, False, True)).
Hello! Thanks a lot for your post! I have a small question? How do I modify the network in order to predict more than one day? For example, getting the next week of the passengers What are the specific parameters I should modify to make the prediction longer?
But code alittle bit incorrect , if we use the network in time series problems tests array must start end of train array in first example test array starts end of train array+1 in anothers exaples test array stars end of train array+3 …. etc if our inputs is small like 1 and 3 no problem but if our inputs big like 170 ,200 it is big problem…… Think please we predict stocks prices our tests stars 150 days later and will give incorrect results, coz market is changable…………
than
train, test = dataset[0:train_size,:], dataset[train_size:len(dataset),:]
must change like this
train, test = dataset[0:train_size,:], dataset[train_size-look_back-1:len(dataset),:]
and
testPredictPlot[len(trainPredict)+(look_back*2)+1:len(dataset)-1, :] = testPredict
so sorry i must add so that 🙂 i have a predict problem i tryed last tree mounts with ANN but i did not find answer and my best MSE was e-3 , when i see your article i decided try DeepLearning with keras now i cannot belive my eyes , my MSE has e-12 , Than Jason Tank you very much……
Hi Jason, Can this technique work for dynamical problems as well, where the time-varying response is a function of time-varying inputs? Ultimately the model should be able to provide/predict time-varying response for any arbitrary time-varying inputs. Thanks
I’m trying to create a curve predictive model to generate new curves (for example, sinusoidal curves), but the problem is that when I train my model with curves with different periods, the model can only generate curves with the same period (like an average of the periods of the training set) which could be the problem?
Hello Jason and thanks for your very nice tutorials.
I have this kind of problem and I wanted to ask you in which category it fits.
Let’s say I have a device which measures temperatures.The temperatures will have a “specific” range (I mean the source of the temprerature will be a steady source).
Now, I will take some thousands of temperatures vaues in the beginning and then, I want to be able to train my network , and when it sees a temperature which is not a good fit in the preious values, to reject them.
What kind of problem is this?Time series? Kernel density?Unsupervised cluster?
Hi Jason,
thank you very much for your great post.
I have a naive confusion regarding the ‘Test Score’ part.
Why we use
‘testScore = math.sqrt(mean_squared_error(testY[0], testPredict[:, 0]))’ instead of
‘testScore = math.sqrt(mean_squared_error(test[:286], testPredict))’ ?
What’s the difference between the two?
And also I am aware that you use ‘testScore = model.evaluate(testX, testY, verbose=0)’ to trigger the ‘testScore’.
Which one is the best to evaluate our model? Could you give me some advice?
Thank you for your work. I appreciate it a lot.
Best regards.
Hi Jason, That is really helpful post. I have a question about random walk data, Can we predict random walk data by using LSTM? I have also read your post about prediction of random walk but still believe LSTM is much better than other methods. Can you give me some advice?
Nice talk! Very clear and useful, being my first guide to implement LSTM in time series prediction. I’ve followed many of your articles, thx for your sharing!
Only one different opinion, it seems that you do Min-Max firstly on the whole dataset before training and prediction, which I think may be improper. Because “test set” should be treated like “online” data in real world, i.e. we never know what’s coming next into our model when we do prediction. If you scale test set first, then you are actually putting information of test set into training process, this will improve model performance on test set, but obviously, it’s improper. So I think the correct pipeline should be:
Step 1. Split dataset into train set and test set
Step 2. Train Scaler on train set and convert train set. i.e. trainSet_convert = scaler.fit_transform(train set)
Step 3. Train LSTM on trainSet_convert .
Step 4. Use scaler to transforms test set, i.e. testSet_transformed = scaler.transform(test set)
Step 5. Use LSTM to do prediction and evaluation on testSet_transformed
Here Step 1.~3. are training stage, Step 4.~5. are prediction stage. The main difference compared with your pipeline is that, scaler transforms test set on prediction stage, not training stage.
Thanks a lot for the useful articles, really good job!
I just have one question: also if I’ve already seen “4 Strategies for Multi-Step Time Series Forecasting” I still can’t get how to predict more future values than my initial dataset.
For example: If my dataset is composed by 100 values, how I can predict the next 10 values and display it in the same way you have done in this example?
), we see that we are using testX to generate predictions. Well, testX is merely a feature containing all the time series data, excluding the particular day we’re next trying to predict.
Then, once a prediction is made, that prediction is actually *ignored* when doing to subsequent prediction, and instead we use the actual data from testX.
So, is this model really only predicting one day in advance? If so, how is it useful? What am I missing here? I know that LSTM RNN’s are very powerful, but this example is not convincing me.
(FWIW, I reproduced this example by correcting it and truly using the predictions to feed the subsequent predictions, and the predictive capablility falls apart. After a few days, it just “stabilizes” and stops moving altogether.)
I agree with you! I have raised same question in my comment below. Almost all tutorial on using ML for time series forecasting is doing this type of mistake
Thank you for this tuto.
There is one thing that I didn’t understand.
I want to interpret the performance of my algo using the RMSE score.
But I was always working with scores in the range of 0 and 1 which is not the case in the first example(LSTM for regression).
So please , I want some details of the score of RMSE and its significance.
RMSE may or may not be between 0 to 1, depending upon the scale of target variable. RMSE mathematically is sum of sqaure of residuals, which in a way tells how much of variance model is not able to explain.
Since, we know the variance in original data we can use it to divide the RMSE, which gives Normalized RMSE or NRMSE, for a good model this quantity should always be less than 1, the closer it is to 0 the better it is. If it’s value is more than, it means that our model is introducing more variance than actually present in data, which is not the goal of any modeling exercise.
In statistics, 1- NRMSE is R-square, which is used to assess the goodness of a model. if R-square is closer to 1, model almost explains all the variance observed, if it is closer to 0, model does not explain any variance and in this case ‘mean’ of target variable would be much better predictor the than model itself.
When forecasting for test data, I think we should not assume that lagged data is available for all testing period. By assuming it to be available, i think we are over-stating the power of LSTM for time series forecasting.
As per me, right method to test would be –
1. When forecasting for time t + 1, we can take t and t – 1 values from train data. Here, t being final time of train data
2. But when forecasting for t + 2, t + 1 and t has to be used, in reality we don’t know t + 1, as we have data till time ‘t’. So, forecast value of t + 1 should be used instead.
3. Step 2 will have to be repeated for time t + 3, t + 4, …..
4. Once we have forecast using steps 2 and 3 for test period, we should compare it with the actual test data to get the error
If above is followed, we will get much higher error than we are currently getting by assuming the availability of lagged values.
Thank you for yours responses.
I asked this question because I follow the course Algo LSTM with Keras but using another dataset.
And I get as result RMSE= 0.01 but when I plot the result i found that the prediction graph are not really fiiting with our dataset.
Hey, thanks for such a detailed post. I thought you might like to check out a guest post we recently had on using LTSM RNNs in Keras Tendorflow for trend prediction using just 3 steps – let us know what you think…
Thanks a lot for the great tutorial Jason. This is super helpful.
However, I have one question. For the stateful LSTM when we are running the epochs manually, I understand why you are doing the model.reset_states() after each epoch.
But when we are finally doing the prediction, we run a predict on the train data and then do a reset_states() before doing a predict on the test data.
I think we do not need this as the test data is right after the train data temporally. So, I think we can use the previous state of the internal memory of the LSTM layer. What do you think?
I updated to the latest version of keras and tensorflow and get extremly bad results. Any suggestions for that Jason? Did you use the latest version of tensorflow?
Hi, The way this post wrote very well summarise.Thanks. I’m a beginner to ML student in campus in SL. I would like to understand the code snippet what each line does, where can I get the clear idea on that ?
..with the performance of the recommended baseline model, consisting a persistence forecast.
A) Feeded with the shampoo example data
The results are:
baseline score: 133.16 RMSE
LSTM simple example score: 142.44 RMSE > 133.16 RMSE
LSTM complete example score: 107.214 RMSE < 133.16 RMSE
B) Feeded with airline data the results are:
baseline score: 47.81 RMSE
LSTM simple example score: 44.87 RMSE 47.81 RMSE
What does this mean in regard to the so called mimicking effect?
And the criticism that there is actually no prediction involved.
I’ve got different results and multiple options to interpret them.
I’m a little bit confused now.
Sorry, the parser of the forum has stripped out some of my code.
B) Fed with airline data the results are:
baseline score: 47.81 RMSE
LSTM simple example score: 44.87 RMSE, is less then baseline 47.81 RMSE
LSTM complete example score: 61.369 RMSE, is greater then baseline 47.81 RMSE
What does this mean in regard to the so called mimicking effect?
And the criticism that there is actually no prediction involved.
I’ve got different results and multiple options to interpret them.
I’m a little bit confused now.
It may suggest the LSTM is more skillful than persistence.
Neural networks will give different results each time they are run. I recommend re-running an experiment many times (30) and taking the average performance.
This a good tutorial.
The only thing which is not clear is how to predict a value that we don’t know it.In this exemple we can predict only the value in our data set and we are not able to predict futur values !!!!!!!!!!!!
Thanks for sharing this great tutorial! Can you please also suggest the way to get the forecast For example, if we want to forecast the value of the series for the next few years (ahead of current time–As we usually do for the any time series data), i have a data from 2000 to 2016 ,and i want to have the forecast for the 4 next years . Thanks
Hi Jason!, first your work is awesome 🙂 and I want to thank you for sharing your knowledge, I have a question, how the model can predict future valued that are not in the data set?. All the examples I have seen in the internet just mimic the last part of the data set but not predict anything. I want to predict future movements but unless I know it can be done I have not find any way to do it.
Hope you can help me to do this.
Thanks so much!.
Hi Jason,
Could you please give a coding example of the suggestion you made to Daniel Luque.
Thank you so much for your contributions, this is definitely the best examples I have seen on this subject.
hi jason,i follow your tutorial,program can run ,but when i change little ,the result is not my expect.
i add the “metrics=[‘accuracy’]”:
model.compile(loss=’mean_squared_error’, optimizer=’adam’,metrics=[‘accuracy’])
when running,loss is down,but acc not change.why?thank you !
I think that my question is important. I am confusing with this algorithme.
When we set look_back = 50 and I provide a dataset with 50 measure to predict the 51 measure, I get an error.
I only can make prediction of the 53th value using 52th measure in dataset and look_back = 50
If we add the metrics accuracy
model.compile(loss=’mean_squared_error’, optimizer=’adam’ ,metrics=[‘accuracy’])
we will ntice that the accuracy is not good
Hello Jason, I have been reading a lot on your blog, very helpful indeed. So first my thanks, I’m fairly new to python and machine/deep learning, but with your examples I got a good starting point.
I have taken one of your lstm examples and adapted it , also changing to GRU and got decent results, however I would like to improve them.
Unfortunately I couldn’t find anything on the internet which would fit what I need.
So my hope is that you could point me in the right direction or help…I am trying to model a time series , now my problem is that it behaves differently on different days of the week and also on bank holidays.
I would like to “add”information to any time series step such as Day of week , week , distance to next bank holiday and which bank holiday is the next one. I have found tf. sequence example but not sure if that is what I am looking for.
Thanks in advance and Best Regards
Ed
HI Jason, thanks for the reply.I have done exactly that now, still fiddling abit to see the effects, but I hope that ultimately with the rihgt “tuning” that this will improve the results.
Best Regards
Ed
Hi Jason,
When it comes to displaying the predictions in the plot, my testpredict has fewer values than test. How to fix this bug? what modifications you need to make in the code for text predict to predict the values for 1/31/1961, if the dataset ends at 12/31/1960?
I think there is a terrible mistake when you divide the dataset between training and test. I rather split that samples randomly (but sequentially). Just give it a try and check the mse:
60% – train set, 20% – validation set, 20% – test set:
train, validate, test = np.split(df.sample(frac=1), [int(.6*len(df)), int(.8*len(df))])
or
70% – train set, 30% – test set:
train, test = train_test_split(df, test_size=0, random_state=42)
I think that it’s better if you try with more data. I don’t beleive 141 samples are good enoght to train a model… I just tried with another dataset with +3K samples and it worked really good (small RMSE) without overfitting the NN. Anyhow, these are really good posts, it helped to to get started with keras and LSTM from zero to hero in in few mintues. Just wonder if you have another post describing in details how to build the keras model…
Thank you for you contribution. However, I’m sorry to say it, but this post doesn’t seem to show a successful LSTM model. A RMSE of 56.35 is worse than if you simply pick the input value as your prediction, which gives you a RMSE of 48.66. You can check it by running:
This is hinted at in the graphs as well, where you can see your predictions goes in one-lag lockstep with the inputs, they should overlap exactly. Remember, a good time series prediction has the ability to predict change.
Hi, thanks for you Blog, that help me a lot in my project and understanding LSTM, by the way, I notice that in creat_dataset function, there is no need to minus one in i’s range. Or you will loose one element.
Jason:
Thank you so much for the great tutorial. Your blog has really taken my skills to the next level as working with Theano was very challenging in the past.
Quick question:
How can I modify you code to take in sequences of 2 real valued numbers (x, y coordinates) and with a look_back window of 3 to predict the time at t+1. The output should be x, y coordinates.
Here is the code I am using, though I am getting an error:
Error when checking model input: expected simple_rnn_1_input to have shape (None, None, 3) but got array with shape (1470, 3, 2)
Here is the main areas I have changed:
-pandas.read_csv reads in 2 columns of data
-Create dataset creates sets that are num_samples x time_steps x features.
-I am using the regression with time steps sample.
-Change Dense(1) to Dense(2) since expecting 2 outputs.
Jason:
Thank you so much for the great tutorial. Your blog has really taken my skills to the next level as working with Theano was very challenging in the past.
Quick question:
How can I modify you code to take in sequences of 2 real valued numbers (x, y coordinates) and with a look_back window of 3 to predict the time at t+1. The output should be length 2 for the regression of x, y coordinates of the prediction.
Here is the code I am using, though I am getting an error:
Error when checking model input: expected simple_rnn_1_input to have shape (None, None, 3) but got array with shape (1470, 3, 2)
Here is the main areas I have changed:
-pandas.read_csv reads in 2 columns of data
-Create dataset creates sets that are num_samples x time_steps x features.
-I am using the regression with time steps sample.
# SimpleRNN that learns on a x, y
import numpy
import matplotlib.pyplot as plt
import pandas
import math
from keras.models import Sequential
from keras.layers import Dense
from keras.layers import LSTM, SimpleRNN
from sklearn.preprocessing import MinMaxScaler
from sklearn.metrics import mean_squared_error
# convert an array of values into a dataset matrix
def create_dataset(dataset, look_back=1):
dataX, dataY = [], []
for i in range(len(dataset)-look_back-1):
a = dataset[i:(i+look_back), 0]
dataX.append(a)
dataY.append(dataset[i + look_back, 0])
return numpy.array(dataX), numpy.array(dataY)
def create_dataset2(dataset, look_back=1):
dataX, dataY = [], []
for i in range(len(dataset)-look_back-1): # go from 0 to dataset length – lookback +1
features=[]
set_of_features=[]
a = dataset[i:(i+look_back), 0] # slice dataset from i to i+ lookback, column 0 (which is x)
b = dataset[i:(i+look_back), 1] # slice dataset from i to i+ lookback, column 1 (which is y)
for X1, X2 in zip(a, b): # create tuples, the list will be tuples of length lookback
features=[X1,X2]
set_of_features.append(features)
dataX.append(set_of_features)
# now do the target (should be a tuple right after the lookback)
dataY.append([dataset[i + look_back, 0], dataset[i + look_back, 1]])
return numpy.array(dataX), numpy.array(dataY)
# fix random seed for reproducibility
numpy.random.seed(7)
# load the dataset
dataframe = pandas.read_csv(‘spiral.csv’, usecols=[1,2], engine=’python’, skiprows=0, delimiter=’\t’) # tab delimited here, use the 2 columns
dataset = dataframe.values
dataset = dataset.astype(‘float32′)
# normalize the dataset
scaler = MinMaxScaler(feature_range=(0, 1))
dataset = scaler.fit_transform(dataset)
# split into train and test sets
train_size = int(len(dataset) * 0.67)
test_size = len(dataset) – train_size
train, test = dataset[0:train_size,:], dataset[train_size:len(dataset),:]
# reshape into X=t and Y=t+1
look_back = 3
trainX, trainY = create_dataset2(train, look_back)
testX, testY = create_dataset2(test, look_back)
# reshape input to be [samples, time steps, features]
#trainX = numpy.reshape(trainX, (trainX.shape[0], 1, trainX.shape[1]))
#testX = numpy.reshape(testX, (testX.shape[0], 1, testX.shape[1]))
trainX = numpy.reshape(trainX, (trainX.shape[0], trainX.shape[1], trainX.shape[2]))
testX = numpy.reshape(testX, (testX.shape[0], testX.shape[1], testX.shape[2]))
i want to make prediction using back propagation algo
can u help me in telling that what would be our target class and how we can convert it in 0 and i
Hi. Great tutorial. Need help in adapting this to my specific problem. I have 2d data set of the dimension 100*30. where 100 is number of different company stocks and 30 is the stock price of each company for 30 consecutive days. Please help in understaning the input dimension of the LSTM in keras for predicting the stock price of 100 different companies in next 10 days.
The expected input structure is [samples, timesteps, features].
Each series is a different feature. Time steps are the ticks or movements. You may need to split each series into sub-sequences, e.g. 200-400 timesteps long. In that case, each sub-sequence will be a sample.
That is really amazing work, but is all the cases you showed, the data is always numeric. I have regression problem (label is a float) but I have multi type data (strings and numerics). How can I use string properly instead of mapping them a random integer ?
Thank you
I see that LSTM is a powerful model which can get better results than classic time series models like ARIMA in some circumstances, but… is it possible to have something similar to confidence intervals for the predictions? is only possible to obtain point forecasts?
Your plot looks like your prediction for both test and train data is lacking 1 datapoint behind – which is exactly what is known to the network. A “predictor” that would just return the input, so lets assume this function:
def predict(x):
return x
would also “follow” the curve, but is not very intelligent. A better prediction would be to use the prediction of t=t0 as an input to the prediction at t=t0+1, then use this output as input for t=t0+2 and so on. Just like what you did here: https://machinelearningmastery.com/text-generation-lstm-recurrent-neural-networks-python-keras/
I hope you could grasp what I mean. Thanks for your thoughts.
I’m trying to apply this for a dengue prediction system. The problem is to determine number of dengue patients in a given week (time series prediction), given the attributes (humidity, temperature for that week).
I set trainX to input features and trainY to number of dengue patients.
So the trainX has the format (attribute1, attribute2, .. attributen) whereas trainY is a vector containing number of patients.
The model predicts some output, but the mean square error is very high.
Is there any way to improve?
and in dengue prediction, we should relay on time steps since number of dengue patients in a given week depends on number dengue patients in the previous week. But the problem is unlike the problem in this post, I don’t have the actual number of patients for a given week for the test data set. In this case, how can I use “LSTM for Regression with Time Steps” for my problem?
I am very new to machine learning and Keras. I have one task to be completed. In it, my input is vector of size 19 (features) and I have 2000 samples (rows of data) and I would want to predict single output value. I am little bit confused in how to create and fit LSTM network that is suitable for this scenario.
What would be the parameters to the LSTM layer while adding it to the model like, units, input_shape?
Basically its a time series regression analysis using LSTMs.
Thanks for your beautiful article.I tried this with some other data set(it has some negative values too), the result was excellent but the only problem was in predicting negative part!I mean in some place at future the line is going below x-axis(negative part) in actual graphs but when the algorithm tries to predict that it goes until x=0 and then return to the positive area of the y-axis.Could you help me why this happens?
And also I saw this question (a lot of time) above in the article but I could not find any answer for that.What should we do if we want to predict more step in the future like future 2-month prediction?If there is any other tutorial about this, please let me know.
HI Jason and All,
Sorry if my question is too basic, how can I separate the training from the test please? I need to run them separately but failed to understand what output comes out of the training and what I need to feed in to the predict function in another file? Any Clues? I mean if it’s possible in the first place of course.
Many thanks,
Goran
Thanks for your interesting tutorial.
I have a question ,I’m thinking about some interesting project but I’m not sure if it is possible by using LSTM model in Keras or not,could you help me please.
I have some noisy signal and then by using some filtering method I make it smooth to get information from pure noise,right now the method which I’m using is so time consuming.
So I want to try it like your method here,the only thing is that I should give noisy signal as an input to my NN and then it should train himself by whatever I had in smooth information(which I got from filtering method)then it should predict future smoothing part base of raw signal.Do you have any idea about?
Thanks for the great post. Can you help understand a few doubts?
1 – Why choose the mean-max scaler from 0 to 1? Why not use the standardization instead? Does this have to do with sigmoid? What would be the optimal choice for Relu or Tanh?
2 – By scaling the entire dataset, are not we incurring in lookahead bias? Should not the fit be done on train dataset and use this fit to transform the test dataset?
3 – In the statefull example you mention “need to be trained for more epochs to internalize the structure of the problem.”. Does not this usually lead to overfitting instead?
4 – Is it possible to query the state of the lstm in keras/tensorflow?
Once again thanks for making ltsm and keras easier to understand and experiment.
Thanks for the tutorial, but to get the real RMSE, shouldn’t you shift the predicted values 1 step back to compare with the actual values?
Putting in the code, will be:
trainScore = math.sqrt(mean_squared_error(trainY[0][:-1], trainPredict[1:,0]))
testScore = math.sqrt(mean_squared_error(testY[0][:-1], testPredict[1:,0]))
I’m getting values below 10 RMSE with this fix
It was great help for me!! But I have some problems. After using MinMaxScaler, I got some
trouble in scaling part. How to deal with this problem?
>>> dataset = scaler.fit_transform(dataset)
Traceback (most recent call last):
File “”, line 1, in
File “C:\Users\01029\Anaconda3\envs\tensorflow\lib\site-packages\sklearn\base.py”, line 494, in fit_transform
return self.fit(X, **fit_params).transform(X)
File “C:\Users\01029\Anaconda3\envs\tensorflow\lib\site-packages\sklearn\preprocessing\data.py”, line 292, in fit
return self.partial_fit(X, y)
File “C:\Users\01029\Anaconda3\envs\tensorflow\lib\site-packages\sklearn\preprocessing\data.py”, line 318, in partial_fit
estimator=self, dtype=FLOAT_DTYPES)
File “C:\Users\01029\Anaconda3\envs\tensorflow\lib\site-packages\sklearn\utils\validation.py”, line 416, in check_array
context))
ValueError: Found array with 0 sample(s) (shape=(0, 0)) while a minimum of 1 is required by MinMaxScaler.
Hello, thank you very much for your rich tutorial. In fact, I am a student of Master 2 in Intelligent System and Multimedia in Vietnam at the Institut Francophone International. I have a concern! I am working on a project to find a causal relationship between climatic factors (I have 7 input climatic factors) and the epidemic of dengue (which will be out) in Southeast Asia for a period Of 1994 – 2010 using Deep Learning! But, I’m not sure what Deep Learning approach to use! I have documented a little, many books say that “the causal relationship Deep learning uses unsupervised learning”. I would like you to help me by pointing out which Deep learning approach used especially as these are very complex approaches! Thank you…
Excuse me for the derangement again, so, if I understand correctly, the causality of time series is not feasible in supervised learning as unsupervised for deep learning?
For example, I used the granger causality method for the same subject and I would like to use deep learning to solve problems!
Hello Jason, thank you for this great tutorial. I am using the above LSTM code to try to predict the next day’s change in a stock value (I made it a classification problem where I assign different classes to specific ranges of values). I am using multiple features and some of them have large values.
I tried running the algorithm normally and got terrible results. However, when I stopped normalizing my dataset, my accuracy improved a lot.
What do you think might be the reason behind that? Is it the normalization technique that might not be right? I would like to hear your input!
My questions is: when the LSTM does the next prediction, does it look at the actual test values? or it looks at the previous predicted value? Because I guess the error is higher when the prediction is made on previous predicted values (because they will be a little different than the actual test values each time)
The model approximates a function with inputs (lag obs) and an output (prediction). You can define what the model takes as input (input_shape and data preparatation).
In lstm using windows methode netwrok how the weighs are adjusted in the hidden layers because in the other architectures we have:
w_(ht) = the weights between the hidden layers of each time step and the input how we can do it for one to many architecture here we have one time step im confused
this method can be considered as one to many architecture
Hi Jason – Thanks for the post.
My question is at a more macro level. I am trying to create a ensemble system of forecasting which will use both traditional ARIMA/ARIMAX and the NeuralNet models. But from what I have read in the literature is that the NNs only perform marginally better than traditional ARIMA, while in some cases ARIMA is better. Now given that NNs need a lot of set up and training time, is there really a benefit in using NNs for Forecasting problems ? Can you guide me to resources/URLs where they have shown the advantages of NNs over ARIMA?
Hi, I have a question about time-series.
If I have time series data like in every 1 minute, can my data be implemented like above code to predict values?
Also, I have one more question that is time series prediction with LSTM and RNN playing only
with just one column of input data??
I would recommend adding more LSTMs not more Dense.
LSTMs need a 3D input, which means that the prior LSTM layer will need to return a sequence (3D) rather than a final state vector (2D) as output. You can do this by setting return_states=True in the previous layer.
To make it more clear: In the above example there is no forecasting for future dates(unavailable data). but i would like to forecast for next 10 years or so.
how would i do that once i build our LSTM model?
I understand we use predict function and predicted on the test data,but again our input was same dataset(x_test). we cannot get this data for future dates right?
Are there examples of LSTMs applied to panel data? So for example each person has their own sequence, and we want to make a prediction about the next value in each person’s sequence without losing information learned from other people’s sequences?
Wonderful post. I was wondering which activation function is used from the hidden layer to the output layer. Is this just a linear activation function? I read in the keras documentation that the linear activation function is used when you don’t spedify it explicitly. Is this correct? Thanks!
Hello, what would be the problem if we discarded the dense layer and used the linear activation of the LSTM (activation=None)? I think that in this way we would have less weights to train totally. Thank you.
I’d like to ditto all the comments above in that these are very well explained tutorials. Thanks for them. In your examples you’re making a prediction for the next time step only, have you found that modelling such that you predict the next, say 10 or 20 time steps is inherently less accurate? IS it trivial to make this change?
Hello Jason
Thank you for this great tutorial
I am using anaconda 3 (64 bit) with python 3.6.1
The dataset length is (5 * 65000)
I reduce epoch to 10 (for time saving while trying)
can you help with this error which I got while implementing the above code?
Traceback (most recent call last):
File “C:/Users/Sayed Gouda/PycharmProjects/training/ds.py”, line 64, in
trainPredict = scaler.inverse_transform(trainPredict)
File “C:\Users\Sayed Gouda\Anaconda3\lib\site-packages\sklearn\preprocessing\data.py”, line 376, in inverse_transform
X -= self.min_
ValueError: non-broadcastable output operand with shape (43547,1) doesn’t match the broadcast shape (43547,5)
Dear Jason,
What is the difference between these two parameters then: look_back and input_features? If we consider the last N points as features in the window version to forecast the next point, should we set both parameters to the number of features?
Regards
i did what you just say but i got another error
ValueError: Error when checking input: expected lstm_1_input to have shape (None, 5, 1) but got array with shape (43547, 1, 1)
could RNN use to learn categorical data in dataset lets say for the api logs which has the features timestamp(with15min gap),req_method(GET/POST/PUT or any)/response_time/NoOfRequests and train RNN timeseries and build to predict the number of requests (feature number 4) by giving remaining variables as test data ?
Thanks, so I converted those categorical features using the one-hot encoding (0 or 1 matrixes) method.Now the data set (first 2 rows) is [1]; having 8099 data points actually.
since in code [2]
it could able to use only one column (column number 14), so how can I change this to use multiple variables (numerical and categorical)?
pandas.errors.ParserError: ‘,’ expected after ‘”‘. Error could possibly be due to parsing errors in the skipped footer rows (the skipfooter keyword is only applied after Python’s csv library has parsed all rows).
Hi, Jason. when I run the first script, I got such error. Can you help me fix this?
Using TensorFlow backend.
Traceback (most recent call last):
File “predic_ltsm.py”, line 40, in
model.add(LSTM(4, input_shape=(1, look_back)))
File “/home/leopard/workspace/dl/keras/venv2.7/local/lib/python2.7/site-packages/keras/models.py”, line 436, in add
layer(x)
File “/home/leopard/workspace/dl/keras/venv2.7/local/lib/python2.7/site-packages/keras/layers/recurrent.py”, line 262, in __call__
return super(Recurrent, self).__call__(inputs, **kwargs)
File “/home/leopard/workspace/dl/keras/venv2.7/local/lib/python2.7/site-packages/keras/engine/topology.py”, line 569, in __call__
self.build(input_shapes[0])
File “/home/leopard/workspace/dl/keras/venv2.7/local/lib/python2.7/site-packages/keras/layers/recurrent.py”, line 1043, in build
constraint=self.bias_constraint)
File “/home/leopard/workspace/dl/keras/venv2.7/local/lib/python2.7/site-packages/keras/legacy/interfaces.py”, line 87, in wrapper
return func(*args, **kwargs)
File “/home/leopard/workspace/dl/keras/venv2.7/local/lib/python2.7/site-packages/keras/engine/topology.py”, line 391, in add_weight
weight = K.variable(initializer(shape), dtype=dtype, name=name)
File “/home/leopard/workspace/dl/keras/venv2.7/local/lib/python2.7/site-packages/keras/layers/recurrent.py”, line 1035, in bias_initializer
self.bias_initializer((self.units * 2,), *args, **kwargs),
File “/home/leopard/workspace/dl/keras/venv2.7/local/lib/python2.7/site-packages/keras/backend/tensorflow_backend.py”, line 1723, in concatenate
return tf.concat([to_dense(x) for x in tensors], axis)
File “/home/leopard/workspace/dl/keras/venv2.7/local/lib/python2.7/site-packages/tensorflow/python/ops/array_ops.py”, line 1000, in concat
dtype=dtypes.int32).get_shape(
File “/home/leopard/workspace/dl/keras/venv2.7/local/lib/python2.7/site-packages/tensorflow/python/framework/ops.py”, line 669, in convert_to_tensor
ret = conversion_func(value, dtype=dtype, name=name, as_ref=as_ref)
File “/home/leopard/workspace/dl/keras/venv2.7/local/lib/python2.7/site-packages/tensorflow/python/framework/constant_op.py”, line 176, in _constant_tensor_conversion_function
return constant(v, dtype=dtype, name=name)
File “/home/leopard/workspace/dl/keras/venv2.7/local/lib/python2.7/site-packages/tensorflow/python/framework/constant_op.py”, line 165, in constant
tensor_util.make_tensor_proto(value, dtype=dtype, shape=shape, verify_shape=verify_shape))
File “/home/leopard/workspace/dl/keras/venv2.7/local/lib/python2.7/site-packages/tensorflow/python/framework/tensor_util.py”, line 367, in make_tensor_proto
_AssertCompatible(values, dtype)
File “/home/leopard/workspace/dl/keras/venv2.7/local/lib/python2.7/site-packages/tensorflow/python/framework/tensor_util.py”, line 302, in _AssertCompatible
(dtype.name, repr(mismatch), type(mismatch).__name__))
TypeError: Expected int32, got list containing Tensors of type ‘_Message’ instead.
Hi, Jason. I just find what’s wrong.
I just use the old version of TensorFlow-0.12. After I update tensorflow version to 1.2.1.
It run successfully. Thus I think maybe the python APIs change for the new version.
Anyway. I’am so excited. Thanks for the nice tutorial !
Great post! I am just a little bit confused about the use of reset states on stateful lstm RNN, cf. ‘Stacked LSTMs with Memory Between Batches, code line 50,51,52 in the post’. Say we have a well trained stateful LSTM RNN model, then we want to make predictions on testX, so first we make predictions on trainX to get the state of last time step, then use the state of last time step as the initial state of the test set, do testPredict = model.predict(testX, batch_size=batch_size), question is why model.reset_states() is in between?
I am trying to implement the RNN regression with dataset having 4 samples and 1 features columns,the shape of dataset is (9567,5),here 9567 rows ,5 columns ,how to reshape the this data set for RNN.
i am trying to train the RNN Regression model with optimizer adam and loss function mean_sqaured_error,but i am getting too much loss value,even though i have increased the no of epochs and node list also,please give any suggestions to decrease the loss value in RNN Regression
Thanks for writing a nice blog.Iam using daily level data for forecasting .If i would need a 90 days ahead forecasting what i need to do .This example is for one step ahead forecasting .
Unfortunately the fitting of the two series in the plot is just an illusion. Here is why:
The output of your network is a 1 step delayed version of the input.
In other words, the network learns that outputting something similar to the input will minimize the mse. That is sometimes called a “trivial predictor” and has very poor predictive performance.
If you do not believe me go ahead and calculate the mse between X(t) and X(t-1) (no neural network required). Is your prediction much better than this?
Alternatively you can plot your output Y(t) together with X(t-1). That does not fit perfectly?
model = Sequential()
model.add(LSTM(1,unroll=True,batch_input_shape=trainX.shape, return_sequences=False))
model.add(Dense(300))
model.add(Dense(1,activation=’linear’))
#model compilation
model.compile(loss=’mean_squared_error’, optimizer=’rmsprop’, metrics=[“mse”])
print “it is going to train the model”
#train the model
model.fit(trainX,Ytrain,batch_size=2,nb_epoch=100,verbose=2)
#predict the outputs
predictions=model.predict(trainX)
score=model.evaluate(trainX,Ytrain,batch_size=32)
this is my code RNN Regression.
i am getting too much loss values ,while training the model.please give me suggestions for to improve my model performance.
Here is another reference on time-series prediction with neural networks and gaussian processes, which includes various feature pre-processing techniques.
Thanks for the wonderful explanation. I am working on my master thesis and my task is to perform predictive analysis (time series data) using neural networks. In statistical theory, it can be called as multivariate time series regression. I have N features for the sales prediction. My question is, how feature selection method works in LSTM? Do I need to find the best features (srongly correlated) prior to feeding the data in LSTM or model will learn on its own?
Hi Jason.
Love your blogs and the content you create. Extremely helpful.
I am currently working on a problem where I have to do text classification, or basically review classification.
I used your code template for CNN-LSTM classifier, and even included dropout.
Can you suggest other techniques that couuld be useful to get better accuracy. I got 70% accuracy on training-test data , but on new data, the model didn’t perform so well and only got 64%.
I used CountVectorizer to convert the text to array, and chose max features up to 1500
Does this hyper parameter have significant effect on the accuracy?
1. Focus on your text data and clean it well and reduce the size of the vocabulary to essential words.
2. Consider a multi-headed CNN with each head reading text with differently sized n-grams (e.g. kernel size).
Hi Jason,
Thank you for the blog it’s so helpful.
Actually, I am working on time series data which is close to this example. When I build the model, it doesn’t memorize the high picks. Also, I want to predict future data based on my known data then I try to shift my sequence step by step to predict future values, the problem is that it get worse and worse when I add forecasted data.
I tried to increase the timestep but the result didn’t get better. I tried also to increase the number of epoch and the number of layers but still the same thing.
What do you recommend in this case?
when ever i am doing model.predict(xtrain_values),i am getting all predict values as same ,that is why i am not getting good loss values,how to resolve this issue .
Please help me in this scenario.
model.predict() gives same output for all inputs in regression,any solution for this problem.
my configuration,
3 hidden layers with relu activation functions.
output layer is linear,batch size :24 and no of epochs is 60.
nodes are :200,100,50.
inputs nodes :4
loss function : mean squared error
optimizer : adam.
I think there is a error: A few data points in train and test data seems to be missing, as you can see on the graph (green line finishes before the blue line).
Here are the steps to fix it:
First you are removing 2 points from the train and test data here:
“for i in range(len(dataset)-look_back-1):” it should be: “for i in range(len(dataset)):”
After this change, inside the loop we are tyring to acess a element outside the dataset (the next prediction), since we are not using then dataY it in the test dataset. we can just set it to 0:
“if i + look_back < len(dataset):
dataY.append(dataset[i + look_back, 0])
else: dataY.append(0) #This is the last value, no prediction necessary."
After this, both the training and test set will have all the data (and not 2 less data points as before).
Now we just need to plot it.
Not sure why the train "prediction" array shift that was used (probably to mask the missing of data points), it can just be ploted like this:
"plt.plot(trainPredict)"
And finally since the test data now has the right dimension it can be shifted just next to the train prediction:
testPredictPlot[len(trainPredict):len(dataset) :,] = testPredict
# create and fit the LSTM network
model = Sequential()
model.add(LSTM(4, input_shape=(1, look_back)))
model.add(Dense(1))
model.compile(loss=’mean_squared_error’, optimizer=’adam’)
model.fit(trainX, trainY, epochs=100, batch_size=1, verbose=2)
in this model , why we have to specify the hidden first layer neurons number in the First layer itself,why don’t we specify this number of neurons in second layers .
Consider I measure something 3 times a month for few years.
In 2014, I’ve measured it on “2014-02-01, 2014-02-05, 2014-02-13 ” in (YYYY-MM-DD) format.
In 2015, I’ve measured it in the same month, but on different dates “2015-02-11, 2015-02-16, 2015-02-21 “.
Is it advisable to assign monthly values to average of that particular month of the year by grouping it? or Is it okay to use the same data-set without processing it?
CNN is mainly used for image processing,but i didn’t find any examples for CNN so far.
how i can write this cnn Regression ,please give me any suggestions for it.
Sorry, I am only familiar with the use of CNN on image and text data. I have not used it on regression problems.
I do not expect CNN to be useful for regression unless your obs are ordered, e.g. time series.
I expect you can model your problem using a window method and a 1-D CNN. Some of my examples of working with text and a CNN may be helpful to you for a starting point.
Jason, hi!
Is there a case when we predict the same thing but for several airlines
In this case, we can increase the dimension
look_back = number of companies
but what if we want to add another variable, for example, the budget for advertising
Hi Jason, thanks for the tutorial it was really helpful like always.
However, I am having kind of an existential crisis. Lets say we have a series 2, 4, 8, 16, 32. We get the difference and get the following (lets forget scaling for now)
X = 2, 4, 8
y = 4, 8, 16
we use X_train = 2, 4 and y_train = 4, 8 to train the model to predict y = 16 if X = 8. How does this help unless we can predict the next number in the series (64). How do we do that because we do not have difference (X value) for that?
I know others have asked the same question and I checked all the links but all examples are just train, test split of the data without actual forecasting of unknown values. Could you please extend this tutorial to include forecasting of next values in the series because that will give more meaning to this exercise.
Thanks for your great tutorial. I have a question regarding to the input shape, the time steps and the number of features, when the value of look_back is more than 1.
# reshape input to be [samples, time steps, features]
trainX = numpy.reshape(trainX, (trainX.shape[0], 1, trainX.shape[1]))
testX = numpy.reshape(testX, (testX.shape[0], 1, testX.shape[1]))
# create and fit the LSTM network
model = Sequential()
model.add(LSTM(4, input_shape=(1, look_back)))
In your code, the original trainX is a 2D matrix with dimension [samples, look_back], and it looks like you are using the value of look_back as the number of features.
Alternatively, it might be more intuitive to treat the value of look_back as timesteps, then the code will be changed to
# reshape input to be [samples, time steps, features]
trainX = numpy.reshape(trainX, (trainX.shape[0], trainX.shape[1], 1))
testX = numpy.reshape(testX, (testX.shape[0], testX.shape[1], 1))
# create and fit the LSTM network
model = Sequential()
model.add(LSTM(4, input_shape=(look_back, 1)))
The value of features is 1 as we are doing uni-variate LSTM.
Am I understanding the meaning of look_back and input_shape correctly?
Do you think there is any difference by treating look_back == timesteps and look_back == features?
I have a question about bidirectional LSTM.
Keras provides a wrapper so we can do something like
model.add(Bidirectional(LSTM(10, return_sequences=True)))
In this case, however, do we have 10 units for forward processing and 10 units for backward processing? Or 5 each?
I took a quick look at the source code and it seems to be 10/10. (And the number is not required to be even.)
Hello Jason I have a question. Can we apply multi-threads on this program? If the size of the training dataset is big it can take a long time to train the LSTM network. Can we separate the dataset or the epoches?
Keras is built on top of math libraries like TensorFlow and Theano. These underlying libraries will allow you to run code on multiple cores automatically or GPU cores if configured.
Hi Jason, this is an awesome tutorial, it has been very helpful for me to understand the way LSTMs work. There is something I don’t have clear at all, it is possible to configure a LSTM network with more than one hidden layer? and how does this influence the behavior of the network? Sorry if it is obvious, Thanks
Hi Jason, I am in the Udacity Nanodegree program. I am working on a project using RNN-LSTM. But I am having a difficult time understanding the input shape. I don’t know if I missed something but I am not getting it. Are there any resources you could point me to? So I can understand how it works a little better.
First of all ,thanks a lot for the great tutorial Jason.
I just have one question regarding the achieved predictions using the LSTM network.
I just don’t understand why are you making “trainPredict = model.predict(trainX)” .
I get the predict method using the testset testX, but using this method for trainX is not like if you were in some way cheating? I say this because we train the network using the trainX and trainY and trainY corresponds to the labels you are trying to predict in the predict method using trainX.
Is it performed for validation purposes only?
I’m still learning to work with the Keras API so I might be confused with the syntax of it
Hi Jason,
thank you so much for those tutorials, they are a great resource.
I have one quick question though: How can we use peephole connections?
I want to compare the performance of LSTMs using/not using them.
I do not quite understand the meanings of LSTM blocks/neuron in keras or unit number in Tensorflow. Could you help me explain these terms with a graph?
I found some graphs in ttps://github.com/fchollet/keras/issues/2654 or https://stackoverflow.com/questions/43034960/many-to-one-and-many-to-many-lstm-examples-in-keras. In the many to many model of LSTMs, Do the green rectangles represent the STM blocks/neuron in keras or unit number in Tensorflow? However if the input sequence is smaller than the number of blocks/neuron, does it mean that some neurons have not input series, just pass states to the next neurons? For example, the input sequence is 30, while the number of neurons is 128.
I am a beginner in the field of Handwriting Recognition Problem. I have gone through your article and I found 4 categories for sequence prediction problem: Sequence Prediction, Sequence Classification, Sequence Generation, Sequence-to-Sequence Prediction. So, which category belongs to Handwriting Recognition?
By Reading this blog, I got the idea how LSTM works but I am not getting about Multi-dimensional LSTM(MDLSTM). How can we incorporate it for Handwriting recognition Problem?
I found a paper which is working on MDLSTM for handwritten text. https://arxiv.org/pdf/1604.03286.pdf
Can you help me to figure out it?
What about MDLSTM? This paper (https://arxiv.org/pdf/1604.03286.pdf) is talking about scanning image in 4 directions for Handwriting recognition. But I have gone through many papers where CNN is used first to extract features followed by LSTM. Can you help me to figure out the things?
Thanks so much for such great tutorials. I have gone thru all of them and find them very useful. I am trying to predict time series having a lot of surges.
So far I managed to get reasonable prediction however in all models I have tried I am having delayed output by single time unit (similar to what you are having in this tutorial).
I have also managed to get rid of the delyed output in this tutorial by increasing the timesteps to 12 and so the number of nurons to 12 in order to include the yearly seasonality.
My question is, is this the reason for the delyed output? if so, i dont see how i get rid of my model’s delayed output since it is a very difficult task to train a surgey signal.
Thanks for your reply.
I am aware of that.
Again, this happens in your example also. Do you know what causes this to happen?
I have train the model with var t-2 only and got delayed output of 2 units.
Great tutorial thanks
I just compared my RNNs, one with only one time step and another with 60 time steps which means it’s trained with 60 previous days(i-60) to predict the next day (i+1 or i depending on how you define). Both are good enough, but one thing I cannot understand is the RNN with only one time step shows a better prediction than the one with 60. I’m just vaguely getting my head around it thinking since there are more data it should calculate, it’s showing a bit more inaccurate results than the one with one time step.
But I ask myself again that “than, what’s the point of feeding it with more data? if it gives me worse predictions”
First of all thanks for the tutorial. An excellent one at that.
However, when I run your first source code is always wrong, as follows:
Traceback (most recent call last):
File “D:/Deep Learning/Examples/LSTM/11/hbckyc.py”, line 59, in
model.add(LSTM(4, input_shape=(1, look_back)))
File “E:\anaconda3-4.4.0\envs\dlwin36\lib\site-packages\keras\models.py”, line 443, in add
layer(x)
File “E:\anaconda3-4.4.0\envs\dlwin36\lib\site-packages\keras\layers\recurrent.py”, line 262, in __call__
return super(Recurrent, self).__call__(inputs, **kwargs)
File “E:\anaconda3-4.4.0\envs\dlwin36\lib\site-packages\keras\engine\topology.py”, line 569, in __call__
self.build(input_shapes[0])
File “E:\anaconda3-4.4.0\envs\dlwin36\lib\site-packages\keras\layers\recurrent.py”, line 1021, in build
constraint=self.kernel_constraint)
File “E:\anaconda3-4.4.0\envs\dlwin36\lib\site-packages\keras\legacy\interfaces.py”, line 88, in wrapper
return func(*args, **kwargs)
File “E:\anaconda3-4.4.0\envs\dlwin36\lib\site-packages\keras\engine\topology.py”, line 391, in add_weight
weight = K.variable(initializer(shape), dtype=dtype, name=name)
File “E:\anaconda3-4.4.0\envs\dlwin36\lib\site-packages\keras\initializers.py”, line 208, in __call__
dtype=dtype, seed=self.seed)
File “E:\anaconda3-4.4.0\envs\dlwin36\lib\site-packages\keras\backend\theano_backend.py”, line 2123, in random_uniform
return rng.uniform(shape, low=minval, high=maxval, dtype=dtype)
File “E:\anaconda3-4.4.0\envs\dlwin36\lib\site-packages\theano\sandbox\rng_mrg.py”, line 1354, in uniform
rstates = self.get_substream_rstates(nstreams, dtype)
File “E:\anaconda3-4.4.0\envs\dlwin36\lib\site-packages\theano\configparser.py”, line 117, in res
return f(*args, **kwargs)
File “E:\anaconda3-4.4.0\envs\dlwin36\lib\site-packages\theano\sandbox\rng_mrg.py”, line 1256, in get_substream_rstates
multMatVect(rval[0], A1p72, M1, A2p72, M2)
File “E:\anaconda3-4.4.0\envs\dlwin36\lib\site-packages\theano\sandbox\rng_mrg.py”, line 66, in multMatVect
[A_sym, s_sym, m_sym, A2_sym, s2_sym, m2_sym], o, profile=False)
File “E:\anaconda3-4.4.0\envs\dlwin36\lib\site-packages\theano\compile\function.py”, line 326, in function
output_keys=output_keys)
File “E:\anaconda3-4.4.0\envs\dlwin36\lib\site-packages\theano\compile\pfunc.py”, line 486, in pfunc
output_keys=output_keys)
File “E:\anaconda3-4.4.0\envs\dlwin36\lib\site-packages\theano\compile\function_module.py”, line 1795, in orig_function
defaults)
File “E:\anaconda3-4.4.0\envs\dlwin36\lib\site-packages\theano\compile\function_module.py”, line 1661, in create
input_storage=input_storage_lists, storage_map=storage_map)
File “E:\anaconda3-4.4.0\envs\dlwin36\lib\site-packages\theano\gof\link.py”, line 699, in make_thunk
storage_map=storage_map)[:3]
File “E:\anaconda3-4.4.0\envs\dlwin36\lib\site-packages\theano\gof\vm.py”, line 1098, in make_all
self.updated_vars,
File “E:\anaconda3-4.4.0\envs\dlwin36\lib\site-packages\theano\gof\vm.py”, line 952, in make_vm
vm = CVM(
NameError: name ‘CVM’ is not defined
Thanks. Great tutorial. I have a question of LSTM.
The feature number of each sample is different, and I want to use these samples to train for a regression. Can this problem be solved by LSTM?
This is great tutorial, it’s been really informative!
Forgive my ignorance as I’m relatively new to RNNs, but I’ve recently been using a similar set-up for time-series regression modelling. Similarly, the results were remarkably accurate. However, one thing struck me as odd: the predicted values (model.predict(X_test)) appeared merely offset from the test set (Y_test) by one. I then noticed the same trends in the plots in this tutorial. That is, simply offsetting the predicted values by one will get the traces almost perfectly aligned. I retrained models setting the target variable (y_train) two steps ahead instead of just one. This time the predicted values were offset by 2, I repeated for 3 and so on. Eventually you look ahead far enough that model no longer works. It feels like the neural net is just learning to return the last entry in each input vector. Such an explanation would fit the observed trend. But, like I said, I’m fairly new to this. What is it that I’m missing?
“We are going to keep things simple and work with the data as-is.
Normally, it is a good idea to investigate various data preparation techniques to rescale the data and to make it stationary.”
“We can see that the model did an excellent job of fitting both the training and the test datasets.”
These parts made me puzzled. How can one expect to get a good model using raw non-stationary data, and, even worse, say the model has got a good quality. It is great foolishness. Too dummy for a Dr. I would say.
All of your “wonderful” forecasts replicate previous data with minor variations, thus making the model almost completely useless. The values of the forecasts are just shifted values of the previous time-series points.
I loved your tutorial. As always, they are extremely insightful and refreshingly easy to understand.
I have a question for you: I’m currently involved in a nonlinear optimization project and I’m looking into LSTMs (specifically their applications in reinforcement learning). In theory, would an LSTM perform well with stochastic input? For example, what if I wanted to train a model for a smart thermostat that uses the weather forecast (along with real-time state variables such as current room temperature) to predict when to start heating or cooling a building? Or does this go against what an LSTM is fundamentally designed to do?
Thank you Jason. This is very helpful.
Just curious though, even though the out of sample test data set seems to fit well when you plot it, isn’t the case that there might be some overfitting going on since the MSE error of the test set is more than double what the error is for the training MSE error? Is there a statistical threshold test to allow one to identify if overfitting is occurring?
This is really insightful, thank you. I was wondering how I would achieve the same but with categorical data predictions. Steps such as the differenced series will not work the same. I have considered one hot encoding my data set but still do not understand how statistical analysis will be possible on these.
I notice you have used batch size of 32 (or 64) many times for training.
Any reason for that? Is that another hyperparameter that we might have to play around with?
I’ve seen 128 being used quite a lot more.
hello jason,
for a scenario of real-time forecasting where our input will be updated regularly, in such cases what should be done about input data shape or length?
for example, we want to use 25 data points as a training data to predict the next 5 data points. we want our training data points should be always 25 but updated. how the new data will replace the old data in the training dataset to provide the updated dataset which should have a length of 25 data points.
do you have any blog or example of such issues?
any guideline along with code would be really helpful for me?
I have a question, in the stateful LSTM (with Memory Between Batches), the batch_size should be always 1? or could be other value, for example, the gcd of train size and test size?
Hi Jason,
Thanks for sharing this wonderful tutorial. However the more advanced approached you propose, the worse result you get. How can you explain it? Or simply because data is not applicable for this case? I expect to see the better result but feel a bit upset lol
Hi Jason,
Thanks for your great post! If my features include both sequence (t-n) values, and current (t) values (such as whether there is a promotion today) as input, how can I build the LSTM model? Thx!
Thanks Jason. I checked that post. It seems talking about how to reshape multiple sequence features. But my question include non-sequence features.
For example: to predict the sales at time t, we need t-n sales and also whether the product is on promotion at time t. How can we model the promotion effect? thx!
I am a self-learner who has spent the last week breaking down different code to learn machine learning and I must say that your walk-through is very well put together. I was wondering how do I maintain the date and/or time information in the output of the graph? I am using the first column as an index for the second columns. The plot shows the temperatures on the y-axis without issue however the x-axis seems to just be a count rather than dates.
Good question, you can use use the count of time steps and the time stamps from the origional dataset. With this you can tie predictions back to time stamps, but its a bit of custom code for sure.
I tried to predict these data with more classical Machine Learning methods (such as Bayesian Linear Regression or Decision Trees).
I tried with both non-stationary data and stationary (made by log + differencing).
For methods like Decision Trees, the results were better with stationary data but for Bayesian Linear Regression they were far better with non-stationary data.
Do you have any explanation ?
Problems vary. It is always a good idea to test a suite of methods and method configurations. Picking methods analytically will not give good results unless your problem is trivial.
As your tutorial, for the input_data we prepared, the rows are how many observations, columns are look_back data (t-1, t-2, t-3…).
My training dataset includes 1M different store-item pairs, for each of the pair, there are 3 year time series sales data. I need to forecast sales for certain store-item pair. How can I prepare the input_data? I am thinking rows are 1M pairs, columns are look-back (t-1,t-2,t-3…), but can I differentiate certain store-item pairs, so that given a certain pair, I can make better forecast? Do I need an embedding layer?
Also, I can I define the look-back length? Does it make sense use 3 year as the look-back?
Thx for your reply! I tried per-store and per-item, there are only 4000 values. My prediction looks bad, and I think it is probably because the data is too small for the LSTM model.
Then I tried to add embedding layers, but I am not sure when it goes to model.fit(x_train, y_train), what is the shape of the dataset should be. Do you have any tutorial about how to add the embedding layers? or hints about other ways to achieve this? thx!
Hello sir,
I want to implement LSTM network for classification. I have 41 features and 5 class. I don’t know how to use look-back for classification. I have read 1 paper ” Kim, Jihyun, and Howon Kim. “An Effective Intrusion Detection Classifier Using Long Short-Term Memory with Gradient Descent Optimization.” Platform Technology and Service (PlatCon), 2017 International Conference on. IEEE, 2017.” They have not mentioned look back. I have to implement the paper as assignment. please help me.
thanks for this awesome tutorial and did implement it and it works fine, however I tried to implement it in another data set which contains 5 features not just one. So I got this error
(Traceback (most recent call last): File “E:/Tutorial/pan.py”, line 68, in trainPredict = scaler.inverse_transform(trainPredict) File “C:\Users\sydgo\Anaconda3\lib\site-packages\sklearn\preprocessing\data.py”, line 385, in inverse_transform X -= self.min_ ValueError: non-broadcastable output operand with shape (45498,1) doesn’t match the broadcast shape (45498,5))
So I don’t know what to do.
My data have weekly seasonality. Then what do you suggest as good look_back? Having look_back as 7 obviously gives good result compared to other look_back(3,4,5) because of weekly seasonality. Is it good to use 7? Using linear regression with 7 day lag variable gave me very good result. I don’t see the need of going to LSTM to achieve good result. So what would you do in this scenario.Thanks!
Hi Jason,
I am working on a prediction model that learns with each data point. Could you give any suggestions how this could be modified to suit the purpose. Also rather than retraining the complete LSTM model is it possible to just refit the LSTM network according to the new data point as well.
What is the reason for the position change between the trainX.shape[1] with 1 in the first row? and what is the reason for the position change between the look_back and 1, in the second row?
Thanks, but unless I missed something, this puts additional timestep as features, not as 3d timesteps ? I am to have something like:
initial shape [1000,1,X] (with X = features count) to [1000,10,X]
My understanding is that unless the network is stateful, its state will be reset between each call of predict function.
Now let’s imagine that I am training with data that are averaged every 5 minutes or more, but I want to predict in the future every minute or even real tiime. If I use my model to predict, it might give false results because of difference in the rate of samples I believe. In this case, should I proceed like:
-Use Stateless LSTM Networks.
-Aggregate current samples until I have a time span of 5 minutes, and periodically reset the network state after inserting aggregated samples in the predict sequence ?
Even the walk forward cross validation is questionable in the case of LSTM. In my understanding, LSTM might outperform the other architectures, in case of long sequences. By using a sliding window approach, we are diving one long sequence into several independent sequences.
In my understanding, LSTMs do not require a fixed size input. They are capable of “remembering” their past and can choose the correct size window on their own. It’s different from FeedForward NNs, mainly because there is no memorization capability.
the dataset contain two columns why the date column not appeared in the first figure and why don’t use it . i want to include it in the forecasting process any suggestion thanks in advance
Hi Jason, could you clarify something for me ?
Why do you use test set to get predictions ? If you predicting something,you do not know what will be in future…
Sorry for neewbe questions, i want to learn something new.
Hi Jason, could you comment on the following problem:
let’s say we have time series data for t=5 time steps, 2 features (x1,x2). and we want to predict till t=10, first we would predict for t=6, using the LSTM trained on t=1-5. Then for t=7 using all previous timesteps t=1-6. and so on finally for t=10 using the original data from t=1-5 and the four new predictions for t=1-9.
Hi Jason,
It failed when I have done training for batch_size=32. I have make the dataset (training and testing) multiple of 32. Even then its failing. Any comment what I am doing wrong.
in the first result we obtain a test score = 47.53 but you have said that the average of error is about 52 thousands passengers, was this an error or i’ve missed something?
I tried the code. But there the actual vs predicted line is not continuous, it is breaking at a couple of points. I guess it is because, all 96 points from training set and all 48 points from Test set have not been included.
While using the reshape function, the train length becomes 94 and the test length becomes 46.
I tried correcting the create dataset function, but an error message is coming up:
IndexError: index 96 is out of bounds for axis 0 with size 96
So,
I am a bit confused. Why are the prediction on the test data set fed with the ground thruth instead of with the subsequent predictions themselves. Isn’t it cheating?
The model is essentially outputting random values with not-so-big standard deviation compared to the previous (ground thruth data). This is why they look nice and they do not drift too much apart.
This is not a useful tool for forecasting in a reliable way.
The idea is to encode the input with one-hot encoding CNN with max-pooling to character embedding then pass the same input through biLSTM to process each character embedding to word vector by concatenating the last time step in each direction.
I implement the above as follow:
from keras.models import Sequential
from keras.layers import Dense
from keras.layers import TimeDistributed
from keras.layers import LSTM
from numpy import array
First of all, thank you for your great tutorials! They helped in reducing the steep learning curve of the machine learning libraries. Especially useful when one is working on applied machine learning research.
In the example here, and all others, the scaler is applied on the entire dataset. Shouldn’t it be applied only on the training data after the split? Test data is something which is seen by the model after training is over and used for forecasts. So including the future values in the scaler that involves max and min would bias it.
How can I obtain a ‘mean absolute percentage error’ instead of ‘mean squared error’?
I imported MAPE using
from keras.metrics import mean_absolute_percentage_error
as there was an ImportError while importing with sklearn.
Later modified to get this
model.compile(loss=’mean_absolute_percentage_error’, optimizer=’adam’)
Finally modified to get this
trainScore = math.sqrt(mean_absolute_percentage_error(trainY[0], trainPredict[:,0]))
testScore = math.sqrt(mean_absolute_percentage_error(testY[0], testPredict[:,0]))
The model completes all the epochs and then reports a Traceback:
trainScore = math.sqrt(mean_absolute_percentage_error(trainY[0], trainPredict[:,0]))
TypeError: a float is required
~/anaconda3/lib/python3.6/site-packages/sklearn/preprocessing/data.py in inverse_transform(self, X)
383 X = check_array(X, copy=self.copy, dtype=FLOAT_DTYPES)
384
–> 385 X -= self.min_
386 X /= self.scale_
387 return X
ValueError: non-broadcastable output operand with shape (157,1) doesn’t match the broadcast shape (157,4)
I have multiple feature time series data but timestep in not constant. How to model such data in LSTM architecture.
SegmentNo / Speed(kmh) / Distance(km) / Time(minutes) / TransportMode
1 70 30 28 Car
2 3 1 15 Walk
3 40 10 20 Bus
in the single trip of a user, he first travels 28 minutes by car, then he walks for 15 minutes and then travels 20 minutes by bus. I am interested to know next transportation mode in a sequence that user will take. can I also predict the set of other features (speed, distance, time).
I though to consider a trip as a batch, but the timestep is variable, 28 minutes then 15 min and then 20 minutes.
Is is possible to use RNN on LSTM neural networks for the following problem:
I have sequence of scalar measurements x(t_0),x(t_1),,,x(t_n) and I should be able to predict physical quantity y(t_n) at any moment t_n, n=[0,N]?
What is different from normal time series prediction (with fixed number of last measurements), is that I have to absolutely use measurement information from the very beginning moment t_0 until t_n. Don’t ask why, but the beginning measurements (and later, too) really affect the outcome. So this is not a stochastic process like stock market or something, but a physical system.
In other words, the neural network should “iterate” through measurements and maybe use a fixed number of latest measurements x(t_n),x(t_n-1),,,x(t_m), but it should memorize what has happened before the current measurement inouts and tune its prediction accordingly.
Is it possible at all? Hopefully you understand the problem and I’d still emphasize that the whole series affect the output and must be taken into account somehow, but the latest measurements have gladly the greatest impact.
I have multivariate time series sequential data and i want to detect the outlier. Will RNN+LSTM help in this case?
I have data related to Combined Sewer Overflow (CSO) network, which captures say flow1, flow2, flow3 every 15 min and isCSOSpilled which can happen any time as:
Hi Jason. Thank you for your great post! I noticed a subtle issue in the graph of predicted line and expected line (red and blue). The shape of two lines matched nicely, however, it seems that the predicted value is always one step behind the expected value. E.g. the true value sequence is […, 1, 2, 3, 4, 3, 2, …], then the predicted sequence looks like […, _, 1.1, 2.1, 3.1, 4.1, 3.1, …].
I’m actually facing the same issue in my own project. To my understanding, this 1-step drift makes the prediction totally worthless. I really look forward to your reply!
Thanks for the post. Do you perhaps have a reference code for how to force the LSTM to predict monotonic sequences? What is the general approach for this?
Hi jasson, i am writing you because i would like to know, if you could teach me how to include a dummies to fit interventions in a timeseries. For instance, supose there was some situation which made the airline sold more tickets in a specific day, this is an outlier in the series, i.e., this is not a seasonality issue how i could include it to improve fitting to the data?
Hi. I am really appreciate your posting. Thank you!
um.. Maybe It’s dumb question… I don’t understand your reply…
As Sarvesh Kumar, I also struggle to find out what the testX is.
In your (maybe all of) posting, to forecast “t+1 ~ t+n” values, you divided train/test and then, you used “test data set” to prediction.
Test data set is from original data set. So.. we already know values.
But what we really want to do is to make “unseen data set” which will be used on model.
(In this case, to make 2019_JAN Y , we made model by data X,Y from 2018_JAN to 2018_DEC, but we don’t know the 2019_JAN X, where is X..?)
You said…
“The input to the model depends on how you have defined the input to your model.
If your model expects one year of data to predict one month, then you must provide one year of prior data.”
Is it meant that testX size must be one-year data? I don’t even know what the test X is. Is it possible to make prediction without knowing future value?
If you have any example code (or posting) Please Let me know!
Hi Jason,
This demo is very helpful!
A couple of things,
1)Could you give more of a thorough explanation on how this model is working and why we shaped the training data set the way we did? with the t, t+1…. why is it only taking 1 previous look back to predict the next? Not clear…
2) My data behaves differently according to the day of the week, could you show me how I would make day of the week another input variable?(code-wise)
or even if this approach isnt taking date into consideration, how can i make atleast predict the value at the next time step or the next few time steps ?
Hey Jason,
I used your exact example to train/test the model, (in my case my input values represent “page views” instead of passengers). how can i predict what the page views will be tomorrow? or over the next 7 days? the link you showed says use yhat = model.predict(X) …. what would my X be exactly? Can you give me a code snippet for how i would do this please?
I understand when the model was predicting the values for the test set, you fed it the values that you already have for it. but what would i feed the input (X) if I want to predict tomorrow(or next few days) which i don’t have a value for?
This is the piece that is really confusing to me. thank you for your help
thank you for this great work!
I have a question about the model predict. In ” testPredict = model.predict(testX)”, I want to know if the model makes prediction of the next value based on his own last prediction or it uses the true value of testX. Could you explain more please how the model makes prediction on the test set. thank you
Hello,
I am confused. Why the results are slightly better than previous example, although the structure of the input data makes a lot more sense ( in the part of LSTM for Regression with Time Steps) ?
i run this code but i get the following errors,
i am workin on time series problem and the size of the dataset is 38
from keras.models import Sequential
from keras.layers import Dense
from keras.layers import LSTM
from keras.wrappers.scikit_learn import KerasClassifier
from sklearn.model_selection import GridSearchCV
import numpy
import pandas as pd
# Function to create model, required for KerasClassifier
def create_model():
# create model
model = Sequential()
model.add(LSTM(2, input_dim=1, activation=’sigmoid’))
model.add(Dense(1))
# Compile model
model.compile(loss=’mean_squared_error’, optimizer=’adam’, metrics=[‘accuracy’])
return model
# fix random seed for reproducibility
seed = 7
numpy.random.seed(seed)
# load pima indians dataset
dataframe = pd.read_csv(‘C:/Users/ASUS-PC/Desktop/pfe/2017budauth7.csv’, usecols=[1], engine=’python’, skipfooter=3)
dataset = dataframe.values
dataset = dataset.astype(‘float32’)
# split into input (X) and output (Y) variables
X = dataset[:,0:1]
Y = dataset[:,1]
model = KerasClassifier(build_fn=create_model, verbose=0)
# define the grid search parameters
batch_size = [10, 20, 40, 60, 80, 100]
epochs = [10, 50, 100]
param_grid = dict(batch_size=batch_size, epochs=epochs)
grid = GridSearchCV(estimator=model, param_grid=param_grid, n_jobs=-1)
grid_result = grid.fit(X, Y)
# summarize results
print(“Best: %f using %s” % (grid_result.best_score_, grid_result.best_params_))
means = grid_result.cv_results_[‘mean_test_score’]
stds = grid_result.cv_results_[‘std_test_score’]
params = grid_result.cv_results_[‘params’]
for mean, stdev, param in zip(means, stds, params):
print(“%f (%f) with: %r” % (mean, stdev, param))
this is the error : ndex 1 is out of bounds for axis 1 with size 1
Hi jason, I have question regarding my regression problem.: I used this simple lstm model to predict:
model = Sequential()
model.add(LSTM(100, return_sequences=True, input_shape=(n_timesteps_in, n_features)))
model.add(LSTM(25, return_sequences=True))
model.add(LSTM(100, return_sequences=True))
model.add(Dense(n_features, activation=’tanh’))
the model was trained with a data shaped into windows. the problem is when I give model.predict another timseries data which the model did not saw before it can still predict it almost good enough to use. I think there must be something wrong e.g. seeing a cosinus wave in training and predicting stock exchanges are both different things but still predicition is good. What do I have to change ? does it have to do with stateful of the model or use a sequence to sequence prediction as you also described here https://machinelearningmastery.com/define-encoder-decoder-sequence-sequence-model-neural-machine-translation-keras/#comment-438058
Thank you for your respond. I already tried different variants for my network but I just can not follow back why my model.predict(test)=test even test has nothing to do with train data. the network training is fine loss is very small and model.predict(test) with test in correlation with train is working perfectly, but I am trying to see a mistake in the prediction so that the model is not following the ‘stock exchange’ back and making a sinus.
I used the same code above I posted and do not want u debug all of my mistakes. It is strange because when I use other random data for the model to train, like training with sinus and than predicting stock exchange, the prediction is not working and I am achieving my goal. What can the problem be ?
As you could see, I’ve modified the code in order to read the last 400,000 rows with data directly from mysql, and then start making predictions based on the last record.
The problem I’ve found, is that predictions are much better when the model is trained with “lookback” variable around 150, however, if I change lookback = 150, it comes up with the following error:
ValueError: Error when checking : expected lstm_1_input to have shape (1, 150) but got array with shape (1, 1)
I understand that the shape of the array isn’t the same, as I printed them both, so I tried to provide the model with the last 150 records from mysql in order to make the predictions based on the last 150 records as well.
As following:
archivo_xnew = read_sql_query(“SELECT value FROM crawler ORDER BY round DESC LIMIT 0,150”, conn)
But I’m still getting the shape error, and I’m not being able so far -after 2 days trying- to make the array look the same way in order to make predictions. Could you please help me, or point me in the right direction?
Thanks a lot!
Pd: Aside from that, with the lookback set in 1, it all works nicely, but performance isn’t the same at all.
Pd2: in case there’s something else I could improve or any advice/recommendation, is really really appreciated!
Dear Jason, how are you? seems like the first time I tried to post this comment it didn’t work.
Thanks a lot for all the information that you provided in this blog, I didn’t know anything at all about machine learning, and within 3 weeks, with a background in PHP and just a little bit of Python, I was able to get a clear idea on how it works and make my first neuronal network!
I have used the examples you shown here and modified them in order to connect to a MySQL database and work with the last 400,000 values from it. By doing:
read_sql_query(“SELECT value FROM ( SELECT * FROM crawler ORDER BY round DESC LIMIT 400000) sub ORDER BY round ASC”, conn)
Once the model is trained it start making predictions, based on the last value which is taken from the database, trying to guess the next value.
like this:
read_sql_query(“SELECT value FROM crawler ORDER BY round DESC LIMIT 0, 1”, conn)
As you could see on the example, I’m using lookback = 1 in order to train the model and make the predictions, however, it performs so much using lookback = 50.
The problem is that if I train the model using lookback = 50, I get the following error when I try to make the prediction:
ValueError: Error when checking : expected lstm_1_input to have shape (1, 50) but got array with shape (1, 1)
I understand that this is a shape problem, as I trained the model using the last 50 records to predict and then I tried to make it predict using only one, so I changed the last query from:
read_sql_query(“SELECT value FROM crawler ORDER BY round DESC LIMIT 0,1”, conn)
to
read_sql_query(“SELECT value FROM crawler ORDER BY round DESC LIMIT 0,50”, conn)
but still getting the array formatted in a different way…
So I have been trying to make the array to look the same way for the last 3 days! I think it’s actually the function that creates the matrix changing the shape of the array? but probably my python isn’t really helping me here!
I used the same value for the lookup and for the limit in the mysql query, then i used numpy.dstack(informacion_xnew) to fix the array dimensions before making predictions!
Hi, I am new to python and RNN. lets say i want to create a model that forecast time series data=[x1 x2 x3 y]. where x1-x3 are the features and y is the target. How do i implement it with this script, so that the code will know my features and target?
Hi Jason,
Thank you for this excellent tutorial. Could you please help me in the below question I asked in stackoverflow. I couldnt figure out how to test LSTM model built on new set of values.
Thank you for your response. So here is my question. I have a total data points of about 1446 which is my training set which has 13 variables excluding date. So I have trained the LSTM model with the time step of 7 and got low loss also. Now I wanted to test the model on new values which doesnt have ground truth value. Given the date, the model should predict all 13 variables for 349 records. I couldnt able to proceed further on this, since the dataset is scaled and used for training and in testing, values are null as we know. Hence I couldnt proceed further on this. Let me know if you need further more details.
Hi Jason,
The link is for the ground truth we already know right ? We have a proper format of data. I have just the code like below, but I am getting some prediction errors.
Test = Stock_AREIT[len(Stock_AREIT)-60:]
Test=Test[‘1. open’]
inputs=Test.values
inputs = inputs.reshape(-1,1)
# Scale inputs but not actual test values
inputs = sc.transform(inputs)
for test in range(0,449):
inputs=np.append(inputs,predicted_stock_price)
inputs=inputs.reshape(-1,1)
print(inputs.shape)
X_test=[]
for i in range(60, 61):
X_test.append(inputs[test:i+test,0])
# make list to array
X_test = np.array(X_test)
X_test = np.reshape(X_test,(X_test.shape[0], X_test.shape[1],1))
predicted_stock_price = regressor.predict(X_test)
inputs=np.delete(inputs,len(inputs)-1,axis=0)
inputs=np.append(inputs,predicted_stock_price)
inputs=inputs.reshape(-1,1)
print(“currently running {}”.format(test))
Could you please advice me where I am going wrong. I can sense that, LSTM uses the ground truth prediction to predict the next value. That is the result I have appended the result everytime.
I think I figured out. The actual graph (figure 1) actually uses the proper ground truth which makes it more accurate in prediction. Whereas my result actually using predicted values in its time step. I think my understanding is correct. But let me know your inputs as well
Thanks for the article. I’m looking at this line of code:
model.add(LSTM(4, input_shape=(1, look_back)))
The Keras documentation says input_shape=(timesteps, data_dim)
In your example, isn’t the look_back equal to the timesteps, and 1 is the data_dim (you have a single value)? So that would mean they are reversed from what you’ve got.
Thanks for providing this blog. I am new to this stuff, and I found your side very useful.
I am trying to predict a flow rate for a sensor. I used LSTM to predict the next value based on the past 10 readings. I got very similar training and testing rmse scores, training: 18.07505 and testing: 18.01321. However, the predictions are not too great: https://photos.app.goo.gl/Ym3KJy5FDyVoYcUv9
(blue: original, orange: testing, green: validation)
I would like to use this model to detect faults (anomalies). I am not doing too great, any help how I could improve my prediction? I used MinMaxScaler for scaling. Do you think smoothing the signal prior to training might help?
This is a wonderful tutorial , I learnt a lot here ,
I running the same code with a different univariate dataset , i am getting an error,
at this line:
model.add(LSTM(neurons, batch_input_shape=(batch_size, X.shape[1], X.shape[2]), stateful=True))
it says:
TypeError: while_loop() got an unexpected keyword argument ‘maximum_iterations’
hey i am workin on a dataset and i want to predict budget for 7 periods that are not presents on my dataset. i want to predict 7 next period how could i modelise this on code ? could you please help me it’s for a school project i need an immediate answer. could you please help me?
As far as I can understand from the code we are using 1 day look back to predict tomorrows price. Can we use used the price of last 100 days to predict say 20 days into the future?
I have made the relevant updates. It seems to be working. Now I want to make a NEW prediction 20 days from today based on the current model. How do I do that?
Hi, Jason Brownlee. Thank you for your awesome posting 🙂
I’m writing to leave my opinion.
I noticed that the dataset imported is normalized first and then split into trainX, testX.
But the order is wrong in my knowledge. the “testX” is now already affected by trainX in the “normalizing step”
Because testX is normalized even considering trainX dataset range too by normalizing the whole dataset. (testX is not independent of trainX anymore. Can’t be used to “test”.)
Please, leave me a comment 🙂 I’m not an expert. So, I hope to hear your opinion on this.
Hello Jason,
This is a great article . Here I’m also using neural network to predict the values with time period (t+1). But I’m getting error while I’m using time period as X. Error is showing that could not convert string to float (time) . But I want to predict my values with that time. Can you give me suggestions to solve this problem? Here I posted my dataset for your reference.
Time g p c y
0:06:15 141 NaN NaN 141
0:08:00 NaN 10 NaN 117
0:09:00 NaN 15 NaN 103
0:09:25 95 NaN NaN 95
0:09:30 NaN NaN 50 93
0:11:00 149 NaN NaN 149
Hope you well recently, I have a question which is when I am dealing with the time series traffic data set, should the features of time series (like 2017-11-10 02:00:00) be trained by Lstm model with other features?
Actually, I want to use lstm to analyze the data of traffic flow, and the time series is like 2017-11-10 02:00:00, which has hours, since the traffic flow on different hours and different weekday is not same, I am wondering whether the time step is 24 (24 hours a day), and whether I should input the information of month and weekday into lstm together with the information of traffic flow.
It’s quite comprehensive tutorial. My question is time is not being used in this time series analysis if I’mm not wrong. How shall predict values of future time steps?Because you’ve predicted using the test data which is part of original data set. Please help
Thanks for your reply. My point is in Time series analysis to forecast future event we’ll have only time. In your tutorial you have built the model & evaluated with the entire data itself by splitting into train & test, but to use the this model for forecasting future event we’ll have only time not data like testX that you have used.What shall I do in that scenario?
Please help.
A time series forecasting model is still a machine learning model with inputs and outputs. Define the model such that you have inputs required to predict the output you require.
Currently we have a model that has a loss curve https://photos.app.goo.gl/9PNTiTkavTmeFoBT7
Is this considered a good model? Hope my adjustments to the parameters are right.
Due to the “strong” continuity of the data source signal how does the LSTM model compare to an overly simple baseline model that just repeats the last value in the predict method’s input argument?
An LSTM works a lot better if a CNN or other better/learned representation of the time series is used on the front-end, e.g. a CNN-LSTM or ConvLSTM. Often a CNN alone will out-perform an LSTM or LSTM hybrids.
Also for univariate time series, classical methods like SARIMA and ETS dominate.
When I look into your preparation of data, it seems you left one piece of data, which is the last line of dataset in training set and testing set 🙂
Is it supposed to be:
for i in range(len(dataset)-look_back)
instead of:
for i in range(len(dataset)-look_back-1)
# convert an array of values into a dataset matrix
def create_dataset(dataset, look_back=1):
dataX, dataY = [], []
for i in range(len(dataset)-look_back):
a = dataset[i:(i+look_back), 0]
dataX.append(a)
dataY.append(dataset[i + look_back, 0])
return numpy.array(dataX), numpy.array(dataY)
What a waste! Those two lines data in training set and testing set are not participating in neither training or testing!
Or is there any deliberate reason to do it?
I change your code slightly, which takes the last piece of data samples in training set and testing set into consideration, as follows:
def create_dataset(dataset, look_back):
dataX, dataY = [], []
for i in range(len(dataset) – look_back):
a = dataset[i:(i + look_back), 0]
dataX.append(a)
dataY.append(dataset[i + look_back, 0])
return numpy.array(dataX), numpy.array(dataY)
Correspondingly, the shift test predictions for plotting needs a little change as well:
testPredictPlot[len(trainPredict) + (look_back * 2) – 1:len(dataset) – 1, :] = testPredict
Hi Dr.Jonson
I have a confusion between block and neurons in LSTM structure
I am very clear the nodes (or units) in each layer in ANN. In LSTM, let me know my explaintation is right or wrong:
Every time xt is fed to hidden layer that contains many nodes (or units). Each node is 4 neurons (not a single neuron like ANN): in, out, forget, cell. All nodes are contained in a block, and those are copied to many blocks through time. That means the number of blocks depend on timestep size and it is generated through input sequence.
In Keras, you have
model.add(LSTM(4, input_shape=(look_back, 1)))
4 is the number of nodes in a block as I know, or the number of blocks (or neurons) as you mention above
Help me clear this confusion. Thank you a lot
this model has 1 input node for input layer, 4 lstm nodes for hidden layer and one output node for output layer. isnt it? correct me if im wrong, im in confusion too. Anyway thanks for the tutorial!
after having built and evaluated the model, how can one visualize the value of t + 1, where this value is the first value predicted after the last value of the database (considered t)
I have been trying to use keras on R, and I have a problem that I see here on your post too: Your prediction looks like a shifted version of the initial data on all your graphs.
Which is a quite bad prediction, a kind of last observation carried forward prediction (it will stay almost the same in the future).
Why do you say it is a good prediction ? What I am not understanding ?
Hello
How can we save our LSTM model and make prediction from the data test .
I think it should be the same:
# new instances where we do not know the answer
Xnew, _ = make_blobs(n_samples=3, centers=2, n_features=2, random_state=1)
Xnew = scalar.transform(Xnew)
# make a prediction
ynew = model.predict_proba(Xnew)
Can you help me find the right instructions, compatible with the code :
Can you please tell me how to train all the data, instead of creating a train and a test set. I want to consider the whole of my data set as a train set and then predict the values for next 30 or 40 values.
Dear Dr. Brownlee,
I want to ask that is it better to use a lagged version of your dataset and train LSTM or (use some padding in case the time series is not divisible by the batch size ) use a batch size for training LSTM?
I used your blog to save and then predict future values on the time series.
The problem is that, my series is uni-variate, i.e. just the temperature and I have been using fpp library in R to predict future intervals, where i just had to specify a parameter h= 30 , for example the model would compute future 30 values.
I used your info from the blog and prepared the following script
from keras.models import load_model
train = dataset[0:train_size, :]
t = 30
# load model from single file
model2 = load_model(‘lstm_model.h5’)
# make predictions
yhat = model2.predict(t, verbose=0)
print(yhat)
But I am getting a ndim error.
Can you please help me out on how to predict future values.
is calling the predict function on input X, which just computes the next value.
How to use the model and then compute the value for next 30 intervals, i.e. the model should treat prediction 1 as an input for prediction 2, prediction 2 as an input for prediction 3.
Please help me, I am unable to get a solution and ain’t clear about the approach.
If you can give me the code snippet for this kind of prediction, that would be great.
Hi Jason,
Thanks for the great article!
In your program, the input X is a one-dimensional vector, which is denoteded as 1*8. And in the model, input_shape=(train_X.shape[1], train_X.shape[2]), here the train_X.shape[2] represents 8 input characteristics. But what should i do when the input X is a two-dimensional vector? For example, sometimes we may want to organise these 8 imput features in a matrix of 2 rows and 4 columns. I hope you can help me.
Thank you for your careful guidance.Best wishes!
ZhaoMing
Hi Jason, This is an excellent article. I am learning deep learning through coursera and your examples makes learning more easy. I have a question regarding this example. In this example, you perform one-step prediction: in each step, you use the current value to predict the next value, update the model using actual expected value and then predict the next value and so on… Now, how do i modify your code to perform prediction without using the actual test value? i.e. I should use the predicted value as an input to update the model and predict the next value and so on.
Hi Jason, I have a doubt about how you make the normalization. You run MinMaxScaler on the whole dataset first before dividing the data into train and test. This will introduce information leak to the test data since you are not supposed to know the min or max of the test data before hand. A correct way should be fit the scaler with train data only, and later do something like test = scaler.transform(test).
Anyway, this is a good tutorial
Hi Jason, I think this not good article even for beginners. I was beginner when I first read your this article and I believe mimic which is “prediction accuracy is good”.
There is LSTM Prediction is : Input: x[i], Output: x[i+1], Prediction: x[i]. There isn’t prediction. Example:
Input Output Prediction
1 2 1
2 3 2
3 4 3
…
n n+1 n
This article took my 3 months. I don’t recommend for beginners.
Hey Jason, I am a big fan of your works and very nicely written articles. Cant say how much your contents have helped me in solving my ML related problems. In this lecture, I am confused with one thing –
1. LSTM takes inputs as [samples, time-steps, features]. In first part, you took this trainX.shape[0], 1, trainX.shape[1]. Here I am completely with you. Samples and features are intuitively understood as number of rows and number of columns. And time-step is 1 if we will have timeseries data at regular fixed interval.
2. However in third part, you reversed it and used this as trainX.shape[0], trainX.shape[1], 1.
I totally did not understand this part. How come time-steps is now the number of columns and number of features is now 1? Can you please explain intuitively this part to me once again?
I’m working on eye tracking dataset. This is a time series data such that coordinates of the screen a viewer is looking at are being recorded per millisecond. I want to predict viewer engagement which is a label 0 (Not engaged), 1 (engaged).
My dataset consists of thousands of steps (eye tracking records) for 40 viewers and I intend to train this dataset with LSTM networks using a fully connected layer and sigmoid activation to predict my class.
I’m getting 75% test accuracy but everyone I meet insists that my number of samples are too small to use deep learning. They advice I use other machine learning methods.
Sayed Mohammed Haider JafriFebruary 11, 2019 at 4:09 am#
Thanks jason for this tutorial, i am working on reactive motion planning of mobile robot in dynamic environment, by observing the some steps of moving obstacle, i have to predict it next steps, suppose the obstacle is moving from A to B and their can be 50 trajectory, obstacles will follow one trajectory, i want to train the LSTM with trajectories of obstacle. According to your tutorial, i can train the one LSTM with only one trajectory. But read the research paper (https://ieeexplore.ieee.org/document/6566154), researcher train the single LSTM with more than one trajectory , please guide on this topic, it will be really helpful for my further research.
Thanks
I really appreciate your work. I am trying to apply what I have learnt with your tutoriols on my machine learning problem.
I have drying rate data of 10 experiments that is how drying rate is changing over time. In each experiment I have known values of 6 other features such as Temp, pressure, velocity etc. The values of these features are fixed throughout the experiment, however, each experiment has different values of these features. I have combined all the experiments together in one file, like, the first column which represnets the time in the data has value form 1 to 120mins then again 1 to 120 mins (in this way 10 times) .
Should I be using multivariate time series forcasting in this case or should I take time as just one feature like temp, pressure? and is LSTM the suitable approach for such kind of problem?
Hi Jason. I have a question about the way model works.
I am confused between two methods. Which is correct?
1) The model uses no information of future (no actual value) and just use its own predictions for the next prediction of one prediction.
2) The model predicts a point for the next step and calculate the error, but forget about the prediction and uses the realization of that point (the actual value) for steps after that.
I thought the first way is right. For example, when I input data of 2001~2017, then I get predicted data of 2018.
I there any indicator, or an easy way to know if the time series is too random to predict?
How would you identify if the problem is the design, or unsolvable.
Another question,
How would you treat “spikes”
for example your output series looks like
0 0 0 0 0 0 1000 0 0 0 -1000 0
the optimizer will probably prefer to miss the 1000 prediction for the overall error reduction.
But it is the 1000 that you actually interested in predicting?
———————————————————————————————-
# returns a dictionary of n-grams frequency for any list
def ngrams_freq(listname, n):
counts = dict()
# make n-grams as string iteratively
grams = [‘ ‘.join(listname[i:i+n]) for i in range(len(listname)-n)]
for gram in grams:
if gram not in counts:
counts[gram] = 1
else:
counts[gram] += 1
return counts
# returns the values of features for any list
def feature_freq(listname,n):
counts = dict()
# make n-grams as string iteratively
grams = [‘ ‘.join(listname[i:i+n]) for i in range(len(listname)-n)]
for gram in grams:
counts[gram] = 0
for gram in grams:
if gram in features:
counts[gram] += 1
return counts
# values of n for finding n-grams
n_values = [3]
# Base address for attack data files
add = “ADFA-LD/ADFA-LD/Attack_Data_Master/”
# list of attacks
attack = [‘Adduser’,’Hydra_FTP’,’Hydra_SSH’,’Java_Meterpreter’,’Meterpreter’,’Web_Shell’]
# initializing dictionary for n-grams from all files
traindict = {}
print(” Training data from Normal”)
Normal_list = []
in_address = “ADFA-LD/ADFA-LD/Training_Data_Master/”
k = 1
read_files = glob.glob(in_address+”/*.txt”)
for f in read_files:
with open(f, “r”) as infile:
globals()[‘Normal%s_list_array’ % str(k)] = infile.read().split()
Normal_list.extend(globals()[‘Normal%s_list_array’ % str(k)])
k += 1
#print(Normal_list)
# number of lists for distinct files
Normal_list_size = k-1
# combined list of all files
listname = Normal_list
# finding n-grams and extracting top 30%
for n in n_values:
print(” Extracting top 30% “+str(n)+”-grams from Normal……………………”)
dictname = ngrams_freq(listname,n)
#print(dictname)
# Creating feature list
features = []
#features.append(‘Label’)
for k,v in dictname.items():
features.append(k)
print(“\n Features created by taking top 30% frequent n-grams for all types……….\n”)
#print (features) #this contains sequences only
# Writing training data to file, this file contains sequences of 3-grams
print(“\nWriting Training data in training file…………………………….\n”)
with open(‘train1.csv’,’w’) as csvfile:
# writing features as header
writer = csv.DictWriter(csvfile, fieldnames = features, extrasaction=’ignore’)
writer.writeheader();
———————————————————————————————-
So my file train1.csv will contains only the sequences, if I want to do a sequence prediction model using this dataset , how will I do? knowing that I tried the code above as it is, I get trainx and test-x with a shape equals to 0.
Any chance this method or any known method of LSTM can be applied to extracting geometric shapes or identifying features? It could be either in 2D(slices) or 3D.
Thanks Jason for the effort and awesomeness you put in this website.
In many cases of training an LSTM for regression problems , i ran into the following problem:
the prediction result is always one value, in many cases, the mean. have you ever encountered such a problem? I appreciate any ideas?
If I am using a trained LSTM to predict time-series data on the same input multiple times within a code, is it possible to get the same output every time?
If I use model.predict on an input 10 times (back-to-back), I get different answers every time. I am not sure if this is just the nature of LSTMs and how they run information through the state.
I did notice that the results were the same if I reset the state each time. Each time I predicted with the same input without resetting the state, it changes slightly, but gets more accurate each time. Thank you for your response!
Hi Jason,
I would have an overall question to the prediction of testX and trainX ( trainPredict = model.predict(trainX)). If I choose a batch-size different to 1 and want to print it with matplotlib it does just print one batch and not the whole series. I can’t really find a solution to that problem.
Thanks for answering.
Elisabeth
Thanks for your articles on time series forecasting using LSTM. I am currently reading this topic with regards to my job and have come across with another similar article in this link:
I would like to ask what is the rationale in inverting the differenced value? Also, I didn’t really get the part on inversed scaling on forecasted values. Any help explaining would be much appreciated. Thanks!
and i search about good value of RMSE, but some source told me according your dependent variable and the other told me it is < 0.3. is that right or not?
Hi Jason,
I read your article, its very helpful.
You have used one column and convert that one single column of data into two columns of dataset like:
def create_dataset(dataset, look_back=1):
dataX, dataY = [], []
for i in range(len(dataset)-look_back-1):
a = dataset[i:(i+look_back), 0]
dataX.append(a)
dataY.append(dataset[i + look_back, 0])
return numpy.array(dataX), numpy.array(dataY)
I have dataset containing two columns and i want to use both columns one as dataX (column 0) and the other as dataY(column 1),mean column 0 is an input and column 1 is output of my data. I want to predict output based on input.
How i edit your code for this problem?
Thanks
I want to ask again, as you mentioned before “We can see that the model has an average error of about 23 passengers (in thousands) on the training dataset, and about 52 passengers (in thousands) on the test dataset. Not that bad.”
why the RMSE value are high both train and test dataset ? i try to predict consumption energy from electronic device using LSTM too, but i got the RMSE value about 100. can i say my prediction have an average error about 100 watt in thousands too ?
would you like to explain me with your data ? i don’t get it. Thank you, FYI
I have 23141 sample of watts, with minimum value = 14 watt and the highest one is 1700 watt
I have a big database around 500 000 data.
My goal is to predict in the long term (IE about a thousand data)
I ran an LSTM on a GPU. The execution seems very long (days) and it gave me big errors (on train and test) besides the predicted values are inconsistent with the historical data and those desired. The same thing for a decoder encoder.
I tried, on the other hand, to forecast with backprpagation (MLP). This gave me an acceptable results in terms of errors and predictions.
Hi Jason, how should we give unseen data to this model, for example, we have data from 1949-01 to 1960-12, i want to predict for 1961-01. How should we do that. Please describe.
I have gone through this blog earlier but my question is how to prepare sequence of unseen data for 30 days. Kindly share an unseen data i.e; X values which should be pass to model for better understand.
This tutorial is so helpful to a newbie like me. Thank you. But I have a question: I still don’t understand what are the differences if we use “reshape(trainX, (trainX.shape[0], trainX.shape[1], 1))” and “reshape(trainX, (trainX.shape[0], 1, trainX.shape[1]))” to feed into our LSTM, please?
This tutorial is so helpful to me. I have a question. If the prediction is a multidimensional array, it should be done, such as 3X3 or more latitudes like the one below.thanks.
Hi Jason.
Thanks for this tutorial.
As a machine learning scientist, which RNN network is best for Time Series Prediction?
What’s your idea about using Elman network?
Thanks
I was reading about the LSTM architecture and found that there is something called a hidden state that is used in LSTM. How can we set the number of hidden states used by LSTM? Is it the same as the lookback in this tutorial? Thank you.
Hi jason, thanks for the article.
But iam working on a lstm timeseries prediction problem in which i want to predict my variable for the next 10 days.I have to do it in such a way that the prediction for the first day will be used for the prediction of the second day and so on for next ten days.(Almost like a loop which inputs the output of previous step as input of upcoming step)
Is there a built in feature in keras which can be used for this?
I am using LSTM for interpolatory time series prediction. I have time series data from 3 values of that parameter. I would like to predict for the parameter whose value is between these three values. How shall I include this parameter in my training data? Shall I include this as the feature? If I use this parameter as the feature, the values of the parameter will remain constant for that time series. Will this affect learning? Are there any other ways to include the parameter rather than as the feature?
Thank you.
thank you for your great article. I used the code and now I have a problem.
after normalizing using MinMax scaler. as I want to invert the prediction to real data. the output of inverse_transform have different range in values.
what should I do.
you can see the image of actual and prediction data: https://ibb.co/9WCLgDn
/home/ubuntu/applications/remoteDisk/softwares/anaconda3/lib/python3.6/site-packages/keras/engine/training.py in predict(self, x, batch_size, verbose, steps)
1155 ‘divided by the batch size. Found: ‘ +
1156 str(x[0].shape[0]) + ‘ samples. ‘
-> 1157 ‘Batch size: ‘ + str(batch_size) + ‘.’)
1158
1159 # Prepare inputs, delegate logic to predict_loop.
ValueError: In a stateful network, you should only pass inputs with a number of samples that can be divided by the batch size. Found: 2552 samples. Batch size: 32.
i did create a stateful lstm and iam getting this error.
below i have given my code for model fit where i have clearly mentioned my batch_size as 1 . Still why am i getting this error
model = Sequential()
batch_size=1
model.add(LSTM(15,batch_input_shape=(batch_size,14, n_features),activation=’tanh’, kernel_initializer=’lecun_uniform’, return_sequences=False, stateful=True))
model.add(Dense(1))
model.compile(loss=’mean_squared_error’, optimizer=’adam’)
reduce_lr=ReduceLROnPlateau(monitor=’loss’, factor=0.1, patience=10, verbose=0, mode=’auto’, min_delta=0.0001, cooldown=0, min_lr=0)
early_stop = EarlyStopping(monitor=’loss’, patience=2, verbose=1)
# fit model
for i in range(2):
model.fit(X, y,epochs=1, batch_size=1, verbose=1, shuffle=False, callbacks=[reduce_lr,early_stop])
model.reset_states()
Hi Jason,
would it make sense to you, to use LSTM RNNs to predict weather (wind speed) given “standard” Numerical Weather Prediction data and historical wind measurements of a location? The goal is to increase the accuracy of a NWP model for a specific location. Is this something that seems feasible based on your experience ?
thank you for what you have done , but i have a question about <>,about the function create_dataset, why dimensions reduced by 2 (len(dataset)-look_back-1) not just 1 ((len(dataset)-look_back)), is there anything import need pay attention to, or both right ?
Thank you for the tutorial. You have covered multivariate problem here, https://machinelearningmastery.com/multivariate-time-series-forecasting-lstms-keras/ . However, you have used reshape as (.shape[0], n_hours, n_features). In the example in this tutorial, you frame the problem as (.shape[0], .shape[1], 1). If we would take this approach and apply to the multivariate problem (similar to the one that is in the link above), is framing the problem as (.shape[0], n_hours, n_features) a correct approach?
Upon training the LSTM model exactly as in the example of airline-passengers dataset given above I have seen a considerable decrease n in loss. However, the accuracy metric does not increase and remains constant from epoch 1. Can you please explain why this is happening and if this is derogatory in any way?
Thankyou very much for these wonderful examples that you bring to those that are just getting started in this ML world.
I just have a question about this example (i’m sorry if im going over something you have already discussed). I wanted to make a very basic prediction with a price data set WITHOUt scalling the data, but my prediction is a straight line… Could you help me understand where the error could be?
Please, find attached below the code I’ve used.
Thank you very much in advance!!
Monica
import numpy as np
import math as m
import matplotlib.pyplot as plt
import pandas as pd
from keras.models import Sequential
from keras.layers import Dense
from keras.layers import LSTM
from sklearn.preprocessing import MinMaxScaler
from sklearn.metrics import mean_squared_error
# convert an array of values into a dataset matrix
def create_dataset(dataset, look_back):
dataX, dataY = [], []
for i in range(len(dataset) – look_back – 1):
a = dataset[i:(i + look_back), 0]
dataX.append(a)
dataY.append(dataset[i + look_back, 0])
return np.array(dataX), np.array(dataY)
I am using a LSTM model to make air pollution index prediction. I am taking a time step of 12 hours and predicting the 13th hour pollution level. Can you please tell me how a look ahead bias may arise in this time-series prediction and what are the remedies?
What I am doing is after prediction at a time ‘t’ in future I am appending that to the dataset so that I can use it for prediction of ‘t+1’ step. However, the prediction becomes stagnant after some time which is not what I want obviously. I am already using a prior sequence of 12 hours to predict the 13th hour and also tried with 24 and 48 time steps to include some more randomness in the sequences but it still seems to stagnate at some constant prediction. How can I resolve this issue any suggestions?
Excuse me for my question which seems far from the objective of your course.
In fact, I wanted to write a python program with 2 subprograms “LSTM”.
Each sub-program is a code like what is described in “Time Series Prediction with LSTM Recurrent Neural Networks in Python with Keras” of the current course,
so that it’s two sub-programs runs as parallel functions.
I am trying to find out how to run parallel fit model, that’s each fit is a different LSTM parameters.
Your create_dataset function is wrong. The range specified should be len(dataset) – look_back rather than len(dataset) – look_back – 1. Thanks for the wonderful tutorials though.
I am doing my thesis on cryptocurrency price forecasting specially on bitcoin price prediction
using deep learning models through time series forecasting . I face big challenge on implementation how can I use the LSTM time series prediction ?
Hi Jason, I’m following your tutorials and found them very very useful.
In fact, with the code in your tutorials I’m having a good foundation for playing around with different ML algorithms.
But I’m stuck at some problem definition.
Can you please look at this stackoverflow question and answer/suggest some architecture, or how to proceed for this problem.
Basically the task is to build a RNN model based architecture for detection of malware using multiple API call sequences.
Thanks for taking time to read this comment. Waiting for suggestions.
Here each binary have variable number of sequences, and each sequence have variable number of API calls. I can pad the data so that all binaries will have equal number of sequences and each sequence also have equal number of API calls. But my question is how can I use this data for training?
The problem is that, all the sequences of the malicious binary may not be malicious sequences. So, if I use the label and indicate the model that all those sequences are malicious and if some of the sequences are similar in benign files also, the benign binary may be treated as malware.
To better understand the problem, treat each binary file as a person on twitter, and each API call sequences as a words in a tweet. A user may tweet so many tweets, but a few of them may be about sports (for eg). And in my training data I know which persons tweets about sports, but I don’t know which tweets are about sports. So, what I’m trying to do is classifying those persons whether they like sports or not based on all the tweets of the person.
In the same way, I know whether the binary is malicious or not, but I don’t know which API call sequences are responsible for maliciousness. And I want the model to identify those sequences from the training data. Is it possible? And what architecture should I use?
What I’m trying now is that, first each sequence is converted into a seq_score using LSTM model, and now multiple sequences will become an array of seq_score. Then I’m connecting this array to a Dense layer.
But I’m not sure, if it is a correct way. Can you suggest some architecture to deal with this?
Did you just preprocess the whole data set (including the test set) before splitting it up?
I thought you emphasize that fitting should only be done on the train set, transform should be done on both train and test set
Am working on link prediction method using LSTM and GRU to map the input sequence to
a fixed-sized vector, i built it using Learning Automta Enironment. and its gives me some error, i need your help,
this is working perfect but to implement the LSTM and GRU its gives error
Thanks a lot for your wonderful insight into the beautiful world deep learning for predicting time series.
I am currently doing an M. Sc. project in which I intend to use Hidden Markov Model in hybridisation model with RNN (LSTM) to predict stock prices in the financial sector. The HMM is to be used to extract the necessary stock features before feeding the data into an RNN (LSTM) for prediction or generalisation
Could you kindly help me find a way around this hybridization.
A wonderful tutorial, as always. I have a separate question as an aside – if I have a set of time dependent features (say X(t)) and I use a neural network to estimate another set of features Z(t) which I subsequently use as the RHS of a system of differential equation of f(X(t)), then after I numerically solve the differential equation and plot f vs t, how can I draw the 95% confidence interval to the solution?
I have a question regarding the time series prediction.
As we make the time series supervised from unsupervised so as to predict the test set.
But in test set we give all the points from the inputs to predict the output.
So, My question is if we want to predict the output without providing all the input in the test set can it be possible? like predicting the future results by just providing the initial value and the historical data.
Thank you so much for this really helpful tutorial.
I am trying to imply this LSTM in sequence to sequence learning rather predicting the sequence in future. Let me explain it a little, suppose i have a 30 set of sequence of length 1000 (earthquake ground motion signature) and corresponding 30 set of sequence of response which is also length of 1000. I am training this input data with the output response data and making the network, then predicting the response sequence of of length 1000 given a unknown ground motion sequence.
Now my question is; is it necessary to supply the same length of x_train(ground motion sequence) and and y_train (response) for training purpose in building the net.
I want to predict the maximum or minimum value from that response sequence instead of training and predicting the whole sequence.
So is it possible to make x_train(30X1000X1) and (30X1X1){i.e. instead of 1000 make it 1}
Here I am attaching the code I have working with so far.
Great Lecture. I have to build an LSTM model for time series data, where I have to predict wind speed. My data is taken every 10 minutes and im using datasets from 2013 to 2014. I want to predict 6 hours in future, using say for example 5 days of observations hence I have to create a window containing the last 5 days observation to train the model.
How would I create the window of 5 days observation (720(5×144)) without having to use : t-2,t-1,t?
Yet again another great article. I have a question in regards to model.predict. Let’s say we have the airplane-passenger model trained and ready to go. How do we structure our input data to .predict future dates in our time series rather than our test/train data? Thanks.
hi…
I am having the problem in my graph as of yours. If you look at the peak of the modeled output they are at t+1 step. can you explain to me the reason why is it that??
I am not bothered about the accuracy or anything. whatever value of prediction that I get should be at the same point on which my observation value is their.
please stick to my question. In my predicted result, it seems that it is of time step t+1 instead of time t which is also clearly seen in your graph. Can you give some explanation to that.
hai Jason, is it avalaible this type of forecasting using GRU (gated recurrent unit). Could you please create the same tutorial but using GRU. Thank you????
Thank you for writing this article. It helped me a lot to learn deep learning.
However, I don’t know if the LSTM model in this article is working properly.
The problem found in the graph seems to be that the predicted value converges with the value at the previous point in time. Did you know the problem? Than what’s the cause of the problem?
Thank you for the great article. Your posts help me a lot with my thesis. 🙂
However I have some difficulties with LSTM forecast. Somehow my prediction is shifted by one comparing to the test values. If I shift them with one it alligns quite well with the test_y values, but I do not understand why is it shifted even compared to the test which is already shifted by one.
Hi Jason,
Thank you for this valuable tutorial. I see a one-period time shift in the forecasts you obtained. Is this normal in forecasting experiments? I also study on a hybrid artificial neural network algorithm and there is one-period time shift in the forecasts like in yours. Do you have any suggestions about this problem if it is really a problem? Thanks again.
I’m using (LSTM) to predict Energy consumption in short term , I finshed it but when it comes to masure the accuracy for the model I got a lot of problem I tried many codes some of them get an error and the others give me a (0.00 accuracy ) , and I do not know what is the problem , this is my code if you have any solution , thank you so much
import numpy as np
import matplotlib.pyplot as plt
import pandas as pd
from pandas import datetime
import math, time
import itertools
from sklearn import preprocessing
import datetime
from operator import itemgetter
from sklearn.metrics import mean_squared_error
from math import sqrt
from keras.models import Sequential
from keras.layers.core import Dense, Dropout, Activation from keras.layers.recurrent import LSTM
hello , how can I use Cross Validation on this code ??
import numpy as np
import matplotlib.pyplot as plt
import pandas as pd
from pandas import datetime
import math, time
import itertools
from sklearn import preprocessing
import datetime
from operator import itemgetter
from sklearn.metrics import mean_squared_error
from math import sqrt
from keras.models import Sequential
from keras.layers.core import Dense, Dropout, Activation from keras.layers.recurrent import LSTM
At the end what the result of this validation , is it a accuracy number in (%) or just an error accuracy , ex : 0.0052 , because I still have problem with showing the accuracy as number with (%) , i’m using LSTM for prediction not classification , and all the solution I got for classification
Hi !
I have used your algorithm for predicting the number of users of a platform, however I would like to know how much data I can predict (5 min 10min …)?
I copy and paste your code and your dataset, but it gives me the following error:
testX = numpy.reshape(testX, (testX.shape[0], 1, testX.shape[1]))
IndexError: tuple index out of range
Hello Thank’s!
I have a question:
Why you reshape it like this
# reshape input to be [samples, time steps, features]
trainX = numpy.reshape(trainX, (trainX.shape[0], 1, trainX.shape[1]))
I think correct is:
trainX = numpy.reshape(trainX, (trainX.shape[0], trainX.shape[1], 1)),
because trainX.shape[1] – number of your timestamps, and 1 -is your unit (1 value)
Hi Jason,
“Some sequence problems may have a varied number of time steps per sample. For example, you may have measurements of a physical machine leading up to a point of failure or a point of a surge. Each incident would be a sample of the observations that lead up to the event would be the time steps, and the variables observed would be the features.”
I have such a problem. I am carrying out an experiment, and I have data measurements of load applied at each time to a specimen for 1000 minutes, and the strength when it failed. The next specimen failed in 800 minutes, and another in 900 minutes. I have such data, where the input is the load sequences, and output is a strength. How do I build an LSTM model for it.
Also, if I need to predict the strength, for a load sequence at 500 minutes, how will it work
hi jason,
Whether LSTM architecture learn its required features on its own,(OR) should we mention to learn specific column featuresIn the dataset….I have big doubt on That..
I implemented using LSTM. Just one question, shall we not split the data into train/ test before we do scaling on it? Is it not leaking info ? I got pretty good results but I am spicy. Then I split the dataset into train/test first and then the results are really poorly. And for multistep forecast it is even not converging.
Looking forward to your reply!
Hi Jason,
Thanks for the simple and great explanation. I have always been so confused with many other explanations.
I am trying to learn and implement techniques such as Bayesian by Backprop – to include variational inference technique into LSTM for probability estimates. The problem statement I have is quite simple – given the failure time-series data for (say) 10 bearings, can I give a probabilistic estimate of a 11th bearing given the data for the first few time steps?
Does your book cover topics such as this? I am happy to pay a subscription to learn more in this regard.
If you are predicting a category, you can predict the probabilistic outcome.
When predicting a numerical quantity, you might need to use an ensemble of models to predict multiple samples from which to construct a probability distribution.
Hi Jason,
Why do we have to put shuffle equal to False in LSTM for time series, as we convert time series to a regression one?
model.fit(trainX, trainY, epochs=1, batch_size=batch_size, verbose=2, shuffle=False)
for example I have 10 files of data and all the 10 files has different time starting point and ending points but the Y axis is the same for all. So, will it be a problem to train such data?
When using inverse transform, I got this error. (ValueError: Found array with dim 3. Estimator expected <= 2.) So, I changed dimension (40,1,42) to (40,42). But, the values of inverse transform is not same with original input values. So, why is it?
Thank you so much for your reply.
if I want to make the model learn in real time after the training. How should we do that? and Can I also fix some parameters while training the model?
Can you provide me any link for this or any guidance to a tutorial?
I currently have a data that contains the 48 hours temperatures of 1000 patients. Nurses and automated thermometers check temperature every hour within 48 hours period. However, there are more than half of temperatures checked by nurses are missing. Do you think making 1000 patients into 1000 features is a good idea? If yes, could you please tell me why this is a good idea? I appreciate your answer.
thank you for a such a informative post.
i was going through the code on making a prediction on the stock market.
however, I am getting the feeling that the code is not forecasting but in fact going back a day and getting the answer, isn’t it?
even on the graph the test and train prediction lines are a day later than the data.
how would you able to predict the day ahead?
i have read all the other post that you suggested to look at for forecasting but not finding the right code for it.
it will be great if you could help me on that.
Sir I have dataset with 75 dates .I mean months.
train = 50 and test = 25
I want to make trainX = 51 and testX = 26 to predict the future value.
how can I do that
Can you help me with that sir?
Jason,
Thank you for the code and explanation.
I am still not sure how I can get the prediction, the next value.
In order to use the model.predict(X) I have to insert a value X. When I did (I insert the last number so i can get the prediction) it gave me an error msg: ‘ ‘float’ object has no attribute ‘ndim’
Your help is appreciated.
I had run the code on standalone Keras 2.3 on TensorFlow 2.0 and the output was always optimized regardless the #neurons, #layers or #epochs, their change was never reflected to the output, even with 1 neuron, 1 layer and 1 epoch the error was minimum as if Keras neglected the user input and had internal values, don’t know why !
I made the change to use Keras from inside Tensorflow and now it works just fine.
Oh, i see. We want predict next t+1 then we have 465 points. But let me know how to predict number of passenger at 1961-01. I still confuse. Can you give me some simple code for this case?
I read some practical articles about lstm till now, yours was the best. The data are so intuitive and this adds intuition to my understanding of lstm, time dependency, words dependency, etc.
I used the same procedure in order to predict the volatility. I’m curious about the reason to normalize the output variable (= y variable). Is there any scientific research behind this normalization step? And if so, could you share it?
For example, I have a dataset with data from different sources which are independent, they can not be combined. However, is possible to transform the data with a sliding window. The main problem is that I will have for example windows for the same period of time.
For example the first is from 8:00-9:00 and the second is also from 8:00-9:00. In the fitting phase, this period will appear two times. Is this really a problem? Or Is it ok to train the model with data from the same period (however, different data)?
I am using similar code you have for an LSTM NN in tensorflow. I’m trying to understand why when re-arranging the feature columns, and leaving everything else the same, the network output is dramatically different. Seed is constant.
I can understand some slight changes, perhaps with the initial weight initilisation and the way connections are made, but there is a material difference in predicted output.
Any ideas why and how to correct, if at all possible? It seems like another unknown to factor for….
More background info not sure if relevant on how I’m processing the data:
About 60K time steps with 4 features (so 60,000 x 4). I take a window of 500 steps for each, “slice”. minmax scale each “Slice”. Output is multi-step approx 2-12 steps.
That was quick! The output is consistent if re-run, between sessions and days…. I can always replicate it, and when going back and forth with featurecolumn arrangement the reproduced output is similar. I can understand why BATCH size can affect results, although I always thought it was mainly for memory optimisation…
This is how I built my NN, maybe I am applying it incorrect?
Thanks once more…
I am using LSTM (or similar deep networks) for predicting time series. For time series like y[n], the LSTM can predict y[n+1], and it is a function of previous samples [ f(y[n], … ,y[0]) ]. My question is whether LSTM works better than a trivial answer like y*[n+1]=y[n] (asterisks show the prediction of a sample) while in my problem loss function of this answer is smaller.
I mean for
the pervious sample as prediction: y*[n+1]=y[n]
RNN with LSTM : y*[n+1]=f(y[n], … ,y[0])
does RNN outperform? ( in my problem based on loss function it does not)
Hey, thanks a lot for the article, in addition to the time series, I wanted to provide some inputs to the LSTM model that are not changing with respect to time, can I please know if that is possible and useful?
Hey, I tried your tutorial to make a time series forecasting and it looks extremely accurate that it looks suspicious so I had a question about the following 2 lines in your code:
trainPredict = model.predict(trainX)
testPredict = model.predict(testX)
What is the method “predict” exactly doing and why would you use it on test data as well?
If you give the actual test data to the model is it then still really a forecasting?
Keras is actually just predicting the next value from each test input with predict function.
So, if you want a legit prediction, you should just predict the first point from test input, and then take the output to feed the input again, and so on. That’s called autonomous mode.
Keras it’s a really closed system based in Tensorflow, so there is many other variables that we are not aware about from Recurrent Neural Nets like LSTM.
In other words, the validation test that everybody does in Keras it’s suspicious because it’s wrong. Real validation should be taken by making autonomous and iterate over the lenght of testY.
I recommend you to use Tensorflow over Keras, to appreciate every detail from LSTM, but it’s quite tough to learn it.
Try to forecast a sine wave first, it’s like the HelloWorld for the Recurrents.
In Keras i couldn’t even do that well because the cell state that LSTM haves it’s quite misleading.
I notice that lot of cases time series prediction has delay problem, even if you take a look at your model predict the train data, the prediction of train data has delay effect(you can shift 1 lag to left the prediction of train data, it will ‘follow; quite nicely to the train data)
In essence model result seems to only follow the “up and down” of the “last” data of the train.
(if you latest data use to predict is high/up -> prediction will be up)
(if you latest data use to predict is low/down -> prediction will be down)
Model seems only follow the latest data, it doesn’t seems “learn” in away like , if the available data already in record high, next prediction will be sharp downturn
For this example, it’s seems okay, but for other time series, it could be problem.
I also has this problem, for my case i need to predict 1 month data but the third month of the latest available data( if we are in august, i need to predict nov data)
the shifting problem occurs even noticeable(shifting3 lag)
I also still have know idea how to solve, any idea?
Hello Jason. Impressive work. I am new to machine learning, deep learning and python programming. I would really appreciate it if you could point me out to right direction regarding the use of this project for forecasting 1 day, 2 days or “n” days in the future, using the model created. Can this LSTM method forecast and not only be compared to past prices of the stock? Does this method create an equation with coefficients (like a regression)?
Thanks in advance!
What a great article – I’m busy learning LSTM and this has been such a massive help to me, and as i can tell by the number of posts, since 2016 on this same article you have provided a great service to students of ML and DL.
Wondering if you have an example/tutorial on how to make time-series predictions for more than one step-ahed (e.g., 1 week, 1 month predictions)?
I have successfully built my hybrid model for one-step ahed prediction, but I am struggling in adapting it for a more long term one. Any help/advise would be appreciated, thanks a lot!
Thanks for your example. I am not a researcher in this field but am stuck with it in a software project. I have a small amount of data and it is not repetitive.
I want to ask that if the data is not repetitive then using model.predict will return the same data as the training data but not much relation to the future data, is that right?
If the model predicts the input as output, this is a sign that the model does not have skill (e.g. it has learned to persist the last seen value). In which case it might be a good idea to try alternate data prep/models/model configs/etc.
Yes. I will research more about it. And do you have any other example for my case (data for a training period, not repetitive… need to forecast a short period)?
excuse me, Dr. 1 more question 😀 in LSTM, my prediction data always one step behind the real data in the graph in the graph, which configuration I can make prediction data be faster a time step.
I have seen and followed a few examples. However, I still don’t understand why after LSTM finished learning from training data, It used test data as input for prediction and returns a highly accurate prediction result. So what is its purpose?
Thanks so much Dr. Jason for the tutorial, i’m a beginner sir.Im trying to incorporate CNN-LSTM into airline passenger problem.i copied some of your code in your previous blog https://machinelearningmastery.com/how-to-develop-lstm-models-for-time-series-forecasting/ but how can i reshape my input into [samples, subsequences, timesteps, features] unlike [samples, timesteps, features] in this tutorial.
First thank you a lot for your blog, it is really helpful.
Here my question, I am using LSTM to make prediction about the price of a certain product. I make a first try using the past 24 hours to predict the next 24 hours.
Now I am interested to add another feature, I want to use the information about the day of week because it gives a lot of information and I am pretty sur it will improve the prediction. But I am not completely sure how to add it.
As, I do windows as you presented, here it is how I feed my first model :
Now if I add my second feature, that I first hot encoded (if we are a Sunday):
Sunday : [t-24, t-23, t-22,… t-1] = [1, 1, 1,…1]
Saturday: [t-24, t-23, t-22,… t-1] = [0, 0, 0,…0]
… [t-24, t-23, t-22,… t-1] = [0, 0, 0,…0]
Monday : [t-24, t-23, t-22,… t-1] = [0, 0, 0,…0]
Price product : [t-24, t-23, t-22,… t-1] –> prediction : [t, t+1, t+2, t+3,…, t23].
I am not sure if it is a good way to feed like this my LSTM model, I just want to know your advice on it ?
My second idea was to transform my time data into a sin and a cos due to the fact that I have a clear periodicity and use something like this (I found it on a tutorial but I don’t clearly understand the meaning for the moment, I will investigate more on that) :
Yes, you can add as many varieties for a given time step as you want.
Perhaps compare to an integer encoded day of week, vs one hot encoded, vs embedding and see what works well/best.
Perhaps try a flag weekday vs weekend or similar.
Perhaps try an MLP or ML model to confirm your LSTM has skill against a naive model.
I come back to you with another general question. After your advices, I also try to use an MLP model and it produces better results on my forecast than LSTM.
So perfect, I wanted to use it on my ‘Production set’. Let be a bit more precise, indeed my dataset is composed of data from 2015 to 2019, I decided to use data from 2015 to 2018 (included) as train set and 2019 data as validation set. I make sure to scaled my data very carefully, i.e. I used StandardScaler from sklearn scaler.fit_transform on data_2015 to 2018, and only scaler.transform on data_2019 (in order to avoid any possible leakage). And yes, I obtain quite good results, on my train and validation set.
I wanted to confirm this on data from 2020 (Production set). Unfortunately my results are really bad…
After some research, I came across another one of your articles about walk-forward validation. At the beginning, I just split my data 2015 to 2018 as train, and 2019 as validation. Now, I use this Walk-Forward method with TimeSeriesSplit from sklearn. But the problem remain the same…. good results on train-validation set and really poor results on 2020 data.
I know also that my data were quite sensitive about the corona-virus but as I used many others features as input, I was expecting that the general effect will be catch by my model (I hope I am understandable). But even so, I am a bit lost and I don’t think that my problem is due to that virus-effect. It feels that my model is suffering of leakage but I really don’t know how.
So yes please, I need some tips or advices to see where can be my problem ?
In my model i also have the yearly cycle (with sin and cos), it’s useful if the data is not stationary (i guess). The thing is, it’s common practice to transform the data to be stationary. Does it make sense to create this variable of periodicity and the transform it?
Excellent post, I was wondering if you could shed light in transfer learning for LSTMs.
I am currently working on a project about time-series forecasting using LSTMs layers. The dataset used for training and testing the model was collected among 443 people which worn a sensor that samples a physical variable ( 1 variable/measure) every 5 minutes, for each patient there are around 5000 records/readings.
Although, I can train and test my model under different scenarios, I am troubled finding information about how to apply transfer learning in such an architecture. I mean, I understand I can use inductive transfer-learning by copying the matrix-weights from the general model onto a secondary model (unknown person), then after I can re-train this model with specific data and evaluate the result.
But I would like to know if you could think of other ways to apply transfer-learning on this type of architecture or where to find information about it since there aren’t many scientific papers talking about it, mostly they talk about NLP and other type of applications but time series?
Yes, transfer learning might help if you don’t have much data and you are able to train a model or models with a large amount of data that is related or similar to your domain in some way – even just for feature extraction at the same level of detail.
Perhaps try it and compare results to from-scratch models on your specific dataset. Compare results to MLP, CNN and hybrids as often LSTMs are not well suited to autoregression type problems.
Thanks Janson for this amazing resource you’ve created.
I’m very new to all this, but I thought I post an edit that might help show the difference between asking the model for a series of one-step predictions based on existing data, and walking forward in time to predict beyond existing data. (I see some questions on the matter here, and I experienced the same confusion). I tried to modify your example a little as possible. Not sure if I’m really doing this right, but it seems to work ok.
1
2
3
4
5
6
7
8
9
10
11
12
13
14
15
16
17
18
19
20
21
22
23
24
25
26
27
28
29
30
31
32
33
34
35
36
37
38
39
40
41
42
43
44
45
46
47
48
49
50
51
52
53
54
55
56
57
58
59
60
61
62
63
64
65
66
67
68
69
70
71
72
73
74
75
76
77
78
79
80
81
82
83
84
85
86
87
88
89
90
91
92
93
94
95
96
97
98
99
100
101
102
103
104
105
106
107
108
109
110
111
112
113
114
115
116
117
118
119
120
121
122
123
124
125
126
127
128
129
130
131
132
133
134
135
136
137
138
139
140
141
142
143
144
145
146
147
from pandas import DataFrame
from pandas import Series
from pandas import concat
from pandas import read_csv
from pandas import datetime
from sklearn.metrics import mean_squared_error
from sklearn.preprocessing import MinMaxScaler
from keras.models import Sequential
from keras.layers import Dense
from keras.layers import LSTM
from math import sqrt
from matplotlib import pyplot
import numpy
import os
# date-time parsing function for loading the dataset
def parser(x):
returndatetime.strptime('190'+x,'%Y-%m')
# frame a sequence as a supervised learning problem
Why do LSTMs require training data in a ‘supervised form’ like other machine learning algorithms? I thought they should be trained sequentially (giving one sample at a time because the model implicitly remembers the past inputs).
1) Why do they require supervised data?
2) If they require supervised data, what’s the difference from other machine learning algorithms?
3) Why are LSTMs memory-less? If I give the same input to the network, I always get the same output regardless of the previous inputs.
Thank Your for the very great article!
My question is, how am I suppose to predict the following i.e. 30 element, that would come after the dataset?
So I have your trained model, and I would like to predict the next for example 30 element of the measured sequence.
Hi Dr. Jason,
Thanks for the excellent post,im confused about the use of time steps and windows method. Why are we creating a new dataset or are we predicting for years ahead.
what the x and y-axis?
I have data related to rainfall it depends on humidity, temperature to predict supply hours in future, I have data for it from 2008 to 2018, how to deal it with the LSTM model as above example
I have data related to rainfall it depends on humidity, temperature to predict supply hours in future, I have data for it from 2008 to 2018, how to deal it with the LSTM model as above example
Güncel Çağrı Merkezi Data – Çağrı Merkezi Data, Güncel Data Hizmetleri En Güncel Datalar.
Perhaps try loading your data and compare the performance classical time series methods, ml methods, mlps, cnns and lstms in order to discover what works best.
I am getting this error:
ValueError: operands could not be broadcast together with shapes (81367,4) (5,) (81367,4)
tried a lot but could not find any solution. Please help
Hi Jason, thanks for this awesome resource and by seeing your blog I’m also really interested in your book. I just had a question about this one, the look_back is used to be able to predict the passengers on the next month right? So if I want to predict the passengers for two years next, I should set the look_back as 24 right? But how can I display the future prediction on the graph? it seems like the predicted test data stops in the graph when the graph of the dataset ends. I hope you’ll be able to help me out here 🙂
Hi, to anyone having the same question, below is how I managed to do it:
1. Set a for loop with range(number of future predictions)
2. predict using the model, the last element of the testX numpy array,
3. concatenate this last prediction
this will add the predictions to the testX array, also make sure you reshape your data correctly so you don’t encounter any errors.
However, I’m not still sure this is the best way to do so
Thanks for this amazing notebook and explanations again. I have a question about preparing lstm dataset. I have a data frame which include lots of features about building, for instance; square meter, outside temperature, wind power etc and the output is energy consumption value by kWh.
I want to build Keras model which feed by 2 dataset and give me one output. Actually I did it. and my rmse value is great. But I have a doubt about my lstm dataset. I used window frame method and build a dataset with 4 features like [“t-4”, “t-3”, “t-2”, “t-1”] and output is t. I feed the dataset with this data frame.
However is that true approach to build a lstm data frame?. Because I feel like it is like a cheating because I have already give the exact value energy consumption to the model when train it.
By the way, I created my second dataset, just using the output values of my original dataframe. So , [“t-4”, “t-3”, “t-2”, “t-1” are all energy consumption values coming from past outputs.
Ensure the input data to your sample represents only data that you have available before a prediction is required. This is like a golden rule for time series.
Does anyone else getting error for the LSTM layer addition?
NotImplementedError: Cannot convert a symbolic Tensor (lstm/strided_slice:0) to a numpy array, when running the following code (keras version 2.4.3)
from keras.models import Sequential
from keras.layers import Dense
from keras.layers import LSTM
from sklearn.preprocessing import MinMaxScaler
from sklearn.metrics import mean_squared_error
# create and fit the LSTM network
look_back = 3
model = Sequential()
model.add(LSTM(4, input_shape=(1, look_back)))
model.add(Dense(1))
model.compile(loss=’mean_squared_error’, optimizer=’adam’)
To anyone who encounter that problem, I solved it by downgrading numpy to version 1.19.5.
The latest Keras seems incompatible with latest numpy version.
You can do so with “pip install –user numpy==1.19.5 “.
This worked for me too, frustrating to try to figure out why the new NumPy doesn’t work…seems like there was some sort of variable/command change. Reading the code, and printing out the array, its type and dimensions, it seems like symbolic Tensor issues shouldn’t be an issue, but it keeps happening in the new NumPy versions.
Thanks for your amazing work. Please I just want to ask if RNN can be used for a normal regression problem?.. lets say you have your ‘Y’ variable and a list of ‘X’ variables as input and you just want to know their relationship and not necessarily a prediction over time as in time series regression. Can the RNN still work? Cos it seems RNN is only tailored to work on only sequential problems like time or temporal series regression
Thanks a lot for this great post. I have couple of questions:
1-I’m using the window method to predict the next value based on the previous 10 values (time_step=1, features=10). LSTM is performing quite bad. I tuned the hyper parameters using Keras tuner for 300 trials, I used the best model and still the performance is not that good.
Could this mean that LSTM is not adequate for my time series? How do I know if the sequence of data could be predicted or not using LSTM ?
2- If I understood well, the window method: predict one value based on the last n values (as features). The time step method: predict n values based on the previous n values (is this correct )?
It may mean the model is not appropriate for your data, or your data may need some preparation or an alternate configuration is required.
It is often a good idea to start with some naive models and compare everything to that, then move on to classical methods then ml, then finally neural nets.
I have run your code with your dataset and got the following error
CODE:
'''

ORIGINAL CODE

For completeness, below is the entire code example.

https://machinelearningmastery.com/time-series-prediction-lstm-recurrent-neural-networks-python-keras/

'''
# LSTM for international airline passengers problem with regression framing
import numpy
import matplotlib.pyplot as plt
from pandas import read_csv
import math
from keras.models import Sequential
from keras.layers import Dense
from keras.layers import LSTM
from sklearn.preprocessing import MinMaxScaler
from sklearn.metrics import mean_squared_error
# convert an array of values into a dataset matrix
def create_dataset(dataset, look_back=1):
dataX, dataY = [], []
for i in range(len(dataset)-look_back-1):
a = dataset[i:(i+look_back), 0]
dataX.append(a)
dataY.append(dataset[i + look_back, 0])
return numpy.array(dataX), numpy.array(dataY)
# fix random seed for reproducibility
numpy.random.seed(7)
# load the dataset
dataframe = read_csv('airline-passengers.csv', usecols=[1], engine='python')
dataset = dataframe.values
dataset = dataset.astype('float32')
# normalize the dataset
scaler = MinMaxScaler(feature_range=(0, 1))
dataset = scaler.fit_transform(dataset)
# split into train and test sets
train_size = int(len(dataset) * 0.67)
test_size = len(dataset) - train_size
train, test = dataset[0:train_size,:], dataset[train_size:len(dataset),:]
# reshape into X=t and Y=t+1
look_back = 1
trainX, trainY = create_dataset(train, look_back)
testX, testY = create_dataset(test, look_back)
# reshape input to be [samples, time steps, features]
trainX = numpy.reshape(trainX, (trainX.shape[0], 1, trainX.shape[1]))
testX = numpy.reshape(testX, (testX.shape[0], 1, testX.shape[1]))
# create and fit the LSTM network
model = Sequential()
model.add(LSTM(4, input_shape=(1, look_back)))
model.add(Dense(1))
model.compile(loss='mean_squared_error', optimizer='adam')
model.fit(trainX, trainY, epochs=100, batch_size=1, verbose=2)
# make predictions
trainPredict = model.predict(trainX)
testPredict = model.predict(testX)
# invert predictions
trainPredict = scaler.inverse_transform(trainPredict)
trainY = scaler.inverse_transform([trainY])
testPredict = scaler.inverse_transform(testPredict)
testY = scaler.inverse_transform([testY])
# calculate root mean squared error
trainScore = math.sqrt(mean_squared_error(trainY[0], trainPredict[:,0]))
print('Train Score: %.2f RMSE' % (trainScore))
testScore = math.sqrt(mean_squared_error(testY[0], testPredict[:,0]))
print('Test Score: %.2f RMSE' % (testScore))
# shift train predictions for plotting
trainPredictPlot = numpy.empty_like(dataset)
trainPredictPlot[:, :] = numpy.nan
trainPredictPlot[look_back:len(trainPredict)+look_back, :] = trainPredict
# shift test predictions for plotting
testPredictPlot = numpy.empty_like(dataset)
testPredictPlot[:, :] = numpy.nan
testPredictPlot[len(trainPredict)+(look_back*2)+1:len(dataset)-1, :] = testPredict
# plot baseline and predictions
plt.plot(scaler.inverse_transform(dataset))
plt.plot(trainPredictPlot)
plt.plot(testPredictPlot)
plt.show()
InvalidArgumentError: Shape must be at least rank 3 but is rank 2 for '{{node BiasAdd}} = BiasAdd[T=DT_FLOAT, data_format="NCHW"](add, bias)' with input shapes: [?,16], [16].
During handling of the above exception, another exception occurred:
ValueError Traceback (most recent call last)
in
45 # create and fit the LSTM network
46 model = Sequential()
---> 47 model.add(LSTM(4, input_shape=(1, look_back)))
48 model.add(Dense(1))
49 model.compile(loss='mean_squared_error', optimizer='adam')
~/anaconda3/envs/tfall/lib/python3.7/site-packages/keras/engine/sequential.py in add(self, layer)
206 # and create the node connecting the current layer
207 # to the input layer we just created.
--> 208 layer(x)
209 set_inputs = True
210
~/anaconda3/envs/tfall/lib/python3.7/site-packages/keras/layers/recurrent.py in __call__(self, inputs, initial_state, constants, **kwargs)
658
659 if initial_state is None and constants is None:
--> 660 return super(RNN, self).__call__(inputs, **kwargs)
661
662 # If any of initial_state or constants are specified and are Keras
~/anaconda3/envs/tfall/lib/python3.7/site-packages/keras/engine/base_layer.py in __call__(self, *args, **kwargs)
944 if _in_functional_construction_mode(self, inputs, args, kwargs, input_list):
945 return self._functional_construction_call(inputs, args, kwargs,
--> 946 input_list)
947
948 # Maintains info about the Layer.call stack.
~/anaconda3/envs/tfall/lib/python3.7/site-packages/keras/engine/base_layer.py in _functional_construction_call(self, inputs, args, kwargs, input_list)
1082 # Check input assumptions set after layer building, e.g. input shape.
1083 outputs = self._keras_tensor_symbolic_call(
-> 1084 inputs, input_masks, args, kwargs)
1085
1086 if outputs is None:
~/anaconda3/envs/tfall/lib/python3.7/site-packages/keras/layers/recurrent_v2.py in lstm_with_backend_selection(inputs, init_h, init_c, kernel, recurrent_kernel, bias, mask, time_major, go_backwards, sequence_lengths, zero_output_for_mask)
1645 # Call the normal LSTM impl and register the CuDNN impl function. The
1646 # grappler will kick in during session execution to optimize the graph.
-> 1647 last_output, outputs, new_h, new_c, runtime = defun_standard_lstm(**params)
1648 _function_register(defun_gpu_lstm, **params)
1649
~/anaconda3/envs/tfall/lib/python3.7/site-packages/keras/layers/recurrent_v2.py in standard_lstm(inputs, init_h, init_c, kernel, recurrent_kernel, bias, mask, time_major, go_backwards, sequence_lengths, zero_output_for_mask)
1386 input_length=(sequence_lengths
1387 if sequence_lengths is not None else timesteps),
-> 1388 zero_output_for_mask=zero_output_for_mask)
1389 return (last_output, outputs, new_states[0], new_states[1],
1390 _runtime(_RUNTIME_CPU))
~/anaconda3/envs/tfall/lib/python3.7/site-packages/tensorflow/python/util/dispatch.py in wrapper(*args, **kwargs)
204 """Call target, and fall back on dispatchers if there is a TypeError."""
205 try:
--> 206 return target(*args, **kwargs)
207 except (TypeError, ValueError):
208 # Note: convert_to_eager_tensor currently raises a ValueError, not a
~/anaconda3/envs/tfall/lib/python3.7/site-packages/keras/backend.py in rnn(step_function, inputs, initial_states, go_backwards, mask, constants, unroll, input_length, time_major, zero_output_for_mask)
4341 # the value is discarded.
4342 output_time_zero, _ = step_function(
-> 4343 input_time_zero, tuple(initial_states) + tuple(constants))
4344 output_ta = tuple(
4345 tf.TensorArray(
~/anaconda3/envs/tfall/lib/python3.7/site-packages/keras/layers/recurrent_v2.py in step(cell_inputs, cell_states)
1364 z = backend.dot(cell_inputs, kernel)
1365 z += backend.dot(h_tm1, recurrent_kernel)
-> 1366 z = backend.bias_add(z, bias)
1367
1368 z0, z1, z2, z3 = tf.split(z, 4, axis=1)
~/anaconda3/envs/tfall/lib/python3.7/site-packages/tensorflow/python/util/dispatch.py in wrapper(*args, **kwargs)
204 """Call target, and fall back on dispatchers if there is a TypeError."""
205 try:
--> 206 return target(*args, **kwargs)
207 except (TypeError, ValueError):
208 # Note: convert_to_eager_tensor currently raises a ValueError, not a
~/anaconda3/envs/tfall/lib/python3.7/site-packages/keras/backend.py in bias_add(x, bias, data_format)
5961 if len(bias_shape) == 1:
5962 if data_format == 'channels_first':
-> 5963 return tf.nn.bias_add(x, bias, data_format='NCHW')
5964 return tf.nn.bias_add(x, bias, data_format='NHWC')
5965 if ndim(x) in (3, 4, 5):
~/anaconda3/envs/tfall/lib/python3.7/site-packages/tensorflow/python/util/dispatch.py in wrapper(*args, **kwargs)
204 """Call target, and fall back on dispatchers if there is a TypeError."""
205 try:
--> 206 return target(*args, **kwargs)
207 except (TypeError, ValueError):
208 # Note: convert_to_eager_tensor currently raises a ValueError, not a
~/anaconda3/envs/tfall/lib/python3.7/site-packages/tensorflow/python/framework/op_def_library.py in _apply_op_helper(op_type_name, name, **keywords)
748 op = g._create_op_internal(op_type_name, inputs, dtypes=None,
749 name=scope, input_types=input_types,
--> 750 attrs=attr_protos, op_def=op_def)
751
752 # outputs is returned as a separate return value so that the output
~/anaconda3/envs/tfall/lib/python3.7/site-packages/tensorflow/python/framework/ops.py in _create_c_op(graph, node_def, inputs, control_inputs, op_def)
1881 except errors.InvalidArgumentError as e:
1882 # Convert to ValueError for backwards compatibility.
-> 1883 raise ValueError(str(e))
1884
1885 return c_op
ValueError: Shape must be at least rank 3 but is rank 2 for '{{node BiasAdd}} = BiasAdd[T=DT_FLOAT, data_format="NCHW"](add, bias)' with input shapes: [?,16], [16].
In this approach, I think the test data is biased and that could be the reason why we are seeing a lag between ground-truth and predictions in the plots. It is basically carrying forward the target values in a sense. The way the test data is being generated is possibly introducing the bias as the look-back data is being generated from the ground-truth instead of the model’s forecasted values. On the other hand, if the model’s forecasted values were used to generate the look-back data, it’s highly possible that the error eventually gets increased. That leaves me in a great confusion. What should be the ideal way to generate test-data for such problems ??
Nice tutorial. I have a question regarding the parameter of LSTM layer.
model.add(LSTM(32, input_shape=(1024,4)))
here I’m sure that block size is 32, but does this code mean window size is 1024 by 4. Please clarify if I’m wrong.
Hi Dr. Jason,
I’m a beginner, trying to learn new things, i removed the invert prediction and tried to run the program but I got an error after the epochs ran ,Singleton array 0.034482762 cannot be considered a valid collection.
When i changed the following code at the RMSE section from
trainScore = math.sqrt(mean_squared_error(trainY[0], trainPredict[:,0]))
testScore = math.sqrt(mean_squared_error(testY[0], testPredict[:,0]))
to
trainScore = math.sqrt(mean_squared_error(trainY, trainPredict[:,0]))
testScore = math.sqrt(mean_squared_error(testY, testPredict[:,0]))
I got the following result using the same dataset
Train Score: 0.11 RMSE
Test Score: 0.31 RMSE
My question is have i done the right thing looking at the error from Train Score and Test Score, especially changing trainY[0] to trainY and what is the meaning of the statement
The result seems no bad on picture, but the score is
Train Score: 209747.60 RMSE
Test Score: 59833.18 RMSE
what does RMSE indicate? Could you help me to undestand why this score is so high. What I know from net sources smaller the RMSE, good the model will be, But in figures the model seems good but values are so high. So, this is not good in this case?
RMSE is the roughly the size of the error. If I am predicting the GDP of a country in dollars, having a RMSE of 60 thousand is exceptionally good. But I see your training score is way larger than your test score. That doesn’t look right to me.
Hi Dr. Jason,
I am using your code to run a time series data that has 5 features, below is how I edited the code and the error I obtained concerning the reshaping.
Traceback (most recent call last):
File “C:\Users\eddy\anaconda3\envs\eny\lib\site-packages\IPython\core\interactiveshell.py”, line 3343, in run_code
exec(code_obj, self.user_global_ns, self.user_ns)
File “”, line 36, in
trainPredict=scaler.inverse_transform(trainPredict)
File “C:\Users\eddy\anaconda3\envs\eny\lib\site-packages\sklearn\preprocessing\_data.py”, line 461, in inverse_transform
X -= self.min_
ValueError: non-broadcastable output operand with shape (41466,1) doesn’t match the broadcast shape (41466,5)
~\anaconda3\envs\eny\lib\site-packages\sklearn\preprocessing\_data.py in inverse_transform(self, X)
459 force_all_finite=”allow-nan”)
460
–> 461 X -= self.min_
462 X /= self.scale_
463 return X
ValueError: non-broadcastable output operand with shape (41466,1) doesn’t match the broadcast shape (41466,5)
use data from x(t-N) to x(t) to predict x(t+1); then use data x(t-N+1) to x(t+1) to predict x(t+2), which x(t+1) was predicted rather than actual data you collected. In this way you can predict into the future. The longer you predict, the less accurate it would be.
Dear Dr Jason,
In the coursd of learning how to generate lagged data by a lag factor, I found something quirky about the following abovementioned code:
1
2
3
4
5
6
7
8
# convert an array of values into a dataset matrix
def create_dataset(dataset,look_back=1):
dataX,dataY=[],[]
foriinrange(len(dataset)-look_back-1):
a=dataset[i:(i+look_back),0]
dataX.append(a)
dataY.append(dataset[i+look_back,0])
returnnumpy.array(dataX),numpy.array(dataY)
I will present a SUMMARY, DETAILS, THE RESULTS
SUMMARY:
When I use the above for larger datasets such as the airline passengers, it works.
BUT when I use the create_dataset for smaller arrays of say size 10, I get an two forms of the returned array:
DETAILS
If one uses the passenger data as mentioned in this tutorial and say print out the first five rows:
1
2
3
4
5
6
XY
112118
118132
132129
129121
121135
The shape of X and Y is
shape(trainX) , shape(trainY)
(99,1), (99,1)
In wanting to learn how this procedure works, I tried the following small array:
1
2
3
4
5
6
7
8
9
10
11
from numpy import shape,reshape,array;# not all used
boo=[aforainrange(10)]
#we have a shape of (10,), so we need to reshape the data into (10,1)
boo=reshape(boo,len(boo),1)
shape(boo)
(10,1)
#This is exactly the same form as for trainX, trainY
BUT when we use create_dataset
1
2
3
4
5
6
7
8
9
10
11
12
13
14
15
16
foo,goo=create_dataset(boo,1)
#printing out foo and goo
foo
array([[0],
[1],
[2],
[3],
[4],
[5],
[6],
[7]
[8]]
)
goo
array([1,2,3,4,5,6,7,8,9])
BUT the output form of goo should be same as foo. BUT it isn’t.
Yet the output form of trainX is the same as trainY.
WHY?
I could not see why create_dataset made two different forms of array for foo and goo, BUT for a larger trainX and trainY, the forms were the same.
How did I solve this – i made another version of create_dataset
I had a look again at the create_dataset, this time with look_back = 2.
My question is what is the purpose of look_back = 2 where first returned matrix foo is 7 x 2.
Workings out: where look_back = 1
Using the simple array of
1
2
3
4
5
6
7
8
9
10
11
12
13
doo=[aforainrange(10)]
doo=reshape(doo,(len(doo),1)
doo
array([[0],
[1],
[2],
[3],
[4],
[5],
[6],
[7],
[8],
[9]])
When lookback = 1
1
2
3
4
5
6
7
8
9
10
11
12
13
14
15
16
17
18
19
20
21
22
foo,goo=create_dataset(doo)
foo,goo=create_dataset(doo)
foo
array([[0],
[1],
[2],
[3],
[4],
[5],
[6],
[7]])
goo
array([[1],
[2],
[3],
[4],
[5],
[6],
[7],
[8]])
Workings out – where look_back = 2
But when I set look_back to 2
1
2
3
4
5
6
7
8
9
10
11
foo,goo=create_dataset(doo,2)
foo
array([[0,1],
[1,2],
[2,3],
[3,4],
[4,5],
[5,6],
[6,7]])
>>>goo
array([2,3,4,5,6,7,8])
Questions:
What is the purpose of the look_back, where look_back >= 2?
For look_back = 2, what is the purpose of the foo being a 7 x 2 matrix, while goo is a 1 x , matrix?
In other words, what is the purpose of the look_back function where look_back >= 2
For the create_dataset() function, what it does is to take a time series A(t) to create X=[A(t-n), …, A(t-1)] and y=A(t) for a sequence of t, and n is the look_back
Therefore, you should not see X and y the same.
Look back means how much you want to consider to predict X(t). If look back is zero (which doesn’t make sense), you are like guessing X(t) without any information. If it is 2, it means you consider t-2 and t-1 to predict t
I was wondering, your dataset is composed of data for each month, which allows you to make predictions based on the number of months. But if your dataset is event based, I have a sensor that gives me information for each variation of +/- 10%, if the value does not change for 1 month and then it changes every minute, it will be a problem when predicting because if I want to predict the next event it could happen in a minute or in a month, right?
So my question is, how to manage the problem if the dataset is event-driven?
I have no good answer for that. Probably you shouldn’t consider that as a time series problem because the data is not depend on time at all (according to what you described, it is based on events). Is there anything outside of your time series can help you predict for the event? That might be something you want to explore.
The manufacturer made this choice of this kind of data backup in order to save the memory of the system. The goal being from this kind of data to predict when there could be a failure (predictive maintenance).
Hello Dr. Jason,
I am trying to print out the actual value with the predicted value, so I used the following code
df = pd.DataFrame({‘Actual’: test,’Predicted’: testPredict}, index=[0])
print(df)
I received the following error when I run the program
Exception: Data must be 1-dimensional
Is there any better way of writing this code sir
Hello Dr. Brownlee ! What a great tutorial!!! Amazing code really! I have some questions, if you can help me:
1) I use a dataset of 10.000 measurements, and the splitting between testing and training is the way you have it in your code. When I see the loss functions, although the shape is correct, and test loss function is lower than train loss function, the problem is that the “starting” value of those functions are 0,020 (for train), and 0,008 (for testing) and then they fall even lower from 2nd, 3rd epochs. Why do I get such low values, so early?
2) I see extremely high accuracy between the predicted values on unseen dataset. Does this have to do with overfitting, or is it something else?
3) I used dropout, but the difference was that the loss functions started from around 0.2 and started decreasing until they stabilized. What other methods should I use in order to avoid overfitting?
4) What is the rationale behind the number of cells on LSTM you used, and more generally how big/small should the LSTM be?
5) Is there any type of bias in your model? For instance optimized for your data you have?
Your blog helped me to improve myself in many ways thanks for sharing this kind of wonderful informative blogs in live. I also love your website because all type of information is available in your blogs. You made my day. Thanks you for everything.
I created a one liner model that predicts (without prior training) that the next value is equal to the previous one and I get RMSE = 33.71 against 47.53 in the LSTM model:
What prompted me to check this out is the fact that with look_back=1 the LSTM model only uses the previous value to guess the next.
Using a look_back=12 gives a RMSE of 24.34, a significant improvement. With a lookback=24, the RMSE drops to 20.35. The larger errors are located at the peaks that are underestimated.
Not dismissing the utility of RMSE which I am certain has good use cases, this toy problem could better be predicted by using a general trend upward and estimating the variability due to seasonality.
Hi Tarik…Machine learning model performance is relative, not absolute.
Start by evaluating a baseline method, for example:
Classification: Predict the most common class value.
Regression: Predict the average output value.
Time Series: Predict the previous time step as the current time step.
Evaluate the performance of the baseline method.
A model has skill if the performance is better than the performance of the baseline model. This is what we mean when we talk about model skill being relative, not absolute, it is relative to the skill of the baseline method.
Additionally, model skill is best interpreted by experts in the problem domain.
For more on this topic, see the post:
How To Know if Your Machine Learning Model Has Good Performance
Hello Dr. Jason,
pleas can help me
I work on the video frame in time series,i want to find some thing can help me in lstm to decide if this frame came before this time or not
thanks for replay
I work on a network camera, in every second I capture 32 frames, I want reduction the number of transmitted frames to another side,
I want to use lstm because it works with time series,
I can’t find anything to help me in deciding to ignore the next frame because I send it before.
Wonderful and very helpful thanks. I would like to ask, that I have time series data for 120 months (so 120 events all have fixed 30 days of Time (X) , and Weather (Y) data) and each of these data comes with a single label predicting the weather like winter, summer, autumn or spring. How can I classify and forecast this target weather class from these 120 events ?thanks
I will make a meta model with spline data.
Input will be Akima spline with 9points and output will be a spline with data set(x:time, y:displacement graph).
In this case, is it right to choose LSTM?
Can LSTM take spline input(or 9points) and make a spline(or data set) output??
If not, what kind of deep learning method should I choose?
If we have a model that input of model is (for example) 7 point in past until now, and output of model is exactly next point of future, and for prediction our model always repeat last value, instead of predict next point, what does it mean? what is model problem?
Assuming that, our data does not have seasonal characteristics and trend, Also we have enough of history of data.
But, behavior in past of history of data is repeated in future. means:
1-Behavior of data is not 100% random.
2-History repeats.
3-Behavior of data is somehow based in psychology and behavior of humans.
I thing my model can not predict next point of time series and it repeats last point, just because it is not enough deep, however when I create a more deeper model, prediction becomes a fix number, for example model always give me a fix number like “1.2345 as output.”
I used several structures of LSTM, Conv1D, Dense…
But I could not become near to predict true.
Thanks for spending your time for reading this text.
Thank You for Your tutorial, it was really helpful.
I have one question, why there is so low epoch loss (eg.0.0022) and then when you calculate error using function mean_squared_error the error is much higher?
Example:
Epoch 100/100
92/92 – 0s – loss: 0.0022 – 35ms/epoch – 384us/step <—- why so low
Train Score: 24.86 RMSE <—- why so high
Hi Kinga…The terms “low” and “high” are relative terms. I would recommend establishing a baseline for your predictions using a statistical method such as ARIMA and then compare your LSTM model to the performance of the ARIMA model. In other words, in machine learning there is no level of loss or RMSE that is considered “low” or “high” without being referenced to the performance of another model.
Thanks for being a great contributor for the data science community. Your posts and tutorials are so amazing.
I need you help in choosing the window size or timestep? how I can tackle this value for different trends and seasonalities. Do I need to consider ACF and PACF for this? Is there any automated gridsearch kind of will help to solve this?
If you could share some insights and guidance will be really helpful.
Just a silly question, we know that the LSTM makes prediction based on the previous x time steps (x is set manually by user), if the LSTM is trained on the training dataset (lets say only 10 samples in the training dataset, and time step is 3), so that LSTM will only use sample 8th,9th,10th to do the prediction on the testing dataset. If the testing dataset contains 10 samples as well, hence, when do the testing, 8th,9th,10th records in training dataset will be used to do the prediction for the 1st record in testing dataset, and 8th,9th,10th records will be used again to do the prediction for 2nd record in testing dataset as well right? Due to the reason that 1st record in testing is not used during the training phase?
And this leads to my second question, should the records in training and testing are all closely related in time series to let the LSTM work? For example, the 10 training samples produced in the first hour, and second hour another 10 samples are produced, what if we use the 10 samples produced in the first hour as the training and use the 10 samples produced in the third hour as testing dataset (one hour gap in between), will the LSTM still work?
Am I right above? Looking forward to hearing from you 🙂
Hi Jason, thanks for this tutorial. I wanted to know if LSTM can be used to generate a time series for a non time series type input. For example, I have an input with 10 features (not time dependent) and I want to train the lstm network with the time series corresponding to this input. I have already done it. But I wanted to know if it is a usual method? Because I mainly see the example of predicting future time dependent values given the past values.
hi, my use case involves predicting 4 features using time series analysis. For example, in your use-case case, if there would have been 4 different places to predict their temperature, would you be using the same model or would have created 4 different models for each place ?
How to proceed with predicting multiple features using time series analysis ?
Hi Jason…on the stacked LSTM’s is there a limit for how many “layers” you can add? Is it similar to MLP where you just experiment with adding hidden layers to model architecture? Its where you add in this to the last section of the tutorial:
Hi Jason,
In the first section you use the look_back = 1, which means that you look back at one value in the past to predict the future, from what I understood.
You also showed cases of increasing this memory by utilizing “windowing” that allows to increase the look_back to larger number.
My question is regarding using look_back = 1. From what I know LSTM has cell states and gates and suppose to internally take into account the past data as it has a “memory” of the past, that is independent of windowing.
If LSTM in itself is “remembering” the past, then why is windowing needed? –
This is so good. The model performs so well. Thank you.
Moving on, I’m looking to forecast the next 200 timesteps of the target timeseries where I have the data for the other x-variable timeseries but not the target timeseries. I’ve implemented a code such that I predict a single timestep at one time with the n lookback rows of target and x-variable timesteps. But I a diminishing return of a plot where the signature is totally differnt from the past history and I know it is obviously incorrect. Any idea on how to implement this? My code is as below:
for i in range(num_iterations):
i=0
# select last n rows of data4 starting from index
The predicted variable for the 200 timestep is way off. when compared to historical. I’m confused as to how I’m able to get a good match during my training and testing but future prediction is way off.
Thank you very much for your answer. In fact, your approach and the link to Flavia Giammarino helped me a lot. The crucial point seems to be the number of dense layers.
So I am happy to be able to continue my work thanks to your help.
I wanted to express my gratitude for your tutorial – it has been quite enlightening. I have a question regarding the process of creating a dataset for testing, particularly when dealing with a look back.
For instance, when we set the look back to 10 and predict the 11th data point, we utilize the past 10 data points for this prediction. However, when it comes to predicting the 12th data point, there seems to be some ambiguity. Should we use the 10 past data points, or should we include the predicted value from the 11th data point and the preceding 9 data points?
Interestingly, I’ve come across videos where the predicted data is used in the look back. Could you kindly confirm whether this is indeed the correct approach?
Hi Farnoush…You are very welcome! Often there is a “history” maintained that performs exactly as you have described. Essentially, predicted values are used to help make future predictions. In this way, the model learns from the original data and the predicted values.
thanks for sharing. I want to predict failure of a industrial pump or any industrial machine with having time series multiple features data. I want to predict failure before a week how to do it ?
Hi Muhammad…Predicting the failure of an industrial pump or any machine using time series data with LSTM Recurrent Neural Networks (RNNs) in Python with Keras involves several key steps. Here’s a step-by-step guide on how to approach this problem:
### 1. **Data Preparation**
– **Collect Data**: Gather historical data that includes multiple features (e.g., temperature, pressure, vibration, flow rate, etc.) and the corresponding failure labels.
– **Preprocess Data**:
– Handle missing data by imputation or removing rows/columns if necessary.
– Normalize/scale the data, as LSTMs work better with normalized inputs.
– Create a sliding window of time series data that includes several days (e.g., a week) of data leading up to the prediction point.
### 2. **Feature Engineering**
– **Create Lag Features**: Generate lag features by shifting the time series data to incorporate past values into the model.
– **Generate Rolling Statistics**: Add rolling mean, standard deviation, or other statistical features to capture trends over time.
– **Target Variable**: Define the target variable, which could be binary (0 for normal operation, 1 for failure) or a more granular approach indicating the likelihood of failure.
### 3. **Model Design**
– **Input Shape**: LSTM expects a 3D input shape (samples, timesteps, features). Ensure your data is reshaped accordingly.
– **LSTM Layers**:
– Start with one or more LSTM layers. Experiment with the number of units (e.g., 50-200).
– Add Dropout layers to prevent overfitting.
– Optionally, include Dense layers after the LSTM layers for further processing.
– **Output Layer**: If it’s a binary classification problem, use a Dense layer with a sigmoid activation function.
python
from keras.models import Sequential
from keras.layers import LSTM, Dense, Dropout
model = Sequential()
model.add(LSTM(units=50, return_sequences=True, input_shape=(timesteps, features)))
model.add(Dropout(0.2))
model.add(LSTM(units=50))
model.add(Dropout(0.2))
model.add(Dense(1, activation='sigmoid')) # For binary classification
### 4. **Training the Model**
– **Train-Test Split**: Split your data into training and testing sets. Ensure the split preserves the time series order (do not shuffle the data).
– **Training**: Train the model using your training dataset. Monitor the validation loss to avoid overfitting.
### 5. **Evaluation**
– **Evaluate Performance**: Use metrics like accuracy, F1-score, precision, and recall to evaluate your model’s performance. Consider using a confusion matrix to understand false positives/negatives.
– **Model Tuning**: Experiment with hyperparameters like learning rate, number of epochs, batch size, and LSTM units.
### 6. **Prediction**
– **Make Predictions**: Once the model is trained, you can predict failures a week in advance by feeding the model with the latest time series data.
python
predictions = model.predict(X_test)
### 7. **Deployment**
– **Model Deployment**: After validation, deploy the model to monitor real-time data from the industrial machine and predict potential failures.
– **Alerting System**: Integrate an alerting system that triggers warnings if the model predicts a failure within the next week.
### 8. **Continuous Improvement**
– **Model Retraining**: Periodically retrain the model with new data to improve accuracy and adapt to changing conditions.
– **Feature Updates**: Continuously monitor and update the features used for prediction as the machine’s behavior or environmental conditions change.
This approach should help you predict the failure of an industrial machine in advance, allowing for preventive maintenance and reducing downtime.
The slice notation here is really confusing. You start out slicing the dataset into the test and training set.
train, test = dataset[0:train_size,:], dataset[train_size:len(dataset),:]
The normal notation for this type of slicing is dataset[start:stop:step]
Why add the comma? It does not make any difference but adds a lot of confusion for python users trying to figure out what you are doing? Remove the comma and the code works without it.
Hi Garth…The comma in the slicing notation is used because dataset is a **NumPy array** or a **Pandas DataFrame**, and it allows indexing along multiple dimensions.
### Breaking It Down: python
train, test = dataset[0:train_size,:], dataset[train_size:len(dataset),:]
– dataset[0:train_size, :] → Selects **rows** from 0 to train_size and **all columns** (:).
– dataset[train_size:len(dataset), :] → Selects **rows** from train_size to the end (len(dataset)) and **all columns** (:).
### Why is the comma there?
In NumPy and Pandas, when dealing with **multidimensional arrays or tables**, indexing is done as: python
array[row_slice, column_slice]
This is different from standard Python lists, where slicing applies to just one dimension.
### What if we remove the comma?
If dataset is a **NumPy array** or **Pandas DataFrame**, removing the comma would cause an error or result in unintended behavior. However, if dataset is just a **Python list of lists**, the comma is unnecessary because Python list slicing does not support multi-dimensional indexing.
### What should you do?
– If dataset is a **NumPy array** or **Pandas DataFrame**, keep the comma.
– If dataset is a **plain Python list**, remove the comma, as list slicing doesn’t use multi-dimensional indexing.
I am working with a labeled dataset (0 and 1) related to stroke prediction. The dataset includes four physiological features: heart rate, oxygen saturation (SpO2), diastolic blood pressure, and systolic blood pressure.
My objective is to develop an early detection model using LSTM to predict stroke occurrence 5 to 10 minutes in advance. The data is time-series, recorded at one-second intervals.
Could you please advise on how to effectively approach early stroke prediction using LSTM? Additionally, how should I determine the optimal sliding window size for capturing relevant temporal patterns in this dataset?
You’re working on a meaningful and complex task—using physiological time-series data to predict strokes in advance. Choosing an LSTM (Long Short-Term Memory) model is a great decision, especially since it’s designed to handle sequential data like physiological signals. Let’s walk through a structured way to approach this.
—
1. Understanding the Problem
Goal:
You want to predict whether a stroke will occur (yes = 1, no = 0) about 5 to 10 minutes before it happens, using second-by-second measurements of physiological signals.
Since the data is recorded every second, predicting 5–10 minutes in advance means you’re forecasting 300 to 600 seconds into the future.
—
2. Preparing the Data
Step A: Preprocessing
* Normalize or standardize the input features using methods like Z-score or Min-Max scaling.
* Deal with any missing values using techniques like linear interpolation or forward fill.
* If the signals are noisy, you might want to use filters like moving average or Savitzky–Golay.
Step B: Creating Input Sequences
You’ll need to transform your raw time-series into a supervised format, where:
* X (input) = a sequence of past values (say, the last 60 seconds)
* y (label) = the binary outcome (stroke or no stroke) 5–10 minutes later
Here’s an example function for generating that:
python
def create_sequences(data, labels, lookback=60, horizon=300):
X, y = [], []
for i in range(len(data) - lookback - horizon):
X.append(data[i:i+lookback])
y.append(labels[i+lookback+horizon])
return np.array(X), np.array(y)
You could even train multiple models for different prediction horizons and combine their results.
—
3. Choosing the Best Window Size
There’s no single best answer here, but you can follow a practical approach:
* Try common lookback ranges like 30, 60, 90, or 120 seconds
* Strokes may show subtle signs a minute or two beforehand
Use cross-validation to compare different window sizes and measure performance using metrics like:
* F1 Score
* Recall (very important in medical predictions)
* AUC (Area Under ROC Curve)
—
4. Designing the LSTM Model
Here’s a simple model structure for binary classification using LSTM:
python
from tensorflow.keras.models import Sequential
from tensorflow.keras.layers import LSTM, Dense, Dropout
Consider using early stopping based on validation AUC or recall to prevent overfitting.
—
5. Dealing with Imbalanced Data
If strokes are rare in your dataset, you’ll need to address the imbalance. You can:
* Use resampling techniques like SMOTE or ADASYN
* Try undersampling the majority class
* Add class weights to the loss function
For example:
python
from sklearn.utils import class_weight
weights = class_weight.compute_class_weight('balanced', classes=np.unique(y_train), y=y_train)
Or explicitly set class weights during model compilation:
python
model.compile(loss='binary_crossentropy', optimizer='adam',
metrics=['accuracy', 'AUC', 'Recall'],
loss_weights={0: 1, 1: 10}) # adjust the weights as needed
—
6. Evaluation Metrics
Since this is about early detection, prioritize:
* Recall (catching as many stroke events as possible)
* AUC-ROC
* Precision-Recall curves
* Lead time accuracy (Did the model detect the event early enough?)
—
7. Visualizing the Results
You can improve your understanding and communication of the model’s performance by plotting:
* Predicted probabilities over time
* Correct vs incorrect predictions
* Physiological trends before the stroke events
—
8. Further Ideas to Explore
* Add temporal features like rolling averages or standard deviations
* Try bidirectional LSTMs to capture more context
* Consider experimenting with transformer-based models for time-series data
WOW! Great content, great site, my new first choice for learning NN concepts. Many thanx.
Have a few questions, will trickle them in as I progress thru working your examples and attempt to modify them to my data. Assuming, hopefully, that you still monitor your earlier work. Just a general one here. Above you note:
”’
Updated LSTM Time Series Forecasting Posts:
The example in this post is quite dated. You can view some better examples using LSTMs on time series with:
LSTMs for Univariate Time Series Forecasting
LSTMs for Multivariate Time Series Forecasting
LSTMs for Multi-Step Time Series Forecasting
”’
However, all three recommended posts are actually older(?) than this one. How can they be _less_ dated than this newer post? Or are you referring to them being better approaches to these types of problems?

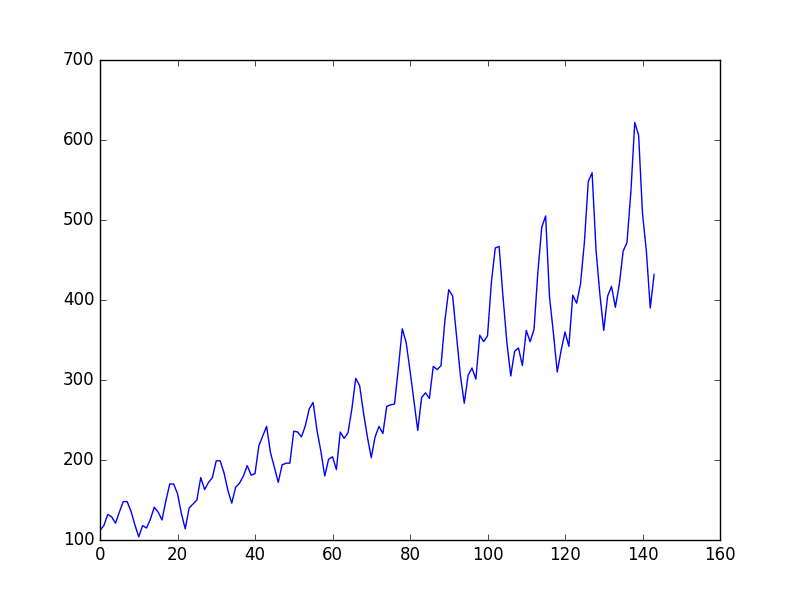
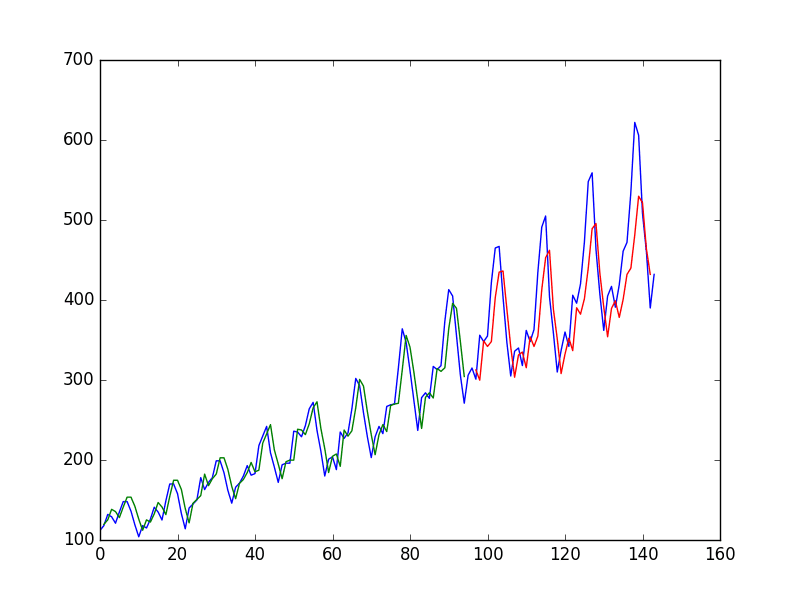
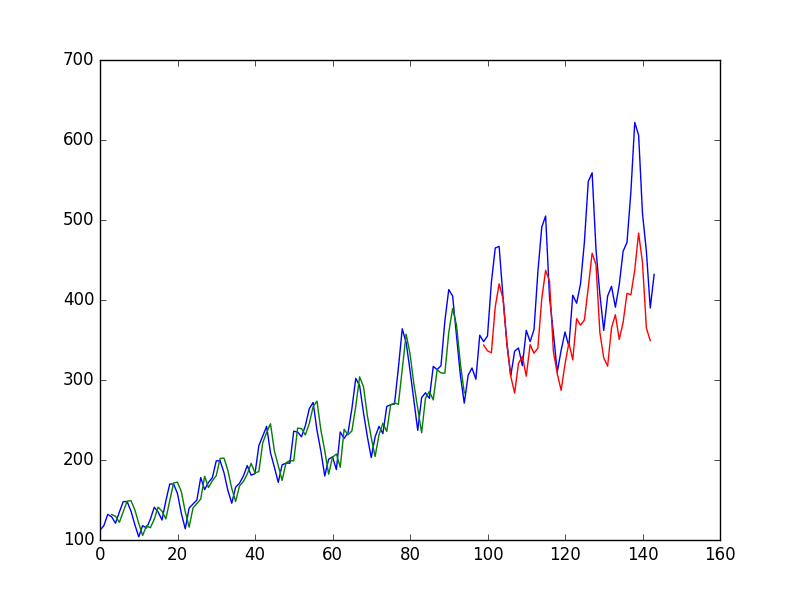
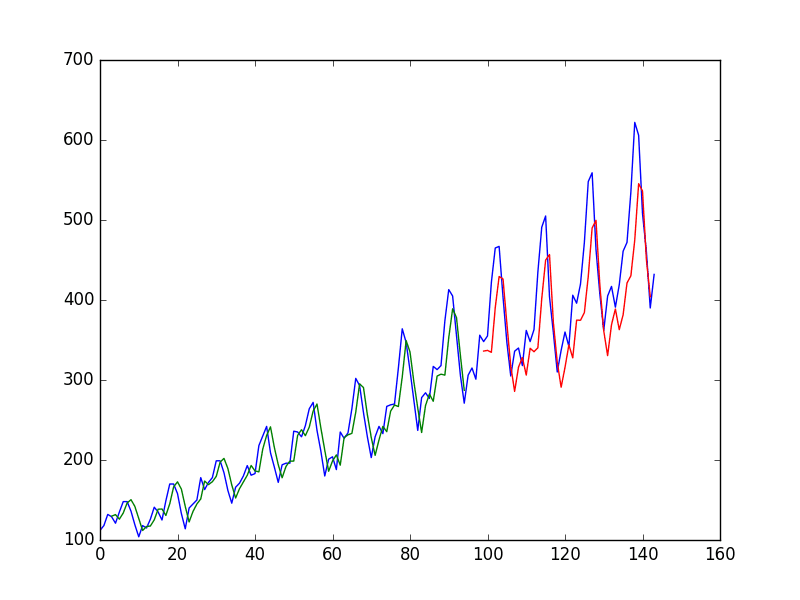
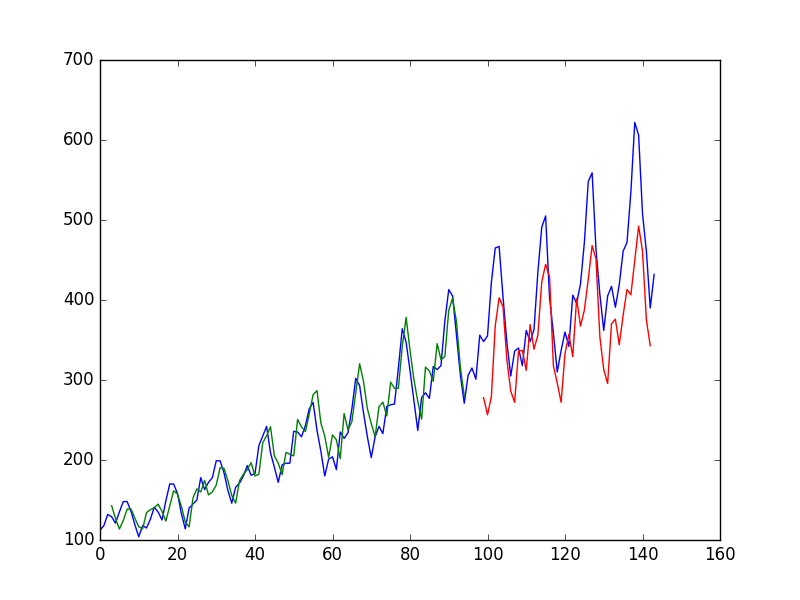
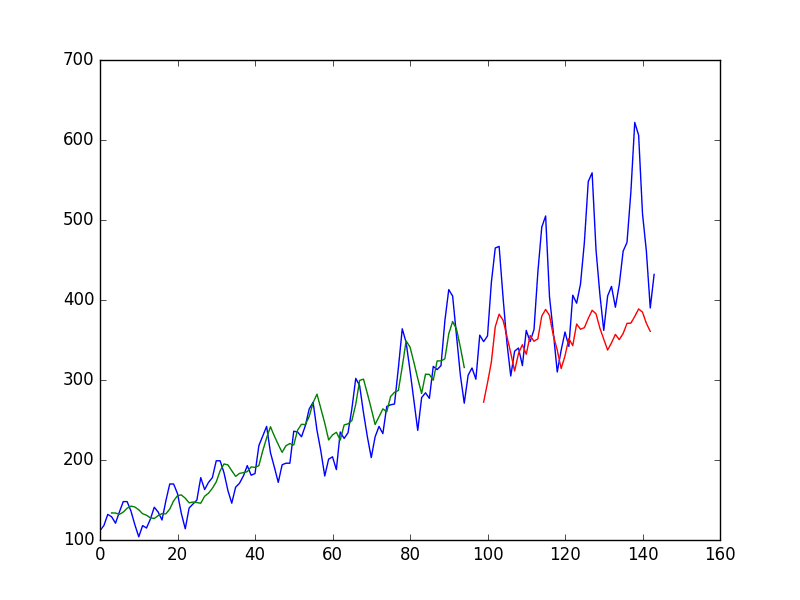


I like Keras, the example is excellent.
Thanks.
Hi, thanks for your awesome tutorial!
I just don’t get one thing… If you’d like to predict 1 step in the future, why does the red line stop before the blue line does?
So for example, we have the testset untill end of the year 1960. How can i predict the future year? Or passangers at the 1/1/1961 (if dataset ends at 12/31/1960).
Best,
Robin
Great question, there might be a small bug in how I am displaying the predictions in the plot.
Hey, great tutorial.
I have the same question about the future prediction. The “testPredict” has two fewer rows that the “test” once the algorithm is done running, how would I obtain the values for the a prediction 1 or 2 days ahead from the end date of the time series? Thanks.
Terrence
I think in the ”create_dataset” function, the range should be “len(dataset)-look_back” but not “len(dataset)-look_back-1”. No “1”should be subtracted here.
Hi Jason,
how to fix this bug? what modifications you need to make in the code to predict the values for 1/31/1961, if the dataset ends at 12/31/1960?
excellent lecture! but I still feel somehow cofused about lstm. I think the timesteps of 1 and feature_size of 3 have made a great job. However, when exchange them, with 3 timesteps in lstm, the prediction at time t+1 seems like a value a little lower than the ground truth value at time t, which make the prediction curve shift to the right of the true value. It seems that lstm only learn memory from last step and makes it a little delay.
Perhaps this might help:
https://machinelearningmastery.com/faq/single-faq/what-is-the-difference-between-samples-timesteps-and-features-for-lstm-input
Sir,
Please let me know, how I can make a future prediction for next 30 or 60 or 90 days. Please help me making that forecast prediction.
Sincerely,
Bikash Kumar, India.
I show how here:
https://machinelearningmastery.com/faq/single-faq/how-do-you-use-lstms-for-multi-step-time-series-forecasting
Hi,
Please, could you explain to us why the prediction (red) is shifted by one step from the blue plot, because when we try to predict 4 of 8 steps the plot is shifted by 4 or 8 steps too. Note that the test set construction is correct. The plot is correct.
Yes, the model has learned a persistence model:
https://machinelearningmastery.com/faq/single-faq/why-is-my-forecasted-time-series-right-behind-the-actual-time-series
Yes, the model requires tuning, perhaps start here:
https://machinelearningmastery.com/start-here/#deep_learning_time_series
Sir,did you fixed that bug in displaying the predictions in the plot. or do you know how to fix it?
Zhang, I think I arrived at this conclusion too.
Hi Robin,
Are you up with a solution for the bug? as you rightly said, the testpredict is smaller than test. How do you modify the code so that it predicts the value on 1/1/1961?
I have tried to check how to fix the bug. Simply delect the -1 in line 14 and for
testPredictPlot[len(trainPredict)+(look_back*2)+1:len(dataset)-1, :] = testPredict
replace it with
testPredictPlot[len(trainPredict)+(look_back):len(dataset)-1, :] = testPredict
The challenge would be that the length of the list would 1 less. but in that way the bug is fixed.
Hello Jason,
Thanks for sharing this great tutorial! Can you please also suggest the way to get the forward forecast based on the LSTM method. For example, if we want to forecast the value of the series for the next few weeks (ahead of current time–As we usually do for the any time series data), then what would be process to do that.
Regards
Shovon
Hi Shovon,
I would suggest reframing the problem to predict a long output sequence, then develop a model on this framing of the problem.
Hi Jason,
Can you elaborate a bit on what is the use of modeling a time-series without being able to make predictions of future time? I ask because I’m learning LSTMs and I’m facing the same issue as the person above: I can model a time series and make accurate predictions for data that I already have, but have difficulty predicting future observations.
Thanks a bunch.
Time series analysis is the study of time series without the interest in making predictions.
I am surprised that you mention “Time series analysis is the study of time series without the interest in making predictions.”.
But can this tutorial be used to predict future? Especially how to wrap the input data and un-wrap the prediction? My wild guess is:
normalize -> predict -> de-normalize
Is this correct?
Here we are differentiating between “analysis” and “forecasting” tasks.
I only have tutorials on forecasting, I don’t write about analysis.
Can RNN be used on Input with multi-variables?
Yes. LSTMs can take multiple input features.
Thanks for this great tutorial Jason. I’m still having trouble figuring out what kind of graph do you get when you do this:
# create and fit the LSTM network
model = Sequential()
model.add(LSTM(4, input_shape=(1, look_back)))
model.add(Dense(1))
for instance if your lookback=1: the input is one value xt, and the target output is xt+1. How is “LSTM(4, input_shape=(1, look_back))” linking your LSTM blocks with the input?
Or do you have 1 input => 1 LSTM block which hidden value (output of the LSTM) is fed to a 4X1 dense MLP? So that the output of the LSTM is actually the input of a 1x4x1 MLP…
And if your input is [xt-1, xt] with target xt+1 (lookback=2), you have two LSTMs blocks (fed with xt-1 and xt respectively) and the hidden value of the second block is the input of a 1x4x1 MLP.
I hope I’m being clear, I really have troubles answering this question. Your tutorial helps though!
The input_shape define the input, the LSTM is the first hidden layer, the Dense is the output layer.
Try this to get an idea of the graph:
Hi,
How we can expand future vector to use more than one indicator to predict future value?
Thanks
See this tutorial:
https://machinelearningmastery.com/multivariate-time-series-forecasting-lstms-keras/
thanks Jason !! great tutorial .
I want to know how to use four variable like latitude,longitude,altitude and weather parameter for aircraft trajectory prediction using LSTM and HMM(Hidden Marcov Model). thanks.
Perhaps start here:
https://machinelearningmastery.com/faq/single-faq/what-is-the-difference-between-samples-timesteps-and-features-for-lstm-input
Hi,
If I want to forecast next say 1000 values. What code would be look like for LSTM above algorithm?
I have examples here:
https://machinelearningmastery.com/faq/single-faq/how-do-you-use-lstms-for-multi-step-time-series-forecasting
Hi Dr json,
Can we emphasize more on one variable in to predict via lstm???
The model will figure out what is important in the data during training. No need to tell it at inference/prediction time.
what about unsupervised learning?
Hi McMirr…You may find the following resource helpful:
https://machinelearningmastery.com/supervised-and-unsupervised-machine-learning-algorithms/
Thanks for your sharing. I am still struggling how to do a real future 30 days prediction based on the current program. I am thinking to loop it as tomorrow prediction is based on latest 60 days in history. Then, the day after tomorrow is the latest 59 days plus the prediction of tomorrow.
How do it implement it & extend it? The current one is not applicable to real world application. Please suggest whether I am on the right track.
Change the output layer to have 30 nodes. Then train the model to make 30 day predictions.
Wow thiis is a very interesting algorithm for time series prediction. Who came up with this formula, whoever did should get some credit for it. I would really like to thank them.
Hi, thanks for the walkthrough. I’ve tried modifying the code to run the network for online prediction, but I’m having some issues. Would you be willing to take a look at my SO question? http://stackoverflow.com/questions/38313673/lstm-with-keras-for-mini-batch-training-and-online-testing
Cheers,
Alex
Sorry Alex, you’re question is a little vague.
It’s of the order “I have data like this…, what is the best way to model this problem”. It’s a tough StackOverflow question because it’s an open question rather than a specific technical question.
Generally, my answer would be “no idea, try lots of stuff and see what works best”.
I think your notion of online might also be confused (or I’m confused). Have you seen online implementations of LSTM? Keras does not support it as far as I know. You train your model then you make predictions. Unless of course you mean the maintained state of the model – but this is not online learning, it is just static model with state, the weights are not updated in an online manner unless you re-train your model frequently.
It might be worth stepping back from the code and taking some time to clearly define I/O of the problem and requirements to then figure out the right kind of algorithm/setup you need to solve it.
Hello Dr. Brownlee,
I have a question about the difference between the Time Steps and Windows method. Am I correct in understanding that the only difference is the shape of the data you feeding into the model? If so, can you give some intuition why the Time Steps method works better? If I have two sequences (For example, if I have 2 noisy signals, one noisier than the other), and I’m using them both to predict a sequence, which method do you think is better?
Best
Hi Tommy,
The window method creates new features, like new attributes for the model, where as timesteps are a sequence within a batch for a given feature.
I would not say one works better than another, the examples in this post are for demonstration only and are not tuned.
I would advise you to try both methods and see what works best, or frame your problem in the way that best makes sense.
Hi Dr Brownlee
First thanks for your brilliant website. You mentioned that new lags are new features so in this particular what is the best number of lags for multivariate multi-target forecasting by lstm? Should I apply correlation in series or test randomly??? Does it affect the result if I consider the lag number too high?
Hi Arman…You are very welcome! The following resource may be of interest to you.
https://stats.stackexchange.com/questions/576989/how-to-minimize-prediction-lag-using-lstm-model
Hi Jason,
What are the hyperparameters of your network?
Thanks,
Pedro
Hi Pedro, the hyperparameters for each network are available right there in the code.
Is it possible to perform hyperparameter optimization of the LTSM, for example using hyperopt?
I don’t see why not Evgeni., Sorry I don’t have an example.
Hi Jason,
Interesting post and a very useful website! Can I use LSTMS for time series classification, for a binary supervised problem? My data is arranged as time steps of 1 hr sequences leading up to an event and the occurrence and non-occurrence of the event are labelled in each instance. I have done a bit of research and have not seen many use cases in the literature. Do you think a different recurrent neural net or simpler MLP might work better in this case? Most of my the research done in my area has got OK results(70% accuracy) from feed forward neural networks and i thought to try out recurrent neural nets, specifically LSTMs to improve my accuracy.
I don’t see why not Jack.
I would suggest using a standard MLP with the window method as the baseline, then develop some LSTMs for comparison. I would expect LSTMs to generally perform better if there is information in the long sequences.
This post on binary classification may help, you can combine some of the details with the LSTMs in this post (e.g. the specifics of the Dense output layer and loss function):
https://machinelearningmastery.com/binary-classification-tutorial-with-the-keras-deep-learning-library/
Hi Jason,
Thanks for this example. I ran the first code example (lookback=1) by just copying the code and can reproduce your train and test scores precisely, however my graph looks differently. Specifically for me the predicted graph (green and red lines) looks as if it is shifted by one to the right in comparison to what I see on this page. It also looks like the predicted graph starts at x=0 in your example, but my predicted graph starts at 1. So in my case it looks like the prediction is almost like predicting identity? Is there a way for me to verify what I could have done wrong?
Thanks,
Peter
Thanks Peter.
I think you’re right, I need to update my graphs in the post.
Hi Jason,
when outputting the train and test score, you scale the output of the model.evaluate with the minmaxscaler to match into the original scale. I am not sure if I understand that correctly. The data values are between 104 and 622, the trainScore (which is the mean squared error) will be scaled into that range using a linear mapping, right? So your transformed trainscore can never be lower than the minimum of the dataset, i.e. 104. Shouldn’t the square root of the trainScore be transformed and then the minimum of the range be subtracted and squared again to get the mean square error in the original domain range? Like numpy.square(scalar.inverse_transform([[nump.sqrt(trainScore)]])-scaler.data_min_)
Thanks,
Peter
Hi Peter, you may have found a bug, thanks.
I believe I thought the default evaluation metric was RMSE rather than MSE and I was using the scaler to transform the RMSE score back into original units.
I will update the examples ASAP.
Update: All estimates of model error were updated to first convert the error score to RMSE and then invert scale transform back to original units.
I would also point out that the normalization is learnt on the whole dataset.
Shouldn’t it be learnt after the train/test split?
Hi Peblo…Your understanding is correct! The following resource provides additional best practices regarding train/validation/test splits:
https://machinelearningmastery.com/training-validation-test-split-and-cross-validation-done-right/
Thank you for your excellent post.
I have one question.
In your examples, you are discussing a predictor such as {x(t-2),x(t-1),x(t)} -> x(t+1).
I want to know how to implement a predictor like {x(t-2),x(t-1),x(t)} -> {x(t+1), x(t+2)}.
Could you tell me how to do so?
This is a sequence in and sequence out type problem.
I believe you prepare the dataset in this form and model it directly with LSTMs and MLPs.
I don’t have a worked example at this stage for you, but I believe it would be straight forward.
Hi,
First of all thanks for the tutorial. An excellent one at that.
However, I do have some questions regarding the underlying architecture that I’m trying to reconcile with what I’ve done learnt about. I posted a question here: http://stackoverflow.com/questions/38714959/understanding-keras-lstms which I felt was too long to post in this forum.
I would really appreciate your input, especially the question on time_steps vs features argument.
Thanks,
Sachin
If I understand correctly, you want more elaboration on time steps vs features?
Features are your input variables. In this airline example we only have one input variable, but we can contrive multiple input variables using past time steps in what is called the window method. Normally, multiple features would be a multivariate time series.
Timesteps are the sequence through time for a give attribute. As we comment in the tutorial, this is the natural mapping of the problem onto LSTMs for this airline problem.
You always need a 3D array as input for LSTMs [samples, features, timesteps], but you can reduce each dimension to one if needed. We explore this ability in reframe the problem in the tutorial above.
You also ask about the point of stateful. It is helpful to have memory between batches over one training run. If we keep all of out time series samples in order, the method can learn the relationships between values across batches. If we did not enable the stateful parameter, the algorithm we no knowledge beyond each batch, much like a MLP.
I hope that helps, I’m happy to dig into a specific topic further if you have more questions.
Dr. Jason,
I think this is a good place to bring this question. Suppose if I have X_train, X_test, y_train and y_test, should I transform all the values into a np.array? If I have in this format, should I still use ‘create_dataset’ function to create X and y?
Yes Jack.
Generally, prepare your data consistently.
Dr Jason,
I have an hourly time series with multiple predictor variables. I skipped
create_datasetand just converted all my X_train, X_test, y_train and y_test into np arrays. The reason is, ex: I use past three months as my training and I would like to predict for next 7 days, which will be about 168 observations. If this is the case, if I happen to prepare consistent, would my ‘look_back = 168’ increate_datasetfunction?I would recommend preparing data with the function in this post:
https://machinelearningmastery.com/convert-time-series-supervised-learning-problem-python/
Dr. Jason,
After a deep thought and research I am thinking to just use my X_train, y_train, X_test and y_test without doing a look back. The reason is, y_train is dependent on on my X_train features. Therefore, my gut feeling is not use look back or sliding window. I just wanted to confirm with you and please let me know if I am on right track. BTW, when are you planning on doing a multivariate time series analysis? if you can educate us on that, it will be great. Thank you sir!
You may not need an LSTM if there is no input sequence, consider an MLP.
So does that mean (in reference to the LSTM diagram in http://colah.github.io/posts/2015-08-Understanding-LSTMs/) that the cell memory is not passed between consecutive lstms if stateful=false (i.e. set to zero)? Or do you mean cell memory is reset to zero between consecutive batches (In this tutorial batch_size is 1). Although I guess I should point out that the hidden layer values are passed on, so it will still be different to a MLP (wouldn’t it?)
On a side note, the fact that the output has to be a factor of batch_size seems to be confounding. Feels like it limits me to using a batch_size of one.
If stateful is set to false (the default), then I understand according to the Keras documentation that the state within each LSTM node is reset after each batch, either for prediction or training.
This is useful if you do not want to use LSTMs in a stateful manner of you want to train with all of the required memory to learn from within each batch.
This does tie into the limit on batch size for prediction. The TF/Theano structures created from this network definition are optimized for the batch size.
I’m super confused here. If the LSTM node is reset after each batch (in this case batch_size 1), does that mean in each forward-backprop session, the LSTM starts with a fresh state without any memory of previous inputs, and it’s only input is a single value? If that’s the case, how could it possibly learn anything?
E.g., let’s say on both time step 10 and 15 the input value is 150, how does the network predict step (10+1) to be 180 and step (15+1) to be 130 while the only input is 150 and the LSTM start with a fresh state?
Hi Mango, I think you’re right. If the number of time-steps is one and the LSTM is not stateful, then I don’t think he is using the recurrent property of the LSTM at all.
Hi!
First of all, thank you for that great post
I have just one small question: For some research work i am working on, I need to make a prediction, so I’ve been looking for the best possible solution and I am guessing its LSTM…
The app. that I am developing is used in a learning environment, so to predict is the probability of a certain student will submit one solution for a certain assignment…
I have data from previous years in this format:
A1 A2 A3 A4 …
Student 1 – Y Y Y Y N Y Y N
Student 2 – N N N N N Y Y Y
…
Where Y means that the student has submitted, and N otherwise…
From what I understood, the best to achieve what I need is by using the solution described in the section “LSTM For Regression Using the Window Method” where my data will be something like
I1 I2 I3 O
N N N N
Y Y Y Y
And when I present a new case like Y N N the “LSTM” will make a prediction according to what has been learnt in the training moment.
Did I understand it right? Do you suggest another way?
Sorry for the eventually dumb question…
Best regards
Looks fine Nuno, although I would suggest you try to frame the problem a few different ways and see what gives you the best results.
Also compare results from LSTMs to MLPs with the window method and ensure it is worth the additional complexity.
Hi Jason,
Very interesting. Is there a function to descale the scaled data (0-1)? You show the data from 0-1. I want to see the original scale data. This is a easy question. But, it is better to show the original scale data, I suppose.
Great point.
Yes, you can save the MinMaxScaler used to scale the training data and use it later to scale new input data and in turn descale predictions. The call is scaler.inverse_transform() from memory.
Why is the shift necessary for plotting the output? Isn’t it unavailable information at time ‘t+1’?
Hi Pacchu, the framing of the problem is to predict t+1, given t, and possibly some subset of t-n.
I hope that is clearer.
Does the output simply mimics the input ? (the copy is shifted by one)
Just like here : https://github.com/fchollet/keras/issues/2856 ?
No, the output is a prediction of the next time step given prior time steps.
Have you tried to use the input value as a prediction? It produces an RMSE similar to what you are getting, 48.66.
Yes, this is call persistence, here is an example:
https://machinelearningmastery.com/persistence-time-series-forecasting-with-python/
i think the point is that the default DNN models are no better than persistence model?
Hi Jason, thanks for the tutorial. Is it because the input features or hyperparameter are not tuned so the prediction (t+1) is only using the input (t)? Thanks
Hi sir
I tried your code for time series prediction. On passing either univariate or multivariate data, the predictions of the target variable are same. Should’nt there be a difference in the predicted values. I expect the predictions to improve with the multivariate data. Please shed some light on this.
The performance of the model is dependent on both the framing of your problem and how the model is configured.
Hi Jason,
Thanks for the wonderful tutorial. It felt great following your code and implementing my first LSTM network. Looking forward to learning a lot more!!
Can we extend time series forecasting problems to multiple time series? I have the following problem in my mind. Suppose we have stock prices of 100 companies (instead of one) and we wanna forecast what happens in the next month for all the companies? Is it possible to use LSTMs and RNNs for such multiple time series problems?
Forecasting stock prices is not my area of expertise. Nevertheless, LSTMs can be used for multiple regression as well as sequence prediction (if you want to predict multiple steps ahead). Give it a shot.
i guess i have the same idea in mind as Madhav..^^ i want to predict multiple time series, each one represent the flow of one grid in the city(since i assume that the neighboured grids influence each other to some extend).. have you done your stock prediction with LSTM?? will you share me some tricks or experience? Thankyou~
I guess the function learnt is only an one-step lag identity (mimic) prediction.
If the code of your basic version runs, it will look like this:
http://imgur.com/BvPnwGu
I change the csv (setting all the data points after some time to be 400 until the end) and run the same code, it will look like this:
http://imgur.com/TvuQDRZ
If it is truly learning the dynamics of the pattern, the prediction should not look like a strict line. At least the previous information before the 400 values will pull down the curve a little bit.
Typo: a *straight line
Clarification: Of course what I said may not be correct. But I think this is an alarming concern to interrupt what the LSTM is really learning behind the scene.
A key to the examples is that the LSTM is capable of learning the sequence, not just the input-output pairs. From the sequence, it is able to predict the next step.
I think Liu is right. because even when I change LSTM to Dense, result is almost the same.
if you use time-step=1. it is actually not LSTM anymore.
Hi Liu,
after investigating a bit, I have concluded that the 1 time-step LSTM is indeed the trivial identity function (you can convince yourself by reducing the layer to 1 neuron, and adding ad-hoc data to the test set, as you have). But if we think about it, this makes alot of sense that the ‘mimic’ function would minimize MSE for such a simple network – it doesn’t see enough time steps to learn the sequence, anyways.
However, if you increase the number of timesteps, you will see that it can reach lower MSE on the test set by slowly moving away from the mimic function to actually learning the sequence, although for low #’s of neurons the approximation will be rougher-looking. I recommend experimenting with the look_back amount, and adding more layers to see how the MSE can be reduced further!
Hi Nicholas,
Thanks for the comment!
I guess the problem (or feature you can say) in the first example is that ‘time-step’ is set to 1 if I understand the API correctly:
trainX = numpy.reshape(trainX, (trainX.shape[0], 1, trainX.shape[1]))
It means it is feeding sequence of length 1 to the network in each training. Therefore, the RNN/LSTM is not unrolled. The updated internal state is not used anywhere (as it is also resetting the states of the machine in each batch).
I agree with what you said. But by setting timestep and look_back to be 1 as in the first example, it is not learning a sequence at all.
For other readers, I think it worths to look at http://stackoverflow.com/questions/38714959/understanding-keras-lstms
Hi Nicholas,
This is a very good point, thanks for mentioning it.
I have implemented an LSTM on a 1,500 points sample size and indeed sometimes I was wondering whether there really was a big difference with a “mimic” function.
A lot of work to predict the value t+1 while value at t would have been a good enough predictor!
Will try more experiments as I have more data.
hey Liu, it’s a very good observation. I still on the basics and I think these sort of information is really important if we want to build something with quality. Thanks.
Thanks for the tutorial as well.
Hi Jason,
Thanks for this amazing tut, could you please tell me about what is the main role of batch_size in model.fit() and output shape of LSTM layer parameter ?
I read somewhere that using batch_size is depend on our dataset why you chose batch_size = 1 for fitting model and what is the effect of choosing it’s value on calculating gradient of the model?
thanks
Great question Chris.
The batch_size is the number of samples from your train dataset shown to the model at a time. After batch_size samples are run through the network and error calculated, an update to the weights is performed. Too many and the updates are too big, too few, and the updates are too noisy. The hardware you use is also a factor for batch_size and you want to ensure you can fit the batch of samples in memory (e.g. so your GPU can get at them).
I chose a batch_size of 1 because I want to explore and demonstrate LSTMs on time series working with only one sample at a time, but potentially vary the number of features or time steps.
Hi Jason,
Thanks for this series. I have a question for you.
I want to apply a multi-classification problem for videos using LSTM. also, video samples have a different number of frames.
Dataset: samples of videos for actions like boxing, jumping, hand waving, etc.. (Dataset like UCF1101) . each class of action has one label.
so, each video has a label.
Really, I do not know how to describe the data set to LSTM when a number of frames sequence are different from one action to another and I do not know how to use it when a number of frames are fixed as well.
if you have any example of how to use:
LSTM, stacked of LSTM, or CNN with LSTM with this problem this will help me too much.
I wait for your recommendations
Thanks
Hi Jason. Thanks for such a wonderful tutorial. it helped me a lot to get an insight on LSTM’s. I too have a similar question. Can you please comment on this question.
Hi Jason,
Thanks for this great tutorial! I would like to ask, suppose I have a set of X points : X1, X2, .. Xn that contributes to the total sales of the day represented by Y, and I have 60 days data (Y1 until Y60), how do I do time series forecast using these data? Assuming that I would like to predict Y65. Do you have any sample or coding references?
Thanks in advance
I believe you could adapt one of the examples in your post directly to your problem. Little effort required.
Consider normalizing or standardizing your input and output values when working with neural networks.
Hi Jason,
I just found out the question that I have is a multi step ahead prediction, where all the X contributes to Y, and I would like to predict ahead the value of Y n days ahead. Is the example that you gave in this tutorial still relevant?
Thanks!
Hi Alvin,
Yes, you could trivially extend the example to do sequence-to-sequence prediction as it is called in recurrent neural network parlance.
Hi Jason,
Thanks for your reply. I still would like to clarify after looking at the sequence to sequence concept. Assuming I would like to predict the daily total sales (Y), given x1 such as the total number of customers, total item A sold as x2, total item B sold as x3 and so on for the next few items, is sequence to sequence suitable for this?
Thanks
Hi Jason,
I have another question. Looking at your example for the Window method, on line 35:
# reshape input to be [samples, time steps, features]
trainX = numpy.reshape(trainX, (trainX.shape[0], 1, trainX.shape[1]))
testX = numpy.reshape(testX, (testX.shape[0], 1, testX.shape[1]))
what if I would like to change the time steps to more than 1? What other parts of codes I would need to change? Currently when I change it, it says
ValueError: total size of new array must be unchanged.
Thanks
Hi Jason,
For using stateful LSTM, to predict multiple steps, I came across suggestions to feed the output vector back into the model for the next timestep’s prediction. May I know how to get an output vector from based on your LSTM stateful example?
Hi Alvin,
The LSTM will maintain internal state so that you only need to provide the next input pattern. The LSTM implementation in Keras does require that you provide your data in consistent batch sizes, but when experimenting with this you could reduce the batch size down to 1.
I hope that helps.
Dear Dr Jason,
I was following the instructions line-by-line. I too have this valueerror problem.
I refer to the section:
# create and fit the LSTM network
model = Sequential()
model.add(LSTM(4, input_shape=(1, look_back)))
model.add(Dense(1))
model.compile(loss=’mean_squared_error’, optimizer=’adam’)
model.fit(trainX, trainY, epochs=100, batch_size=1, verbose=2)
As soon as I enter the following code, REGARDLESS of the the size of the epochs, eg, epochs = 10, I get a very large error statement. The following is just some of the error.
ValueError: (‘The following error happened while compiling the node’, forall_inplace,cpu,scan_fn}(Elemwise{maximum,no_inplace}.0, Subtensor{int64:int64:int8}.0, IncSubtensor{InplaceSet;:int64:}.0, IncSubtensor{InplaceSet;:int64:}.0, Elemwise{Maximum}[(0, 0)].0, Subtensor{::, int64:int64:}.0, InplaceDimShuffle{x,0}.0, Subtensor{::, int64:int64:}.0, Subtensor{::, :int64:}.0, InplaceDimShuffle{x,0}.0, Subtensor{::, :int64:}.0, Subtensor{::, int64:int64:}.0, InplaceDimShuffle{x,0}.0, Subtensor{::, int64:int64:}.0, Subtensor{::, int64::}.0, InplaceDimShuffle{x,0}.0, Subtensor{::, int64::}.0), ‘\n’, ‘The following error happened while compiling the node’, Dot22(, ), ‘\n’, ‘invalid token “=” in ldflags_str: “-LC:openblas -lopenblas;gcc.cxxflags = -shared -Ic:ming64winclude -Lc:python34libs -lpython34 -DMS_WIN64″‘)
I have uninstalled Theano, then reinstalled Theano.
My Theano version is 1.0.1, and keras is version ‘2.1.5’
Theano is the not going to be upgraded according to team that ‘created’ it at the Uni of Montreal.
Should I downgrade the keras version and what do I need to do to downgrade.
Thank you,
Anthony of Sydney NSW
I uninstalled Theano and used the following command to install Theano via the git program on my Windows pc:
pip install git+https://github.com/Theano/Theano.git#egg=Theano
Sucessful installatation.
But again as soon as I enter the following line:
model.fit(trainX, trainY, epochs=100, batch_size=1, verbose=2)
I get the following (cut-down) errors:
TypeError: c_compile_args() takes 1 positional argument but 2 were given
During handling of the above exception, another exception occurred:
Traceback (most recent call last):
File “C:\Python34\lib\site-packages\theano\tensor\blas.py”, line 443, in _ldflags
t0, t1, t2 = t[0:3]
ValueError: need more than 1 value to unpack
During handling of the above exception, another exception occurred:
lots of files from the Theano package were mentioned (cut out of the edit)
ValueError: (‘The following error happened while compiling the node’, forall_inplace,cpu,scan_fn}(Elemwise{maximum,no_inplace}.0, Subtensor{int64:int64:int8}.0, IncSubtensor{InplaceSet;:int64:}.0, IncSubtensor{InplaceSet;:int64:}.0, Elemwise{Maximum}[(0, 0)].0, Subtensor{::, int64:int64:}.0, InplaceDimShuffle{x,0}.0, Subtensor{::, int64:int64:}.0, Subtensor{::, :int64:}.0, InplaceDimShuffle{x,0}.0, Subtensor{::, :int64:}.0, Subtensor{::, int64:int64:}.0, InplaceDimShuffle{x,0}.0, Subtensor{::, int64:int64:}.0, Subtensor{::, int64::}.0, InplaceDimShuffle{x,0}.0, Subtensor{::, int64::}.0), ‘\n’, ‘The following error happened while compiling the node’, Dot22(, ), ‘\n’, ‘invalid token “=” in ldflags_str: “-LC:openblas -lopenblas;gcc.cxxflags = -shared -Ic:ming64winclude -Lc:python34libs -lpython34 -DMS_WIN64″‘)
Any idea, would be appreciated,
Anthony of Belfield, NSW 2191
Perhaps try working through this tutorial to setup your environment:
https://machinelearningmastery.com/setup-python-environment-machine-learning-deep-learning-anaconda/
Dear Dr Jason,
I did the following in the conda window:
activiate python34
conda update theano
# During this time, there were other packages which were installed including variations of gcc.
conda update keras. # Did not work, package does not exist
conda search -t conda keras # It told me that there was a package under some other directory, which is anaconda/keras.
conda install -c anaconda keras #unsuccessful – need Python v3.6.
When I am in python34 I run the lstm example and still get the same problem.
When I run in conda’s python34, I run the lstm but get different kind of compilation errors.
Conclusion: whether I use an external python34 or conda’s python34, the lstm example does not work. The kinds of errors are different.
Conclusion II: I may go to my alma mater’s wifi (very fast) and download the python36 and reinstall all packages to python36.
Thank you,
Anthony of Belfield
Let me know how you go re Py3.6.
Dear Dr Jason,
I will be transitioning from py3.4.4 to 3.6.
I had another attempt to try the lstm example.
Today, 27/03/2018, I did one more attempt using the anaconda shell.
I either ‘pipped’ or ‘conded’ the most up-to-date files of keras, scikit-learn and theano within the anaconda dos prompt.
So I tried the LSTM example and got the same ‘value error’ that I had under py3.4 which is a separate installation.
In sum, whether I used my independently installed py3.4 or used the anaconda’s py3.4 through the anaconda shell, with all necessary packages updated, the result was the same: run the example, eg in the anaconda shell, python lstmexample.py OR on my independently installed py3.4, python lstexample.py or using my independently installed py3.4 ‘Idle, exec(open(‘lstmexample.py’).read()), THE RESULT WAS THE SAME.
Conclusion: I will be transitioning from py3.4.4 to py3.6. The py3.6 installation will be an independent installation because I have had success with independently installing other python packages and I feel I have a sense of control.
On top of that, since Theano will cease being updated source http://www.i-programmer.info/news/105-artificial-intelligence/11183-theano-to-step-down-after-version-10.html , I will go to Tensorflow which appears to be a going concern. ‘Hopefully’ that should work. Fortunately my laptop’s NVIDIA GPU is suitable for the cuda, I may try that. Ultimately I would like to program on the RPi which does not have an NVIDIA GPU and live within the confines of the RPi’s performance.
I’ll keep you in touch, when my ‘alma mater’ is ‘student-free’ during the Easter holiday season and I can use their very fast wifi.
Thank you,
Anthony of Belfield
Hang in there Anthony. I’m surprised at all the issues you are having. I believe the example works fine with Python 2 and Python 3 and regardless of the Keras backend. Ensure you have copied all of the code required and maintained the indenting.
Dear Dr Jason,
After trying so many attempts at ‘hand-coding’ directly into the Python interpreter I got the “valueerror” problem.
Despite highlighting and saving the code below the sentence “For completeness, below is the entire code example,” I still got the “valueerror” problem. That is I copied the identical code and pasted the copied code in the Notepad++ editor. Indenting was no problem in situation otherwise the interpreter would cease.
I saved the copied code as lstmexample.py.
Execution:
In the Idle interpreter: exec(open(‘c:\python34\lstmexample.py’).read())
via a dos shell: python c:\python34\lstmexample.py
Result same even when I use either the anaconda shell or the dossshell.
So I’ll be resuming my activity when I go to my ‘alma mater’ during the Easter break.
Thank you,
Anthony of Belfield
What version of the Python libraries are you using? Keras? sklearn? pandas?
Here’s what I’m running as of today:
Here’s the exact code (from the first complete example), updated to use a URL to the dataset instead of a local file:
Here is the result:
Dear Dr Jason,
Thank you for your reply:
I saved the above 70 lines as ‘lstmexample2.py’
Based on your above listing of the relevant python packages, with the exception of py3.6, here they are:
python: 3.4.4, Dr Jason’s is v3.6.
scipy: 1.0.1
numpy: 1.14.2
matplotlib: 2.2.2
pandas: 0.22.0
statsmodels: 0.8.0
sklearn: 0.19.1
nltk: 3.2.1 Dr Jason’s 3.2.4 – to pip, updated to 3.2.5
gensim: 0.13.4.1 Dr Jason’s 3.4.0 – to pip, updated to 3.4.0
xgboost: 0.6
tensorflow: n/a since only available for python >= 3.5, Dr Jason’s 1.6
theano: 1.0.1
keras: 2.1.5
In other words, the necessary packages were updated today 29/03/2018 at 0738
Restarted Python either the shell version (in DOS) or Idle version.
Result: with the exception of python3.4.4 and tensorflow (for python >=3.5), all other relevant packages have been updated. The python shell (c:> python c:\python34\lstmexample2.py’) or the Idle (exec(open(‘c:\python34\lstmexample2.py’).read()) produced the same output, “ValueError”
ValueError: (‘The following error happened while compiling the node’, forall_inplace,cpu,scan_fn}(Elemwise{maximum,no_inplace}.0, Subtensor{int64:int64:int8}.0, IncSubtensor{InplaceSet;:int64:}.0, IncSubtensor{InplaceSet;:int64:}.0, Elemwise{Maximum}[(0, 0)].0, Subtensor{::, int64:int64:}.0, InplaceDimShuffle{x,0}.0, Subtensor{::, int64:int64:}.0, Subtensor{::, :int64:}.0, InplaceDimShuffle{x,0}.0, Subtensor{::, :int64:}.0, Subtensor{::, int64:int64:}.0, InplaceDimShuffle{x,0}.0, Subtensor{::, int64:int64:}.0, Subtensor{::, int64::}.0, InplaceDimShuffle{x,0}.0, Subtensor{::, int64::}.0), ‘\n’, ‘The following error happened while compiling the node’, Dot22(, ), ‘\n’, ‘invalid token “=” in ldflags_str: “-LC:openblas -lopenblas;gcc.cxxflags = -shared -Ic:ming64winclude -Lc:python34libs -lpython34 -DMS_WIN64″‘)
>>>
Still puzzled.
Will eventually be transferring to v3.6 during the Easter break.
Thank you,
Anthony of Belfield
Dear Dr Jason,
I have transitioned Python3.4.4 to 3.6.5. I reinstalled the latest scipy, numpy, keras, tensorflow, etc.
I installed tensoflow and ensured that keras ran tensorflow as the background. Incidentally,
I forgot about installing xgboost,
Despite that, I successfully ran the above LSTM example without problem. Went through 100 epochs. The matplotlib’s plot of the predicted and original data was the same.
So the example worked.
Thank you,
Anthony of Belfield
Well done!
Apparently, when using the tensor flow backend, you have to specify input_length in the LTSM constructor. Otherwise, you get an exception. I assume it would just be input_length=1
So like this:
model.add(LSTM(4, input_dim=look_back, input_length=1))
This references the first example where number of features and timesteps is 1. Here input_length corresponds to timesteps.
Hi DRD,
Is this the setting used to solve multi step ahead prediction?
Thanks in advance!
HI,
Haven’t tried it yet, but in the section titled: “LSTM With Memory Between Batches
” input_length should be 3. Basically the same as look_back
Hi Jason,
I applied your technique on stock prediction:
But, I am having some issues.
I take all the historical prices of a stock and frame it the same way the airline passenger prices are in a .csv file.
I use a look_back=20 and I get the following image:
https://postimg.org/image/p53hw2nc7/
Then I try to predict the next stock price and the prediction is not accurate.
Why is the model able to predict the airline passengers so precisely ?
https://postimg.org/image/z0lywvru1/
Thank you
I would suggest tuning the number of layers and number of blocks to suits your problem.
Thank you.
I will play around the network.
In general, For input_dim (windows size), is a smaller or larger number better ?
Hi Jason,
First off, thanks again for this great blog, without you I would be nowhere, with LSTM, and life!
I am running a LSTM model that works, but when I make predictions with “model.predict” it spits out 4000 predictions, which look fine. However, when I run “model.predict” again and save those 4000 predictions again, they are different. From prediction 50 onward, they are all essentially the same, but the first few (that are very important to me) are very different. To give you an idea, the correlation between the first 10 predictions of both rounds is 0.11.
Please help!
The problem wasn’t with numpy.random.seed(0) as I originally thought. I’ve tested this over and over, and even if on the exact same data, predictions are always different/inconsistent for the first few predictions, and only “converge” to some consistent predictions after about 50 predictions have been made previously (on the same or different input data).
It seems like I have made an error by neglecting to include “model.reset_states()” after one line of calling model.predict()
I’m glad to hear you worked it out Marcel.
A good lesson for all of to remember or calls to reset state.
In the part “LSTM For Regression with Time Steps”,
should’t the reshaping be in the form:
[Samples, Features, Time] = (trainX, (trainX.shape[0], trainX.shape[1], 1]
Because in the previous two section:
“LSTM Network For Regression” and
“LSTM For Regression Using the Window Method” we used:
[Samples, Time Steps, Features] = (trainX, (trainX.shape[0], 1, trainX.shape[1])
Thank you
Hi Jason,
Correct me if I’m wrong, but you don’t want to reset_state in the last training iteration do you? Basically my logic is that you want to carry through the last ‘state’ onto the test set because they occur right after the other.
Cheers,
Sachin
You do. The reason is that you can seed the network with state later when you are ready to use it to make a prediction.
Hello Jason,
Am I correct if I was to use Recurrent Neural Networks to predict Dengue Incidences against data on temperature, rainfall, humidity, and dengue incidences.. If so, how would I go about in the processing of my data. I already have the aforementioned data at hand and I have tried using a feed forward neural network using pybrain. It doesn’t seem to get the trend hence my trying of Recurrent Neural Network.
Thank you!
I am a little bit confused regarding the “statefulness”.
If I use a Sequential Model with LSTM layers and stateful set to false. Will this still be a recurrent network that feeds back into my nodes? How would I compare it to the standard LSTM model proposed by Hochreiter et al. (1997)? Do I have to use the stateful layers to mimic the behaviour presented in the original paper?
In essence, I have a simple time series of sales forecasts that show a weekly and partly a yearly pattern. It was easy to create a simple MLP with the Dense layer and the time window method. I put some sales values from the last week, the same week day a few weeks back and the sales of the days roughly a year before into my feature vector. Results are pretty good so far.
I now want to compare it to an LSTM approach. I am however not sure how I can model the weekly and yearly pattern correctly and if I need to use the stateful LSTM or not. Basically I want to use the power of an LSTM to predict a sequence of a longer period of time and hope that the forecasts will be better than with a standard (and much faster) MLP.
These lines don’t make sense to me:
# reshape input to be [samples, time steps, features]
trainX = numpy.reshape(trainX, (trainX.shape[0], 1, trainX.shape[1]))
testX = numpy.reshape(testX, (testX.shape[0], 1, testX.shape[1]))
Isn’t it [samples, fetaures, timesteps] ?
When you switch to lookback = 3, you still use trainX.shape[0], 1, trainX.shape[1] as your reshape, and aren’t the timesteps the lookback? I noticed the Keras model doesn’t work unless you reshape in this way, which is really strange to me. Why do we have to have a matrix full of 1×1 vectors which hold another vector inside of them? Is this in case we have more features or something? Are there ever any cases where the ‘1’ in the reshape would be any other number?
I think the example given here is wrong in the sense, that each data point represents a sample with one single timestep. This doesn’t make sense at all if you think about the strengths of recurrent networks and especially LSTM. How is the LSTM going to memorize if there’s only one timestep for each sample?
Since we are working on a single time series, it should probably be the other way around, with one sample and n timesteps. One could also try and reduce the number of timesteps and split the time series up into samples of a week or a month depending on the data.
Not sure if this is all correct what I just said, but I get the feeling that this popular tutorial isn’t a 100% correct and therefore a bit misleading for the community.
I do provide multiple examples just so you can compare the methods, both learning by single sample, by window and by timestep.
For this specific problem, the timestep approach is probably the best way to model it, but if you want to use some of these examples as a template for your own problem, you have a few options to choose from.
If I want to predict t+1 in a test set with t, the prediction doesn’t make sense. If I shift the prediction, it make sense but I end up predicting t with t, using a next-step model that learnt the sequence. Nice exercise to get used with the implementation, but what’s the point in real life? I really want a t+1 prediction that match t+1 (not t) in the test set, What I’m missing?
Hi Jason,
This is an excellent tutuorial. I have a question. You have one LSTM (hidden) layer with 4 neurons. What if I construct a LSTM layer with only 1 neuron. Why should I have 4 neurons ? I suppose this is different from having two or layers (depth) ? Depth in my understanding is if you have more layers of LSTM.
If you have 4 LSTM neurons in first layers, does input get fed to all the 4 neurons in a fully connected fashion ? Can you explain that ?
Best Regards,
Easwar
Great question Easwar.
More neurons means more representational capacity at that layer. More layers means more opportunity to abstract hierarchical features.
The number of neurons (LSTM call them blocks) and layers to use is a matter of trial and error (tuning).
If we reduce the number of neurons BELOW the number of features fed into an RNN, then does the model simply use as many features as the neuron number allows ?
For example, if I have 10 features but define a model with only 5 neurons in the initial layer(s), would the model only use the FIRST 5 features ?
Thanks,
Sam
No, I expect it will cause an error. Try it and see.
NO, surprisingly it works very well and gives great prediction results.
Is there a requirement that each feature have a neuron ?
Hi I have found when running your raw example on the data, the training data seems to be shifted to the right of the true plot and not the same as your graph in your first example, why could this be?
Hi Jason,
Nice blog post.
I noticed however, that when you do not scale the input data and switch the activation of the LSTMs to ReLu, you are able to get performance comparable to the feedforward models in your other blog post (https://machinelearningmastery.com/time-series-prediction-with-deep-learning-in-python-with-keras/). The performance becomes: Train Score: 23.07 RMSE, Test Score: 48.59 RMSE
Moreover, when you run the feedforward models in the other blog post with scaling of the input data their performance degrades.
Any idea why scaling the dataset seems to worsen the performance performance?
Cheers,
Stijn
Interesting finding Stijn, thanks for reporting it.
I need to experiment more myself. Not scaling and using ReLu would go hand in hand.
Hi Jason – actually I was able to verify Stjin’s results (could you please delete my inquiry to him).
But I am curious about this:
Train Score: 22.51 RMSE
Test Score: 49.75 RMSE
The error is almost twice as large on the out of sample data, what does that mean about the quality of our model?
I don’t know why my
Train Score: 159586.05 RMSE
Test Score: 189479.02 RMSE
become like this????
Hi Stijn – I wasn’t able to replicate your results, could you please post your code. Thanks!
http://stats.stackexchange.com/questions/59630/test-accuracy-higher-than-training-how-to-interpret
Great link, thanks Max.
Hey Jason,
As far as I can tell (and you’ll have to excuse me if I’m being naive) this isn’t predicting the next timestep at all? Merely doing a good job at mimicking the previous timestep?
For example the with the first example, if we take the first timestep of trainX (trainX[0]) the prediction from the model doesn’t seem to be trying to predict what t+1 (trainX[1]) is, but merely mimics what it thinks fits the model at that particular timestep (trainX[0]) i.e. tries to copy the current timestep. Same for trainX[1], the prediction is not a prediction of trainX[2] but a guess at trainX[1]… Hence which the graphs in the post (which as you mentioned above you need to update) look like they’re forwardlooking, but running the code actually produces graphs which have the predictions shifted t+look_back.
How would you make this a forward looking graph? Hence also, I tried to predict multiple future timesteps with your first model by initialising the first prediction with testX[0] and then feeding the next predictions with the prior predictions but the predictions just plummeted downwards into a downwards curve. Not predicting the next timesteps at all.
Am I being naive to the purpose of this blog post here?
All the best, love your work,
Jakob
Hi Jakob,
I believe you are correct.
I have tried these methods on many different time series and the same mimicking behavior occurs – the training loss is somehow minimized by outputting the previous timestep.
A similar mimicking behavior occurs when predicting multiple time steps ahead as well (for example, if predicting two steps ahead, the model learns to output the previous two timesteps).
There is a small discussion on this issue found here – https://github.com/fchollet/keras/issues/2856 – but besides that I haven’t discovered any ways to combat this (or if there is some underlying problem with Keras, my code, etc.).
I am in the process of writing a blog to uncover this phenomenon in more detail. Will follow up when I am done.
Any other advancements or suggestions would be greatly appreciated!
Thanks,
Jeremy
Hello,
I have been trying to play around with the code for a few days now and all I get is a curve plummeting to zero after a while.
I start to believe that we are using the wrong tool to do what we would like to, although it works for sine waves. We may want to try with stationary time series then, this is the last card I can play.
Are you simply using t-1 to predict t+1 in the time window, if so I don’t think there is enough data being fed into the neural network to learn effectively. with a bigger time window I notice that the model does start to fit better.
Hi, Jason
Thank you for your post.
I am still confused about LSTM for regression with window method and time steps.
Could you explain more about this point. Could you use some figures to show the difference between them?
Many thanks!
As my understanding, the LSTM for regression with window method is the same as a standard MLP method, which has 3 input features and one output as the example. Is this correct? What’s the difference?
Thank you very much for the detailed article!
Does anybody have a scientific source for the time window? I can’t seem to find one.
Great question.
I don’t know of any, but there must be something written up about it back in the early days. I also expect it’s in old neural net texts.
Have you experimented with having predictors (multivariate time series) versus a univariate? Is that possible in Keras?
Yes, you can have multiple input features for multiple regression.
Any chance you will add this type of example?
I will in coming weeks.
Me too will be interested in using multivariate(numerical) data !
Been trying for a few days , but the “reshaping/shaping/data-format-blackmagic” always breaks
Purely cause I don’t yet understand it !
Otherwise great example !
Understood, I’ll prepare tutorials.
Sir, Awesome work!!!
I am very interested in cross-sectional time series estimation… How can that be done?
I am starting your Python track, but will eventually target data with say 50 explanatory variables, with near infinite length of time series observations available on each one. Since the explanatory variables are not independent normal OLS is useless and wish to learn your methods.
I would be most interested in your approach to deriving an optimal sampling temporal window and estimation procedure.
Sorry Richard, I don’t know about cross-sectional time series estimation.
For good window sizes, I recommend designing a study and resolving the question empirically.
Hi Jason
As you mentioned before, you will prepare the tutorial for multiple input features for multiple regression. Could you provide us the link to that tutorial?
It will be part of a new book I am writing. I will put a version of it on the blog soon.
Multiple regression is straight forward with LSTMs, remember input is defined as [samples, timesteps, features]. Your multiple inputs are features.
For multiple output multi-step regression you can recurse the LSTM or change the number of outputs in the output layer.
Did you ever create a tutorial for multivariate LSTM? I can’t seem to find any!
I get this error when I run your script with the Theano backend:
ValueError: (‘The following error happened while compiling the node’, forall_inplace,cpu,scan_fn}(Elemwise{maximum,no_inplace}.0, Subtensor{int64:int64:int8}.0, IncSubtensor{InplaceSet;:int64:}.0, IncSubtensor{InplaceSet;:int64:}.0, Elemwise{Maximum}[(0, 0)].0, lstm_1_U_o, lstm_1_U_f, lstm_1_U_i, lstm_1_U_c), ‘\n’, ‘numpy.dtype has the wrong size, try recompiling’)
Any idea what might be happening?
Hi Bob, it might be a problem with your backend. Try reinstalling Theano or Tensorflow – whichever you are using. Try switching up the one you are using.
Excellent article, really insightful. Do you have an article which expands on this to forecast data? An approach that would mimic that of say arima.predict in statsmodels? So ideally we train/fit the model on historical data, but then attempt to predict future values?
Thanks Philip, I plan to prepare many more time series examples.
Hi,Mr.Brownlee!
I don’t see future values on your plots, as I understand your model don’t predict the Future, only describe History. Can you give advice, how can I do this? And how I can print predictive values?
Thanks a lot!
Great article Jason.
I was just wondering if there was any way I could input more than 1 feature , and have 1 output, which is what I am trying to predict? I am trying to build a stock market predictor. And yes I know, it is nearly impossible to predict the stock market, but I am just testing this, so lets say we live in a perfect world and it can be predicted. How would I do this?
Hi Tucker,
You can have multiple features as inputs.
The input structure for LSTMS is [samples, time steps, features], as explained above. In fact, there are examples of what you are looking for above (see the section on the window method).
Just specify the features (e.g. different indicators) in the third dimension. You may have 1 or more timesteps for each feature (second dimension).
I hope that helps.
I did what you said, but now it wants to output 2 sequences out of the activation layer, but I only wanted it to have a final output of 1. Basically what I am doing is trying to use open and close stock data, and use it to predict tomorrow’s close. So I need to input 2 sequences and have an output of 1. I hope I explained that right. What should I do?
Jason, you mentioned that LSTMs input shape must be [samples, time stamps, features]. What if my time series is sampled (t, x), i.e. each sample has its own time stamp, and the time stamps are NOT evenly spaced. Do I have to generate another time series in which all samples are evenly spaced? Is there any way to handle the original time series?
Really good question Joe. Thanks. I have not thought about this.
My instinct would be to pad the time series, fill in the spaces with zeros and make the time series steps equidistant. At least, I would try that against not doing it and evaluate the effect on performance.
Take samples in blocks via Sklearn.model_selection.TimeSeriesSplit
What an excellent article!
Recently I used LSTM to predict stock market index where the data is fluctuating and has no seasonal pattern like the air passanger data. I was just wondering about how does LSTM (or every gate) decide when to forget or keep a certain value of this type of series data. Any explanation about this? Thank you.
Great question Rio. I would love to work through how the gates compute/output on a specific problem.
I think this would be a new blog post in the future.
I’m looking forward to that post, Jason. Thank you
I used “LSTM For Regression Using the Window Method” with the following parameters
look_back = 20
LSTM(20,input_dim=look_back)
I got the following results
Train_Score: 113.67 RMSE
Test_Score: 122.88 RMSE
I computed R-squared and I got 0.93466300136
In addition I tried changing the hyperparameters in the other two models but R-squared was less in both comparing to this model.
Dear SalemAmeen,
I am currently working with lstm recurrent neural networks and I am curious how you calculated R-squared. Are you willing to share your code about the R-squared calculation with me? Thank you very much!
Kind regards
Cas
If you collect your predictions, you can calculate r^2 using the sklearn library:
http://scikit-learn.org/stable/modules/generated/sklearn.metrics.r2_score.html
You can also use a custom metric to report r^2 each epoch:
https://keras.io/metrics/
Hi, Jason
First of all, this is really a fantastic post and thank you so much!
I’ve got confused on the “model.predict(x,batch_size)”.
I can’t figure what it means “predict in a batched way” on the keras official website.
My situation is like:
batch_size=10
I have a test sample [x_1] \in R^{2}, and I put it into the function,
[x_2] = model.predict([x_1],batch_size=batch_size)
(Let’s skip the numpy form issue)
Then, subsequently, I put [x_2] into it, similarly, and I get [x_3] = model.predict([x_2],batch_size=batch_size), and so on, till x_10.
I don’t know if the function “predict” treats [x_1],[x_2],…[x_3] as in a batch ?
I guess it does.(although I didn’t put them into the function at one time)
Otherwise, I’ve tried another way to compute [x_2],…[x_10] and I got the same as above.
Another strategy is like:
[x_2] = model.predict([x_1],batch_size=batch_size)
[x_3] = model.predict([[x_1],[x_2],batch_size=batch_size)
[x_4] = model.predict([[x_1],[x_2],[x_3]],batch_size=batch_size)
…
What’s the difference between the two ways?
Thanks!
btw, I am also confused at “batch”.
If batch_size=1, does that mean there’s no relation between samples? I mean the state s_t won’t be sent to affect the next step s_(t+1).
So, why we need RNN?
It’s a good point.
We need RNN because the state they can maintain gives results better than methods that do not maintain state.
As for batch_size=1 during calls to model.predict() I have not tested whether indeed state is lost as in training, but I expect it may be. I expect one would need batch_size=n_samples and replay data each time a prediction is needed.
I must experiment with this and get back to you.
I’m not sure I understand the “two ways” you’re comparing, sorry.
The batch size is the number of records that the network will process at once – as in load into memory and perform computation upon.
In training, this is the constraint on data before weight update. In test, it is data before computed predictions are returned.
Does that help at all?
yes, it does!
I appreciate it !!
This is a great post! Thanks for the guidance. I’m wondering about performance. I’ve setup my network very similarly to yours, just have a larger data set (about 2500 samples, each with 218 features). Up to about 20 epochs runs in a reasonable amount of time, but anything over that seems to take forever.
I’ve set-up random forests and MLPs, and nothing has run so slowly. I can see all CPUs are being used, so am wondering whether Keras and/or LSTM has performance issues with larger data sets.
Great question.
LSTMs do use more resources than classical networks because of all the internal gates. No significant, but you will notice it at scale.
I have not performed any specific studies on this, sorry.
Hi Jason,
I am confusing about deep learning and machine learning in Stock Market , forex . There are a lot of models which analyses via chart using amibroker or metastock which redraw the history price and take the prediction in that model . Does it call the machine learning or deep learning ?
How is it when we could do farther to make better prediction via deep learning if it’s right ?
Hi Jason, it sounds like you are already using predictive models.
It may fair to call them machine learning. Deep learning is one group of specific techniques you may or may not be using.
There are may ways to improve results, but it is trial and error. I offer some ideas here:
https://machinelearningmastery.com/improve-deep-learning-performance/
Sorry, I don’t know the specifics of stockmarket data.
Hi Jason,
These models do not predict, they extrapolate current value 1 step ahead in more or less obscured way. As seen on the pictures, prediction is just shifted original data. For this data one can achieve much better RMSE 33.7 without neural net, in just one line of code:
trainScore = math.sqrt(mean_squared_error(x[:-1], x[1:]))
Hi Alexander, thanks.
This is good motivation for me/community to go beyond making LSTMs “just work” for time series and dive into how to train LSTMs effectively and even competitively on even very simple problems.
It’s an exciting open challenge.
This is a nice tutorial for starters. Thank you.
However, I have some concerns about the
create_datasetfunction. I think it just make a simple problem complicated (or even wrong).When
look_back=1, the function is simply equivalent to: dataX = dataset[:len(dataset)-look_back], dataY = dataset[look_back:].When
look_backis larger than 1, the function is wrong: after each iteration,dataXis appended by more than 1 data, butdataYis appended by just 1 data. Finally, dataX will belook_backtimes larger than dataY.Is that what
create_datasetsupposed to do?def create_dataset(dataset, look_back=1):
dataX, dataY = [], []
for i in range(len(dataset)-look_back-1):
a = dataset[i:(i+look_back), 0]
dataX.append(a)
dataY.append(dataset[i + look_back, 0])
return numpy.array(dataX), numpy.array(dataY)
Thanks for your great article! I have a question that when I use the model “Stacked LSTMs With Memory Between Batches” with my own data, I found that cpu is much faster than gpu.
May data contains many files and each files’ size is about 3M. I put each file into the model to
trian one by one. I guess that the data is too small so the gpu is useless, but I can’t sure. I use thano backend and I can sure that the type of the data is float32. So I want to know what reason would make this happen, or the only reason is the data too small? Thank you very much and best wishes to you.
Hi Jason,
Excellent tutorial. I am new to time series prediction. I have a basic question. In this example(international-airline-passengers) model predicted the values on test data from 1957-01 to 1960-12 time period.
How to predict the passengers in next one year from 1961-01 – 1961-12.
How to pass input values to model, so it will predict the passengers count in each month for next one year.
Hi,
Any inputs to solve below question
How to predict the passengers in next one year from 1961-01 – 1961-12.
Regards,
Rajesh
Hi,
“The dataset is available for free from the DataMarket webpage as a CSV download with the filename “international-airline-passengers.csv“.”
Not anymore I guess.
Any other way to get the file?
Thanks,
Nicolas
Yes, it is still available NicoAd.
Visit: https://datamarket.com/data/set/22u3/international-airline-passengers-monthly-totals-in-thousands-jan-49-dec-60
Click “Export” on the left-hand side, and choose the CSV file format.
Thanks !
Just a new location:
https://github.com/ufal/npfl114/blob/master/labs06/international-airline-passengers.tsv
Hi,
Great article on LSTM and keras. I was really struggling with this, until I read through your examples. Now I have a much better understanding and can use LSTM on my own data.
One thing I’d like to point out. The reuse of trainY and trainX on lines 55 & 57.
Line 55 trainY = scaler.inverse_transform([trainY])
This confused me a lot, because the model can’t run fit() or predict() again, after this is done. I was struggling to understand why it could not do a second predict or fit. Until i very carefully read each line of code.
I think renaming the above variables would make the example code clearer.
Unless I am missing something….. and being a novice programmer that’s very possible.
Thanks again for the great work.
Brian.
Thanks Brian, I’m glad the examples were useful to get you started.
Great point about remaining variables.
Hi, Jason, thank you for the example.
I have used the method on my own data. The data is about the prediction of the average temperature per month. I want to predict more than one month. But I can only predict one month now. Because the inputs are X1 X2 X3, the result is only y. I want to kown how to modify the code to use ,like, X1 X2 X3 X4 X5 X6 to predict Y1 Y2 Y3.
I don’t know if I have made it clear. I hope you will help me.
Thank you very much.
Hi Joaco, that is a sequence to sequence problem. I will prepare an example soon.
Hi Jason, Joaco,
I am also looking forward to a similar example 🙂
Je
Sorry do you have prepare this example? Thanks!
Yes, see here:
https://machinelearningmastery.com/learn-add-numbers-seq2seq-recurrent-neural-networks/
Nice post Jason!
I read that GRU has a less complex architecture than the LSTM has, but many people still use LSTM for forecasting. I’d like to ask, what are the advantages LSTM compared to GRU? Thank you
Hi Nida, I would defer to model skill in most circumstances, rather than concerns of computational complexity – unless that is a requirement of your project.
Agreed, we do want the simplest and best performing model possible, so perhaps evaluate GRUs and then see of LSTMs can out perform them on your problem.
I’m a total newbie to Keras and LSTM and most things NN, but if you’ll excuse that, I’d like to run this idea past you just to see if I’m talking the same language let alone on the same page… :
I’m interested in time-series prediction, mostly stocks / commodities etc, and have encountered the same problem as others in these comments, namely, how is it prediction if it’s mostly constrained to within the time-span for which we already have data?
With most ML algorithms I could train the model and implement a shuffle, ie get the previous day’s prediction for today and append it in the input-variable column, get another prediction, … repeat. The worst that would happen is a little fudge around the last day in the learning dataset.
That seems rather laborious if we want to predict how expensive gold is going to be in 6 months’ time.
(Doubly so, since in other worlds (R + RSNNS + elman or jordan), the prediction is bound-up with training so a prediction would involve rebuilding the entire NN for every day’s result, but we digress.)
I saw somewhere Keras has a notion of “masking”, assigning a dummy value that tells the training the values are missing. Would it be possible to use this with LSTM, just append a bunch of 180 mask zeroes, let it train itself on this and then use the testing phase to impute the last values, thereby filling in the blanks for the next 6 months?
It would also be possible to run an ensemble of these models and draw a pretty graph similar to arima.predict with varying degrees of confidence as to what might happen.
Waffle ends.
Interesting idea.
My thoughts go more towards updating the model. A great thing about neural nets is that they are updatable. This means that you can prepare just some additional training data for today/this week and update the weights with the new knowledge, rather than training them from scratch.
Again, the devil is in the detail and often updating may require careful tuning and perhaps balance of old data to avoid overfitting.
Dear Jason,
I am trying to implement your code in order to make forecasting on a time-series that i am receiving from a server. My only problem is that the length of my dataset is continuously increasing. Is there any way to read the last N rows from my csv file? What changes do i have to make in code below in order to succeed it.
def create_dataset(dataset, look_back=1):
dataX, dataY = [], []
for i in range(len(dataset)-look_back-1):
a = dataset[i:(i+look_back), 0]
dataX.append(a)
dataY.append(dataset[i + look_back, 0])
return numpy.array(dataX), numpy.array(dataY)
# fix random seed for reproducibility
numpy.random.seed(7)
# load the dataset
dataframe = pandas.read_csv(‘timeseries.csv’, usecols=[1], engine=’python’, skipfooter=3)
dataset = dataframe.values
dataset = dataset.astype(‘float32’)
This post might help with loading your CSV into memory:
https://machinelearningmastery.com/load-machine-learning-data-python/
If you load your data with Pandas, you can use DataFrame.tail() to select the last n records of your dataset, for example:
Hello, I would like to use that your model. But the problem I am using sliding window size greater than one. Type {[x-2], [x-1], [x]} ==> [x + 1]. But I found several problems in training. For example, when I turn your trainX in {[x-2], [x-1], [x]} and trainY in [x + 1], the keras tells me that the input and the target must have same size. Can you help me with this?
Hi Alisson, I think the error suggests that input and target do not have the same number of rows.
Check your prepared data, maybe even save it to file and look in a text editor or excel.
Thaks, Jason. I was able to solve my problem. But see, the use of the ReLu function in the memory cell and the sigmoid function on the output showed strange behavior. You have some experience with this setting.
Congratulations on the work, this page has helped me a lot.
Hi Jason,
Thanks for your great content.
As you did i upgraded to Keras 1.1.0 and scikit-learn v0.18. however i run Theano v.0.9.0dev3 as im on Windows 10. Also im on Anaconda 3.5. (installed from this article: http://ankivil.com/installing-keras-theano-and-dependencies-on-windows-10/)
Your examples run fine on my setup – but i seem to be getting slightly different results.
For eamples in your first example: # LSTM for international airline passengers problem with window regression framing – i get:
Train Score: 22.79 RMSE
Test Score: 48.80 RMSE
Should i be getting exact the same results as in your tutorial? If yes, any idea what i should be looking at changing?
Best regards
Soren
Great work Soren!
Don’t worry about small differences. It is hard to get 100% reproducible results with Keras/Theano/TensorFlow at the moment. I hope the community can work something out soon.
great post ! thank you so much. I was wondering how can be adapt the code to make multiple-step-ahead prediction. One of the commenters suggested defining the out-put like [x(t+1),x(t+2),x(t+3),…x(t+n)] , but is there a way to make prediction recursively ? More specifically, to build an LSTM with only one output. We first predict x(t+1), then use the predicted x(t+1) as the input for the next time step to predict x(t+2) and continue doing so ‘n’ times.
Hi Jason,
I am wondering how to apply LSTM to real time data. The first change I can see is the data normalisation. Concretely, a new sample could be well out of min max among previous observations. How would you go about this problem?
Thanks.
Could it be that in:
# calculate root mean squared error
math.sqrt(mean_squared_error(trainY[0], trainPredict[:,0]))
you mean :
# calculate root mean squared error
trainScore = math.sqrt(mean_squared_error(trainY[:], trainPredict[:,0]))
trainY is an array of (one) array. Compare:
print len(trainYi[0]) # 720
print len(trainYi[:]) # 1
print len(trainPredict[:,0]) # 720
So the original code is the right one.
Hi jason, i got a question,that have stacked me for many days,how can i add hidden layer into the LSTM model(By using model.add(LSTM()).what i tried : say ,in your first code example, I assume ‘model.add(LSTM(4, input_dim=look_back))’ this line was to create a hidden layer in the LSTM model. So i thought:oh , 1 hidden layer is so easy , why don’t add one hidden layer into it .So i try to add one layer. After the code:’model.add(LSTM(4, input_dim=look_back))’ , i try many ways to insert one hidden layer , such as : just copy model.add(LSTM(4,input_dim=look_back)) and insert after it . I try many ways ,but it always got the error that got the wrong input _ dimension. So can you show me how to add one hidden layer in example 1st . Or , i don’t got the LSTM model right ,it can’t be inserted ?
See the section titled “Stacked LSTMs With Memory Between Batches”.
It gives an example of multiple hidden layers in an LSTM network.
Thanks . I got that.
However, I got another question: compared to the other article you published ‘time series prediction with deep learning ‘(https://machinelearningmastery.com/time-series-prediction-with-deep-learning-in-python-with-keras/?utm_source=tuicool&utm_medium=referral) , It seems that ‘LSTM’ model doesn’t predict as well as the simple neurons. Does that mean LSTM may not a good choice for some specific time series structure?
I would not agree, these are just demonstration projects and were not optimized for top performance.
These examples show how LSTMs could be used for time series projects (and how to use MLPs for time series projects), but not optimally tuned for the problem.
Hi, great post! Thanks
How could I set the input if I have several observations (time series) with same length of the same feature and I want to predict t+1? Would I concatenate them all? In that case the last sample of one observation would predict the first one of the next.. Or should I explicitly assign the length of each time series to the batch_size?
Hi, you’re predicting one day after your last entry, if i want to predict a day five days after what should i do?
Hi Mauro, that would be a sequence to sequence prediction.
Sorry, I don’t have an example just yet.
Hi
This is a great example. I am quite new in deep learning and keras. But this website has been very helpful. I want to learn more.
Like many commenters, I am also requesting to find out: how to predict future time periods. Is that possible? How can I achieve this using the example above? If there are multiple series or Ys and there are categorical predictors, how can I accomodate that?
Please help, and am very keen to learn this via other channels in this website if required. Please let me know.
Many thanks
The example does indeed predict future values.
You can adapt the example and call model.predict to make a prediction for new data, rather than just evaluate the performance of predictions on new data as in the example.
Hi,
I tried to predict future values, but have trouble finding the right way to do it
I work with the window method so my current data à t-3 t-2 t-1 t looks like this
[100,110,108]
If I try
data = [[100,110,108]]
model.predict(data)
I get the following error :
Attribute error : ‘list’ object has no attribute “shape”
I guess the format is not correct, and I need sort of reshape.
but for me the line
trainX = numpy.reshape(trainX, (trainX.shape[0], 1, trainX.shape[1])) is not clear.
and if I try to apply the same transform on my new data I get this error :
IndexError : tuple index out of range
could you provide an exemple dealing with new data ?
Thanks !
I think I almost here but still have a last error (my window side is 8)
todayData = numpy.array([[1086.22,827.62,702.94,779.5,711.8399999999999,1181.25,1908.69,2006.39]])
todayData = todayData.astype(‘float32’)
todayData = scaler.fit_transform(todayData)
print “todayData scaled ” + str(todayData)
todayData = scaler.inverse_transform(todayData)
print “todayData inversed ” + str(todayData)
todayData = numpy.reshape(todayData, (todayData.shape[0], 1, todayData.shape[1]))
predictTomorrow = model.predict(todayData)
predictTomorrow = scaler.inverse_transform([predictTomorrow])
print “prediction” + str(predictTomorrow)
the inverse_transform line on predictTomorrow generate the following error
ValueError : Found array with dim 3 . Estimator expected <= 2
again a reshape issue 🙁
Dear Nico AD:
Glad to know you made it! I am getting into the same problem, can you post your full code?
Thanks!
I recommend starting here instead:
https://machinelearningmastery.com/start-here/#deep_learning_time_series
I am working on a new example Nico, it may be a new blog post.
thanks Jason. I tried various things with no luck. for me some part of the tutorial (like the reshape part / scaling ) are pure magic 🙂 trying to get some help from the keras community on gitter 🙂
finally got it , I need to reshape in (1,1,8) ( where 8 is the look_back size)
Well done Nico.
Why this example does not indeed predict future values?
It does.
I recommend starting here:
https://machinelearningmastery.com/start-here/#deep_learning_time_series
Hi Jason
Which book gives complete examples/codes with time series keras? I want to predict future time periods ahead and want add other predictor variables? Is that achievable?
Please let me know if you have any resources / book that I can purchase.
Many thanks
Deep Learning With Python:
https://machinelearningmastery.com/deep-learning-with-python/
Hi Jason
Thank you for your great tutorial,
I have a question about number of features. How could I have input with 5 variables?
Thank you in advance
Sarah
Hi Sarah, LSTMs take input in the form [samples, timesteps, features], e.g. [n, 1, 5].
You can prepare your data in this way, then set the input configuration of your network appropriately, e.g. input_dim=5.
Nice tutorial, thanks.
I think the line
for i in range(len(dataset)-look_back-1):
should be
for i in range(len(dataset)-(look_back-1)):
Actually, I think its
for i in range(len(dataset)-look_back):and
testPredictPlot[train_size+(look_back-1):len(dataset)-1, :] = testPredictThanks Adam, I’ll take a look.
Hi Adam, nice blog ! I only have a small suggestion for shifting data: use the shift() method from pandas. Cheers
Great suggestion Ben. I have been using this myself recent to create a lagged dataset.
Hi Jason,
As i am new to RNN, i would like to ask about the difference in stateful:
for i in range(100):
model.fit(trainX, trainY, nb_epoch=1, batch_size=batch_size, verbose=2, shuffle=False)
model.reset_states()
and the stateless:
model.fit(trainX, trainY, nb_epoch=100, batch_size=1, verbose=2)
Do the range of 100(nb_epoch=1) the same as nb_epoch=100?
What is the difference between these 2?
Good question Weixian.
In the stateful case, we are running each epoch manually and resetting the state of the network at the end of each epoch.
In the stateless case, we let the Keras infrastructure run the loop over epochs for us and we’re not concerned with resetting network state.
I hope that is clear.
Hi Jason,
Thanks for the reply.
In this case for the stateful:
if i reset the network, would the next input from the last trained epoch?
For the stateless:
Does it loop from the epochs that was previously trained?
How does the 2 affect the data trained or tested?
Sorry, I don’t understand your questions. Perhaps you could provide more context?
Hi Jason,
stateful:
I mean like the training results of the last epoch [Y1] output for example A
Would the [X2] input of the network be A from the last epoch?
Stateless:
How would the top situation be different from the epoch=2?
Yes, you need to have the same inputs in both cases. The difference is the LSTM is maintaining some internal state when stateful.
Hi Jason
Thank you for your LSTM tutorial.
But i found that an error always occurred, when i ran the first code in ‘model.add(LSTM(4, input_dim=look_back))’
The error is : TypeError: super() argument 1 must be type, not None
So, why?
Thanks
Check your white space Quinn, it’s possible to let extra white space sneak in when doing the copy-paste.
Many thanks for this article. I am trying to wrap my head around
trainX = numpy.reshape(trainX, (trainX.shape[0], trainX.shape[1], 1))
testX = numpy.reshape(testX, (testX.shape[0], testX.shape[1], 1))
(from LSTM for Regression with Time Steps section), since this is exactly what I need.
Let’s say I have 4 videos (prefix v) , of different lengths (say, 2,3,1 sec) (prefix t) , and for every 1 sec, I get a feature vector of length 3 (prefix f).
So, as I understand my trainX would be like this, right? –>
trainX=np.array (
[
[ [v1_t1_f1, v1_t1_f2, v1_t1_f3],
[v1_t2_f1, v1_t2_f2, v1_t2_f3] ],
[ [v2_t1_f1, v2_t1_f2, v2_t1_f3],
[v2_t2_f1, v2_t2_f2, v2_t2_f3],
[v2_t3_f1, v2_t3_f2, v2_t3_f3], ],
[ [v3_t1_f1, v3_t1_f2, v3_t1_f3] ] )
]
(=[ [v1], [v2], [v3] ], and v is Nt x Nf python list?)
If I have v1, v2,v3, how do I start with an **empty** xTrain and update them **recursively** to xTrain, so that xTrain can be used by Keras?
I have tried np.append, np.insert, np.stack methods, but no success as yet, I always get some error. Kindly help!!!
If I make my ‘v1′,’v2′,v3′ ..’v19’ as np arrays, and trainX as a list =[ v1, v2, v3…v19 ] using trainX.append(vn) –> and eventually outside of for loop: trainX=np.array(trainX), I get following error.
File “/usr/local/lib/python2.7/dist-packages/keras/engine/training.py”, line 100, in standardize_input_data
str(array.shape))
Exception: Error when checking model input: expected lstm_input_1 to have 3 dimensions, but got array with shape (19, 1)
Which makes sense since, Keras must be expecting input to have 3 dimensions = (sample,tstep, features).
But how do I fix this???
Your comment is awaiting moderation.
If I make my ‘v1′,’v2′,v3′ ..’v19’ as np arrays, and trainX as a list =[ v1, v2, v3…v19 ] using trainX.append(vn) –> and eventually outside of for loop: trainX=np.array(trainX), I get following error.
File “/usr/local/lib/python2.7/dist-packages/keras/engine/training.py”, line 100, in standardize_input_data
str(array.shape))
Exception: Error when checking model input: expected lstm_input_1 to have 3 dimensions, but got array with shape (19, 1)
Which makes sense since, Keras must be expecting input to have 3 dimensions = (sample,tstep, features).
But how do I fix this???
Guestion about the stateful data representation.
If I understood correctly prepare_data makes repeats the previous look_back sequences.
For example the original data
1
2
3
4
5
6
will become
1 2 3 -> 4
2 3 4 ->5
3 4 5 ->6
Then when you reshape for the stateful LSTM don’t you feed these sequences like this ?
batch 1 sequences [ 1, 2, 3] -> predict 4
batch 2 sequences [ 2, 3, 4] -> predict 5
batch 3 sequences [ 3, 4, 5] -> predict 6
In the stateful RNN shouldn’t it be two batches only that continue one from the next:
batch 1 sequences [ 1, 2, 3] -> predict 4
batch 2 sequences [ 3, 4, 5] -> predict 6
Or alternatively you can have it to return the full state and predict all of them
batch 1 sequences [ 1, 2, 3] -> predict [2, 3, 4]
batch 2 sequences [ 3, 4, 5] -> predict [4, 5, 6]
Thanks,
Ilias
Sorry i mean for the stateful RNN
batch 1 sequences [ 1, 2, 3] -> predict 4
batch 2 sequences [ 4, 5, 6] -> predict 7 (not 3,4,5)
Hi!
First of all, thanks for the tutorial. I’m trying to predict data that are very similar to the example ones. I was playing with the code you gave, but then something very strange happened: if I fit a model using the flight data and i use those hyper parameters to predict white noise I receive a very accurate results. Example:
#Data Generation:
dataset = numpy.random.randint(500, size=(200,1))
dataset = dataset.astype(‘float32’)
#Data Prediction:
scaler = MinMaxScaler(feature_range=(0, 1))
dataset = scaler.fit_transform(dataset)
prediction in red:
https://s17.postimg.org/oavua7uq7/download.png
How could that be possible? White noise should be not predictable, what am I doing wrong?
Sorry, i was doing something very stupid, just ignore my latest post.
Cheers
Ok, sorry again for the last correction, the result was obtained using:
plt.plot(dataset,”b”,model.predict(dataset[:,:,numpy.newaxis]),”r”)
so I’am actually predicting white noise, how could that be possible?
Hi Luca, glad you’re making progress.
If results are too good to be true, they usually are. There will be a bug somewhere.
Kindly reply to my question above as well, please?
How do I shape trainX for 4 videos (v1,..v4) , of different lengths (2,3,1 sec) and for every 1 sec, I get a feature vector [f1 f2 f3] ?
Sorry, I don’t have examples of working with video data. Hopefully soon.
oh, it is not about videos.. Question is about ‘instances/samples’ in general…
I am saying,
Instance1 through instance4 correspond to 2,3,1,5 feature vectors in time respectively, each of dimension 3. How do I shape these to train LSTM?
That is the whole idea behind the section “LSTM for Regression with Time Steps” above, right?
Features of instance1 should not be considered when training LSTM on instance2! Just as your paragraph says:
“Some sequence problems may have a varied number of time steps per sample. For example, you may have measurements of a physical machine leading up to a point of failure or a point of surge. Each incident would be a sample the observations that lead up to the event would be the time steps, and the variables observed would be the features.”
I don’t need *examples of working with video data.* Kindly advise only on how to shape trainX I mentioned above.
look careful, isn’t there +1 shift in your white noise prediction? )))
same as in charts in tutorial?
best prediction for weather tomorrow is: it’ll be exact the same as today. see?
hello
I see many factors for your handling this time series prediction:
-Number of LSTM blocks
-Lookback number
-Epochs
-Activation
-Optimizer
Can you show the order of importance for these in creating a prediction model? Also, you have chosen 4 LSTM blocks, any reason for this?
Great question Prakash. I would say framing of the problem and network topology as the biggest levers.
I have more info on improving performance in deep learning here:
https://machinelearningmastery.com/improve-deep-learning-performance/
I chose 4 neurons (memory modules) with a little trial and error.
Hi Jason,
When I try your “Stacked LSTMs with Memory Between Batches” example as it is, I found the following error. I wonder if you could help to explain what went wrong and how to rectify it please?
Thank you.
ValueError Traceback (most recent call last)
in ()
41 model = Sequential()
42 model.add(LSTM(4, batch_input_shape=(batch_size, look_back, 1), stateful=True, return_sequences=True))
—> 43 model.add(LSTM(4, batch_input_shape=(batch_size, look_back, 1), stateful=True))
44 model.add(Dense(1))
45 model.compile(loss=’mean_squared_error’, optimizer=’adam’)
/home/nbuser/anaconda3_410/lib/python3.5/site-packages/keras/models.py in add(self, layer)
322 output_shapes=[self.outputs[0]._keras_shape])
323 else:
–> 324 output_tensor = layer(self.outputs[0])
325 if type(output_tensor) is list:
326 raise Exception(‘All layers in a Sequential model ‘
/home/nbuser/anaconda3_410/lib/python3.5/site-packages/keras/engine/topology.py in __call__(self, x, mask)
515 if inbound_layers:
516 # This will call layer.build() if necessary.
–> 517 self.add_inbound_node(inbound_layers, node_indices, tensor_indices)
518 # Outputs were already computed when calling self.add_inbound_node.
519 outputs = self.inbound_nodes[-1].output_tensors
/home/nbuser/anaconda3_410/lib/python3.5/site-packages/keras/engine/topology.py in add_inbound_node(self, inbound_layers, node_indices, tensor_indices)
569 # creating the node automatically updates self.inbound_nodes
570 # as well as outbound_nodes on inbound layers.
–> 571 Node.create_node(self, inbound_layers, node_indices, tensor_indices)
572
573 def get_output_shape_for(self, input_shape):
/home/nbuser/anaconda3_410/lib/python3.5/site-packages/keras/engine/topology.py in create_node(cls, outbound_layer, inbound_layers, node_indices, tensor_indices)
153
154 if len(input_tensors) == 1:
–> 155 output_tensors = to_list(outbound_layer.call(input_tensors[0], mask=input_masks[0]))
156 output_masks = to_list(outbound_layer.compute_mask(input_tensors[0], input_masks[0]))
157 # TODO: try to auto-infer shape if exception is raised by get_output_shape_for.
/home/nbuser/anaconda3_410/lib/python3.5/site-packages/keras/layers/recurrent.py in call(self, x, mask)
225 constants=constants,
226 unroll=self.unroll,
–> 227 input_length=input_shape[1])
228 if self.stateful:
229 updates = []
/home/nbuser/anaconda3_410/lib/python3.5/site-packages/keras/backend/tensorflow_backend.py in rnn(step_function, inputs, initial_states, go_backwards, mask, constants, unroll, input_length)
1304 loop_vars=(time, output_ta) + states,
1305 parallel_iterations=32,
-> 1306 swap_memory=True)
1307 last_time = final_outputs[0]
1308 output_ta = final_outputs[1]
/home/nbuser/anaconda3_410/lib/python3.5/site-packages/tensorflow/python/ops/control_flow_ops.py in while_loop(cond, body, loop_vars, shape_invariants, parallel_iterations, back_prop, swap_memory, name)
2634 context = WhileContext(parallel_iterations, back_prop, swap_memory, name)
2635 ops.add_to_collection(ops.GraphKeys.WHILE_CONTEXT, context)
-> 2636 result = context.BuildLoop(cond, body, loop_vars, shape_invariants)
2637 return result
2638
/home/nbuser/anaconda3_410/lib/python3.5/site-packages/tensorflow/python/ops/control_flow_ops.py in BuildLoop(self, pred, body, loop_vars, shape_invariants)
2467 self.Enter()
2468 original_body_result, exit_vars = self._BuildLoop(
-> 2469 pred, body, original_loop_vars, loop_vars, shape_invariants)
2470 finally:
2471 self.Exit()
/home/nbuser/anaconda3_410/lib/python3.5/site-packages/tensorflow/python/ops/control_flow_ops.py in _BuildLoop(self, pred, body, original_loop_vars, loop_vars, shape_invariants)
2448 for m_var, n_var in zip(merge_vars, next_vars):
2449 if isinstance(m_var, ops.Tensor):
-> 2450 _EnforceShapeInvariant(m_var, n_var)
2451
2452 # Exit the loop.
/home/nbuser/anaconda3_410/lib/python3.5/site-packages/tensorflow/python/ops/control_flow_ops.py in _EnforceShapeInvariant(merge_var, next_var)
584 “Provide shape invariants using either the
shape_invariants”585 “argument of tf.while_loop or set_shape() on the loop variables.”
–> 586 % (merge_var.name, m_shape, n_shape))
587 else:
588 if not isinstance(var, (ops.IndexedSlices, sparse_tensor.SparseTensor)):
ValueError: The shape for while_2/Merge_2:0 is not an invariant for the loop. It enters the loop with shape (1, 4), but has shape (?, 4) after one iteration. Provide shape invariants using either the
shape_invariantsargument of tf.while_loop or set_shape() on the loop variables.Hi, Jason.
Thank you for your LSTM tutorial! I would like to use it to do some predictions, however, the input_dim is two variables, and the output_dim is one, just like: input: x(t) y(t) output: y(t+1) .I have known that you answered it with the window method. I still have no idea, any suggestions?
This is an informative and fun article. Thanks!
However, for this application, ARIMA and exponential smoothing perform better out of the box without any tuning.
# Compare ARIMA vs. NN
library(forecast)
library(ModelMetrics)
df.raw <- read.csv('international-airline-passengers.csv', stringsAsFactors=FALSE)
df <- ts(df.raw[,2], start=c(1949,1), end=c(1960,12), frequency=12)
# Same train/test split as example
train.size <- floor(length(df) * 0.67)
ts.train <- ts(df[1:train.size], start=c(1949,1), frequency=12)
ts.test <- ts(df[(train.size+1):length(df)], end=c(1960,12), frequency=12)
ts.fit <- auto.arima(ts.train)
ets.fit <- ets(ts.train)
fcast <- forecast(ts.fit, 4*12)
y_hat <- fcast$mean
# Simple ARIMA vs. NN has RMSE = 8.83/26.47 vs. 22.61/51.58 for train/test
ModelMetrics::rmse(ts.train, fcast$fitted)
ModelMetrics::rmse(ts.test, y_hat)
# ETS is even better ... RMSE 7.25/23.05
ets.fcast <- forecast(ets.fit, 4*12)
ModelMetrics::rmse(ts.train, ets.fcast$fitted)
ModelMetrics::rmse(ts.test, ets.fcast$mean)
`
Agreed Benjamin. The post does show how LSTMs can be used, just not a very good use on this dataset.
Is this Python too?
I have a question is how to predict the data outside the dataset
Hi libra, train your model your training data and make predictions by calling model.predict().
The batch size/pattern dimensions must match what was used to train the network.
Hi, does the dataset need to be continuous … if i have intermittent missing data then is it supposed to work ?
You can use 0 to pad and to mark missing values Nilavra.
Also, try consider imputing and see how that affects performance.
Hi Jason,
This is a wonderful tutorial. As a beginner, just wondering, how do I know when I should add a layer and when I should add more neurons in a layer?
Great question.
More layers offer more “levels of abstraction” or indirection, depending on how you want to conceptualize.
More nodes/modules in a layer offers more “capacity” at one level of abstraction.
Increasing the capacity of the network in terms of layers or neurons in a layer will both require more learning (epochs) or faster learning (learning rate).
What is the magic bullet for a given problem? There’s none. Find a big computer with lots of CPU/RAM and grind away a suite of ideas on a sample of the dataset to see what works well.
Thanks for the reply, another question is, is there a typical scenario we should use stacked LSTM instead of the normal one?
When you need more representation capacity.
It’s a vague answer , because it’s a hard question to answer objectively, sorry.
Hi Jason,
Many thanks for the tutorial. Very useful indeed.
Following up the question from Aubrey Li and your response to that, does it mean that if I double the number of LSTM nodes (from four to eight), it will perform better?. In other words, how did you decide that number of LSTM nodes to be of 4 and not 6 or 8?
Thanks 🙂
Regards
Je
It may perform better but may require a lot more training.
It may also not converge or it may overfit the problem.
Sadly, there is no magic bullet, just a ton of trial and error. This is why we must develop a strong test harness for a given problem and a strong baseline performance for models to out-perform.
Thanks Jason. Please keep throwing all these nice and very informative blogs / tutorials.
Je
Thanks Je.
Hi Jason
I’ve been struggling with a particular problem and I am hoping you can assist. Basically, I’m running a stateful LSTM following the same logic and code as you’ve discussed above and in addition I’ve played around a bit by adding for example a convolutional layer. My issue is with the mean squared error given at the last epoch (where verbose=2 in model.fit) compared to the mean squared error calculated from trainPredict as in the formula you provide above. Please correct me if I am wrong, but my intuition tells me that these two mean square errors should be the same or at least approximately equal because we are predicting on the training set. However, in my case the mean square error calculated from trainPredict is nearly 50% larger than the mean square error at the last epoch of model.fit. Initially, I thought this had something to do with the resetting of states, but this seems not to be the case with only small differences noticed through my investigation. Does anything come to mind of why this may be? I feel like there is something obvious I’m missing here.
model.compile(loss=’mean_squared_error’, optimizer=ada)
for i in range(500):
XXm = model.fit(trainX, trainY, nb_epoch=1, batch_size=bats, verbose=0,
shuffle=False)
model.reset_states()
print(XXm.history)
at epoch 500: {‘loss’: [0.004482088498778204]}
trainPredict = model.predict(trainX, batch_size=bats)
mean_squared_error(trainY, trainPredict[:,0])
Out[68]: 0.0064886363673947768
Thanks
I agree with your intuition, I would expect the last reported MSE to match a manually calculated MSE. Also, it is not obvious from a quick scan where you might be going wrong.
Start off by confirming this expectation on a standalone small network with a contrived or well understand dataset. Say one hidden layer MLP on the normalized boston house price dataset.
This is a valuable exercise because it cuts out all of the problem specific and technique specific code and concerns and gets right to the heart of the matter.
Once achieved, now come back to your project and cut it back to the bone until it achieves the same outcome.
Let me know how you go.
Hi Jason
Thanks for getting back to me.
I followed your suggestion by running a simple MLP using the housing dataset but I’m still seeing differences. Here is my code as well as the output:
%reset -f
import numpy
seed = 50
numpy.random.seed(seed)
import pandas
from keras.models import Sequential
from keras.layers import Dense
from sklearn.metrics import mean_squared_error
dataframe = pandas.read_csv(“housing.csv”, delim_whitespace=True,
header=None)
dataset = dataframe.values
X = dataset[:,0:13]
Y = dataset[:,13]
model = Sequential()
model.add(Dense(13, input_dim=13, init=’normal’, activation=’relu’))
model.add(Dense(1, init=’normal’))
model.compile(loss=’mean_squared_error’, optimizer=’adam’)
nep=100
mhist = model.fit(X, Y, nb_epoch=nep, batch_size=3, verbose=0)
print ‘MSE on last epoch:’, mhist.history[“loss”][nep-1]
PX=model.predict(X)
print ‘Calculated MSE:’, mean_squared_error(Y, PX)
MSE on last epoch: 30.7131816067
Calculated MSE: 28.8423397398
Please advise. Thanks
Apologies. I forgot to scale. Used a MinMaxScaler
scalerX = MinMaxScaler(feature_range=(0, 1))
scalerY = MinMaxScaler(feature_range=(0, 1))
X = scalerX.fit_transform(dataset[:,0:13])
Y = scalerY.fit_transform(dataset[:,13])
MSE on last epoch: 0.00589414117318
Calculated MSE: 0.00565485540125
The difference is about 4%. Perhaps this is negligible?
Might be small differences due to random number generators and platform differences.
Hi Jason,
Thank you for an excellent introduction to using LSTM networks for time series prediction; I learned a great deal from this article. One question I did have: if I wanted to plot the difference between the data and prediction, would it be correct to use something like (in the case of the training data):
plt.plot(trainY[0]-trainPredict[:,0]),plt.show()
Once again, many thanks.
Regards,
David
For the codes with stacked ltsm, I’m getting the following error. Copy paste the whole thing doesn’t work either. Any help?
The shape for while_1/Merge_2:0 is not an invariant for the loop. It enters the loop with shape (1, 4), but has shape (?, 4) after one iteration. Provide shape invariants using either the
shape_invariantsargument of tf.while_loop or set_shape() on the loop variables.Ouch, I’ve not seen that before.
Perhaps try StackOverflow or the google group for the backend that you’re using?
Hi Jason.
Thanks for all you valuable advice here.
I have trained a model for time series prediction on a quite big data set, which took 12 hours for 100 epochs.
The results (validation accuracy) stayed flat for the first 90 epochs and then began to move up.
Now wonder how to add more training on top of a trained model in Keras without loosing the training gained from the first 100 epochs?
Best regards
Søren
Hi Søren,
You can save the weights of your network. Then later load them and continue training / refining weights.
See here for more info on saving and loading a network:
https://machinelearningmastery.com/save-load-keras-deep-learning-models/
Hi Jason,
Another question towards the normalisation. Here, we are lucky to have all the data for training and testing. And this has enabled us to normalise the data (MinMaxScaler). However, in real-life, we may not have all the data in one go and in fact it is very likely the case that we will be receiving data from streams. In such cases, we will never has the max or min or even the sum. How do we handle this case (so that we can feed the RNN with the normalised values?).
One obvious solution, perhaps, is calculating this over the running data. But that will be an expensive approach. Or something to do with stochastic sampling strategy ? Any help Jason?
Thanks in advance
Kind Regards
Je
Great question Je.
For normalization we need to estimate the expected extremes of the data (min/max). For standardization we need to estimate the expected mean and standard deviation. These can be stored and used any time to validate and prepare data.
For more on normalizing and standardizing time series data, see this post:
https://machinelearningmastery.com/normalize-standardize-time-series-data-python/
Hi Jason,
Thanks for the response and for the pointer. Useful – I have to say. 🙂
Kind Regards
Je
Glad to hear it!
Thanks Jason for the response and for the pointer. Useful – I have to say. 🙂
Hi Jason,
Great article! I got a lot of benefits from your work.
One question here, lots of LSTM code like yours use such
trainX[1,2,3,4] to target trainY[5]
trainX[2,3,4,5] to target trainY[6]
…
It is possible to make trainY also be time series? like
trainX[1,2,3,4] to target trainY[5,6]
trainX[2,3,4,5] to target trainY[6,7]
…
So the prediction will be done at once rather than 5 and then 6.
Best regards,
Yes, Shaun.
Reform the dataset with two output variables. Then change the number of neurons in the output layer to 2.
I will have an example of this on the blog in coming weeks.
Thanks, I look forward to your example! I really wonder the advantages and disadvantages in doing so.
Hi Jason, I am here again. I have achieved my goal to predict more than one day in this period of time. But now I have another question. I make X=[x1,x2…x30] and Y=[y1,y2…y7], which means I use 30 days to predict 7 days. When predicting y2, actually I used the real value. So here is the question. How can I put my predicted number,like y2,to the X sequence to predict y3? I am looking forward to your answer.
Thank you very much
Hi Jason, a great tutorial. I’m a newbie, and trying to understand this code. My understanding of Keras is that time steps refers to the number of hidden nodes that the system back propagates to through time, and input dimensions refers to the number of ‘features’ for a given input datum (e.g. if we had 2 categorical values, the input dimensions would be 2). So what confuses me about the code is that it tries to model past values (look back) as the number of input dimensions. Timesteps is always set to 1. In that case isn’t the system not behaving like a recurrent network at all but more like an MLP? Thanks!
Hi Kavitha,
The tutorial demonstrates a number of ways that you can use LSTMs, including using lag variables as input features and lag variables as time steps.
Got it, thank you!
hi jason,
thank you for this great Tuto
with one timestep what is the difference between an MLP and lstm
LSTMs are a very different architecture to MLP. The internal state and gates will result in a different mapping function being learned.
Using a single time step input would not be a good use for an LSTM.
Hi Jason, I am looking for a machine learning algorithm that can learn the timing issues like debounce and flip flops in logic circuits and predict an output.
Sounds like an interesting problem Nishat.
This post might help you frame your problem for predictive modeling:
https://machinelearningmastery.com/how-to-define-your-machine-learning-problem/
I think this is wrong :len(dataset)-look_back-1
it should be len(dataset)-look_back
Hi,
I would like to point out that the graphics
LSTM Trained on Regression Formulation of Passenger Prediction Problem
is the most confusing part of the article.
The red line is NOT the actual prediction for 1,2,3, etc. steps ahead. As we can see from the data, you need to know the REAL value just at the time T to predict T+1, it is not based on your prediction in this setup.
If you need to do a prediction for more steps ahead a different approach is needed.
I am still grateful for the parts of the code you have provided, but this part led me way away from my goal.
Hi Jakub, do you have any idea on what approach to take for multi-step ahead prediction?
Hi,
I would control the input of the internal gate of the cell memory. is it a possible thing to do?
In case of yes, what are the function that allow it? Thanks!
I don’t believe this is the case in Keras Salvo. I’m happy to be corrected though.
Thanks for your help! These articles are very useful for my studies!
I’m glad to hear that Salvo.
in the “LSTM for Regression with Time Steps”
how can we add more layers to the model ?
model = Sequential()
model.add(LSTM(4, input_dim=1))
model.add(Dense(1))
model.compile(loss=’mean_squared_error’, optimizer=’adam’)
model.fit(trainX, trainY, nb_epoch=100, batch_size=1, verbose=2)
How can I add another Layer or more Layers ?
Hi Nader,
Set the batch_input_shape on each layer and set the return_sequences argument on all layers except the output layer.
I’d recommend carefully re-reading the words and code in the section titled “Stacked LSTMs with Memory Between Batches”.
I hope that helps.
Jason,
Thanks for the nice blog. What Hardware configurations are required for running this program?
Hi Anthony, you’re welcome.
A normal PC without a GPU is just fine for running small LSTMs like those in this tutorial.
I have a small question. I dont see how look_back feature is relevant. If I put look_back to zero or one but increase memory units to lets say 20, I get much better results because the network itself “learns” to look back as much as its needed. Can you replicate that? Isn’t that the whole point of LSTM?
How do you recommend we include additional features, such as
moving averages, standard deviation,etc.. ?
Also, how would we tune the Stacked LSTMs with Memory Between Batches
to achieve better accuracy ?
Thanks Jason for a wonderful post. Your code uses keras which has tensorflow working in the background. Tensorflow is not available under Windows platform. Is there any way one could run this code in windows?
I am using Anaconda.
Hi Anthony, absolutely. Use the Theano backend instead:
Correction 04.2017: Its available on Windows/Anaconda
I think the way data is normalized in this tutorial is not correct. The shows hetroskadicity and hence needs advanced method of normalization.
I agree Akhilesh.
The series really should have been made stationary first. A log or box-cox transform and then differenced.
I’m sorry to tell you that this is no prediction.
Your LSTM network learned to save the value from t-1 and retrieve it at time t.
Try one thing… train this model on that dataset… and test this on a hole different Timeseries. E.g. a sincurve.
You will get the inputted sincurve with an offset of 1 timestep out. Maybe with some distortion in it.
I can get the same results with an stupid arima model…
This is no prediction at all. It just a stupid system.
Kind Regards,
S. Wollner
Thanks S. Wollner,
It is a trivial perhaps even terrible prediction example, but it does show how to use the LSTM features of Keras.
I hope to provide some updated examples soon.
If the example is not predicting anything, is this article somehow misleading for those trying to predict with this code?
Now I have two adapted versions of the example, feeded with own data.
One from Wollner and one from Jason. Both are running and plotting.
With some additions, I’m even able to forecast unseen data- BUT…
As beginner, how can I decide whether I’m dealing with real predictions or not?
Compare to a persistence model:
https://machinelearningmastery.com/persistence-time-series-forecasting-with-python/
Thank you Jason.
When will you provide updated examples?
I have many updated examples, you can get started here:
https://machinelearningmastery.com/start-here/#deep_learning_time_series
Hi again,
I’ve updated your example so that a real prediction is possible.
What I did:
set look_back to 25
add a linear activation to the Dense layer
and changed trainings settings like batch size
optionally I added detrending and stationarity of signal (Currently it’s commented out)
Here is the code:
import numpy
import math
import matplotlib.pyplot as plt
import pandas
from keras.models import Sequential
from keras.layers import Dense
from keras.layers import LSTM
from keras.layers import Activation
from sklearn.preprocessing import MinMaxScaler
from sklearn.metrics import mean_squared_error
# fix random seed for reproducibility
numpy.random.seed(7)
# load the dataset
dataframe = pandas.read_csv(‘international-airline-passengers.csv’, usecols=[1], engine=’python’, skipfooter=3)
dataset = dataframe.values
dataset = dataset.astype(‘float32′)
#plt.plot(dataset);
#plt.show();
# normalize the dataset
#dataset = numpy.log10(dataset) # stationary signal
#dataset = numpy.diff(dataset, n=1, axis=0) # detrended signal
dataset = (dataset – numpy.min(dataset)) / (numpy.max(dataset) – numpy.min(dataset)) # normalized signal
#plt.plot(dataset);
#plt.show();
# split into train and test sets
train_size = int(len(dataset) * 0.67)
test_size = len(dataset) – train_size
train, test = dataset[:train_size,:], dataset[train_size:len(dataset),:]
print(len(train), len(test))
# convert an array of values into a dataset matrix
def create_dataset(dataset, look_back=1):
dataX, dataY = [], []
for i in range(len(dataset)-look_back-1):
a = dataset[i:(i+look_back), 0]
dataX.append(a)
dataY.append(dataset[i + look_back, 0])
return numpy.array(dataX), numpy.array(dataY)
# reshape into X=t and Y=t+1
look_back = 25
trainX, trainY = create_dataset(train, look_back)
testX, testY = create_dataset(test, look_back)
# reshape input to be [samples, time steps, features]
trainX = numpy.reshape(trainX, (trainX.shape[0], 1, trainX.shape[1]))
testX = numpy.reshape(testX, (testX.shape[0], 1, testX.shape[1]))
# create and fit the LSTM network
model = Sequential()
model.add(LSTM(100, input_dim = look_back))
model.add(Dense(1))
model.add(Activation(“linear”))
model.compile(loss=’mean_squared_error’, optimizer=’adam’)
#model.compile(loss=”mean_squared_error”, optimizer=”rmsprop”)
model.fit(trainX, trainY, nb_epoch=100, batch_size=25, validation_data=(testX, testY), verbose=1)
score = model.evaluate(testX, testY, verbose=0)
print(‘Test score:’, score)
# make predictions
trainPredict = model.predict(trainX, verbose=0)
testPredict = model.predict(testX, verbose=0)
# shift train predictions for plotting
trainPredictPlot = numpy.empty_like(dataset)
trainPredictPlot[:, :] = numpy.nan
trainPredictPlot[look_back:len(trainPredict)+look_back, :] = trainPredict
# shift test predictions for plotting
testPredictPlot = numpy.empty_like(dataset)
testPredictPlot[:, :] = numpy.nan
testPredictPlot[len(trainPredict)+(look_back*2)+1:len(dataset)-1, :] = testPredict
# plot baseline and predictions
plt.plot(dataset)
plt.plot(trainPredictPlot)
plt.plot(testPredictPlot)
plt.show()
Kind regards
S. Wollner
Hello Wollner,
I tried to follow your code, however i got the prediction as a straight line. Where do you think i went wrong.
Thank you.
Hello Mr. Wollner,
Would you please explain what’s the point of plotting the ‘dataset’, ‘trainPredictPlot’, and ‘testPredictPlot’ together?
I see that they are not single vectors;
trainPredictPlot.shape = (num_samples, num_variables)
testPredictPlot.shape = (num_samples, num_variables)
num_points: What does it represent here?
num_variables: is the number of both input variables and the output variable.
I have used this code: https://machinelearningmastery.com/multivariate-time-series-forecasting-lstms-keras/
and I added the last part of the forecasting from this code: https://www.kaggle.com/fatmakursun/time-series-forecasting-unknown-future/
but I’m getting the new forecasting curve as a flat line, although the training and validation steps were very good. Would you please take a look at my code here and tell me how can I fix the problem of the forecasting?
https://github.com/MohamedNedal/lstm/tree/master
I don’t recommend using the above tutorial (as is stated), instead start here:
https://machinelearningmastery.com/time-series-forecasting-long-short-term-memory-network-python/
Jason,
Thank you for this excellent post. I have reproduce the example and also used a real time-series data set successfully. But I have a simple question:
How I can generate a sequence of predict new values? I mean future values (no the test values), for example, the six first months of the year 1961; values for 1961-01, 1961-02,…1961-06.
Luis
Hi Luis, you can make predictions on new data by calling y = model.predict(X)
Hi Jason,
I hope I don’t ask for something already in the comments, but at least I did not see it. All my apologizes else.
Based on your dataset, let’s assume that we have more features than only the number of passengers per unit of time, for example the “current” weather, fuel price,… whatever.
If I want to use them in the training, the idea is the same, for each one I “copy” the n loopback values for each sample ?
Thanks
Hi Shazz,
I would recommend creating a new dataset using DataFrame.shift() rather than the crude loop back function in this example.
Hello S. Wollner:
I too notice the predictions to be simply mimicking the last known value.
Thanks for posting your code.
I had a couple questions on your post:
1. How did you set the batch_size ? It appears that matches the lookback.
Is that intentional ?
2. Similarly, how did you know how to set the number of neurons to 100 via this line:
model.add(LSTM(100, input_dim = look_back)) ?
That appears to be 4*look_back ?
Hi Sam,
To 1.:
No it doesn’t have to match the look_back amount.
Here is a similar question and a good answer
http://stats.stackexchange.com/questions/153531/what-is-batch-size-in-neural-network
Short, you devide your time series into pieces for training. In this case:
Training_set_size = (data_size * train_size – forecast_amount) / look_back
That is the set for training your network. Now you devide it by the batch_size.
Each batch should have more or less the same size.
In the link above you will see pros and cons about the size of each batch.
To 2.:
Try and error, like almost everything with neuronal networks. That’s parameter optimization. There is no true config for all problems. The more neurons you have, the more powerful your network can be. The problem is you also need a larger trainingset.
Normally you iterate through the number of neurons. E.g. you start at 2 and go up till 100 in a step size of 2 neurons. For each step you calculate at least 35 networks (statistical expression) and calculate the mean and variance over the error of train- and testset.
Plot all the results in a graph and take the network with less complexity and best TEST rate (not train!). Consider variance and mean!!!
That’s a paper from our research group. In this paper you’ll see such a graphic for lvq networks (Figure 4).
http://isommer.informatik.fh-schmalkalden.de/publications/2002_Sci_doc.pdf
Kind regards,
S. Wollner
Thanks S. Wollner for the guidance.
I’m currently trying to use this LSTM RNN to predict monthly stock returns.
Again though I cannot beat the naive benchmark of simply predicting
t+1 = t or predicting the future return is simply the last known/given return at time t.
I’m wondering what else I can tune /change in the LSTM RNN to remove
the” mimicking” effect ?
The major difficulty here is that the time series is non stationary – it is both mean trending and the variance is exploding as well. It is very hard to forecast using this time series.
You get around this by scaling using the entire dataset, therefore violating the in-sample out-of-sample separation. In other words, you are looking into the future, i.e. your test set, for scaling – which unfortunately is not possible in real life.
Hi berkmeister,
The level can be made stationary with order one differencing.
The variance can be made stationary with log or box-cox transforms.
Both methods can be used on test and training data.
Hi Jason,
Many thanks to your post and tutorial. I really got the most beneficial of ideas to apply the LSTM to my problem.
I’m glad to hear that.
I believe I have made the stock data in my dataset stationary by taking the first difference of the log of the prices.
However, if I want to include additional features such as
volatility, a moving average, etc… would those be computed
on the ORIGINAL stock prices or on the newly calculated
log differences, which are stationary ?
Great question Sam.
I don’t work with security prices myself, but I expect you will want those measures on the original data.
From a feature engineering perspective, I’d recommend testing alternatives and use what results in the most accurate predictive models.
Regarding predicting security prices in the short term, consider using a persistence model:
https://machinelearningmastery.com/gentle-introduction-random-walk-times-series-forecasting-python/
Another question I had was on performing 2 or more day ahead forecasts on a stationary time series
with first differences.
For example, if we want to forecast 5 days ahead of day (instead of 1 day), would we instead use
the differences between t and t-5 ?
Hi Sam,
Forecasts would be made one time step at a time. The differences can then be inverted from the last known observation across each of the predicted time steps.
I hope that answers your question.
Unfortunately I’m not able to follow.
Suppose we have the following stock price history
Date Price Difference
1/2/2017 100
1/3/2017 102 2
1/4/2017 104 2
1/5/2017 105 1
1/6/2017 106 1
1/7/2017 107 1
1/8/2017 108 1
If we want to forecast what the price will be on January 8th STARTING from January 3rd (a 5 day horizon),
how would build the differences to make the series stationary? If we continue with first differences, then I believe we would only be forecasting the change from Jan 7th to Jan 8, which is still
a 1 day change, not a 5 day ?
Thanks again.
Hi Sam,
Off the cuff: The LSTM can forecast a 5-day horizon by having 5 neurons in the output layer and learn from differenced data. The difference inverse can be applied from the last know observation and propagated along the forecast to get back to domain values.
Alright, so if I understand correctly, the 5 outputs from the output layer
would correspond to the differences between days 0-1,1 -2, 2-3,3-4, 4-5 respectively?
Thanks for your patience.
Correct Sam.
One more question on that:
Would I also need to modify the target values (trainY) so they
contained 5 targets per sample, instead of just one ? That is to match up the
5 RNN outputs ?
Thanks,
Yes.
Hi, Jason
I have some question about using multivariable.
Did I understand correctly?
for example, if i have three variables and one window (just one day, continuous data)
data structure is In this way,
variable1 variable2 variable3 output1
(input_shape=(1, 3))
and, if i have three variables and two windows (two day, continuous data)
data structure is In this way,
variable1(t-1) variable2(t-1) variable3(t-1) output1(t-1)
variable1 variable2 variable3 output1
(input_shape=(2, 3))
is it right way? thank in advance
Many thanks to your post and tutorial. I really got the most beneficial of ideas to apply the LSTM to my problem.
I have some questions:
1): How to save the test data and predict dat to a text file?
2): How to save the output image ?
Thanks a lot.
You can save data to a file using Python IO functions, npy functions for saving the matrix, or wrap it in a dataframe and save that.
You can save a plot using the matplotlib function savefig().
Thanks for your quickly reply. I have resolved the problem.
I’m glad to hear that.
Hi, Jason
It’s a great tutorial. I have learnt a lot from it. Thank you very much.
By the way, is it possible to use the LSTM-RNN to obtain the predictions with a probability distribution? I think it will be even better if LSTM-RNN can do this.
Please let me know if I have the wrong thinking.
Sure Tony, you could use a sigmoid on the output layer and interpret it as a probability distribution.
Thank you for your quickly reply.
Maybe I have asked in a wrong way. I mean like the example above, is it possible we get the probability distributions of the predicted future passengers at the same time? In other words, how confident we are sure about the prediction accuracies.
Not directly Tony.
Thank you for this, it has been a great help in debugging my own keras RNN code. A suggestion for your root LSTM for Regression with Time Steps model, as examples of what else you could do:
First, incorporate the month number as a predictor. This helps with the obvious seasonality in the time series. You can do this by creating an N-by-lookback shaped matrix where the value equals the month number (0 for January, …, 11 for December). I did it by adjusting the create_dataset function to look like
def create_dataset(dataset, look_back=1):
dataX, dataY, dataT = [], [], []
for i in range(len(dataset)-look_back-1):
a = dataset[i:(i+look_back), 0]
dataX.append(a)
dataY.append(dataset[i + look_back, 0])
b = [x % (12) for x in range(i, i+(look_back))] #12 because that’s how many months are in a year
dataT.append(b)
return numpy.array(dataX), numpy.array(dataY), numpy.array(dataT)
Then, feed this into an embedding layer to create a one-hot vector of 12 dimensions. Your model will now have two branches (one for the time series and one for the vector of month indicators), that merge into a single model containing the RNN. F. Chollet has some examples at https://keras.io/getting-started/sequential-model-guide/. I did it with
month_model = Sequential()
month_model.add(Embedding(12, 12, input_length=look_back))
month_model.add(GRU(output_dim=4, return_sequences=True))
month_model.add(TimeDistributed(Dense(look_back)))
series_model = Sequential()
series_model.add(Dense(look_back, input_shape=(look_back,1)))
model = Sequential()
model.add(Merge([month_model, series_model], mode=’concat’, concat_axis=-1))
model.add(GRU(4, return_sequences=False))
model.add(Dense(1))
model.compile(loss=’mean_squared_error’, optimizer=’adam’)
Lastly, I used a callback to ensure that the model didn’t overfit during the 100 epochs. Specifically, if the loss on the validation set stopped decreasing, the model would early terminate. I found I didn’t really need even half of the epochs, thus saving some time. E.g.,
early_stopping = EarlyStopping(monitor=’val_loss’, patience=3)
model.fit([np.array(trainT.squeeze()),trainX], trainY.squeeze(), validation_data=([np.array(testT.squeeze()),testX],testY.squeeze()), nb_epoch=100, batch_size=1, verbose=2, callbacks=[early_stopping])
Using a lookback of 3, my training set had a RMSE of 7.38, and 17.69 for the validation set. Which I think is a pretty decent improvement with minimal additional work.
Very nice Amw, thanks!
Hello, I was testing your code, when you run the function create_dataset, it gives an error:
trainX, trainY = create_dataset(train, look_back)
ValueError: too many values to unpack (expected 2)
Hi Dan,
Perhaps check that you do not have any extra white space and that you have not modified the example.
I think you are missing some Keras dependencies. Make sure you have:
from keras.models import Sequential
from keras.layers import Dense
from keras.layers import Embedding
from keras.layers import GRU
from keras.layers import Merge
from keras.layers import TimeDistributed
from keras.callbacks import EarlyStopping
The error comes from: trainX,trainY = create_dataset(train, look_back), If I remove trainY, it works…wtf
Nice idea.
What do you feed into trainPredict and testPredict?
trainPredict = model.predict(numpy.array(trainT.squeeze()),trainX], batch_size=batch_size)
gives me an invalid syntax error.
Hi KJ,
For me it worked with the following syntax:
trainPredict = model.predict([numpy.array(trainT.squeeze()),trainX])
testPredict = model.predict([numpy.array(testT.squeeze()),testX])
Glad to hear it, thanks for the tip.
Dear Amw and Jason,
I have a lot of measurements of solar pannels’ production sampled every 10 minutes.
I would like to use these samples to predict the production for the next timestep.
Since the pannels are in different places, I am confident I can use the past measurements to predict a pannels future production.
I have used your tutorial so far, so use a few pannels’ production at T-1 to predict one pannel’s production at T.
Time would also be a very valuabe information to add to my model, since I have daytime related periodicity.
I am glad I found Amw’s post to handle this problem.
I am not really sure I fully understand how you use time in this model. Can you explain a little further what is happenning here when merging the two models ?
I also have a problem wih dimension. Do I need to provide a ‘time’ feature at each step that has the same length as my productions ?
Since I use several pannels’ productions at T-1, do I need to provide the model a vector with n_features times the same hour of the day ?
Thank you in advance for your help
Hi Amw,
I very much like your idea of improving this solution, but I cannot make it work. I got the same error as Dan, but instead of removing trainY I added also trainT.
But then I got another error: The model expects 2 arrays, but only received one array.
Is there any change you could upload the entire code, please?
Thank you!
Hi Amw,
Great illustration of merging! As a note to future readers, the Merge layer is deprecated and was scheduled to be removed in August 2017. Recommended usage is now through keras.layers.merge.
I have some examples here:
https://machinelearningmastery.com/keras-functional-api-deep-learning/
Hello Sir,
This guide is amazing, but how can we use that to predict out of sample ?
Thank you
Train your model on all your historical data then call model.predict().
It didn’t work for me. I’ve done: train_size = int(len(dataset) * 1)
and removed all the test data but still it does predict inside the samples.
Is there a function that I should add ?
Thank you for this great post.
I just have two questions:
1) What would be the code to add to show the accuracy in percentage?
2) How can I code the red line to show the next prediction at the end of the chart?
Thank you in advance.
Hi Chris,
It is a regression problem so accuracy does not make sense. If it were a classification problem, the activation function in the output layer would have to be changed to sigmoid or similar.
You can predict the next out of sample value by training the model on all available data and calling model.predict()
Ok, I will try.
Thank you Jason 😉
I really appreciate the time you put into this very detailed explanation of time series prediction. I think there are a couple of errors in your code, which appear to be confusing a lot of people:
1. When you read the file, skipfooter should = 2, not 3, as there are only two lines of data after the last value. The existing code prevents the last value from being added to dataset.
2. Similarly, in create_dataset, you should not subtract 1 in the range of the for loop. Again, this prevents the last value from being added to dataX and dataY.
3. Finally, you should not use the the shift train prediction, and the shift test prediction is incorrect. This has the effect of making it appear that the prediction at t=0 instead of t+1. I think this is why many people have been asking how to predict the last value.
Here is my code which both demonstrates and fixes these issues. Please feel free to tell me I’m wrong.
# Stacked LSTM for international airline passengers problem with memory
import numpy
import matplotlib.pyplot as plt
import pandas
import math
from keras.models import Sequential
from keras.layers import Dense
from keras.layers import LSTM
from sklearn.preprocessing import MinMaxScaler
from sklearn.metrics import mean_squared_error
# convert an array of values into a dataset matrix
def create_dataset(dataset, look_back=1):
dataX, dataY = [], []
for i in range(len(dataset)-look_back): # – 1 IS WRONG. IT PREVENTS LAST VALUE OF DATASET FROM BEING USED FOR dataX AND dataY
a = dataset[i:(i+look_back), 0]
dataX.append(a)
dataY.append(dataset[i + look_back, 0])
return numpy.array(dataX), numpy.array(dataY)
# fix random seed for reproducibility
numpy.random.seed(7)
# load the dataset
# No header on data
dataframe = pandas.read_csv(‘international-airline-passengers.csv’, usecols=[1], engine=’python’, skipfooter=2) # 3 IS WRONG AS THERE ARE ONLY TWO LINES IN THE FOOTER. THIS PREVENTS THE LAST VALUE FROM BEING READ.
dataset = dataframe.values
dataset = dataset.astype(‘float32’)
print()
print(‘Last 5 values from dataset’)
print(dataset[dataset.shape[0] – 5])
print(dataset[dataset.shape[0] – 4])
print(dataset[dataset.shape[0] – 3])
print(dataset[dataset.shape[0] – 2])
print(dataset[dataset.shape[0] – 1])
print()
# normalize the dataset
scaler = MinMaxScaler(feature_range=(0, 1))
dataset = scaler.fit_transform(dataset)
# split into train and test sets
train_size = int(len(dataset) * 0.67)
test_size = len(dataset) – train_size
train, test = dataset[0:train_size,:], dataset[train_size:len(dataset),:]
# reshape into X=t and Y=t+1
look_back = 1
trainX, trainY = create_dataset(train, look_back)
testX, testY = create_dataset(test, look_back)
# reshape input to be [samples, time steps, features]
trainX = numpy.reshape(trainX, (trainX.shape[0], trainX.shape[1], 1))
testX = numpy.reshape(testX, (testX.shape[0], testX.shape[1], 1))
# create and fit the LSTM network
batch_size = 1
model = Sequential()
model.add(LSTM(12, batch_input_shape=(batch_size, look_back, 1), stateful=True, return_sequences=True))
model.add(LSTM(12, stateful=True))
model.add(Dense(1))
model.compile(loss=’mean_squared_error’, optimizer=’adam’)
for i in range(1):
model.fit(trainX, trainY, nb_epoch=1, batch_size=batch_size, verbose=0, shuffle=False) # I JUST SET VERBOSE=0 SO IT IS EASIER TO SEE THE PRINTED DATA
model.reset_states()
# make predictions
trainPredict = model.predict(trainX, batch_size=batch_size)
model.reset_states()
testPredict = model.predict(testX, batch_size=batch_size)
# invert predictions
trainPredict = scaler.inverse_transform(trainPredict)
trainY = scaler.inverse_transform([trainY])
testPredict = scaler.inverse_transform(testPredict)
testY = scaler.inverse_transform([testY])
# print the data
testX = scaler.inverse_transform(testX[:,0,0])
print()
print(‘testX’,’testY’, ‘testPredict’)
print(testX[testX.shape[0] – 5], round(testY[0, testY.shape[1] – 5]), round(testPredict[testPredict.shape[0] – 5, 0]))
print(testX[testX.shape[0] – 4], round(testY[0, testY.shape[1] – 4]), round(testPredict[testPredict.shape[0] – 4, 0]))
print(testX[testX.shape[0] – 3], round(testY[0, testY.shape[1] – 3]), round(testPredict[testPredict.shape[0] – 3, 0]))
print(testX[testX.shape[0] – 2], round(testY[0, testY.shape[1] – 2]), round(testPredict[testPredict.shape[0] – 2, 0]))
print(testX[testX.shape[0] – 1], round(testY[0, testY.shape[1] – 1]), round(testPredict[testPredict.shape[0] – 1, 0]))
print()
# calculate root mean squared error
trainScore = math.sqrt(mean_squared_error(trainY[0], trainPredict[:,0]))
print(‘Train Score: %.2f RMSE’ % (trainScore))
testScore = math.sqrt(mean_squared_error(testY[0], testPredict[:,0]))
print(‘Test Score: %.2f RMSE’ % (testScore))
# shift train predictions for plotting THIS IS ALSO WRONG
#trainPredictPlot = numpy.empty_like(dataset)
#trainPredictPlot[:, :] = numpy.nan
#trainPredictPlot[look_back:len(trainPredict)+look_back, :] = trainPredict
trainPredictPlot = trainPredict
testPredictPlot = testPredict
# plot last 25 predictions
plt.figure(figsize=(10,4))
plt.title(‘Last 25 Predictions’)
datasetPlot = dataset[len(dataset) – 25:len(dataset),:]
plt.plot(scaler.inverse_transform(datasetPlot), color=’b’, label=’Actual’)
testPredictPlot = testPredictPlot[len(testPredictPlot) – 25:len(testPredictPlot),:]
plt.plot(testPredictPlot, color=’r’, label=’Prediction’)
plt.grid(True)
plt.legend()
plt.show()
# shift test predictions for plotting THIS IS ALSO WRONG
testPredictPlot = numpy.empty_like(dataset)
testPredictPlot[:, :] = numpy.nan
testPredictPlot[len(trainPredict) + (look_back):len(dataset) – 1, :] = testPredict
# plot baseline and predictions
plt.figure(figsize=(10,4))
plt.title(‘All Data’)
plt.plot(scaler.inverse_transform(dataset), color=’b’, label=’Actual’)
plt.plot(trainPredictPlot, color=’g’, label=’Training’)
plt.plot(testPredictPlot, color=’r’, label=’Prediction’)
plt.grid(True)
plt.legend()
plt.show()
Jason,
I have looked through most of the comments, and not seen this pointed out, but in the “Memory Between Batches” examples, you should not do the
reset_state()in between doingpredicton thetrainingandtestsets. The beginning of your test set should know that it is at the “end” of the training set, rather than at null.Thank you very much for all this, by the way, it’s been super helpful.
Are you sure?
Quote:
It requires that the training data not be shuffled when fitting the network. It also requires explicit resetting of the network state after each exposure to the training data (epoch) by calls to model.reset_states(). This means that we must create our own outer loop of epochs and within each epoch call model.fit() and model.reset_states().
If this is a prediction, should’n plot be continued like this?
http://i90.fastpic.ru/big/2017/0224/31/9aa244bfcaebaa4cc8255d858e12d731.png
Please correct me if I’m wrong, we are predicting for look_back periods? Or just t+1?
It is prediction, but the code as written doesn’t predict anything into the future. My updated code https://machinelearningmastery.com/time-series-prediction-lstm-recurrent-neural-networks-python-keras/#comment-389969 predicts one value into the future based on the existing data.
You would have to add to either code if you want to predict more than one value into the future.
I’d appreciate it if you would delete the code from my post on February 23, 2017 at 3:29 pm. I’ve made a couple of improvements to it, so it will make your comments section a lot shorter if people don’t have to read through all that old code.
The improvements are:
look_back = look_back + 1, ie. if the look_back is set to 1, each X will contain t-1 & t, rather than just the current value (t). If you just want one value, set look_back = 0.
The look_back is added to x before it is split into trainX and trainY. This allows predictions to be made on testX[0], instead of testX[look_back]. One might argue that this is letting the model use data in the training set to make predictions, but since that is only time series data, I don’t see that as a problem.
The final value in the dataset is added to testX, so the model makes a prediction for 1961-01.
There are a lot of commented out print statements to allow people to see exactly what the data looks like.
Here is the updated code:
# Stacked LSTM for international airline passengers problem with memory
import numpy
import matplotlib.pyplot as plt
import pandas
import math
from keras.models import Sequential
from keras.layers import Dense
from keras.layers import LSTM
from sklearn.preprocessing import MinMaxScaler
from sklearn.metrics import mean_squared_error
# convert an array of values into a dataset matrix
def create_dataset(dataset, look_back):
dataX, dataY = [], []
for i in range(len(dataset)- look_back):
dataX.append(dataset[i:(i + look_back), 0])
dataY.append(dataset[i + look_back, 0])
return numpy.array(dataX), numpy.array(dataY)
# fix random seed for reproducibility
numpy.random.seed(7)
# load the dataset
# https://datamarket.com/data/set/22u3/international-airline-passengers-monthly-totals-in-thousands-jan-49-dec-60#!ds=22u3&display=line
# if using a different dataset, skipfooter=2 may need to have a different value
# and if the csv file does not have a header, add header=None
dataframe = pandas.read_csv(‘international-airline-passengers.csv’, usecols=[1], engine=’python’, skipfooter=2)
dataset = dataframe.values
dataset = dataset.astype(‘float32′)
”’
# this can be deleted
# print first and last values from dataset to verify data
print()
print(‘First 15 values from dataset:’)
for i in range(15):
print(dataset[i])
print()
print(‘Last 15 values from dataset:’)
for i in range(dataset.shape[0] – 15, dataset.shape[0]):
print(dataset[i])
”’
# normalize the dataset
scaler = MinMaxScaler(feature_range=(0, 1))
dataset = scaler.fit_transform(dataset)
# reshape into X=t and Y=t+1
look_back = 10
look_back += 1
trainX, trainY = create_dataset(dataset, look_back)
# split into train and test sets
train_size = int(len(dataset) * 0.67)
test_size = len(dataset) – train_size
trainX, testX = trainX[0:train_size,:], trainX[train_size:len(trainX),:]
trainY, testY = trainY[0:train_size], trainY[train_size:len(trainY)]
”’
# this can be deleted
# print trainX and trainY to verify data
print()
print(‘trainX + trainY’)
for i in range(trainX.shape[0]):
print(i + look_back, end=’ ‘)
for c in range(look_back):
print(trainX[i,c], end=’ ‘)
print(trainY[i],” “)
print()
print(‘testX + testY’)
for i in range(testX.shape[0]):
print(i+ look_back + trainX.shape[0], end=’ ‘)
for c in range(look_back):
print(testX[i,c], end=’ ‘)
print(testY[i],” “)
”’
# reshape input to be [samples, time steps, features]
trainX = numpy.reshape(trainX, (trainX.shape[0], trainX.shape[1], 1))
testX = numpy.reshape(testX, (testX.shape[0], testX.shape[1], 1))
# create and fit the LSTM network
batch_size = 1
model = Sequential()
model.add(LSTM(4, batch_input_shape=(batch_size, look_back, 1), stateful=True, return_sequences=True))
model.add(LSTM(4, stateful=True)) # There is no need for an batch_input_shape in the second layer
model.add(Dense(1))
model.compile(loss=’mean_squared_error’, optimizer=’adam’)
for i in range(100):
model.fit(trainX, trainY, nb_epoch=1, batch_size=batch_size, verbose=0, shuffle=False) # I JUST SET VERBOSE=0 SO IT IS EASIER TO SEE THE PRINTED DATA
model.reset_states()
# make predictions
trainPredict = model.predict(trainX, batch_size=batch_size)
model.reset_states()
# add last entry from dataset to be able to predict unknown testY
a = dataset[len(dataset) – look_back:len(dataset), 0]
a = numpy.reshape(a, (1, a.shape[0]))
a = numpy.reshape(a, (a.shape[0], a.shape[1], 1))
testX = numpy.append(testX, a, 0)
testPredict = model.predict(testX, batch_size=batch_size)
# invert predictions
trainPredict = scaler.inverse_transform(trainPredict)
trainY = scaler.inverse_transform([trainY])
testPredict = scaler.inverse_transform(testPredict)
testY = scaler.inverse_transform([testY])
# print next predicted value
print()
print(‘Prediction for 1961-01:’, round(testPredict[len(testPredict) – 1, 0]))
”’
# this can be deleted
# print testX, testY and testPredict to confirm code is working
train = scaler.inverse_transform(trainX[:,0,0])
train = numpy.reshape(train, (len(train), 1))
test = scaler.inverse_transform(testX[:,0,0])
test = numpy.reshape(test, (len(test), 1))
for c in range(1, look_back):
train1 = scaler.inverse_transform(trainX[:,c,0])
train1 = numpy.reshape(train1, (len(train1), 1))
train = numpy.append(train, train1, axis = 1)
test1 = scaler.inverse_transform(testX[:,c,0])
test1 = numpy.reshape(test1, (len(test1), 1))
test = numpy.append(test, test1, axis = 1)
trainX = train
testX = test
# print number of rows in data
print()
print(‘Number of values in:’)
print(‘trainX’,’trainY’, ‘trainPredict’)
print(trainX.shape[0], ‘ ‘, trainY.shape[1], ‘ ‘, trainPredict.shape[0])
print(‘testX’,’testY’, ‘testPredict’)
print(testX.shape[0], ‘ ‘, testY.shape[1], ‘ ‘, testPredict.shape[0])
# print trainX, trainY and trainPredict to verify data
print()
print(‘trainX’ , ‘ trainY’, ‘trainPredict’)
for i in range(trainX.shape[0]):
print(i + look_back, end=’ ‘)
for c in range(look_back):
print(trainX[i, c], end=’ ‘)
print(round(trainY[0,i]), end=’ ‘)
print(round(trainPredict[i,0]), ‘ ‘)
# print testX, testY and testPredict to verify data
print()
print(‘testX’ , ‘ testY’, ‘testPredict’)
for i in range(testX.shape[0]):
print(i + look_back + trainX.shape[0], end=’ ‘)
for c in range(look_back):
print(testX[i, c], end=’ ‘)
if(i < testX.shape[0] – 1):
print(round(testY[0,i]), end=' ')
else:
print(' ', end=' ')
print(round(testPredict[i,0]), " ")
'''
# calculate root mean squared error
trainScore = math.sqrt(mean_squared_error(trainY[0], trainPredict[:,0]))
print()
print('Train Score: %.2f RMSE' % (trainScore))
print()
# THIS HAS BEEN REMOVED, BECAUSE WHEN THE LAST ENTRY IS ADDED TO testX,
# testPredict HAS MORE VALUES THAN testY, WHICH WILL THROW AN EXCEPTION
#testScore = math.sqrt(mean_squared_error(testY[0], testPredict[:,0]))
#print('Test Score: %.2f RMSE' % (testScore))
# shift train predictions for plotting
trainPredictPlot = numpy.empty_like(dataset) # create array with same shape as dataset
trainPredictPlot[:, :] = numpy.nan # fill with nan
trainPredictPlot[look_back:len(trainPredict) + look_back, :] = trainPredict
# shift test predictions for plotting
testPredictPlot = numpy.empty_like(dataset) # create array with same shape as dataset
testPredictPlot[:, :] = numpy.nan # fill with nan
test = ['nan']
test = numpy.reshape(test, (len(test), 1))
testPredictPlot = numpy.append(testPredictPlot, test, 0)
testPredictPlot[len(trainPredict) + look_back:len(dataset) + 1, :] = testPredict
# plot baseline and predictions
plt.figure(figsize=(10,4))
plt.title('All Data')
plt.plot(scaler.inverse_transform(dataset), color='b', label='Actual')
plt.plot(trainPredictPlot, color='g', label='Training')
plt.plot(testPredictPlot, color='r', label='Prediction')
plt.grid(True)
plt.grid(b=True, which='minor', axis='both')
plt.minorticks_on()
plt.legend()
plt.show()
# zoom in on the test predictions
plt.figure(figsize=(10,4))
plt.title('Test Predictions')
'''
# the next two lines plot the data set to confirm that testY is the same as the dataset
# this can be deleted
datasetPlot = dataset[len(dataset) – len(testPredict) + 1:len(dataset),:] # subtract 24, because dataset has one less value than testPredict
plt.plot(scaler.inverse_transform(datasetPlot), color='y', label='dataset')
'''
testYPlot = numpy.reshape(testY, [testY.shape[1], 1]) # testY is [0, 47] need to change shape to [47, 0] to plot it
testYPlot = testYPlot[testYPlot.shape[0] – len(testPredict) + 1:testYPlot.shape[0]] # subtract 24, because testY has one less value than testPredict
plt.plot(testYPlot, color='b', label='testY')
testPredictPlot = testPredict[len(testPredict) – len(testPredict):len(testPredict), :]
plt.plot(testPredictPlot, color='r', label='Prediction')
plt.grid(True)
plt.grid(b=True, which='minor', axis='both')
plt.minorticks_on()
plt.legend()
plt.show()
It is nearly impossible to reproduce the original formatting of this code.
Could you provide it formatted or on Github?
Thanks for the awesome tutorial, Jason, and for being so helpful in the comments!
I’d like to predict into the future using time series data that has multiple observations from each date (and goes beyond a single year), and that also has multiple other features besides just the date and the label. I would also like to predict more than 1 step into the future, and to predict multiple dependent variables simultaneously if possible. I saw how to use additional features from other comments. I also think I saw how to predict more than 1 step into the future.
Could you explain how I can use data with multiple observations from the same date? I’m really stuck on understanding that. If you have the time, could you also explain how to simultaneously predict multiple dependent variables?
One other thing…how do I normalize the data when I have multiple variables, not all of which are numbers?
Hi Robert,
Great question. I’m working on more examples like this at the moment.
Generally, multiple input features is multiple multivariate time series forecasting. You can structure you data so that each column is a new feature in the LSTM format of [samples, timesteps, features].
A time-horizon of more than one timestep is called multi-step time series forecasting. Again, you can structure your data so that the output has multiple columns and then specify the output layer of your network with that many neurons.
This post might help with restructuring your data:
https://machinelearningmastery.com/time-series-forecasting-supervised-learning/
This post might help with scaling your data:
https://machinelearningmastery.com/normalize-standardize-time-series-data-python/
I hope that helps.
Hey ,
Could you provide a github link to this code.
Regards,
Nrithya
Hello,
If my input file have multiple columns “open, high, low, close, volume”, how can I adapt the script to use all columns for training and then make prediction for “close” column?
Sorry Donald, I do not have a good tutorial for multivariate time series for you to work from. Not yet anyway.
Generally, the principles are the same as the univariate case. See this post on how to structure your data:
https://machinelearningmastery.com/time-series-forecasting-supervised-learning/
Hi,
Nice tutorial. I recently used an LSTM forecasting.
I have a couple of questions.
1. When we are providing the training set is the LSTM which is being trained equal to the length of the training data size. For example if the training data is a sequence of 10000 values then is the LSTM equal to a 10000 length unrolled recurrent net like in this blog http://colah.github.io/posts/2015-08-Understanding-LSTMs/
If so then shouldn’t we part up the data of sequences of smaller length like your tutorial in https://machinelearningmastery.com/text-generation-lstm-recurrent-neural-networks-python-keras/
2. I see that you are normalizing the entire dataset, and the data seems to be a monotonically increasing one. So any future data may not be scaled within that range .
How will you deal with such a case, where future data value is not within the range of observed data.
Hi Nilavra,
I’d recommend trying many different representations for a given perdiction problem. Try breaking it into sub-sequences, try using lag obs as features and time steps, see what works best for your problem.
It is a good idea to difference a dataset with a trend (changing level). Also, it is a good idea to power transform a dataset with an increasing variance (e.g. ideally boxcox or log). The dataset in this example could use both transforms.
Why do we see a discontinuity between train prediction (green) and test prediction (red)?
Is your lstm code performing forecasts for multiple time steps?
I have a multivariate time series in which I have fields such as business days, holidays, product launch data etc. in addition to the Y (variable to forecast). How can I implement this model using a LSTM?
I tried to modify the data such that my Nxm training set (trainX) contains m lags for N rows (using ‘create_dataset’ method from the code), and then concatenated the additional information ( business days, holidays, product launch data etc.) as columns. However, I realize that , it does not make sense. I will somehow have to pass a data vector in place of every Y value and its m lags ( containing the additional information: holidays, product launch data and other info). If this makes sense to you, please advise how to go about with this. Thanks
Hi Arslan, see this post on how to structure your data as supervised learning for multivariate time series:
https://machinelearningmastery.com/time-series-forecasting-supervised-learning/
Thank you for your great article.
However, in your example. Why don’t you consider preprocessing methods such as: log and difference dataset? Most of research papers showed that preprocessing data can improve prediction performance.
I agree, the example would be better if the data was made stationary first (log transform and differenced). I hope to cover this with fuller examples in upcoming blog posts.
Hi Jason, does this means, even though we’re making forecasting of time series using machine learning method, the pre-processing such as making the data stationary is necessary?
It can be, it depends on the specifics of the data.
Thanks for great article!!!! I now probably can practice LSTM in code! 🙂
I got one question when I try to define my LSTM network. Say if I have some different datas, dataX, dataY, dataZ and try to predict/mimic dataA. Shall I use different batches or different features? (I know feature is designed for this, but it seems batch can also do the samething, am I right?)
dataX, dataY, dataZ, dataA all hold scalar value.
Another question is practical (basically python related). Say I have dataX and try to predcit dataA. dataX = [1,2,3,…n], is there any efficient way to build training dataset like [3,2, ].
Thanks
There are many ways to represent time series data with LSTMs.
I’d recommend using a stateful LSTM with 1 lag variable as input and let it learn the sequence. Then try all other structures (timesteps/features) you can think of to see if you can out-perform your baseline.
Yes, consider using the Pandas shift() function. I offer examples in my recent time series blog posts.
Awesome post and simple (as it should be)!
What I’d like to know from this is if one could try to predict *one* signal given *n* other signals?
That would mean that the network learns about non-linear correlations between multiple signals and outputs a desired target signal. Can this be done using LSTM networks?
I don’t see why not, as long is the signals are correlated.
I have a similar dataset. However when trying to reshape the X array into the LSTM required format i receive an error : “lstm tuple index out of range”. Searched on Google but can’t find the solution that works. Any suggestions?
Check your data carefully ensure the shape you are requesting makes sense.
Remember, LSTMs require data in [samples, timesteps, features] format.
I feel like there is a delay effect happening. The shifted predicted values are closer to the value at current timestamp. Do you think there is an explanation of why that particular effect is being observed?
Would it be possible to learn to predict more than one steps ahead at once? For example, instead for giving past 3 data, learn to predict the future 3 data. (instead of only one future datum, as in your example)
Yes, you will need to reframe your problem and specify 3 neurons in the output layer.
Dear Jason Brownlee
Thanks for your useful tutorial
The topic of my master’s thesis is network bandwidth forecasting using LSTM. Can you help me with that?
No. But if you get a concrete question, we can comment on it.
Nice blog Jason!
In this tutorial you always give 4 output dimensions
model.add(LSTM(4, input_dim=look_back))
When I set the output dimension = 1, like:
model.add(LSTM(1, input_dim=look_back))
it returned error maessage:
TypeError: Cannot convert Type TensorType(float32, 3D) (of Variable Subtensor{:int64:}.0) into Type TensorType(float32, (False, False, True)). You can try to manually convert Subtensor{:int64:}.0 into a TensorType(float32, (False, False, True)).
Any suggestions?
Sorry, I have not seen this fault.
Hello! Thanks a lot for your post! I have a small question? How do I modify the network in order to predict more than one day? For example, getting the next week of the passengers What are the specific parameters I should modify to make the prediction longer?
You can reframe the problem to predict multiple days.
You can also call the model again and again and use predictions as input observations.
This post will give you some ideas:
https://machinelearningmastery.com/multi-step-time-series-forecasting/
Thank you jason good article
But code alittle bit incorrect , if we use the network in time series problems tests array must start end of train array in first example test array starts end of train array+1 in anothers exaples test array stars end of train array+3 …. etc if our inputs is small like 1 and 3 no problem but if our inputs big like 170 ,200 it is big problem…… Think please we predict stocks prices our tests stars 150 days later and will give incorrect results, coz market is changable…………
than
train, test = dataset[0:train_size,:], dataset[train_size:len(dataset),:]
must change like this
train, test = dataset[0:train_size,:], dataset[train_size-look_back-1:len(dataset),:]
and
testPredictPlot[len(trainPredict)+(look_back*2)+1:len(dataset)-1, :] = testPredict
must change like this
testPredictPlot[len(trainPredict)+look_back:len(dataset)-1, :] = testPredict
so sorry i must add so that 🙂 i have a predict problem i tryed last tree mounts with ANN but i did not find answer and my best MSE was e-3 , when i see your article i decided try DeepLearning with keras now i cannot belive my eyes , my MSE has e-12 , Than Jason Tank you very much……
Hi Jason, Can this technique work for dynamical problems as well, where the time-varying response is a function of time-varying inputs? Ultimately the model should be able to provide/predict time-varying response for any arbitrary time-varying inputs. Thanks
Hi!
I’m trying to create a curve predictive model to generate new curves (for example, sinusoidal curves), but the problem is that when I train my model with curves with different periods, the model can only generate curves with the same period (like an average of the periods of the training set) which could be the problem?
thanks
It is hard to know.
Perhaps the problem requires a more sophisticated model or a simpler representation, or perhaps the problem is too difficult.
Hello Jason and thanks for your very nice tutorials.
I have this kind of problem and I wanted to ask you in which category it fits.
Let’s say I have a device which measures temperatures.The temperatures will have a “specific” range (I mean the source of the temprerature will be a steady source).
Now, I will take some thousands of temperatures vaues in the beginning and then, I want to be able to train my network , and when it sees a temperature which is not a good fit in the preious values, to reject them.
What kind of problem is this?Time series? Kernel density?Unsupervised cluster?
Thank you very much!
This sounds like “anomaly detection” or “change detection”, even “outlier detection”.
These terms will help you find good algorithms to try.
Great!Thanks a lot!
You’re welcome George.
Hi Jason,
thank you very much for your great post.
I have a naive confusion regarding the ‘Test Score’ part.
Why we use
‘testScore = math.sqrt(mean_squared_error(testY[0], testPredict[:, 0]))’ instead of
‘testScore = math.sqrt(mean_squared_error(test[:286], testPredict))’ ?
What’s the difference between the two?
And also I am aware that you use ‘testScore = model.evaluate(testX, testY, verbose=0)’ to trigger the ‘testScore’.
Which one is the best to evaluate our model? Could you give me some advice?
Thank you for your work. I appreciate it a lot.
Best regards.
Hi Jason, That is really helpful post. I have a question about random walk data, Can we predict random walk data by using LSTM? I have also read your post about prediction of random walk but still believe LSTM is much better than other methods. Can you give me some advice?
You can, but I doubt you will do better than a persistence model.
In fact, if the data is a true random walk, then you will not do better.
Hi Jason,
Nice talk! Very clear and useful, being my first guide to implement LSTM in time series prediction. I’ve followed many of your articles, thx for your sharing!
Only one different opinion, it seems that you do Min-Max firstly on the whole dataset before training and prediction, which I think may be improper. Because “test set” should be treated like “online” data in real world, i.e. we never know what’s coming next into our model when we do prediction. If you scale test set first, then you are actually putting information of test set into training process, this will improve model performance on test set, but obviously, it’s improper. So I think the correct pipeline should be:
Step 1. Split dataset into train set and test set
Step 2. Train Scaler on train set and convert train set. i.e. trainSet_convert = scaler.fit_transform(train set)
Step 3. Train LSTM on trainSet_convert .
Step 4. Use scaler to transforms test set, i.e. testSet_transformed = scaler.transform(test set)
Step 5. Use LSTM to do prediction and evaluation on testSet_transformed
Here Step 1.~3. are training stage, Step 4.~5. are prediction stage. The main difference compared with your pipeline is that, scaler transforms test set on prediction stage, not training stage.
Yes, ideally you would perform scaling on the training dataset and use the coefficients from training to scale test (e.g. min/max or stdev/mean).
Hi Jason,
Thanks a lot for the useful articles, really good job!
I just have one question: also if I’ve already seen “4 Strategies for Multi-Step Time Series Forecasting” I still can’t get how to predict more future values than my initial dataset.
For example: If my dataset is composed by 100 values, how I can predict the next 10 values and display it in the same way you have done in this example?
Thank you in advance!
You can configure the LSTM to have 10 units in the output layer.
You can treat it as a many-to-one RNN or a many-to-many and use a seq2seq paradigm.
I have tutorials covering this scheduled for the blog.
I went through this example, but I feel like there is something I am not understanding: the predictions are only being provided one day in advance.
E.g., if we look at the generated test data (testPredict from the line
testPredict = model.predict(testX, batch_size=batch_size)
), we see that we are using testX to generate predictions. Well, testX is merely a feature containing all the time series data, excluding the particular day we’re next trying to predict.
Then, once a prediction is made, that prediction is actually *ignored* when doing to subsequent prediction, and instead we use the actual data from testX.
So, is this model really only predicting one day in advance? If so, how is it useful? What am I missing here? I know that LSTM RNN’s are very powerful, but this example is not convincing me.
(FWIW, I reproduced this example by correcting it and truly using the predictions to feed the subsequent predictions, and the predictive capablility falls apart. After a few days, it just “stabilizes” and stops moving altogether.)
I agree with you! I have raised same question in my comment below. Almost all tutorial on using ML for time series forecasting is doing this type of mistake
This is called walk forward validation and assumes new data is available each day, at least in this domain.
yes exactly! It basically diverges into a value after a few days…not really sure what we are doing here
Thank you for this tuto.
There is one thing that I didn’t understand.
I want to interpret the performance of my algo using the RMSE score.
But I was always working with scores in the range of 0 and 1 which is not the case in the first example(LSTM for regression).
So please , I want some details of the score of RMSE and its significance.
Thank you !!!
RMSE may or may not be between 0 to 1, depending upon the scale of target variable. RMSE mathematically is sum of sqaure of residuals, which in a way tells how much of variance model is not able to explain.
Since, we know the variance in original data we can use it to divide the RMSE, which gives Normalized RMSE or NRMSE, for a good model this quantity should always be less than 1, the closer it is to 0 the better it is. If it’s value is more than, it means that our model is introducing more variance than actually present in data, which is not the goal of any modeling exercise.
In statistics, 1- NRMSE is R-square, which is used to assess the goodness of a model. if R-square is closer to 1, model almost explains all the variance observed, if it is closer to 0, model does not explain any variance and in this case ‘mean’ of target variable would be much better predictor the than model itself.
Hope this helps!
This post shows how to implement RMSE from scratch and other performance measures:
https://machinelearningmastery.com/time-series-forecasting-performance-measures-with-python/
When forecasting for test data, I think we should not assume that lagged data is available for all testing period. By assuming it to be available, i think we are over-stating the power of LSTM for time series forecasting.
As per me, right method to test would be –
1. When forecasting for time t + 1, we can take t and t – 1 values from train data. Here, t being final time of train data
2. But when forecasting for t + 2, t + 1 and t has to be used, in reality we don’t know t + 1, as we have data till time ‘t’. So, forecast value of t + 1 should be used instead.
3. Step 2 will have to be repeated for time t + 3, t + 4, …..
4. Once we have forecast using steps 2 and 3 for test period, we should compare it with the actual test data to get the error
If above is followed, we will get much higher error than we are currently getting by assuming the availability of lagged values.
It would be good to know your thought on this
I agree in the case when we remaking a multi-step forecast.
Thank you for yours responses.
I asked this question because I follow the course Algo LSTM with Keras but using another dataset.
And I get as result RMSE= 0.01 but when I plot the result i found that the prediction graph are not really fiiting with our dataset.
Hey, thanks for such a detailed post. I thought you might like to check out a guest post we recently had on using LTSM RNNs in Keras Tendorflow for trend prediction using just 3 steps – let us know what you think…
https://www.freelancermap.com/freelancer-tips/11865-trend-prediction-with-lstm-rnns-using-keras-tensorflow-in-3-steps
Thanks for the link.
Great tutorial! Thank you for your effort and time Sir.
I think this is the one of few tutorials that actually talk about how to manage data matrix.
Thanks JD.
Thanks a lot for the great tutorial Jason. This is super helpful.
However, I have one question. For the stateful LSTM when we are running the epochs manually, I understand why you are doing the
model.reset_states()after each epoch.But when we are finally doing the prediction, we run a predict on the train data and then do a reset_states() before doing a predict on the test data.
I think we do not need this as the test data is right after the train data temporally. So, I think we can use the previous state of the internal memory of the LSTM layer. What do you think?
Thanks,
Srinivas
We may.
See this post on seeding state in LSTMs:
https://machinelearningmastery.com/seed-state-lstms-time-series-forecasting-python/
I updated to the latest version of keras and tensorflow and get extremly bad results. Any suggestions for that Jason? Did you use the latest version of tensorflow?
Consider increasing the number of training epochs.
Consider running the example multiple times and take the average of results.
Hi, The way this post wrote very well summarise.Thanks. I’m a beginner to ML student in campus in SL. I would like to understand the code snippet what each line does, where can I get the clear idea on that ?
This might be a good place to start:
https://machinelearningmastery.com/5-step-life-cycle-neural-network-models-keras/
Thanks for the detailed blog. this helped me apply this to predicting gender using name with minor modification to accomodate many-to-one architecture. the link can be found here
https://medium.com/@prdeepak.babu/deep-learning-gender-from-name-lstm-recurrent-neural-networks-448d64553044
Thanks again! keep writing !!
Well done!
Thanks for sharing the link.
What about the so called mimicking effect described in several comments here Jason?
I’m new to this topic and slightly concerned.
Could you provide an elaborated statement in regard to this ‘critic’ (t+1 etc.)?
I refer you to this updated tutorial and compare skill to a persistence model:
https://machinelearningmastery.com/time-series-forecasting-long-short-term-memory-network-python/
Thank you Jason.
I have compared the performance, running the code on
https://machinelearningmastery.com/time-series-forecasting-long-short-term-memory-network-python/
..with the performance of the recommended baseline model, consisting a persistence forecast.
A) Feeded with the shampoo example data
The results are:
baseline score: 133.16 RMSE
LSTM simple example score: 142.44 RMSE > 133.16 RMSE
LSTM complete example score: 107.214 RMSE < 133.16 RMSE
B) Feeded with airline data the results are:
baseline score: 47.81 RMSE
LSTM simple example score: 44.87 RMSE 47.81 RMSE
What does this mean in regard to the so called mimicking effect?
And the criticism that there is actually no prediction involved.
I’ve got different results and multiple options to interpret them.
I’m a little bit confused now.
Sorry, the parser of the forum has stripped out some of my code.
B) Fed with airline data the results are:
baseline score: 47.81 RMSE
LSTM simple example score: 44.87 RMSE, is less then baseline 47.81 RMSE
LSTM complete example score: 61.369 RMSE, is greater then baseline 47.81 RMSE
What does this mean in regard to the so called mimicking effect?
And the criticism that there is actually no prediction involved.
I’ve got different results and multiple options to interpret them.
I’m a little bit confused now.
It may suggest the LSTM is more skillful than persistence.
Neural networks will give different results each time they are run. I recommend re-running an experiment many times (30) and taking the average performance.
More on the stochastic nature of neural nets here:
https://machinelearningmastery.com/randomness-in-machine-learning/
I also recommend tuning the LSTM to the problem, this post may help:
https://machinelearningmastery.com/improve-deep-learning-performance/
Trying to adapt some versions from the user comments I get the error message:
“TypeError: (‘Keyword argument not understood:’, ‘input_dim’)”
If I try instead “input_shape” it says “int object is not iterateable”
Does somebody has a solution for this?
Update:
There seems to be an undocumented change in the Keras-API.
Got very few infos out of the web.
Hello,
This a good tutorial.
The only thing which is not clear is how to predict a value that we don’t know it.In this exemple we can predict only the value in our data set and we are not able to predict futur values !!!!!!!!!!!!
Please I want some clarifications
You can predict a future value by feeding in the last observations as input (X) to the function:
yhat = model.predict(X)
I created a ‘Jason-checked’ example here…
https://machinelearningmastery.com/time-series-prediction-with-deep-learning-in-python-with-keras/#comment-397444
Hello Jason,
Thanks for sharing this great tutorial! Can you please also suggest the way to get the forecast For example, if we want to forecast the value of the series for the next few years (ahead of current time–As we usually do for the any time series data), i have a data from 2000 to 2016 ,and i want to have the forecast for the 4 next years . Thanks
See this post:
https://machinelearningmastery.com/multi-step-time-series-forecasting/
Hi Jason!, first your work is awesome 🙂 and I want to thank you for sharing your knowledge, I have a question, how the model can predict future valued that are not in the data set?. All the examples I have seen in the internet just mimic the last part of the data set but not predict anything. I want to predict future movements but unless I know it can be done I have not find any way to do it.
Hope you can help me to do this.
Thanks so much!.
Fit the model on all available data and then call model.predict(X) where X are the last few observations.
Hi Jason,
Could you please give a coding example of the suggestion you made to Daniel Luque.
Thank you so much for your contributions, this is definitely the best examples I have seen on this subject.
For more on finalizing models, see this post:
https://machinelearningmastery.com/train-final-machine-learning-model/
hi jason,i follow your tutorial,program can run ,but when i change little ,the result is not my expect.
i add the “metrics=[‘accuracy’]”:
model.compile(loss=’mean_squared_error’, optimizer=’adam’,metrics=[‘accuracy’])
when running,loss is down,but acc not change.why?thank you !
This is the challenge of applied machine learning.
Hello again ,
When I set look_back=50 and I want to predict the 51 value , I found that I must provid 52 value and no 50 values to predict the futur.
It is supposed to work like that ???
I think that my question is important. I am confusing with this algorithme.
When we set look_back = 50 and I provide a dataset with 50 measure to predict the 51 measure, I get an error.
I only can make prediction of the 53th value using 52th measure in dataset and look_back = 50
This is normal ????
If we add the metrics accuracy
model.compile(loss=’mean_squared_error’, optimizer=’adam’ ,metrics=[‘accuracy’])
we will ntice that the accuracy is not good
Hello Jason, I have been reading a lot on your blog, very helpful indeed. So first my thanks, I’m fairly new to python and machine/deep learning, but with your examples I got a good starting point.
I have taken one of your lstm examples and adapted it , also changing to GRU and got decent results, however I would like to improve them.
Unfortunately I couldn’t find anything on the internet which would fit what I need.
So my hope is that you could point me in the right direction or help…I am trying to model a time series , now my problem is that it behaves differently on different days of the week and also on bank holidays.
I would like to “add”information to any time series step such as Day of week , week , distance to next bank holiday and which bank holiday is the next one. I have found tf. sequence example but not sure if that is what I am looking for.
Thanks in advance and Best Regards
Ed
I would recommend providing this additional context (day or type of day) as a separate input variable.
HI Jason, thanks for the reply.I have done exactly that now, still fiddling abit to see the effects, but I hope that ultimately with the rihgt “tuning” that this will improve the results.
Best Regards
Ed
Hang in there Ed!
Hi Jason,
When it comes to displaying the predictions in the plot, my testpredict has fewer values than test. How to fix this bug? what modifications you need to make in the code for text predict to predict the values for 1/31/1961, if the dataset ends at 12/31/1960?
You could trim off the test data for which you did not make predictions.
Hi Jason, excellent example.
I think there is a terrible mistake when you divide the dataset between training and test. I rather split that samples randomly (but sequentially). Just give it a try and check the mse:
60% – train set, 20% – validation set, 20% – test set:
train, validate, test = np.split(df.sample(frac=1), [int(.6*len(df)), int(.8*len(df))])
or
70% – train set, 30% – test set:
train, test = train_test_split(df, test_size=0, random_state=42)
Just be sure they get sorted:
train.sort_index(inplace=True)
test.sort_index(inplace=True)
#optional
validate.sort_index(inplace=True)
Great tip! Thanks for sharing Antonio.
I think that it’s better if you try with more data. I don’t beleive 141 samples are good enoght to train a model… I just tried with another dataset with +3K samples and it worked really good (small RMSE) without overfitting the NN. Anyhow, these are really good posts, it helped to to get started with keras and LSTM from zero to hero in in few mintues. Just wonder if you have another post describing in details how to build the keras model…
Thanks Antonio, I’m really glad to hear that.
Yes, you can see more about testing strategies for time series / sequence prediction here:
https://machinelearningmastery.com/backtest-machine-learning-models-time-series-forecasting/
Thank you for you contribution. However, I’m sorry to say it, but this post doesn’t seem to show a successful LSTM model. A RMSE of 56.35 is worse than if you simply pick the input value as your prediction, which gives you a RMSE of 48.66. You can check it by running:
testX_ = scaler.inverse_transform(testX.reshape(1,-1))
print(“Untrained:”, numpy.sqrt(mean_squared_error(testX_.flatten(), testY.flatten())))
print(“Trained:”, numpy.sqrt(mean_squared_error(testPredict.flatten(), testY.flatten())))
This is hinted at in the graphs as well, where you can see your predictions goes in one-lag lockstep with the inputs, they should overlap exactly. Remember, a good time series prediction has the ability to predict change.
I agree, see this post for a better approach:
https://machinelearningmastery.com/time-series-forecasting-long-short-term-memory-network-python/
Hi, thanks for you Blog, that help me a lot in my project and understanding LSTM, by the way, I notice that in creat_dataset function, there is no need to minus one in i’s range. Or you will loose one element.
Thanks.
Jason:
Thank you so much for the great tutorial. Your blog has really taken my skills to the next level as working with Theano was very challenging in the past.
Quick question:
How can I modify you code to take in sequences of 2 real valued numbers (x, y coordinates) and with a look_back window of 3 to predict the time at t+1. The output should be x, y coordinates.
Here is the code I am using, though I am getting an error:
Error when checking model input: expected simple_rnn_1_input to have shape (None, None, 3) but got array with shape (1470, 3, 2)
Here is the main areas I have changed:
-pandas.read_csv reads in 2 columns of data
-Create dataset creates sets that are num_samples x time_steps x features.
-I am using the regression with time steps sample.
-Change Dense(1) to Dense(2) since expecting 2 outputs.
Jason:
Thank you so much for the great tutorial. Your blog has really taken my skills to the next level as working with Theano was very challenging in the past.
Quick question:
How can I modify you code to take in sequences of 2 real valued numbers (x, y coordinates) and with a look_back window of 3 to predict the time at t+1. The output should be length 2 for the regression of x, y coordinates of the prediction.
Here is the code I am using, though I am getting an error:
Error when checking model input: expected simple_rnn_1_input to have shape (None, None, 3) but got array with shape (1470, 3, 2)
Here is the main areas I have changed:
-pandas.read_csv reads in 2 columns of data
-Create dataset creates sets that are num_samples x time_steps x features.
-I am using the regression with time steps sample.
# SimpleRNN that learns on a x, y
import numpy
import matplotlib.pyplot as plt
import pandas
import math
from keras.models import Sequential
from keras.layers import Dense
from keras.layers import LSTM, SimpleRNN
from sklearn.preprocessing import MinMaxScaler
from sklearn.metrics import mean_squared_error
# convert an array of values into a dataset matrix
def create_dataset(dataset, look_back=1):
dataX, dataY = [], []
for i in range(len(dataset)-look_back-1):
a = dataset[i:(i+look_back), 0]
dataX.append(a)
dataY.append(dataset[i + look_back, 0])
return numpy.array(dataX), numpy.array(dataY)
def create_dataset2(dataset, look_back=1):
dataX, dataY = [], []
for i in range(len(dataset)-look_back-1): # go from 0 to dataset length – lookback +1
features=[]
set_of_features=[]
a = dataset[i:(i+look_back), 0] # slice dataset from i to i+ lookback, column 0 (which is x)
b = dataset[i:(i+look_back), 1] # slice dataset from i to i+ lookback, column 1 (which is y)
for X1, X2 in zip(a, b): # create tuples, the list will be tuples of length lookback
features=[X1,X2]
set_of_features.append(features)
dataX.append(set_of_features)
# now do the target (should be a tuple right after the lookback)
dataY.append([dataset[i + look_back, 0], dataset[i + look_back, 1]])
return numpy.array(dataX), numpy.array(dataY)
# fix random seed for reproducibility
numpy.random.seed(7)
# load the dataset
dataframe = pandas.read_csv(‘spiral.csv’, usecols=[1,2], engine=’python’, skiprows=0, delimiter=’\t’) # tab delimited here, use the 2 columns
dataset = dataframe.values
dataset = dataset.astype(‘float32′)
# normalize the dataset
scaler = MinMaxScaler(feature_range=(0, 1))
dataset = scaler.fit_transform(dataset)
# split into train and test sets
train_size = int(len(dataset) * 0.67)
test_size = len(dataset) – train_size
train, test = dataset[0:train_size,:], dataset[train_size:len(dataset),:]
# reshape into X=t and Y=t+1
look_back = 3
trainX, trainY = create_dataset2(train, look_back)
testX, testY = create_dataset2(test, look_back)
# reshape input to be [samples, time steps, features]
#trainX = numpy.reshape(trainX, (trainX.shape[0], 1, trainX.shape[1]))
#testX = numpy.reshape(testX, (testX.shape[0], 1, testX.shape[1]))
trainX = numpy.reshape(trainX, (trainX.shape[0], trainX.shape[1], trainX.shape[2]))
testX = numpy.reshape(testX, (testX.shape[0], testX.shape[1], testX.shape[2]))
# create and fit the RNN network
model = Sequential()
model.add(SimpleRNN(4, input_dim=look_back))
model.add(Dense(2)) # was 1
model.compile(loss=’mean_squared_error’, optimizer=’adam’)
model.fit(trainX, trainY, nb_epoch=100, batch_size=1, verbose=2)
# make predictions
trainPredict = model.predict(trainX)
testPredict = model.predict(testX)
# invert predictions
trainPredict = scaler.inverse_transform(trainPredict)
trainY = scaler.inverse_transform([trainY])
testPredict = scaler.inverse_transform(testPredict)
testY = scaler.inverse_transform([testY])
# calculate root mean squared error
trainScore = math.sqrt(mean_squared_error(trainY[0], trainPredict[:,0]))
print(‘Train Score: %.2f RMSE’ % (trainScore))
testScore = math.sqrt(mean_squared_error(testY[0], testPredict[:,0]))
print(‘Test Score: %.2f RMSE’ % (testScore))
# shift train predictions for plotting
trainPredictPlot = numpy.empty_like(dataset)
trainPredictPlot[:, :] = numpy.nan
trainPredictPlot[look_back:len(trainPredict)+look_back, :] = trainPredict
# shift test predictions for plotting
testPredictPlot = numpy.empty_like(dataset)
testPredictPlot[:, :] = numpy.nan
testPredictPlot[len(trainPredict)+(look_back*2)+1:len(dataset)-1, :] = testPredict
# plot baseline and predictions
plt.plot(scaler.inverse_transform(dataset))
plt.plot(trainPredictPlot)
plt.plot(testPredictPlot)
plt.show()
I have a post on multivariate forecasting with LSTMs scheduled on the blog for a few weeks time.
i want to make prediction using back propagation algo
can u help me in telling that what would be our target class and how we can convert it in 0 and i
Perhaps this tutorial will help:
https://machinelearningmastery.com/implement-backpropagation-algorithm-scratch-python/
Hi Jason:
Can you tell me how to modify the code to take in sequences of x,y coordinates (real values) and output the x, y coordinate at t+1?
Thank you for your time.
Frame the problem:
https://machinelearningmastery.com/convert-time-series-supervised-learning-problem-python/
Then ensure you define your LSTM with 2 inputs on the input layer and 2 outputs on the output layer.
Hi. Great tutorial. Need help in adapting this to my specific problem. I have 2d data set of the dimension 100*30. where 100 is number of different company stocks and 30 is the stock price of each company for 30 consecutive days. Please help in understaning the input dimension of the LSTM in keras for predicting the stock price of 100 different companies in next 10 days.
Thanks
The expected input structure is [samples, timesteps, features].
Each series is a different feature. Time steps are the ticks or movements. You may need to split each series into sub-sequences, e.g. 200-400 timesteps long. In that case, each sub-sequence will be a sample.
I hope that helps.
Hello Jason,
I discovered that in https://machinelearningmastery.com/time-series-forecasting-long-short-term-memory-network-python/ there is no implementation of differencing, yet the example has seasonal and trend variations. Is it ok to just model your LSTM and predict as you have done in this example without differencing, what is the implications?
Thank you very much
No, it is best to difference the data and in this case also use a log transform.
Hi Jason,
That is really amazing work, but is all the cases you showed, the data is always numeric. I have regression problem (label is a float) but I have multi type data (strings and numerics). How can I use string properly instead of mapping them a random integer ?
Thank you
Strings will have to be mapped to integers (chars or words), sorry.
Hi, Jason.
I see that LSTM is a powerful model which can get better results than classic time series models like ARIMA in some circumstances, but… is it possible to have something similar to confidence intervals for the predictions? is only possible to obtain point forecasts?
Good question, I’m not sure off hand.
Perhaps you could use the bootstrap method with multiple repeats of fitting the model and making predictions?
Hi Dr.Brownlee,
Thanks for the tutorial!
I am struggling to understand the shifting done on the predicted data, namely why do we shift by that particular amount?
Thank you!
Your plot looks like your prediction for both test and train data is lacking 1 datapoint behind – which is exactly what is known to the network. A “predictor” that would just return the input, so lets assume this function:
def predict(x):
return x
would also “follow” the curve, but is not very intelligent. A better prediction would be to use the prediction of t=t0 as an input to the prediction at t=t0+1, then use this output as input for t=t0+2 and so on. Just like what you did here:
https://machinelearningmastery.com/text-generation-lstm-recurrent-neural-networks-python-keras/
I hope you could grasp what I mean. Thanks for your thoughts.
Awesome post!!!!
I’m trying to apply this for a dengue prediction system. The problem is to determine number of dengue patients in a given week (time series prediction), given the attributes (humidity, temperature for that week).
I set trainX to input features and trainY to number of dengue patients.
So the trainX has the format (attribute1, attribute2, .. attributen) whereas trainY is a vector containing number of patients.
The model predicts some output, but the mean square error is very high.
Is there any way to improve?
and in dengue prediction, we should relay on time steps since number of dengue patients in a given week depends on number dengue patients in the previous week. But the problem is unlike the problem in this post, I don’t have the actual number of patients for a given week for the test data set. In this case, how can I use “LSTM for Regression with Time Steps” for my problem?
Thanks in advance
This post may give you some ideas:
https://machinelearningmastery.com/improve-deep-learning-performance/
Hi Jason,
You are amazing.
I am very new to machine learning and Keras. I have one task to be completed. In it, my input is vector of size 19 (features) and I have 2000 samples (rows of data) and I would want to predict single output value. I am little bit confused in how to create and fit LSTM network that is suitable for this scenario.
What would be the parameters to the LSTM layer while adding it to the model like, units, input_shape?
Basically its a time series regression analysis using LSTMs.
Can you please provide me with some help.
Many thanks
The input shape is [samples, timesteps, features], your number of features is 19.
Hi Jason
Thanks for your beautiful article.I tried this with some other data set(it has some negative values too), the result was excellent but the only problem was in predicting negative part!I mean in some place at future the line is going below x-axis(negative part) in actual graphs but when the algorithm tries to predict that it goes until x=0 and then return to the positive area of the y-axis.Could you help me why this happens?
Many thanks
And also I saw this question (a lot of time) above in the article but I could not find any answer for that.What should we do if we want to predict more step in the future like future 2-month prediction?If there is any other tutorial about this, please let me know.
Call model.predict()
You can better understand how to make predictions with LSTMs here:
https://machinelearningmastery.com/5-step-life-cycle-long-short-term-memory-models-keras/
Consider scaling your data first to the range 0-1.
HI Jason and All,
Sorry if my question is too basic, how can I separate the training from the test please? I need to run them separately but failed to understand what output comes out of the training and what I need to feed in to the predict function in another file? Any Clues? I mean if it’s possible in the first place of course.
Many thanks,
Goran
See this post for a tutorial:
https://machinelearningmastery.com/backtest-machine-learning-models-time-series-forecasting/
Hi Jason
Thanks for your interesting tutorial.
I have a question ,I’m thinking about some interesting project but I’m not sure if it is possible by using LSTM model in Keras or not,could you help me please.
I have some noisy signal and then by using some filtering method I make it smooth to get information from pure noise,right now the method which I’m using is so time consuming.
So I want to try it like your method here,the only thing is that I should give noisy signal as an input to my NN and then it should train himself by whatever I had in smooth information(which I got from filtering method)then it should predict future smoothing part base of raw signal.Do you have any idea about?
Thank you so much
Try it and see. Neural networks are generally good at handling noisy inputs.
Thanks for the great post. Can you help understand a few doubts?
1 – Why choose the mean-max scaler from 0 to 1? Why not use the standardization instead? Does this have to do with sigmoid? What would be the optimal choice for Relu or Tanh?
2 – By scaling the entire dataset, are not we incurring in lookahead bias? Should not the fit be done on train dataset and use this fit to transform the test dataset?
3 – In the statefull example you mention “need to be trained for more epochs to internalize the structure of the problem.”. Does not this usually lead to overfitting instead?
4 – Is it possible to query the state of the lstm in keras/tensorflow?
Once again thanks for making ltsm and keras easier to understand and experiment.
Hi Hugo,
I find the 0-1 scaling works well. Try standardizing and let me know how you go. Test everything!
Correct. I scaled all at once for simplicity of the example. Develop transforms on train data and apply to all test/validation/new data.
Yes, it can.
Not sure, I expect you can. See here:
https://github.com/fchollet/keras/issues/2593
Thanks for the tutorial, but to get the real RMSE, shouldn’t you shift the predicted values 1 step back to compare with the actual values?
Putting in the code, will be:
trainScore = math.sqrt(mean_squared_error(trainY[0][:-1], trainPredict[1:,0]))
testScore = math.sqrt(mean_squared_error(testY[0][:-1], testPredict[1:,0]))
I’m getting values below 10 RMSE with this fix
It was great help for me!! But I have some problems. After using MinMaxScaler, I got some
trouble in scaling part. How to deal with this problem?
>>> dataset = scaler.fit_transform(dataset)
Traceback (most recent call last):
File “”, line 1, in
File “C:\Users\01029\Anaconda3\envs\tensorflow\lib\site-packages\sklearn\base.py”, line 494, in fit_transform
return self.fit(X, **fit_params).transform(X)
File “C:\Users\01029\Anaconda3\envs\tensorflow\lib\site-packages\sklearn\preprocessing\data.py”, line 292, in fit
return self.partial_fit(X, y)
File “C:\Users\01029\Anaconda3\envs\tensorflow\lib\site-packages\sklearn\preprocessing\data.py”, line 318, in partial_fit
estimator=self, dtype=FLOAT_DTYPES)
File “C:\Users\01029\Anaconda3\envs\tensorflow\lib\site-packages\sklearn\utils\validation.py”, line 416, in check_array
context))
ValueError: Found array with 0 sample(s) (shape=(0, 0)) while a minimum of 1 is required by MinMaxScaler.
Confirm your data was loaded correctly.
Hello, thank you very much for your rich tutorial. In fact, I am a student of Master 2 in Intelligent System and Multimedia in Vietnam at the Institut Francophone International. I have a concern! I am working on a project to find a causal relationship between climatic factors (I have 7 input climatic factors) and the epidemic of dengue (which will be out) in Southeast Asia for a period Of 1994 – 2010 using Deep Learning! But, I’m not sure what Deep Learning approach to use! I have documented a little, many books say that “the causal relationship Deep learning uses unsupervised learning”. I would like you to help me by pointing out which Deep learning approach used especially as these are very complex approaches! Thank you…
Sorry, I am not aware of work using deep learning for causal models.
Supervised learning solves the problem of induction (e.g. think correlation, not causation).
Excuse me for the derangement again, so, if I understand correctly, the causality of time series is not feasible in supervised learning as unsupervised for deep learning?
For example, I used the granger causality method for the same subject and I would like to use deep learning to solve problems!
It is not possible!?
Are we leaking data here when we’re normalizing the entire dataset with MinMaxScaler? Thanks
Yes, it is a limitation of the tutorial – a tradeoff for brevity.
Hello Jason, thank you for this great tutorial. I am using the above LSTM code to try to predict the next day’s change in a stock value (I made it a classification problem where I assign different classes to specific ranges of values). I am using multiple features and some of them have large values.
I tried running the algorithm normally and got terrible results. However, when I stopped normalizing my dataset, my accuracy improved a lot.
What do you think might be the reason behind that? Is it the normalization technique that might not be right? I would like to hear your input!
Again, thank you so much!
Well done.
I have no idea, it depends on the data and on the network config.
Hi Michael, can you please send me the code on how you’re doing the next day’s prediction?
Thanks!
Hi, very nice lesson!
My questions is: when the LSTM does the next prediction, does it look at the actual test values? or it looks at the previous predicted value? Because I guess the error is higher when the prediction is made on previous predicted values (because they will be a little different than the actual test values each time)
The model approximates a function with inputs (lag obs) and an output (prediction). You can define what the model takes as input (input_shape and data preparatation).
In lstm using windows methode netwrok how the weighs are adjusted in the hidden layers because in the other architectures we have:
w_(ht) = the weights between the hidden layers of each time step and the input how we can do it for one to many architecture here we have one time step im confused
this method can be considered as one to many architecture
thank you
Hi , thank you for this tuto.
My question is a bit theoric.
How the activationq of hidden neurones are calculated. in lstm with windows
In lstm with time steps.
H(t) = x-t × whx + whh × h(t-1), in this case what is our h(t-1)
It can be a one to many architecture ?
Is there any explanation for the gap that is in diagrams in predictions parts?
I mean in green and red lines there is a gap in start and end…
Hi Jason – Thanks for the post.
My question is at a more macro level. I am trying to create a ensemble system of forecasting which will use both traditional ARIMA/ARIMAX and the NeuralNet models. But from what I have read in the literature is that the NNs only perform marginally better than traditional ARIMA, while in some cases ARIMA is better. Now given that NNs need a lot of set up and training time, is there really a benefit in using NNs for Forecasting problems ? Can you guide me to resources/URLs where they have shown the advantages of NNs over ARIMA?
Thanks,
Nirav.
See this post (and the refs/links it contains):
https://machinelearningmastery.com/promise-recurrent-neural-networks-time-series-forecasting/
Hi, I have a question about time-series.
If I have time series data like in every 1 minute, can my data be implemented like above code to predict values?
Also, I have one more question that is time series prediction with LSTM and RNN playing only
with just one column of input data??
Thank you for helping and posting blogs for us.
Best,
Paul
Yes, LSTMs could be used.
Yes, LSTMs can be used with multiple input or output features.
I caution you to develop a baseline with a linear model and an MLP to see if in fact the LSTM will add value on your problem.
Thanks for replying me back Jason! 🙂 It helps me a lot! 🙂
Do you know why my error appears like that?
Thank you so much for helping! 🙂
Best,
Paul
Also when I applied your example to mine,
trainX = np.reshape(trainX, (trainX.shape[0], 1, trainX.shape[1]))
testX = np.reshape(testX, (testX.shape[0], 1, testX.shape[1]))
it gives me an error as follows,
ValueError: Error when checking : expected lstm_6_input to have 3 dimensions, but got array with shape (1, 1)
what is the problem..?
Best,
Paul
Confirm the same of your training data is 3d [samples, timesteps, features].
Confirm the input layer (input_shape) of your model specifies the same number of time steps and features.
Thank you Jason! 🙂 It helps me a lot.
I have one more question. (Sorry for bothering..)
If I want to add more hidden layer from
model.add(LSTM(4, input_shape=(1, look_back)))
model.add(Dense(1))
model.compile(loss=’mean_squared_error’, optimizer=’adam’)
Then should I just add model.add(Dense(150), activation = ‘sigmoid’) between LSTM block line and Dense(1) line if want to add hidden layer?
What if I want to add one more LSTM block before output? Can I do that?
I would recommend adding more LSTMs not more Dense.
LSTMs need a 3D input, which means that the prior LSTM layer will need to return a sequence (3D) rather than a final state vector (2D) as output. You can do this by setting return_states=True in the previous layer.
I hope that helps.
Thank you for replying me back! 🙂 Ah ha I see.
Thanks so much for helping me out! 🙂
Best,
Paul
You’re welcome Paul.
Hey, Thanks for the wonderful tutorial.
wondering how to forecast for the future dates after creating the model.
Say for example: now we have air passengers till some dates and i want to forecast for next 10 years.
How do i do it?
Explanation is much appreciated
See this post on training a final model:
https://machinelearningmastery.com/train-final-machine-learning-model/
Hi Jason, Thanks for your reply.
Wondering how that link is helpful for our case.
To make it more clear: In the above example there is no forecasting for future dates(unavailable data). but i would like to forecast for next 10 years or so.
how would i do that once i build our LSTM model?
I understand we use predict function and predicted on the test data,but again our input was same dataset(x_test). we cannot get this data for future dates right?
response me much appreciated.
Thanks in advance:-)
For different strategies for multi-step forecasting, see this post:
https://machinelearningmastery.com/multi-step-time-series-forecasting/
For an example of multi-step forecasts in the future, see this post:
https://machinelearningmastery.com/multi-step-time-series-forecasting-long-short-term-memory-networks-python/
Does that help?
Really helps! Thanks alot
Great tutorial!
Are there examples of LSTMs applied to panel data? So for example each person has their own sequence, and we want to make a prediction about the next value in each person’s sequence without losing information learned from other people’s sequences?
Thanks!
There may be Grant, I have not come across them.
Perhaps search on google scholar?
Like other ML methods, I expect the benefit comes from generalizing across cases.
Hey Jason,
Wonderful post. I was wondering which activation function is used from the hidden layer to the output layer. Is this just a linear activation function? I read in the keras documentation that the linear activation function is used when you don’t spedify it explicitly. Is this correct? Thanks!
LSTMs use tanh by default. Dense use linear by default. We are using linear in the output layer here – good for regression problems.
Hello, what would be the problem if we discarded the dense layer and used the linear activation of the LSTM (activation=None)? I think that in this way we would have less weights to train totally. Thank you.
The output would be a vector and would have to be reduced to a single value.
Hello, great post. If I recall from the comments, you may have a multivariate example of the above soon/already?
Hi Jason,
Thanks for this article.
Will LTSM predictions always lag the actual test data by 1? I see this in your plot and the same happens with my dataset.
Regards,
Daniel
No, I recommend reading this post instead:
https://machinelearningmastery.com/time-series-forecasting-long-short-term-memory-network-python/
Hi Jason,
I’d like to ditto all the comments above in that these are very well explained tutorials. Thanks for them. In your examples you’re making a prediction for the next time step only, have you found that modelling such that you predict the next, say 10 or 20 time steps is inherently less accurate? IS it trivial to make this change?
Thanks again
Ari
Here is an example of multi-step forecast with LSTMs:
https://machinelearningmastery.com/multi-step-time-series-forecasting-long-short-term-memory-networks-python/
Isn’t there a mistake in the way you compare and plot the predicted data?
It seems shifted to the right by 1 (in the plots).
Here is what i did:
…
# align the predicted Ys and original Ys
trainY = numpy.delete(trainY, trainY.shape[1]-1, axis=1);
trainPredict = numpy.delete(trainPredict, 0, axis=0);
testY = numpy.delete(testY, testY.shape[1]-1, axis=1);
testPredict = numpy.delete(testPredict, 0, axis=0);
# calculate root mean squared error
trainScore = math.sqrt(mean_squared_error(trainY[0], trainPredict[:, 0]))
…
…
# adjust the plot for the new shape of testPredict
testPredictPlot[len(trainPredict)+(look_back*2)+2:len(dataset)-2, :] = testPredict
…
My results with look_back = 1 and LSTM(4) are:
Train Score: 6.08 RMSE
Test Score: 15.53 RMSE
Am i missing something here? Or were the data offset for real?
I would recommend following this tutorial instead:
https://machinelearningmastery.com/time-series-forecasting-long-short-term-memory-network-python/
Hello Jason
Thank you for this great tutorial
I am using anaconda 3 (64 bit) with python 3.6.1
The dataset length is (5 * 65000)
I reduce epoch to 10 (for time saving while trying)
can you help with this error which I got while implementing the above code?
Traceback (most recent call last):
File “C:/Users/Sayed Gouda/PycharmProjects/training/ds.py”, line 64, in
trainPredict = scaler.inverse_transform(trainPredict)
File “C:\Users\Sayed Gouda\Anaconda3\lib\site-packages\sklearn\preprocessing\data.py”, line 376, in inverse_transform
X -= self.min_
ValueError: non-broadcastable output operand with shape (43547,1) doesn’t match the broadcast shape (43547,5)
It looks like your data has 5 features, is that right? If so, your network will need to be configured to expect 5 inputs (input_shape argument).
Dear Jason,
What is the difference between these two parameters then: look_back and input_features? If we consider the last N points as features in the window version to forecast the next point, should we set both parameters to the number of features?
Regards
Features are parallel series for an LSTM model.
look_back is about re-framing the data so that we can use lag obs as features or time steps in any model.
hi Jason
i did what you just say but i got another error
ValueError: Error when checking input: expected lstm_1_input to have shape (None, 5, 1) but got array with shape (43547, 1, 1)
It looks like the input shape for your network does not match your data. Change the shape of the network or the data.
could RNN use to learn categorical data in dataset lets say for the api logs which has the features timestamp(with15min gap),req_method(GET/POST/PUT or any)/response_time/NoOfRequests and train RNN timeseries and build to predict the number of requests (feature number 4) by giving remaining variables as test data ?
Sure.
Thanks, so I converted those categorical features using the one-hot encoding (0 or 1 matrixes) method.Now the data set (first 2 rows) is [1]; having 8099 data points actually.
since in code [2]
it could able to use only one column (column number 14), so how can I change this to use multiple variables (numerical and categorical)?
[1] https://paste.ofcode.org/R6WPQ2ymznnJKFNhysj9Ad
[2] https://paste.ofcode.org/38Z89HXqJsyeTXUhLMRMCLT
Thanks…
May I have any reply on this please? I’m struggling with the fourth year degree research project , any simple information would so much helpful.
Sorry, I do not have the capacity to review your code.
Thanks lot of
I found the following problem:
pandas.errors.ParserError: ‘,’ expected after ‘”‘. Error could possibly be due to parsing errors in the skipped footer rows (the skipfooter keyword is only applied after Python’s csv library has parsed all rows).
I used :
python 3.6 with anaconda 64 bit
Consider opening the text file in a text editor and deleting the footer lines from the file.
Hi, Jason. when I run the first script, I got such error. Can you help me fix this?
Using TensorFlow backend.
Traceback (most recent call last):
File “predic_ltsm.py”, line 40, in
model.add(LSTM(4, input_shape=(1, look_back)))
File “/home/leopard/workspace/dl/keras/venv2.7/local/lib/python2.7/site-packages/keras/models.py”, line 436, in add
layer(x)
File “/home/leopard/workspace/dl/keras/venv2.7/local/lib/python2.7/site-packages/keras/layers/recurrent.py”, line 262, in __call__
return super(Recurrent, self).__call__(inputs, **kwargs)
File “/home/leopard/workspace/dl/keras/venv2.7/local/lib/python2.7/site-packages/keras/engine/topology.py”, line 569, in __call__
self.build(input_shapes[0])
File “/home/leopard/workspace/dl/keras/venv2.7/local/lib/python2.7/site-packages/keras/layers/recurrent.py”, line 1043, in build
constraint=self.bias_constraint)
File “/home/leopard/workspace/dl/keras/venv2.7/local/lib/python2.7/site-packages/keras/legacy/interfaces.py”, line 87, in wrapper
return func(*args, **kwargs)
File “/home/leopard/workspace/dl/keras/venv2.7/local/lib/python2.7/site-packages/keras/engine/topology.py”, line 391, in add_weight
weight = K.variable(initializer(shape), dtype=dtype, name=name)
File “/home/leopard/workspace/dl/keras/venv2.7/local/lib/python2.7/site-packages/keras/layers/recurrent.py”, line 1035, in bias_initializer
self.bias_initializer((self.units * 2,), *args, **kwargs),
File “/home/leopard/workspace/dl/keras/venv2.7/local/lib/python2.7/site-packages/keras/backend/tensorflow_backend.py”, line 1723, in concatenate
return tf.concat([to_dense(x) for x in tensors], axis)
File “/home/leopard/workspace/dl/keras/venv2.7/local/lib/python2.7/site-packages/tensorflow/python/ops/array_ops.py”, line 1000, in concat
dtype=dtypes.int32).get_shape(
File “/home/leopard/workspace/dl/keras/venv2.7/local/lib/python2.7/site-packages/tensorflow/python/framework/ops.py”, line 669, in convert_to_tensor
ret = conversion_func(value, dtype=dtype, name=name, as_ref=as_ref)
File “/home/leopard/workspace/dl/keras/venv2.7/local/lib/python2.7/site-packages/tensorflow/python/framework/constant_op.py”, line 176, in _constant_tensor_conversion_function
return constant(v, dtype=dtype, name=name)
File “/home/leopard/workspace/dl/keras/venv2.7/local/lib/python2.7/site-packages/tensorflow/python/framework/constant_op.py”, line 165, in constant
tensor_util.make_tensor_proto(value, dtype=dtype, shape=shape, verify_shape=verify_shape))
File “/home/leopard/workspace/dl/keras/venv2.7/local/lib/python2.7/site-packages/tensorflow/python/framework/tensor_util.py”, line 367, in make_tensor_proto
_AssertCompatible(values, dtype)
File “/home/leopard/workspace/dl/keras/venv2.7/local/lib/python2.7/site-packages/tensorflow/python/framework/tensor_util.py”, line 302, in _AssertCompatible
(dtype.name, repr(mismatch), type(mismatch).__name__))
TypeError: Expected int32, got list containing Tensors of type ‘_Message’ instead.
Sorry, I’m not clear on what the fault is.
Perhaps start with this tutorial:
https://machinelearningmastery.com/tutorial-first-neural-network-python-keras/
Hi, Jason. I just find what’s wrong.
I just use the old version of TensorFlow-0.12. After I update tensorflow version to 1.2.1.
It run successfully. Thus I think maybe the python APIs change for the new version.
Anyway. I’am so excited. Thanks for the nice tutorial !
I’m glad to hear that Leopard.
Hi Jason,
Great post! I am just a little bit confused about the use of reset states on stateful lstm RNN, cf. ‘Stacked LSTMs with Memory Between Batches, code line 50,51,52 in the post’. Say we have a well trained stateful LSTM RNN model, then we want to make predictions on testX, so first we make predictions on trainX to get the state of last time step, then use the state of last time step as the initial state of the test set, do testPredict = model.predict(testX, batch_size=batch_size), question is why model.reset_states() is in between?
To clear the internal state of the network.
I recommend testing with and without and see if it makes a difference, see this post:
https://machinelearningmastery.com/get-the-most-out-of-lstms/
Good site to learn LSTM and Keras, thanks to all your effort
Thanks.
In Time series prediction happen for next few time periods. How can you do prediction for next 12 time periods
See this example:
https://machinelearningmastery.com/multi-step-time-series-forecasting-long-short-term-memory-networks-python/
Please can you explain how we can do LSTM for regression problem,how it is differ from classification ,how it is works for continuous output?
See this tutorial for LSTM on regression:
https://machinelearningmastery.com/time-series-forecasting-long-short-term-memory-network-python/
I am trying to implement the RNN regression with dataset having 4 samples and 1 features columns,the shape of dataset is (9567,5),here 9567 rows ,5 columns ,how to reshape the this data set for RNN.
Like this:
Thank you for prompt reply.
Why we have to reshape the inputs in RNN and CNN for neural networks,we can’t read without reshaping of inputs in RNN and CNN.
It is a requirement of the Keras library that inputs have a specific dimensionality.
i am trying to train the RNN Regression model with optimizer adam and loss function mean_sqaured_error,but i am getting too much loss value,even though i have increased the no of epochs and node list also,please give any suggestions to decrease the loss value in RNN Regression
Here are my best suggestions for tuning neural nets:
https://machinelearningmastery.com/improve-deep-learning-performance/
Thanks for writing a nice blog.Iam using daily level data for forecasting .If i would need a 90 days ahead forecasting what i need to do .This example is for one step ahead forecasting .
See this post on multi-step forecasting strategies:
https://machinelearningmastery.com/multi-step-time-series-forecasting/
See this post on LSTMs for multi-step forecasting:
https://machinelearningmastery.com/multivariate-time-series-forecasting-lstms-keras/
Results will probably be poor regardless of method, it’s a hard problem to predict that far in advance unless your domain is trivial.
Hi Jason,
Thank you very much for your post!
Unfortunately the fitting of the two series in the plot is just an illusion. Here is why:
The output of your network is a 1 step delayed version of the input.
In other words, the network learns that outputting something similar to the input will minimize the mse. That is sometimes called a “trivial predictor” and has very poor predictive performance.
If you do not believe me go ahead and calculate the mse between X(t) and X(t-1) (no neural network required). Is your prediction much better than this?
Alternatively you can plot your output Y(t) together with X(t-1). That does not fit perfectly?
model = Sequential()
model.add(LSTM(1,unroll=True,batch_input_shape=trainX.shape, return_sequences=False))
model.add(Dense(300))
model.add(Dense(1,activation=’linear’))
#model compilation
model.compile(loss=’mean_squared_error’, optimizer=’rmsprop’, metrics=[“mse”])
print “it is going to train the model”
#train the model
model.fit(trainX,Ytrain,batch_size=2,nb_epoch=100,verbose=2)
#predict the outputs
predictions=model.predict(trainX)
score=model.evaluate(trainX,Ytrain,batch_size=32)
this is my code RNN Regression.
i am getting too much loss values ,while training the model.please give me suggestions for to improve my model performance.
I have a ton of ideas here:
https://machinelearningmastery.com/improve-deep-learning-performance/
Nice and useful blog, thanks for sharing!
Here is another reference on time-series prediction with neural networks and gaussian processes, which includes various feature pre-processing techniques.
http://www.tandfonline.com/doi/abs/10.1080/07474938.2010.481556
Thanks for sharing Nesreen.
on what basis we can select no of hidden layers for RNN networks?any formula is there for this.
Sorry, there is no reliable analytical way to configure neural networks.
The best we can do is to use experimentation (recommended) or copy designs from other people (common in computer vision).
Hello Jason,
Thanks for the wonderful explanation. I am working on my master thesis and my task is to perform predictive analysis (time series data) using neural networks. In statistical theory, it can be called as multivariate time series regression. I have N features for the sales prediction. My question is, how feature selection method works in LSTM? Do I need to find the best features (srongly correlated) prior to feeding the data in LSTM or model will learn on its own?
I would recommend performing feature selection before applying the LSTM.
Or you can apply the LSTM and hope that it can down-weight features that are not predictive.
how the LSTM is differ from GRU in Recurrent neural networks?please can you explain it.
Generally, the LSTM unit is more complex – has more gates.
Hi Jason.
Love your blogs and the content you create. Extremely helpful.
I am currently working on a problem where I have to do text classification, or basically review classification.
I used your code template for CNN-LSTM classifier, and even included dropout.
Can you suggest other techniques that couuld be useful to get better accuracy. I got 70% accuracy on training-test data , but on new data, the model didn’t perform so well and only got 64%.
I used CountVectorizer to convert the text to array, and chose max features up to 1500
Does this hyper parameter have significant effect on the accuracy?
Two ideas would be to:
1. Focus on your text data and clean it well and reduce the size of the vocabulary to essential words.
2. Consider a multi-headed CNN with each head reading text with differently sized n-grams (e.g. kernel size).
Hi Jason,
Thank you for the blog it’s so helpful.
Actually, I am working on time series data which is close to this example. When I build the model, it doesn’t memorize the high picks. Also, I want to predict future data based on my known data then I try to shift my sequence step by step to predict future values, the problem is that it get worse and worse when I add forecasted data.
I tried to increase the timestep but the result didn’t get better. I tried also to increase the number of epoch and the number of layers but still the same thing.
What do you recommend in this case?
Predicting the future is hard 🙂
The further out you go, the worse it will become.
I have a list of general things to try here:
https://machinelearningmastery.com/improve-deep-learning-performance/
what is hyper parameter in machine learning jason?how it is differ from normal parameters?
Great question, see this post on the topic:
https://machinelearningmastery.com/difference-between-a-parameter-and-a-hyperparameter/
#model creation
model = Sequential()
#model.add(LSTM(4,unroll=True,batch_input_shape=trainX.shape, return_sequences=False))
#model.add(SimpleRNN(4,unroll=True,batch_input_shape=trainX.shape))
model.add(GRU(4,unroll=True,batch_input_shape=trainX.shape))
#model.add(Dense(500,activation=”relu”))
model.add(Dense(200,activation=”relu”))
model.add(Dense(80,activation=”relu”))
model.add(Dense(1,activation=”linear”))
#model compilation
model.compile(loss=’mean_absolute_error’, optimizer=’adam’, metrics=[“mae”])
print “Training the model”
#train the model
batchSize = 16
print type(trainX)
print type(Ytrain)
model.fit(trainX,Ytrain,batch_size=batchSize,nb_epoch=20,verbose=2)
#predict the outputs
predictions=model.predict(trainX)
score=model.evaluate(trainX,Ytrain,batch_size=batchSize)
print(“score value”,score)
RegScoreFun = r2_score(Ytrain,predictions)
meanSquareError = mean_squared_error(Ytrain,predictions)
print(“RegScoreFun”,RegScoreFun)
print model.metrics_names
print model.summary()
meanAbsoluteError=mean_absolute_error(Ytrain,predictions,multioutput=’raw_values’)
print meanAbsoluteError
print meanSquareError
this is my RNN regression code,when i will call model.predict(Xtrainvalues) , i am getting same values as predictions, it has to be different,
Please where i am doing wrong in this code.
Perhaps your model needs to be tuned for your problem.
Here are some ideas:
https://machinelearningmastery.com/improve-deep-learning-performance/
when ever i am doing model.predict(xtrain_values),i am getting all predict values as same ,that is why i am not getting good loss values,how to resolve this issue .
Please help me in this scenario.
I have some ideas here:
https://machinelearningmastery.com/improve-deep-learning-performance/
model.predict() gives same output for all inputs in regression,any solution for this problem.
my configuration,
3 hidden layers with relu activation functions.
output layer is linear,batch size :24 and no of epochs is 60.
nodes are :200,100,50.
inputs nodes :4
loss function : mean squared error
optimizer : adam.
Please do any suggestion for this problem.
Perhaps you need to prepare your date or tune your model, here are a suite of ideas to try:
https://machinelearningmastery.com/improve-deep-learning-performance/
You should not use more neurons.It might be underfitting problem.try adding more layers with less neurons
I think there is a error: A few data points in train and test data seems to be missing, as you can see on the graph (green line finishes before the blue line).
Here are the steps to fix it:
First you are removing 2 points from the train and test data here:
“for i in range(len(dataset)-look_back-1):” it should be: “for i in range(len(dataset)):”
After this change, inside the loop we are tyring to acess a element outside the dataset (the next prediction), since we are not using then dataY it in the test dataset. we can just set it to 0:
“if i + look_back < len(dataset):
dataY.append(dataset[i + look_back, 0])
else: dataY.append(0) #This is the last value, no prediction necessary."
After this, both the training and test set will have all the data (and not 2 less data points as before).
Now we just need to plot it.
Not sure why the train "prediction" array shift that was used (probably to mask the missing of data points), it can just be ploted like this:
"plt.plot(trainPredict)"
And finally since the test data now has the right dimension it can be shifted just next to the train prediction:
testPredictPlot[len(trainPredict):len(dataset) :,] = testPredict
And you get a nice graph with the train and test data matching the original data (without any shift) and the test data prediction to every data point until the end :
https://www.dropbox.com/s/x128njdu8dfhufb/airplane_graph.png?dl=0
# create and fit the LSTM network
model = Sequential()
model.add(LSTM(4, input_shape=(1, look_back)))
model.add(Dense(1))
model.compile(loss=’mean_squared_error’, optimizer=’adam’)
model.fit(trainX, trainY, epochs=100, batch_size=1, verbose=2)
in this model , why we have to specify the hidden first layer neurons number in the First layer itself,why don’t we specify this number of neurons in second layers .
We specify the number of neurons in each layer, the first hidden layer must also specify the number of inputs (e.g. the input layer or visible layer).
Great tutorial Jason!
Consider I measure something 3 times a month for few years.
In 2014, I’ve measured it on “2014-02-01, 2014-02-05, 2014-02-13 ” in (YYYY-MM-DD) format.
In 2015, I’ve measured it in the same month, but on different dates “2015-02-11, 2015-02-16, 2015-02-21 “.
Is it advisable to assign monthly values to average of that particular month of the year by grouping it? or Is it okay to use the same data-set without processing it?
Try both framings of the problem and see what works best when making predictions.
Can We write CNN regression usign keras,is it possible?
I don’t see why not.
CNN is mainly used for image processing,but i didn’t find any examples for CNN so far.
how i can write this cnn Regression ,please give me any suggestions for it.
it will helpful for my task ?
Sorry, I am only familiar with the use of CNN on image and text data. I have not used it on regression problems.
I do not expect CNN to be useful for regression unless your obs are ordered, e.g. time series.
I expect you can model your problem using a window method and a 1-D CNN. Some of my examples of working with text and a CNN may be helpful to you for a starting point.
Jason, hi!
Is there a case when we predict the same thing but for several airlines
In this case, we can increase the dimension
look_back = number of companies
but what if we want to add another variable, for example, the budget for advertising
Yes, this is multivariate time series. I have an example here:
https://machinelearningmastery.com/multivariate-time-series-forecasting-lstms-keras/
Thanks, Jason!
Jason, this post is for just one object – Beijing
Can we use LSTM for several objects?
Yes, I recommend trying it for your problem and see how it impacts the skill of the predictions.
Hi Jason, thanks for the tutorial it was really helpful like always.
However, I am having kind of an existential crisis. Lets say we have a series 2, 4, 8, 16, 32. We get the difference and get the following (lets forget scaling for now)
X = 2, 4, 8
y = 4, 8, 16
we use X_train = 2, 4 and y_train = 4, 8 to train the model to predict y = 16 if X = 8. How does this help unless we can predict the next number in the series (64). How do we do that because we do not have difference (X value) for that?
I know others have asked the same question and I checked all the links but all examples are just train, test split of the data without actual forecasting of unknown values. Could you please extend this tutorial to include forecasting of next values in the series because that will give more meaning to this exercise.
thanks,
I’m not sure I follow, what is the problem exactly?
Machine learning is really a mapping problem from X to y, e,g, y = f(X).
You must have input to predict an output.
Hi, Jason,
Thanks for your great tutorial. I have a question regarding to the input shape, the time steps and the number of features, when the value of look_back is more than 1.
# reshape input to be [samples, time steps, features]
trainX = numpy.reshape(trainX, (trainX.shape[0], 1, trainX.shape[1]))
testX = numpy.reshape(testX, (testX.shape[0], 1, testX.shape[1]))
# create and fit the LSTM network
model = Sequential()
model.add(LSTM(4, input_shape=(1, look_back)))
In your code, the original trainX is a 2D matrix with dimension [samples, look_back], and it looks like you are using the value of look_back as the number of features.
Alternatively, it might be more intuitive to treat the value of look_back as timesteps, then the code will be changed to
# reshape input to be [samples, time steps, features]
trainX = numpy.reshape(trainX, (trainX.shape[0], trainX.shape[1], 1))
testX = numpy.reshape(testX, (testX.shape[0], testX.shape[1], 1))
# create and fit the LSTM network
model = Sequential()
model.add(LSTM(4, input_shape=(look_back, 1)))
The value of features is 1 as we are doing uni-variate LSTM.
Am I understanding the meaning of look_back and input_shape correctly?
Do you think there is any difference by treating look_back == timesteps and look_back == features?
Generally, this post provides help on how to reshape input data for LSTMs:
https://machinelearningmastery.com/reshape-input-data-long-short-term-memory-networks-keras/
I have a question about bidirectional LSTM.
Keras provides a wrapper so we can do something like
model.add(Bidirectional(LSTM(10, return_sequences=True)))
In this case, however, do we have 10 units for forward processing and 10 units for backward processing? Or 5 each?
I took a quick look at the source code and it seems to be 10/10. (And the number is not required to be even.)
Yes, 10 forward and 10 backward. See this post for an example:
https://machinelearningmastery.com/develop-bidirectional-lstm-sequence-classification-python-keras/
I have a question. For the current code it is predicting only t+1.
Where should i change the code to predict 5days ahead? Is it possible??
Sorry I’m total new to python and LSTM and i’m trying to understand the coding.
I have an example of predicting multiple days ahead here:
https://machinelearningmastery.com/multi-step-time-series-forecasting-long-short-term-memory-networks-python/
Thank you Jason,your tutorials help me a lot! I recommended these to my classmates also.
Thanks Rowena!
Hello Jason I have a question. Can we apply multi-threads on this program? If the size of the training dataset is big it can take a long time to train the LSTM network. Can we separate the dataset or the epoches?
Keras is built on top of math libraries like TensorFlow and Theano. These underlying libraries will allow you to run code on multiple cores automatically or GPU cores if configured.
Can we develop text processing using neural networks,Please provide any guidance for this task?
Yes, perhaps start with this post:
https://machinelearningmastery.com/sequence-classification-lstm-recurrent-neural-networks-python-keras/
Hi Jason, this is an awesome tutorial, it has been very helpful for me to understand the way LSTMs work. There is something I don’t have clear at all, it is possible to configure a LSTM network with more than one hidden layer? and how does this influence the behavior of the network? Sorry if it is obvious, Thanks
Yes, it is called a stacked LSTM, see more about it here:
https://machinelearningmastery.com/stacked-long-short-term-memory-networks/
Hi Jason, I am in the Udacity Nanodegree program. I am working on a project using RNN-LSTM. But I am having a difficult time understanding the input shape. I don’t know if I missed something but I am not getting it. Are there any resources you could point me to? So I can understand how it works a little better.
Yes, take a look at this post on how to reshape data for LSTMs:
https://machinelearningmastery.com/reshape-input-data-long-short-term-memory-networks-keras/
Hi Jason!
First of all, thank you for that great post.
Using your post as study, I did some custom testing, one of them, I used the months as feature and look_back equals 5.
The new dataset:
Shape trainX (90, 5, 13)
Shape trainY (90,)
Shape testX (42, 5, 13)
Shape testY (42,)
Each month is a column (0 or 1).
I obtained the following results:
Train Score: 8.48 RMSE
Test Score: 24.26 RMSE
My question is, do you consider this approach of using the months interesting?
Thank you so much for the help.
Nice work.
First of all ,thanks a lot for the great tutorial Jason.
I just have one question regarding the achieved predictions using the LSTM network.
I just don’t understand why are you making “trainPredict = model.predict(trainX)” .
I get the predict method using the testset testX, but using this method for trainX is not like if you were in some way cheating? I say this because we train the network using the trainX and trainY and trainY corresponds to the labels you are trying to predict in the predict method using trainX.
Is it performed for validation purposes only?
I’m still learning to work with the Keras API so I might be confused with the syntax of it
Many thanks
It is a validation to see if the model can predict the data it was trained on. If it cannot, it is a sign of a poor model.
Hi Jason,
thank you so much for those tutorials, they are a great resource.
I have one quick question though: How can we use peephole connections?
I want to compare the performance of LSTMs using/not using them.
Thanks in advance and have a nice day!
I found this on google, perhaps it will help you get started:
https://github.com/fchollet/keras/issues/1717
Hi Jason,
I do not quite understand the meanings of LSTM blocks/neuron in keras or unit number in Tensorflow. Could you help me explain these terms with a graph?
I found some graphs in ttps://github.com/fchollet/keras/issues/2654 or https://stackoverflow.com/questions/43034960/many-to-one-and-many-to-many-lstm-examples-in-keras. In the many to many model of LSTMs, Do the green rectangles represent the STM blocks/neuron in keras or unit number in Tensorflow? However if the input sequence is smaller than the number of blocks/neuron, does it mean that some neurons have not input series, just pass states to the next neurons? For example, the input sequence is 30, while the number of neurons is 128.
Thank you very much.
If
I have a gentle introduction to LSTM here that may help:
https://machinelearningmastery.com/gentle-introduction-long-short-term-memory-networks-experts/
Hi Jason,
I am a beginner in the field of Handwriting Recognition Problem. I have gone through your article and I found 4 categories for sequence prediction problem: Sequence Prediction, Sequence Classification, Sequence Generation, Sequence-to-Sequence Prediction. So, which category belongs to Handwriting Recognition?
By Reading this blog, I got the idea how LSTM works but I am not getting about Multi-dimensional LSTM(MDLSTM). How can we incorporate it for Handwriting recognition Problem?
I found a paper which is working on MDLSTM for handwritten text.
https://arxiv.org/pdf/1604.03286.pdf
Can you help me to figure out it?
Thanks in advance!
Perhaps one to many, one image to many chars or many words.
What about MDLSTM? This paper (https://arxiv.org/pdf/1604.03286.pdf) is talking about scanning image in 4 directions for Handwriting recognition. But I have gone through many papers where CNN is used first to extract features followed by LSTM. Can you help me to figure out the things?
Perhaps this will help as a start:
https://machinelearningmastery.com/cnn-long-short-term-memory-networks/
Thanks so much for such great tutorials. I have gone thru all of them and find them very useful. I am trying to predict time series having a lot of surges.
So far I managed to get reasonable prediction however in all models I have tried I am having delayed output by single time unit (similar to what you are having in this tutorial).
I have also managed to get rid of the delyed output in this tutorial by increasing the timesteps to 12 and so the number of nurons to 12 in order to include the yearly seasonality.
My question is, is this the reason for the delyed output? if so, i dont see how i get rid of my model’s delayed output since it is a very difficult task to train a surgey signal.
many thanks
It means your model is predicting the input as the output and has no skill (e.g. persistence).
Thanks for your reply.
I am aware of that.
Again, this happens in your example also. Do you know what causes this to happen?
I have train the model with var t-2 only and got delayed output of 2 units.
Yes, generally, LSTMs are not suited to autoregression type problems:
https://machinelearningmastery.com/suitability-long-short-term-memory-networks-time-series-forecasting/
Great tutorial thanks
I just compared my RNNs, one with only one time step and another with 60 time steps which means it’s trained with 60 previous days(i-60) to predict the next day (i+1 or i depending on how you define). Both are good enough, but one thing I cannot understand is the RNN with only one time step shows a better prediction than the one with 60. I’m just vaguely getting my head around it thinking since there are more data it should calculate, it’s showing a bit more inaccurate results than the one with one time step.
But I ask myself again that “than, what’s the point of feeding it with more data? if it gives me worse predictions”
Can you explain to me why it’s happening please?
/Users/DylanPark/Desktop/Screen Shot 2017-10-30 at 2.26.22 AM.png
RNN with 60 time steps
/Users/DylanPark/Desktop/Screen Shot 2017-10-26 at 8.56.27 PM.png
RNN with one time step
Indeed, more time steps should be a better model.
The answer is, LSTMs are just not great at autoregression (e.g. local dependence):
https://machinelearningmastery.com/suitability-long-short-term-memory-networks-time-series-forecasting/
Hi, Jason
First of all thanks for the tutorial. An excellent one at that.
However, when I run your first source code is always wrong, as follows:
Traceback (most recent call last):
File “D:/Deep Learning/Examples/LSTM/11/hbckyc.py”, line 59, in
model.add(LSTM(4, input_shape=(1, look_back)))
File “E:\anaconda3-4.4.0\envs\dlwin36\lib\site-packages\keras\models.py”, line 443, in add
layer(x)
File “E:\anaconda3-4.4.0\envs\dlwin36\lib\site-packages\keras\layers\recurrent.py”, line 262, in __call__
return super(Recurrent, self).__call__(inputs, **kwargs)
File “E:\anaconda3-4.4.0\envs\dlwin36\lib\site-packages\keras\engine\topology.py”, line 569, in __call__
self.build(input_shapes[0])
File “E:\anaconda3-4.4.0\envs\dlwin36\lib\site-packages\keras\layers\recurrent.py”, line 1021, in build
constraint=self.kernel_constraint)
File “E:\anaconda3-4.4.0\envs\dlwin36\lib\site-packages\keras\legacy\interfaces.py”, line 88, in wrapper
return func(*args, **kwargs)
File “E:\anaconda3-4.4.0\envs\dlwin36\lib\site-packages\keras\engine\topology.py”, line 391, in add_weight
weight = K.variable(initializer(shape), dtype=dtype, name=name)
File “E:\anaconda3-4.4.0\envs\dlwin36\lib\site-packages\keras\initializers.py”, line 208, in __call__
dtype=dtype, seed=self.seed)
File “E:\anaconda3-4.4.0\envs\dlwin36\lib\site-packages\keras\backend\theano_backend.py”, line 2123, in random_uniform
return rng.uniform(shape, low=minval, high=maxval, dtype=dtype)
File “E:\anaconda3-4.4.0\envs\dlwin36\lib\site-packages\theano\sandbox\rng_mrg.py”, line 1354, in uniform
rstates = self.get_substream_rstates(nstreams, dtype)
File “E:\anaconda3-4.4.0\envs\dlwin36\lib\site-packages\theano\configparser.py”, line 117, in res
return f(*args, **kwargs)
File “E:\anaconda3-4.4.0\envs\dlwin36\lib\site-packages\theano\sandbox\rng_mrg.py”, line 1256, in get_substream_rstates
multMatVect(rval[0], A1p72, M1, A2p72, M2)
File “E:\anaconda3-4.4.0\envs\dlwin36\lib\site-packages\theano\sandbox\rng_mrg.py”, line 66, in multMatVect
[A_sym, s_sym, m_sym, A2_sym, s2_sym, m2_sym], o, profile=False)
File “E:\anaconda3-4.4.0\envs\dlwin36\lib\site-packages\theano\compile\function.py”, line 326, in function
output_keys=output_keys)
File “E:\anaconda3-4.4.0\envs\dlwin36\lib\site-packages\theano\compile\pfunc.py”, line 486, in pfunc
output_keys=output_keys)
File “E:\anaconda3-4.4.0\envs\dlwin36\lib\site-packages\theano\compile\function_module.py”, line 1795, in orig_function
defaults)
File “E:\anaconda3-4.4.0\envs\dlwin36\lib\site-packages\theano\compile\function_module.py”, line 1661, in create
input_storage=input_storage_lists, storage_map=storage_map)
File “E:\anaconda3-4.4.0\envs\dlwin36\lib\site-packages\theano\gof\link.py”, line 699, in make_thunk
storage_map=storage_map)[:3]
File “E:\anaconda3-4.4.0\envs\dlwin36\lib\site-packages\theano\gof\vm.py”, line 1098, in make_all
self.updated_vars,
File “E:\anaconda3-4.4.0\envs\dlwin36\lib\site-packages\theano\gof\vm.py”, line 952, in make_vm
vm = CVM(
NameError: name ‘CVM’ is not defined
I hope you can help, thank you!
Sorry, I have not seen this error before, perhaps try posting it to one of the Keras support locations:
https://machinelearningmastery.com/get-help-with-keras/
Thank very much for your reply.
I try do according to your method, find a solution,thank you Dr.J !
Thanks. Great tutorial. I have a question of LSTM.
The feature number of each sample is different, and I want to use these samples to train for a regression. Can this problem be solved by LSTM?
Sure. This post will help you configure your input:
https://machinelearningmastery.com/reshape-input-data-long-short-term-memory-networks-keras/
Could someone explain me what this line this does in code?
train, test = dataset[0:train_size,:], dataset[train_size:len(dataset),:]
See this post for more on array slicing:
https://machinelearningmastery.com/index-slice-reshape-numpy-arrays-machine-learning-python/
Hi Jason,
This is great tutorial, it’s been really informative!
Forgive my ignorance as I’m relatively new to RNNs, but I’ve recently been using a similar set-up for time-series regression modelling. Similarly, the results were remarkably accurate. However, one thing struck me as odd: the predicted values (model.predict(X_test)) appeared merely offset from the test set (Y_test) by one. I then noticed the same trends in the plots in this tutorial. That is, simply offsetting the predicted values by one will get the traces almost perfectly aligned. I retrained models setting the target variable (y_train) two steps ahead instead of just one. This time the predicted values were offset by 2, I repeated for 3 and so on. Eventually you look ahead far enough that model no longer works. It feels like the neural net is just learning to return the last entry in each input vector. Such an explanation would fit the observed trend. But, like I said, I’m fairly new to this. What is it that I’m missing?
Kind regards
Tolu
This might be a sign of the model acting like a persistence model (unskillful). See this post for a good baseline model to use as reference:
https://machinelearningmastery.com/persistence-time-series-forecasting-with-python/
Hi Jason,
Thank you very much! I’ll look into this.
Tolu
“We are going to keep things simple and work with the data as-is.
Normally, it is a good idea to investigate various data preparation techniques to rescale the data and to make it stationary.”
“We can see that the model did an excellent job of fitting both the training and the test datasets.”
These parts made me puzzled. How can one expect to get a good model using raw non-stationary data, and, even worse, say the model has got a good quality. It is great foolishness. Too dummy for a Dr. I would say.
All of your “wonderful” forecasts replicate previous data with minor variations, thus making the model almost completely useless. The values of the forecasts are just shifted values of the previous time-series points.
Thanks for the feedback.
Hi Jason,
I loved your tutorial. As always, they are extremely insightful and refreshingly easy to understand.
I have a question for you: I’m currently involved in a nonlinear optimization project and I’m looking into LSTMs (specifically their applications in reinforcement learning). In theory, would an LSTM perform well with stochastic input? For example, what if I wanted to train a model for a smart thermostat that uses the weather forecast (along with real-time state variables such as current room temperature) to predict when to start heating or cooling a building? Or does this go against what an LSTM is fundamentally designed to do?
Let me know what you think!
It is hard to say, try it and see! Compare to an MLP baseline.
Thank you Jason. This is very helpful.
Just curious though, even though the out of sample test data set seems to fit well when you plot it, isn’t the case that there might be some overfitting going on since the MSE error of the test set is more than double what the error is for the training MSE error? Is there a statistical threshold test to allow one to identify if overfitting is occurring?
Perhaps.
No, generally it is a matter of model selection – whatever you are willing to tolerate for your predictive modeling problem.
Hi Jason,
This is really insightful, thank you. I was wondering how I would achieve the same but with categorical data predictions. Steps such as the differenced series will not work the same. I have considered one hot encoding my data set but still do not understand how statistical analysis will be possible on these.
Indeed, ideas of trend and seasonality do not make sense with a sequence of labels.
Perhaps try projections of the labels, as we do with sequences of words in NLP?
Hi Jason,
Thank you for the tutorial!
I notice you have used batch size of 32 (or 64) many times for training.
Any reason for that? Is that another hyperparameter that we might have to play around with?
I’ve seen 128 being used quite a lot more.
I was just wondering about the reason (if any)!
Correct, tune for your problem.
See this post for some advice on tuning batch size:
https://machinelearningmastery.com/gentle-introduction-mini-batch-gradient-descent-configure-batch-size/
hello jason,
for a scenario of real-time forecasting where our input will be updated regularly, in such cases what should be done about input data shape or length?
for example, we want to use 25 data points as a training data to predict the next 5 data points. we want our training data points should be always 25 but updated. how the new data will replace the old data in the training dataset to provide the updated dataset which should have a length of 25 data points.
do you have any blog or example of such issues?
any guideline along with code would be really helpful for me?
Perhaps this post will help:
https://machinelearningmastery.com/multi-step-time-series-forecasting-long-short-term-memory-networks-python/
Hi Jason! Thank for all your great tutorials!
I have a question, in the stateful LSTM (with Memory Between Batches), the batch_size should be always 1? or could be other value, for example, the gcd of train size and test size?
Thank you a lot!
You can change the batch size.
Hi Jason,
Thanks for sharing this wonderful tutorial. However the more advanced approached you propose, the worse result you get. How can you explain it? Or simply because data is not applicable for this case? I expect to see the better result but feel a bit upset lol
LSTMs are not good at straight autoregression:
https://machinelearningmastery.com/suitability-long-short-term-memory-networks-time-series-forecasting/
Hi Jason,
Thanks for your great post! If my features include both sequence (t-n) values, and current (t) values (such as whether there is a promotion today) as input, how can I build the LSTM model? Thx!
Perhaps this post will give you ideas:
https://machinelearningmastery.com/reshape-input-data-long-short-term-memory-networks-keras/
Thanks Jason. I checked that post. It seems talking about how to reshape multiple sequence features. But my question include non-sequence features.
For example: to predict the sales at time t, we need t-n sales and also whether the product is on promotion at time t. How can we model the promotion effect? thx!
For non-sequence features, I would recommend a multiple-input model. I have some examples here:
https://machinelearningmastery.com/keras-functional-api-deep-learning/
HI Dears
i need to analysis my data using ANN ,anyone can do it contact me ,i will pay for him
fathi_nias@yahoo.com
thanks
Perhaps hire someone on upwork?
Greetings Jason,
I am a self-learner who has spent the last week breaking down different code to learn machine learning and I must say that your walk-through is very well put together. I was wondering how do I maintain the date and/or time information in the output of the graph? I am using the first column as an index for the second columns. The plot shows the temperatures on the y-axis without issue however the x-axis seems to just be a count rather than dates.
‘DateTime’ ‘WeatherLow’ are my headers
Good question, you can use use the count of time steps and the time stamps from the origional dataset. With this you can tie predictions back to time stamps, but its a bit of custom code for sure.
Hi Jason,
I tried to predict these data with more classical Machine Learning methods (such as Bayesian Linear Regression or Decision Trees).
I tried with both non-stationary data and stationary (made by log + differencing).
For methods like Decision Trees, the results were better with stationary data but for Bayesian Linear Regression they were far better with non-stationary data.
Do you have any explanation ?
Thanks,
Clement
Nice work.
Problems vary. It is always a good idea to test a suite of methods and method configurations. Picking methods analytically will not give good results unless your problem is trivial.
Hi Jason,
As your tutorial, for the input_data we prepared, the rows are how many observations, columns are look_back data (t-1, t-2, t-3…).
My training dataset includes 1M different store-item pairs, for each of the pair, there are 3 year time series sales data. I need to forecast sales for certain store-item pair. How can I prepare the input_data? I am thinking rows are 1M pairs, columns are look-back (t-1,t-2,t-3…), but can I differentiate certain store-item pairs, so that given a certain pair, I can make better forecast? Do I need an embedding layer?
Also, I can I define the look-back length? Does it make sense use 3 year as the look-back?
Thanks!
Sorry, typo: “How can I differentiate certain store-item pairs?”
“How can I define the look-back length?”
thx!
There are many ways to frame your problem, I’d encourage you to brainstorm then test each to see what works best for your specific data.
Perhaps per-store or per-item models would be a good (easy) place to start?
Thx for your reply! I tried per-store and per-item, there are only 4000 values. My prediction looks bad, and I think it is probably because the data is too small for the LSTM model.
Then I tried to add embedding layers, but I am not sure when it goes to model.fit(x_train, y_train), what is the shape of the dataset should be. Do you have any tutorial about how to add the embedding layers? or hints about other ways to achieve this? thx!
I have many posts on embedding layers for text data, you can use the blog search.
thx! That helps a lot!
Glad to hear it.
Hi Dr. Jason
thx for great topic, but i cant find a t+1 value, how can I print(t+1) value
t+1 is the next observation in your data from the current time step t.
If this is a new concept, perhaps you would be better to start here:
https://machinelearningmastery.com/start-here/#timeseries
Hello sir,
I want to implement LSTM network for classification. I have 41 features and 5 class. I don’t know how to use look-back for classification. I have read 1 paper ” Kim, Jihyun, and Howon Kim. “An Effective Intrusion Detection Classifier Using Long Short-Term Memory with Gradient Descent Optimization.” Platform Technology and Service (PlatCon), 2017 International Conference on. IEEE, 2017.” They have not mentioned look back. I have to implement the paper as assignment. please help me.
What is the problem exactly?
Dr. Brownlee,
Congratulations for your excelent guide. I was wondering if it was possible to feed the output of the model and see how it works with that instead.
Thank ou!
What do you mean by feed the output of the model?
You can make predictions as follows:
thanks for this awesome tutorial and did implement it and it works fine, however I tried to implement it in another data set which contains 5 features not just one. So I got this error
(Traceback (most recent call last): File “E:/Tutorial/pan.py”, line 68, in trainPredict = scaler.inverse_transform(trainPredict) File “C:\Users\sydgo\Anaconda3\lib\site-packages\sklearn\preprocessing\data.py”, line 385, in inverse_transform X -= self.min_ ValueError: non-broadcastable output operand with shape (45498,1) doesn’t match the broadcast shape (45498,5))
So I don’t know what to do.
Hi Tom, this post will show you how to model multiple input features:
https://machinelearningmastery.com/multivariate-time-series-forecasting-lstms-keras/
Dear Dr. Jason Brownlee, Thank you so so so much for your wonderful tutorials.
You’re welcome.
Hey Jason,
My data have weekly seasonality. Then what do you suggest as good look_back? Having look_back as 7 obviously gives good result compared to other look_back(3,4,5) because of weekly seasonality. Is it good to use 7? Using linear regression with 7 day lag variable gave me very good result. I don’t see the need of going to LSTM to achieve good result. So what would you do in this scenario.Thanks!
Experiments and see what works best.
Hi Jason,
I am working on a prediction model that learns with each data point. Could you give any suggestions how this could be modified to suit the purpose. Also rather than retraining the complete LSTM model is it possible to just refit the LSTM network according to the new data point as well.
It is called model updating, see here:
https://machinelearningmastery.com/update-lstm-networks-training-time-series-forecasting/
Could you be please explain the following difference?
LSTM For Regression Using the Window Methods:
trainX = numpy.reshape(trainX, (trainX.shape[0], 1, trainX.shape[1]))
model.add(LSTM(4, input_shape=(1, look_back)))
LSTM For Regression With Time Steps:
trainX = numpy.reshape(trainX, (trainX.shape[0], trainX.shape[1], 1))
model.add(LSTM(4, input_shape=(look_back,1)))
What is the reason for the position change between the trainX.shape[1] with 1 in the first row? and what is the reason for the position change between the look_back and 1, in the second row?
Thanks in advance,
It comes down to whether we want to use lag obs as features or time steps.
Time steps are for BPTT:
https://machinelearningmastery.com/gentle-introduction-backpropagation-time/
How to do out of sample forecast for this?also how to decide the optimum number of epochs?number of neurons?
See this post on predicting:
https://machinelearningmastery.com/make-predictions-long-short-term-memory-models-keras/
For getting the best config for your model, you must tune it for your problem.
Hi,
I want predict to time t + 12 in the first example, what change I must do?¿
Thx.
Hi Jason,
First, thanks for the good stuff 🙂
I could not find an example on how to “expand” data to have sequences of X past entries as timesteps and not features.
I could see this example:
https://machinelearningmastery.com/prepare-univariate-time-series-data-long-short-term-memory-networks/
Which splits de data into smaller samples, but I had in mind to do something like this, but maybe it would not be useful.
Let’s assume input like (Where A, B, C are features, and 1-4 observations):
A1 B1 C1
A2 B2 C2
A3 B3 C3
A4 B4 C4
I’d like to turn it like this (with lag = 2)
[0, A1] [0, B1] [0, C1]
[A1, A2] [B1, B2] [B1, B2]
[A2, A3] [B2, B3] [B2, B3]
Would there be any advantage doing so ? And is there any better method than recopying each line X time and reshaping the dataset ?
Try this post:
https://machinelearningmastery.com/convert-time-series-supervised-learning-problem-python/
Thanks, but unless I missed something, this puts additional timestep as features, not as 3d timesteps ? I am to have something like:
initial shape [1000,1,X] (with X = features count) to [1000,10,X]
And I have another question 🙂
My understanding is that unless the network is stateful, its state will be reset between each call of predict function.
Now let’s imagine that I am training with data that are averaged every 5 minutes or more, but I want to predict in the future every minute or even real tiime. If I use my model to predict, it might give false results because of difference in the rate of samples I believe. In this case, should I proceed like:
-Use Stateless LSTM Networks.
-Aggregate current samples until I have a time span of 5 minutes, and periodically reset the network state after inserting aggregated samples in the predict sequence ?
Correct. Test to see if it makes a difference or not. I find if often does not.
Hi,
Is it relevant to use cross validation for LSTM?
Thanks
It really depends on the problem.
Sometimes it may make more sense to use walk forward cross validation:
https://machinelearningmastery.com/backtest-machine-learning-models-time-series-forecasting/
Jason,
Even the walk forward cross validation is questionable in the case of LSTM. In my understanding, LSTM might outperform the other architectures, in case of long sequences. By using a sliding window approach, we are diving one long sequence into several independent sequences.
How so?
In my understanding, LSTMs do not require a fixed size input. They are capable of “remembering” their past and can choose the correct size window on their own. It’s different from FeedForward NNs, mainly because there is no memorization capability.
Yes.
Typically we implement them with fixed sized inputs for efficiency reasons. This is the default in Keras and the default approach I teach.
the dataset contain two columns why the date column not appeared in the first figure and why don’t use it . i want to include it in the forecasting process any suggestion thanks in advance
Why do you want to include the date column as an input?
Hi Jason
thanks for this tutorial.
I start reading it some days ago.
I have few doubts. Can I ask you an help?
why do you invert predictions?
sc.inverse_transform(Y_trainPredict), sc.inverse_transform([Y_train]) and so on..
as the model is trained to predict Y_train (you never transformed it) I think y_trainPredict and Y_train are already in the correct scale.
what am I missing?
thanks again
To get the predictions back into the original scale.
Hi Jason, could you clarify something for me ?
Why do you use test set to get predictions ? If you predicting something,you do not know what will be in future…
Sorry for neewbe questions, i want to learn something new.
Thank you !
We do this to estimate the skill of the model in order to get an idea of how well it might perform on data where we do not have the output available.
Thank you for sharing. This is excellent for a ML beginner like me.
Thanks David.
Thank you for sharing. How can we get the results into excel? I mean, not just diagram.
You can save the result to a CSV file then load the CSV in excel.
Hi Jason, could you comment on the following problem:
let’s say we have time series data for t=5 time steps, 2 features (x1,x2). and we want to predict till t=10, first we would predict for t=6, using the LSTM trained on t=1-5. Then for t=7 using all previous timesteps t=1-6. and so on finally for t=10 using the original data from t=1-5 and the four new predictions for t=1-9.
Perhaps start with an MLP.
Hi Jason,
It failed when I have done training for batch_size=32. I have make the dataset (training and testing) multiple of 32. Even then its failing. Any comment what I am doing wrong.
Sorry to hear that, what error are you getting?
hi. Thanks for your teaching.
I think the indexes in the sentence are wrong as the following.
“testPredictPlot[len(trainPredict)+(look_back*2)+1:len(dataset)-1, :] = testPredict”
should be
“testPredictPlot[len(trainPredict)+1:len(dataset), :] = testPredict”
In fact the length of testPredict is equal to one of testX and so is trainPredict.
hi Jason,
in the first result we obtain a test score = 47.53 but you have said that the average of error is about 52 thousands passengers, was this an error or i’ve missed something?
Hi Jason,
Great write up.
I tried the code. But there the actual vs predicted line is not continuous, it is breaking at a couple of points. I guess it is because, all 96 points from training set and all 48 points from Test set have not been included.
While using the reshape function, the train length becomes 94 and the test length becomes 46.
I tried correcting the create dataset function, but an error message is coming up:
IndexError: index 96 is out of bounds for axis 0 with size 96
So,
I am a bit confused. Why are the prediction on the test data set fed with the ground thruth instead of with the subsequent predictions themselves. Isn’t it cheating?
The model is essentially outputting random values with not-so-big standard deviation compared to the previous (ground thruth data). This is why they look nice and they do not drift too much apart.
This is not a useful tool for forecasting in a reliable way.
Am I missing anything?
This is called walk forward validation:
https://machinelearningmastery.com/backtest-machine-learning-models-time-series-forecasting/
Thanks Jason
Another question: am I only allowed to predict in the future the same amount that I look back?
No, you can choose how to frame your sequence prediction problem.
The lengths can be decoupled with an encoder/decoder framework.
Hi,
I want to implement a model with LSTM and one max pooling layer with 4D input. However, LSTM’s output is 3D. How can I implement?
Example:
LSTM ( units:32, input_shape(batch_size,1,200),return_sequences:true)
LSTM ( units:32, input_shape(batch_size,1,200),return_sequences:true) //3D output
pooling() //input_Shape(sample,row,col,channels)
TimeDistributed()
The idea is to encode the input with one-hot encoding CNN with max-pooling to character embedding then pass the same input through biLSTM to process each character embedding to word vector by concatenating the last time step in each direction.
Looking forward to hear from you.
Hi,
I implement the above as follow:
from keras.models import Sequential
from keras.layers import Dense
from keras.layers import TimeDistributed
from keras.layers import LSTM
from numpy import array
import numpy as np
length= 5
trainX = 2.5 * np.random.randn(2,3,length,7)+3
trainY = 2.5 * np.random.randn(2,length,7)+3
dataset = 2.5 * np.random.rand(1,length,7)
look_back =3
batch_size = 1
# sequenced_model.
model = Sequential()
model.add(TimeDistributed(LSTM(7, batch_input_shape=(batch_size,\
look_back, dataset.shape[1], dataset.shape[2]), stateful=True,\
return_sequences=True), batch_input_shape=(batch_size,\
look_back, dataset.shape[1], dataset.shape[2])))
model.add(TimeDistributed(LSTM(7, batch_input_shape= (batch_size,\
look_back,dataset.shape[1],dataset.shape[2]),\
stateful=True), batch_input_shape=(batch_size, look_back,\
dataset.shape[1], dataset.shape[2])))
model.add(TimeDistributed(Dense(7, input_shape = (batch_size,\
1,look_back, dataset.shape[1],dataset.shape[2]))))
model.compile(loss = ‘mean_squared_error’, optimizer=’adam’)
print(model.summary())
for i in range(10):
model.fit(trainX, trainY, epochs=1, batch_size=batch_size,
verbose=2, shuffle=False)
model.reset_states()
/* Got this error:
ValueError: Error when checking target: expected time_distributed_54 to have shape (3, 7) but got array with shape (5, 7)
*/
This post can help you reshape your data for LSTMs:
https://machinelearningmastery.com/reshape-input-data-long-short-term-memory-networks-keras/
thanks for this tutorial,
Can we use the same method on ECG data?
Is it possible to predict ECG?
Perhaps. I would recommend looking into some papers on neural nets on ECG data to see what the state of the art methods are.
thank you for replying
I have a master project (specialization: artificial intelligence and distributed systems) on the following topic:
“Time series analysis for IoT seneor”
Can you help me to suggest a simple project or program in this specialty and thank you
We have benefited greatly from your publications
Thank you
Perhaps here is good place to start:
https://machinelearningmastery.com/start-here/#timeseries
First of all, thank you for your great tutorials! They helped in reducing the steep learning curve of the machine learning libraries. Especially useful when one is working on applied machine learning research.
In the example here, and all others, the scaler is applied on the entire dataset. Shouldn’t it be applied only on the training data after the split? Test data is something which is seen by the model after training is over and used for forecasts. So including the future values in the scaler that involves max and min would bias it.
It should be calculated from training and applied to test, I was trying to keep the example simpler.
How can I obtain a ‘mean absolute percentage error’ instead of ‘mean squared error’?
I imported MAPE using
from keras.metrics import mean_absolute_percentage_error
as there was an ImportError while importing with sklearn.
Later modified to get this
model.compile(loss=’mean_absolute_percentage_error’, optimizer=’adam’)
Finally modified to get this
trainScore = math.sqrt(mean_absolute_percentage_error(trainY[0], trainPredict[:,0]))
testScore = math.sqrt(mean_absolute_percentage_error(testY[0], testPredict[:,0]))
The model completes all the epochs and then reports a Traceback:
trainScore = math.sqrt(mean_absolute_percentage_error(trainY[0], trainPredict[:,0]))
TypeError: a float is required
How do I solve this issue?
I don’t think MAPE is supported by default, you might have to implement it yourself.
I have an example of implementing a custom metric here:
https://machinelearningmastery.com/custom-metrics-deep-learning-keras-python/
—————————————————————————
ValueError Traceback (most recent call last)
in ()
—-> 1 trainPredict = scaler.inverse_transform(trainPredict)
2 #y_train= scaler.inverse_transform(y_train)
3 #testPredict = scaler.inverse_transform(testPredict)
4 y_test= scaler.inverse_transform(y_test.reshape(1,-1))
~/anaconda3/lib/python3.6/site-packages/sklearn/preprocessing/data.py in inverse_transform(self, X)
383 X = check_array(X, copy=self.copy, dtype=FLOAT_DTYPES)
384
–> 385 X -= self.min_
386 X /= self.scale_
387 return X
ValueError: non-broadcastable output operand with shape (157,1) doesn’t match the broadcast shape (157,4)
solution for this?
Are you able to confirm that you copied all of the code as-is from the tutorial?
Thanks for the awesome walk through,
You’re welcome.
Hi it was very useful.What is a unit in a LSTM layer.Is it a block that contains the four gates?
Yes.
can you explain why you are shifting the dataset.I can’t understand that step
Perhaps this post will help:
https://machinelearningmastery.com/convert-time-series-supervised-learning-problem-python/
I have multiple feature time series data but timestep in not constant. How to model such data in LSTM architecture.
SegmentNo / Speed(kmh) / Distance(km) / Time(minutes) / TransportMode
1 70 30 28 Car
2 3 1 15 Walk
3 40 10 20 Bus
in the single trip of a user, he first travels 28 minutes by car, then he walks for 15 minutes and then travels 20 minutes by bus. I am interested to know next transportation mode in a sequence that user will take. can I also predict the set of other features (speed, distance, time).
I though to consider a trip as a batch, but the timestep is variable, 28 minutes then 15 min and then 20 minutes.
these are sample attributes but I also have other set of attributes like timestamps of their travelling, bearing rate, velocity, acceleration etc…
I would recommend getting creating about how you frame your predictive modeling problem.
Hi
Is is possible to use RNN on LSTM neural networks for the following problem:
I have sequence of scalar measurements x(t_0),x(t_1),,,x(t_n) and I should be able to predict physical quantity y(t_n) at any moment t_n, n=[0,N]?
What is different from normal time series prediction (with fixed number of last measurements), is that I have to absolutely use measurement information from the very beginning moment t_0 until t_n. Don’t ask why, but the beginning measurements (and later, too) really affect the outcome. So this is not a stochastic process like stock market or something, but a physical system.
In other words, the neural network should “iterate” through measurements and maybe use a fixed number of latest measurements x(t_n),x(t_n-1),,,x(t_m), but it should memorize what has happened before the current measurement inouts and tune its prediction accordingly.
Is it possible at all? Hopefully you understand the problem and I’d still emphasize that the whole series affect the output and must be taken into account somehow, but the latest measurements have gladly the greatest impact.
BTW, thanks for the site, Jason!
Perhaps. I would recommend testing a suite of methods on the problem, and a suite of framings of the problem to see what works best.
Thank you for your example. Every other example is shit compared to this one, if you will use it to learn LSTM from scratch.
Thanks Carlos.
Hi Jason,
I have multivariate time series sequential data and i want to detect the outlier. Will RNN+LSTM help in this case?
I have data related to Combined Sewer Overflow (CSO) network, which captures say flow1, flow2, flow3 every 15 min and isCSOSpilled which can happen any time as:
Time Flow1 Flow2 Flow3 IS_CSO_SPILLED <>
1-Jan-2018 00:00 20 21 77 Not Spilling
1-Jan-2018 00:15 20 24 71 Not Spilling
1-Jan-2018 00:30 23 45 76 Not Spilling
1-Jan-2018 00:45 20 87 83 Not Spilling
1-Jan-2018 00:52 1 SPILL_STARTED
1-Jan-2018 01:00 14 44 57 SPILLING
1-Jan-2018 01:15 20 21 70 SPILLING
1-Jan-2018 01:21 0 SPILL_STOPPED
1-Jan-2018 01:30 20 77 48 Not Spilling
1-Jan-2018 01:45 1 SPILL_STARTED
Test data is also in same format. I want to build a model which can validate the spills (IS_CSO_SPILLED=1) of the test data.
For above question, trying to print data in nice comma seperated format which is easy to understand:
Time, Flow1, Flow2, Flow3 , IS_CSO_SPILLED REMARKS
1-Jan-2018 00:00, 20 , 21 , 77 , NULL , Not Spilling
1-Jan-2018 00:15, 20 , 24 , 71 , NULL , Not Spilling
1-Jan-2018 00:30, 23 , 45 , 76 , NULL , Not Spilling
1-Jan-2018 00:45, 20 , 87 , 83 , NULL , Not Spilling
1-Jan-2018 00:52, NULL , NULL, NULL , 1 , SPILL_STARTED
1-Jan-2018 01:00, 14 , 44 , 57 , NULL ,SPILLING
1-Jan-2018 01:15, 20 , 21 , 70 , NULL ,SPILLING
1-Jan-2018 01:21, NULL , NULL, NULL , 0 ,SPILL_STOPPED
1-Jan-2018 01:30, 20 , 77 , 48 , NULL ,Not Spilling
1-Jan-2018 01:45, NULL , NULL, NULL , 1 ,SPILL_STARTED
Perhaps.
I don’t have material on anomaly detection in time series with LSTMs. I hope to cover it in the future.
Hi Jason,
Thank you very much for this article!
Would it be possible to predict the trend line (slope and duration) instead of only the value at the next step?
Any advice on this would be appreciated!
Yes, but you will have to use a linear regression model instead.
Hi Jason. Thank you for your great post! I noticed a subtle issue in the graph of predicted line and expected line (red and blue). The shape of two lines matched nicely, however, it seems that the predicted value is always one step behind the expected value. E.g. the true value sequence is […, 1, 2, 3, 4, 3, 2, …], then the predicted sequence looks like […, _, 1.1, 2.1, 3.1, 4.1, 3.1, …].
I’m actually facing the same issue in my own project. To my understanding, this 1-step drift makes the prediction totally worthless. I really look forward to your reply!
One step behind suggests that the model has learned a persistence forecast and is not skilful.
You can learn more about this here:
https://machinelearningmastery.com/faq/single-faq/why-is-my-forecasted-time-series-right-behind-the-actual-time-series
Ho jason, thanks for this post. Is it possibile to force the LSTM to predict monotonic sequences (say not-decreasIng)?
Sure. Generally, LSTMs are not great at autoregression though.
Hi Jason,
Thanks for the post. Do you perhaps have a reference code for how to force the LSTM to predict monotonic sequences? What is the general approach for this?
This might help as a first step:
https://machinelearningmastery.com/how-to-develop-lstm-models-for-time-series-forecasting/
Hi Jason,
Is it possible to enforce a constraint such that the sequence of outputs at every timestep of an LSTM is increasing ?
Not as far as I know, at least with a vanilla LSTM.
Hi jasson, i am writing you because i would like to know, if you could teach me how to include a dummies to fit interventions in a timeseries. For instance, supose there was some situation which made the airline sold more tickets in a specific day, this is an outlier in the series, i.e., this is not a seasonality issue how i could include it to improve fitting to the data?
Thanks
I hope to cover that topic soon.
I want to predict unseen data for example If I have trained a model for JAN to DEC for a year 2018, how can I get next year’s (2019) predictions?
testPredict = model.predict(testX)
I have no Idea what would be testX because I have no values for next year.
What I have tried is, I have Predicted with single value of the DEC. So Is it true that predicted value will be off JAN_2019?
JAN_2019 = model.predict(DEC_2018) ???
I have made similar predictions for 2019 like –
FEB_2019 = model.predict(JAN_2019)
But I am getting only a constant line which is not very different from JAN_2019’s value.
The input to the model depends on how you have defined the input to your model.
If your model expects one year of data to predict one month, then you must provide one year of prior data.
Does that help?
Hi. I am really appreciate your posting. Thank you!
um.. Maybe It’s dumb question… I don’t understand your reply…
As Sarvesh Kumar, I also struggle to find out what the testX is.
In your (maybe all of) posting, to forecast “t+1 ~ t+n” values, you divided train/test and then, you used “test data set” to prediction.
Test data set is from original data set. So.. we already know values.
But what we really want to do is to make “unseen data set” which will be used on model.
(In this case, to make 2019_JAN Y , we made model by data X,Y from 2018_JAN to 2018_DEC, but we don’t know the 2019_JAN X, where is X..?)
You said…
“The input to the model depends on how you have defined the input to your model.
If your model expects one year of data to predict one month, then you must provide one year of prior data.”
Is it meant that testX size must be one-year data? I don’t even know what the test X is. Is it possible to make prediction without knowing future value?
If you have any example code (or posting) Please Let me know!
No, it means it depends on how you define your model and how you have prepared the data.
Perhaps try working through this tutorial to help make these concepts clearer:
https://machinelearningmastery.com/time-series-forecasting-long-short-term-memory-network-python/
THERE IS SOMETHING FISHY ABOUT THIS. Try 5% Training or less to see
What do you mean exactly?
Hi Jason,
Thank you for taking the time to share the knowledge.
In the last example, the for loop resets the state after each epoch. Then, what is the purpose to set the stateful=True?
Mihai
To give control over when state is reset instead of having the state reset automatically after each batch.
Hi Jason,
This demo is very helpful!
A couple of things,
1)Could you give more of a thorough explanation on how this model is working and why we shaped the training data set the way we did? with the t, t+1…. why is it only taking 1 previous look back to predict the next? Not clear…
2) My data behaves differently according to the day of the week, could you show me how I would make day of the week another input variable?(code-wise)
You can learn more about preparing data for LSTMs here:
https://machinelearningmastery.com/faq/single-faq/how-do-i-prepare-my-data-for-an-lstm
You can learn more about modeling time series with RNNs here:
https://machinelearningmastery.com/faq/single-faq/how-do-i-use-lstms-for-time-series-forecasting
Also, Can I give the trained model a random future Date (or set of dates) and say predict values for these dates? how would i do that?
The results will be poor the further in the future you try to predict.
or even if this approach isnt taking date into consideration, how can i make atleast predict the value at the next time step or the next few time steps ?
Here is more information on how to make predictions:
https://machinelearningmastery.com/make-predictions-long-short-term-memory-models-keras/
Like what would be the inputs when making predictions
It depends specifically on what your model expects as input.
Hey Jason,
I used your exact example to train/test the model, (in my case my input values represent “page views” instead of passengers). how can i predict what the page views will be tomorrow? or over the next 7 days? the link you showed says use yhat = model.predict(X) …. what would my X be exactly? Can you give me a code snippet for how i would do this please?
I understand when the model was predicting the values for the test set, you fed it the values that you already have for it. but what would i feed the input (X) if I want to predict tomorrow(or next few days) which i don’t have a value for?
This is the piece that is really confusing to me. thank you for your help
You can use a recursive model, more details here:
https://machinelearningmastery.com/multi-step-time-series-forecasting/
Here is an example of multi-step forecasting with an LSTM:
https://machinelearningmastery.com/multi-step-time-series-forecasting-long-short-term-memory-networks-python/
thank you for this great work!
I have a question about the model predict. In ” testPredict = model.predict(testX)”, I want to know if the model makes prediction of the next value based on his own last prediction or it uses the true value of testX. Could you explain more please how the model makes prediction on the test set. thank you
This post might make things clearer for you:
https://machinelearningmastery.com/make-predictions-long-short-term-memory-models-keras/
Hello,
I am confused. Why the results are slightly better than previous example, although the structure of the input data makes a lot more sense ( in the part of LSTM for Regression with Time Steps) ?
Hi-
Why did we take time-step as 1? If we take time step as 1, isnt that the same with ANN and cancels out the central logic of RNN?
Nearly, we loose the BPTT, but still gain the internal state.
Hello, could anyone please tell me what learning rate did you use for this example
It was automatically figured out via the Adam optimization algorithm.
You can learn more about Adam here:
https://machinelearningmastery.com/adam-optimization-algorithm-for-deep-learning/
i run this code but i get the following errors,
i am workin on time series problem and the size of the dataset is 38
from keras.models import Sequential
from keras.layers import Dense
from keras.layers import LSTM
from keras.wrappers.scikit_learn import KerasClassifier
from sklearn.model_selection import GridSearchCV
import numpy
import pandas as pd
# Function to create model, required for KerasClassifier
def create_model():
# create model
model = Sequential()
model.add(LSTM(2, input_dim=1, activation=’sigmoid’))
model.add(Dense(1))
# Compile model
model.compile(loss=’mean_squared_error’, optimizer=’adam’, metrics=[‘accuracy’])
return model
# fix random seed for reproducibility
seed = 7
numpy.random.seed(seed)
# load pima indians dataset
dataframe = pd.read_csv(‘C:/Users/ASUS-PC/Desktop/pfe/2017budauth7.csv’, usecols=[1], engine=’python’, skipfooter=3)
dataset = dataframe.values
dataset = dataset.astype(‘float32’)
# split into input (X) and output (Y) variables
X = dataset[:,0:1]
Y = dataset[:,1]
model = KerasClassifier(build_fn=create_model, verbose=0)
# define the grid search parameters
batch_size = [10, 20, 40, 60, 80, 100]
epochs = [10, 50, 100]
param_grid = dict(batch_size=batch_size, epochs=epochs)
grid = GridSearchCV(estimator=model, param_grid=param_grid, n_jobs=-1)
grid_result = grid.fit(X, Y)
# summarize results
print(“Best: %f using %s” % (grid_result.best_score_, grid_result.best_params_))
means = grid_result.cv_results_[‘mean_test_score’]
stds = grid_result.cv_results_[‘std_test_score’]
params = grid_result.cv_results_[‘params’]
for mean, stdev, param in zip(means, stds, params):
print(“%f (%f) with: %r” % (mean, stdev, param))
this is the error : ndex 1 is out of bounds for axis 1 with size 1
Sorry, I don’t have the capacity to debug your code for you.
Sorry, I don’t have the capacity to debug your code for you.
Hi jason, I have question regarding my regression problem.: I used this simple lstm model to predict:
model = Sequential()
model.add(LSTM(100, return_sequences=True, input_shape=(n_timesteps_in, n_features)))
model.add(LSTM(25, return_sequences=True))
model.add(LSTM(100, return_sequences=True))
model.add(Dense(n_features, activation=’tanh’))
the model was trained with a data shaped into windows. the problem is when I give model.predict another timseries data which the model did not saw before it can still predict it almost good enough to use. I think there must be something wrong e.g. seeing a cosinus wave in training and predicting stock exchanges are both different things but still predicition is good. What do I have to change ? does it have to do with stateful of the model or use a sequence to sequence prediction as you also described here
https://machinelearningmastery.com/define-encoder-decoder-sequence-sequence-model-neural-machine-translation-keras/#comment-438058
It is not clear what to change, perhaps experiment with each aspect of the model to help you debug and understand what is going on?
More ideas here:
https://machinelearningmastery.com/improve-deep-learning-performance/
Thank you for your respond. I already tried different variants for my network but I just can not follow back why my model.predict(test)=test even test has nothing to do with train data. the network training is fine loss is very small and model.predict(test) with test in correlation with train is working perfectly, but I am trying to see a mistake in the prediction so that the model is not following the ‘stock exchange’ back and making a sinus.
Perhaps there is a bug in your implementation?
I used the same code above I posted and do not want u debug all of my mistakes. It is strange because when I use other random data for the model to train, like training with sinus and than predicting stock exchange, the prediction is not working and I am achieving my goal. What can the problem be ?
In applied machine learning, the challenge is to choose the right data, model, and model config for each new problem.
You can learn more about this here:
https://machinelearningmastery.com/applied-machine-learning-is-hard/
Dear Jason, how are you doing?
Thanks a lot for all the information published in your blog! I’m now doing machine learning like I never did before!
I have a question regarding this example you shown here, which I used as reference and starting point for my project.
Wich is here: https://codepen.io/anon/pen/XYMNrY
As you could see, I’ve modified the code in order to read the last 400,000 rows with data directly from mysql, and then start making predictions based on the last record.
The problem I’ve found, is that predictions are much better when the model is trained with “lookback” variable around 150, however, if I change lookback = 150, it comes up with the following error:
ValueError: Error when checking : expected lstm_1_input to have shape (1, 150) but got array with shape (1, 1)
I understand that the shape of the array isn’t the same, as I printed them both, so I tried to provide the model with the last 150 records from mysql in order to make the predictions based on the last 150 records as well.
As following:
archivo_xnew = read_sql_query(“SELECT value FROM crawler ORDER BY round DESC LIMIT 0,150”, conn)
But I’m still getting the shape error, and I’m not being able so far -after 2 days trying- to make the array look the same way in order to make predictions. Could you please help me, or point me in the right direction?
Thanks a lot!
Pd: Aside from that, with the lookback set in 1, it all works nicely, but performance isn’t the same at all.
Pd2: in case there’s something else I could improve or any advice/recommendation, is really really appreciated!
Kind regards!
Chris
I recommend using the function in this page when preparing data:
https://machinelearningmastery.com/convert-time-series-supervised-learning-problem-python/
Hi Jason,
just wondering if my last comment was actually posted?
Thanks!
Feel free to delete this one!
More about the delay in posting comments here:
https://machinelearningmastery.com/faq/single-faq/where-is-my-blog-comment
Dear Jason, how are you? seems like the first time I tried to post this comment it didn’t work.
Thanks a lot for all the information that you provided in this blog, I didn’t know anything at all about machine learning, and within 3 weeks, with a background in PHP and just a little bit of Python, I was able to get a clear idea on how it works and make my first neuronal network!
I have used the examples you shown here and modified them in order to connect to a MySQL database and work with the last 400,000 values from it. By doing:
read_sql_query(“SELECT value FROM ( SELECT * FROM crawler ORDER BY round DESC LIMIT 400000) sub ORDER BY round ASC”, conn)
Once the model is trained it start making predictions, based on the last value which is taken from the database, trying to guess the next value.
like this:
read_sql_query(“SELECT value FROM crawler ORDER BY round DESC LIMIT 0, 1”, conn)
As you could see on the example, I’m using lookback = 1 in order to train the model and make the predictions, however, it performs so much using lookback = 50.
The problem is that if I train the model using lookback = 50, I get the following error when I try to make the prediction:
ValueError: Error when checking : expected lstm_1_input to have shape (1, 50) but got array with shape (1, 1)
I understand that this is a shape problem, as I trained the model using the last 50 records to predict and then I tried to make it predict using only one, so I changed the last query from:
read_sql_query(“SELECT value FROM crawler ORDER BY round DESC LIMIT 0,1”, conn)
to
read_sql_query(“SELECT value FROM crawler ORDER BY round DESC LIMIT 0,50”, conn)
but still getting the array formatted in a different way…
So I have been trying to make the array to look the same way for the last 3 days! I think it’s actually the function that creates the matrix changing the shape of the array? but probably my python isn’t really helping me here!
Here’s is a copy of the full source in case someone needs it: https://codepen.io/anon/pen/XYMNrY
Do you know where I’m missing it? or what I’m doing wrong in the last part?
Aside from that, thanks a lot for this wonderful blog, it’s really full of valuable information!
Thanks in advance for your help,
Kind regards;
Chris
Pd: If there’s anything else that you think it could be improve, or any kind of advice/recommendation is fully appreciated!
I think i finally solved it!
I used the same value for the lookup and for the limit in the mysql query, then i used numpy.dstack(informacion_xnew) to fix the array dimensions before making predictions!
I’m not sure if it’s the right way to do it tho!
Thanks!
Glad to hear it.
how can i use Auto Arima with Fourier Transformation in Python
Sorry, I don’t have examples of using Fourier transforms as a data preparation technique.
Hi, I am new to python and RNN. lets say i want to create a model that forecast time series data=[x1 x2 x3 y]. where x1-x3 are the features and y is the target. How do i implement it with this script, so that the code will know my features and target?
Thanks in advance.
I recommend starting with classical time series methods first, then ml, then only try deep learning if it can lift skill over those methods.
Hi Jason,
Thank you for this excellent tutorial. Could you please help me in the below question I asked in stackoverflow. I couldnt figure out how to test LSTM model built on new set of values.
https://stackoverflow.com/questions/50901731/how-to-test-on-new-values-in-lstm-in-python
Perhaps you could summarize it for me?
Thank you for your response. So here is my question. I have a total data points of about 1446 which is my training set which has 13 variables excluding date. So I have trained the LSTM model with the time step of 7 and got low loss also. Now I wanted to test the model on new values which doesnt have ground truth value. Given the date, the model should predict all 13 variables for 349 records. I couldnt able to proceed further on this, since the dataset is scaled and used for training and in testing, values are null as we know. Hence I couldnt proceed further on this. Let me know if you need further more details.
Thank you
This post shows how to make a prediction with an LSTM:
https://machinelearningmastery.com/make-predictions-long-short-term-memory-models-keras/
Hi Jason,
The link is for the ground truth we already know right ? We have a proper format of data. I have just the code like below, but I am getting some prediction errors.
Test = Stock_AREIT[len(Stock_AREIT)-60:]
Test=Test[‘1. open’]
inputs=Test.values
inputs = inputs.reshape(-1,1)
# Scale inputs but not actual test values
inputs = sc.transform(inputs)
for test in range(0,449):
inputs=np.append(inputs,predicted_stock_price)
inputs=inputs.reshape(-1,1)
print(inputs.shape)
X_test=[]
for i in range(60, 61):
X_test.append(inputs[test:i+test,0])
# make list to array
X_test = np.array(X_test)
X_test = np.reshape(X_test,(X_test.shape[0], X_test.shape[1],1))
predicted_stock_price = regressor.predict(X_test)
inputs=np.delete(inputs,len(inputs)-1,axis=0)
inputs=np.append(inputs,predicted_stock_price)
inputs=inputs.reshape(-1,1)
print(“currently running {}”.format(test))
The graph result for the code and actual is provided in the link below
https://stackoverflow.com/questions/50939347/forecasting-new-value-using-lstm-python
Could you please advice me where I am going wrong. I can sense that, LSTM uses the ground truth prediction to predict the next value. That is the result I have appended the result everytime.
Thank you in advance
I have advice on how to improve the performance of a model here:
https://machinelearningmastery.com/improve-deep-learning-performance/
I think I figured out. The actual graph (figure 1) actually uses the proper ground truth which makes it more accurate in prediction. Whereas my result actually using predicted values in its time step. I think my understanding is correct. But let me know your inputs as well
Hi Jason,
Thanks for the article. I’m looking at this line of code:
model.add(LSTM(4, input_shape=(1, look_back)))
The Keras documentation says input_shape=(timesteps, data_dim)
In your example, isn’t the look_back equal to the timesteps, and 1 is the data_dim (you have a single value)? So that would mean they are reversed from what you’ve got.
Yes, here we are using time steps as features.
For a better approach see this post:
https://machinelearningmastery.com/time-series-forecasting-long-short-term-memory-network-python/
Dear Jason,
Thanks for providing this blog. I am new to this stuff, and I found your side very useful.
I am trying to predict a flow rate for a sensor. I used LSTM to predict the next value based on the past 10 readings. I got very similar training and testing rmse scores, training: 18.07505 and testing: 18.01321. However, the predictions are not too great:
https://photos.app.goo.gl/Ym3KJy5FDyVoYcUv9
(blue: original, orange: testing, green: validation)
I would like to use this model to detect faults (anomalies). I am not doing too great, any help how I could improve my prediction? I used MinMaxScaler for scaling. Do you think smoothing the signal prior to training might help?
Thank you for your help.
I have some suggestions here:
https://machinelearningmastery.com/machine-learning-performance-improvement-cheat-sheet/
And here:
https://machinelearningmastery.com/improve-deep-learning-performance/
This is a wonderful tutorial , I learnt a lot here ,
I running the same code with a different univariate dataset , i am getting an error,
at this line:
model.add(LSTM(neurons, batch_input_shape=(batch_size, X.shape[1], X.shape[2]), stateful=True))
it says:
TypeError: while_loop() got an unexpected keyword argument ‘maximum_iterations’
Perhaps try this tutorial instead:
https://machinelearningmastery.com/time-series-forecasting-long-short-term-memory-network-python/
I have encountered the same problem.
TypeError: while_loop() got an unexpected keyword argument ‘maximum_iterations’
Can you help me solve it?
Consider using this tutorial instead:
https://machinelearningmastery.com/time-series-forecasting-long-short-term-memory-network-python/
I’m new to Keras ,sorry if i’m asking silly doubts.why look_back is needed if already timesteps is assigned with value 1
We need to prepare the sequence data as a supervised learning problem, see this post:
https://machinelearningmastery.com/convert-time-series-supervised-learning-problem-python/
hey i am workin on a dataset and i want to predict budget for 7 periods that are not presents on my dataset. i want to predict 7 next period how could i modelise this on code ? could you please help me it’s for a school project i need an immediate answer. could you please help me?
I would recommend an ARIMA model, you can get started here:
https://machinelearningmastery.com/start-here/#timeseries
Hi, thank you for this great code examples! When I try to run in python with the airport dataset, some of them produce the following error:
ValueError: Found array with 0 feature(s) (shape=(143, 0)) while a minimum of 1
is required by MinMaxScaler.
Is this just because the date column is not being taken into account?
I have some help here:
https://machinelearningmastery.com/faq/single-faq/why-does-the-code-in-the-tutorial-not-work-for-me
Hi
As far as I can understand from the code we are using 1 day look back to predict tomorrows price. Can we use used the price of last 100 days to predict say 20 days into the future?
Sure.
How can we do that? Which part of the code we have to alter?
This post will help you to prepare the data with multiple lag inputs:
https://machinelearningmastery.com/convert-time-series-supervised-learning-problem-python/
I have made the relevant updates. It seems to be working. Now I want to make a NEW prediction 20 days from today based on the current model. How do I do that?
Nice to hear.
More on making predictions here:
https://machinelearningmastery.com/make-predictions-long-short-term-memory-models-keras/
More on making multi-step predictions here:
https://machinelearningmastery.com/multi-step-time-series-forecasting-long-short-term-memory-networks-python/
Hi, I have a doubt. Considering the dataset used in the post, we have only time stamp (index) and target. In the link you suggested
” More on making predictions here:
https://machinelearningmastery.com/make-predictions-long-short-term-memory-models-keras/ ”
mode.predict(x) is used. So what should I use for x ?
x is the input part of one sample.
If your model expects n time steps with f features then the sample will have the shape [1, n, f]
Hi, Jason Brownlee. Thank you for your awesome posting 🙂
I’m writing to leave my opinion.
I noticed that the dataset imported is normalized first and then split into trainX, testX.
But the order is wrong in my knowledge. the “testX” is now already affected by trainX in the “normalizing step”
Because testX is normalized even considering trainX dataset range too by normalizing the whole dataset. (testX is not independent of trainX anymore. Can’t be used to “test”.)
Please, leave me a comment 🙂 I’m not an expert. So, I hope to hear your opinion on this.
Ideally, we would fit the normalization on the training set then apply to train and test sets.
I simplified the process for the tutorial.
Hi Jason,
I have this problem with your code: Each time I run the Keras, I get different result.
I looked here
https://github.com/keras-team/keras/issues/2743
here
https://keras.io/getting-started/faq/#how-can-i-obtain-reproducible-results-using-keras-during-development
and here
https://blog.csdn.net/qq_33039859/article/details/75452813.
How do i fix this problem of reproducability ?
From the methods above, which is better to be used ?
This is by design, see this post:
https://machinelearningmastery.com/randomness-in-machine-learning/
You can fix the random seed, I don’t recommend it, but I show how here:
https://machinelearningmastery.com/reproducible-results-neural-networks-keras/
Hi Jason, can you have a look at this post and answer the questions?
https://stackoverflow.com/questions/51904845/define-multiple-different-lstm-in-keras-or-tensorflow
Thanks.
Perhaps you can summarize it for me Andy?
Hello Jason,
This is a great article . Here I’m also using neural network to predict the values with time period (t+1). But I’m getting error while I’m using time period as X. Error is showing that could not convert string to float (time) . But I want to predict my values with that time. Can you give me suggestions to solve this problem? Here I posted my dataset for your reference.
Time g p c y
0:06:15 141 NaN NaN 141
0:08:00 NaN 10 NaN 117
0:09:00 NaN 15 NaN 103
0:09:25 95 NaN NaN 95
0:09:30 NaN NaN 50 93
0:11:00 149 NaN NaN 149
Perhaps remove the time and impute or mask the missing values?
Hi Jason,
Hope you well recently, I have a question which is when I am dealing with the time series traffic data set, should the features of time series (like 2017-11-10 02:00:00) be trained by Lstm model with other features?
Many thanks,
Shuai
Sure, what is the problem exactly?
Actually, I want to use lstm to analyze the data of traffic flow, and the time series is like 2017-11-10 02:00:00, which has hours, since the traffic flow on different hours and different weekday is not same, I am wondering whether the time step is 24 (24 hours a day), and whether I should input the information of month and weekday into lstm together with the information of traffic flow.
Perhaps try a few different framings of the problem in order to discover what works best for your specific data?
Yeah, thanks Jason
Hi Jason,
It’s quite comprehensive tutorial. My question is time is not being used in this time series analysis if I’mm not wrong. How shall predict values of future time steps?Because you’ve predicted using the test data which is part of original data set. Please help
Thanks,
Rakesh
You can train a final model on all training data, then use the model to make a prediction with model.predict()
More information here:
https://machinelearningmastery.com/make-predictions-long-short-term-memory-models-keras/
Hi Jason,
Thanks for your reply. My point is in Time series analysis to forecast future event we’ll have only time. In your tutorial you have built the model & evaluated with the entire data itself by splitting into train & test, but to use the this model for forecasting future event we’ll have only time not data like testX that you have used.What shall I do in that scenario?
Please help.
Regards,
Rakesh
A time series forecasting model is still a machine learning model with inputs and outputs. Define the model such that you have inputs required to predict the output you require.
Perhaps I don’t understand your question?
Currently we have a model that has a loss curve https://photos.app.goo.gl/9PNTiTkavTmeFoBT7
Is this considered a good model? Hope my adjustments to the parameters are right.
Learning curves look good.
A good model is defined by comparing its performance to a naive model:
https://machinelearningmastery.com/faq/single-faq/how-to-know-if-a-model-has-good-performance
Due to the “strong” continuity of the data source signal how does the LSTM model compare to an overly simple baseline model that just repeats the last value in the predict method’s input argument?
Often simpler methods outperform an LSTM.
An LSTM works a lot better if a CNN or other better/learned representation of the time series is used on the front-end, e.g. a CNN-LSTM or ConvLSTM. Often a CNN alone will out-perform an LSTM or LSTM hybrids.
Also for univariate time series, classical methods like SARIMA and ETS dominate.
Hi Jason, can you help me to get the percentage error? I got the RMSE but % of error is better too. Thanks!
What do you mean by percentage error exactly? MAPE?
If so, see this:
https://stats.stackexchange.com/questions/58391/mean-absolute-percentage-error-mape-in-scikit-learn
ive seen one of your comment, MAPE cannot be used to measure regression right?
No, MAPE is a metric for time series.
Hello Jason,
When I look into your preparation of data, it seems you left one piece of data, which is the last line of dataset in training set and testing set 🙂
Is it supposed to be:
for i in range(len(dataset)-look_back)
instead of:
for i in range(len(dataset)-look_back-1)
# convert an array of values into a dataset matrix
def create_dataset(dataset, look_back=1):
dataX, dataY = [], []
for i in range(len(dataset)-look_back):
a = dataset[i:(i+look_back), 0]
dataX.append(a)
dataY.append(dataset[i + look_back, 0])
return numpy.array(dataX), numpy.array(dataY)
What a waste! Those two lines data in training set and testing set are not participating in neither training or testing!
Or is there any deliberate reason to do it?
Hi Jason,
I change your code slightly, which takes the last piece of data samples in training set and testing set into consideration, as follows:
def create_dataset(dataset, look_back):
dataX, dataY = [], []
for i in range(len(dataset) – look_back):
a = dataset[i:(i + look_back), 0]
dataX.append(a)
dataY.append(dataset[i + look_back, 0])
return numpy.array(dataX), numpy.array(dataY)
Correspondingly, the shift test predictions for plotting needs a little change as well:
testPredictPlot[len(trainPredict) + (look_back * 2) – 1:len(dataset) – 1, :] = testPredict
Hopefully I am right.
What should I do? If I simply want to put the future value into a dataframe. How to get the next 10 days or for a month of value.
Perhaps this tutorial will help:
https://machinelearningmastery.com/multi-step-time-series-forecasting-long-short-term-memory-networks-python/
Hi Dr.Jonson
I have a confusion between block and neurons in LSTM structure
I am very clear the nodes (or units) in each layer in ANN. In LSTM, let me know my explaintation is right or wrong:
Every time xt is fed to hidden layer that contains many nodes (or units). Each node is 4 neurons (not a single neuron like ANN): in, out, forget, cell. All nodes are contained in a block, and those are copied to many blocks through time. That means the number of blocks depend on timestep size and it is generated through input sequence.
In Keras, you have
model.add(LSTM(4, input_shape=(look_back, 1)))
4 is the number of nodes in a block as I know, or the number of blocks (or neurons) as you mention above
Help me clear this confusion. Thank you a lot
Seems about right. Forget blocks, we have layers of lstm nodes. It simplifies everything.
this model has 1 input node for input layer, 4 lstm nodes for hidden layer and one output node for output layer. isnt it? correct me if im wrong, im in confusion too. Anyway thanks for the tutorial!
Yes 1/4/1
Way too small. Try this tutorial instead:
https://machinelearningmastery.com/time-series-forecasting-long-short-term-memory-network-python/
I thank you for your explanation !!
after having built and evaluated the model, how can one visualize the value of t + 1, where this value is the first value predicted after the last value of the database (considered t)
thanks
You can make the predictions and then use matplotlib to plot them as a line plot compared to true values.
may I know why do you use lstm (4)? is it any rules to choose the number of lstm?
No, trial and error.
Dear Jason
I have been trying to use keras on R, and I have a problem that I see here on your post too: Your prediction looks like a shifted version of the initial data on all your graphs.
Which is a quite bad prediction, a kind of last observation carried forward prediction (it will stay almost the same in the future).
Why do you say it is a good prediction ? What I am not understanding ?
It is poor, about as good as a persistence forecast.
Here is a much better example:
https://machinelearningmastery.com/how-to-develop-lstm-models-for-multi-step-time-series-forecasting-of-household-power-consumption/
Hello,
How we can use KerasRegressor or AdaBoostRegressor with LSTM ?
In what way exactly? In an ensemble?
Hello
How can we save our LSTM model and make prediction from the data test .
I think it should be the same:
# new instances where we do not know the answer
Xnew, _ = make_blobs(n_samples=3, centers=2, n_features=2, random_state=1)
Xnew = scalar.transform(Xnew)
# make a prediction
ynew = model.predict_proba(Xnew)
Can you help me find the right instructions, compatible with the code :
# make predictions
trainPredict = model.predict(trainX)
testPredict = model.predict(testX)
# invert predictions
trainPredict = scaler.inverse_transform(trainPredict)
trainY = scaler.inverse_transform([trainY])
testPredict = scaler.inverse_transform(testPredict)
testY = scaler.inverse_transform([testY])
to predict values after the test.
Thanks.
You must save the model and the objects used for performing the transform/inverse transform.
Can you please tell us Jason sir, How to save the model and objects for performing the transform/inverse transform.
Thanks in Advance.
You could pickle the transform objects or you could save the coefficients within the transform objects directly.
Hi,
Can you please tell me how to train all the data, instead of creating a train and a test set. I want to consider the whole of my data set as a train set and then predict the values for next 30 or 40 values.
Sure, simply provide your entire dataset as the training dataset.
Hi Jason,
Thanks for the prompt reply!
Being a novice in python, i am getting confused on how to write the predict portion for the next 30 days, after training the data for the whole year.
Can you please provide me with some sample code for that
I have a post that explains how to make a prediction here:
https://machinelearningmastery.com/make-predictions-long-short-term-memory-models-keras/
Hi Jason,
When I tried to change the batch_size from 1 to 8 ( both in forecast_lstm() and fit_lstm() ), I got the following error:
ValueError: could not broadcast input array from shape (8,1) into shape (1,1)
on this line: yhat = model.predict(X, batch_size=batch_size)
I think maybe I should change the shape of X here (in the forecast_lstm() ):
X = X.reshape(1, 1, len(X))
can you please let me know, How should I change the batch_size?
This is an outdated tutorial. I recommend using the code from here:
https://machinelearningmastery.com/how-to-develop-deep-learning-models-for-univariate-time-series-forecasting/
Dear Dr. Brownlee,
I want to ask that is it better to use a lagged version of your dataset and train LSTM or (use some padding in case the time series is not divisible by the batch size ) use a batch size for training LSTM?
Perhaps try both and see if it makes a difference on your problem.
HI Jason,
Thanks for the blog.
I used your blog to save and then predict future values on the time series.
The problem is that, my series is uni-variate, i.e. just the temperature and I have been using fpp library in R to predict future intervals, where i just had to specify a parameter h= 30 , for example the model would compute future 30 values.
I used your info from the blog and prepared the following script
from keras.models import load_model
train = dataset[0:train_size, :]
t = 30
# load model from single file
model2 = load_model(‘lstm_model.h5’)
# make predictions
yhat = model2.predict(t, verbose=0)
print(yhat)
But I am getting a ndim error.
Can you please help me out on how to predict future values.
Thanks
Perhaps ensure that the input data has a 3d structure:
https://machinelearningmastery.com/reshape-input-data-long-short-term-memory-networks-keras/
Hi Jason,
what approach is to be taken to predict for the next 30 intervals or 10 intervals in this given code?
Please can you write the code.
I am getting stuck. Help appreciated.
I cannot write the code for you.
Hi Jason,
The confusion still remains on predicting 30 future interval. Your link https://machinelearningmastery.com/make-predictions-long-short-term-memory-models-keras/
is calling the predict function on input X, which just computes the next value.
How to use the model and then compute the value for next 30 intervals, i.e. the model should treat prediction 1 as an input for prediction 2, prediction 2 as an input for prediction 3.
Please help me, I am unable to get a solution and ain’t clear about the approach.
If you can give me the code snippet for this kind of prediction, that would be great.
You can use a model that makes one step predictions recursively.
Or you can design a model to make 30-day forecasts.
I have tutorials on both approaches. Perhaps start here:
https://machinelearningmastery.com/start-here/#deep_learning_time_series
does your book Deep Learning for Time Series Forecasting covers my problem??
If yes then I will buy it for my reference.
Thanks
The book shows how to develop multi-step forecasting from scratch and for example problems.
For the given example shown above, how would you predict the next 30 day interval.
Can you please illustrate through an example in python code.
Thanks
This post shows how to develop a multi-step LSTM forecasting model from scratch:
https://machinelearningmastery.com/how-to-develop-lstm-models-for-time-series-forecasting/
Hi Jason,
Thanks for the great article!
In your program, the input X is a one-dimensional vector, which is denoteded as 1*8. And in the model, input_shape=(train_X.shape[1], train_X.shape[2]), here the train_X.shape[2] represents 8 input characteristics. But what should i do when the input X is a two-dimensional vector? For example, sometimes we may want to organise these 8 imput features in a matrix of 2 rows and 4 columns. I hope you can help me.
Thank you for your careful guidance.Best wishes!
ZhaoMing
Perhaps use a ConvLSTM as input?
Thank you very much! I will try this method. By the way, do you have a case recommendation for this model?
What is a “case recommendation” for a model?
have you done prediction of next 30 days??
if yes..!!
please help me…
I have many examples of multi-step forecasting, you can start here for a general approach:
https://machinelearningmastery.com/how-to-develop-lstm-models-for-time-series-forecasting/
Hi Jason, This is an excellent article. I am learning deep learning through coursera and your examples makes learning more easy. I have a question regarding this example. In this example, you perform one-step prediction: in each step, you use the current value to predict the next value, update the model using actual expected value and then predict the next value and so on… Now, how do i modify your code to perform prediction without using the actual test value? i.e. I should use the predicted value as an input to update the model and predict the next value and so on.
Great question, I have a suite of more recent tutorials here:
https://machinelearningmastery.com/start-here/#deep_learning_time_series
Hi Jason, I have a doubt about how you make the normalization. You run MinMaxScaler on the whole dataset first before dividing the data into train and test. This will introduce information leak to the test data since you are not supposed to know the min or max of the test data before hand. A correct way should be fit the scaler with train data only, and later do something like test = scaler.transform(test).
Anyway, this is a good tutorial
Yes, I did this for brevity. Ideally you would fit the transform on a training set and apply it to both train and test sets.
Hi Jason, I think this not good article even for beginners. I was beginner when I first read your this article and I believe mimic which is “prediction accuracy is good”.
There is LSTM Prediction is : Input: x[i], Output: x[i+1], Prediction: x[i]. There isn’t prediction. Example:
Input Output Prediction
1 2 1
2 3 2
3 4 3
…
n n+1 n
This article took my 3 months. I don’t recommend for beginners.
Agreed, this is a much better post:
https://machinelearningmastery.com/how-to-develop-lstm-models-for-time-series-forecasting/
Hey Jason, I am a big fan of your works and very nicely written articles. Cant say how much your contents have helped me in solving my ML related problems. In this lecture, I am confused with one thing –
1. LSTM takes inputs as [samples, time-steps, features]. In first part, you took this trainX.shape[0], 1, trainX.shape[1]. Here I am completely with you. Samples and features are intuitively understood as number of rows and number of columns. And time-step is 1 if we will have timeseries data at regular fixed interval.
2. However in third part, you reversed it and used this as trainX.shape[0], trainX.shape[1], 1.
I totally did not understand this part. How come time-steps is now the number of columns and number of features is now 1? Can you please explain intuitively this part to me once again?
Thanks and Regards
Abhik
You can choose to use the lag observations as features or time steps. I recommend using them as time steps only (third part).
Hello Jason,
Thanks for this tutorial.
I’m working on eye tracking dataset. This is a time series data such that coordinates of the screen a viewer is looking at are being recorded per millisecond. I want to predict viewer engagement which is a label 0 (Not engaged), 1 (engaged).
My dataset consists of thousands of steps (eye tracking records) for 40 viewers and I intend to train this dataset with LSTM networks using a fully connected layer and sigmoid activation to predict my class.
I’m getting 75% test accuracy but everyone I meet insists that my number of samples are too small to use deep learning. They advice I use other machine learning methods.
What do you think about this?
You can develop deep learning methods for small datasets, although you must make heavy use of regularization.
You can get started with regularization methods here:
https://machinelearningmastery.com/introduction-to-regularization-to-reduce-overfitting-and-improve-generalization-error/
sir,I have a problem.The problem is that forecasted outputs appear to be lagged by one time step when compared to the true outputs.
This is a common question that I answer here:
https://machinelearningmastery.com/faq/single-faq/why-is-my-forecasted-time-series-right-behind-the-actual-time-series
Thanks jason for this tutorial, i am working on reactive motion planning of mobile robot in dynamic environment, by observing the some steps of moving obstacle, i have to predict it next steps, suppose the obstacle is moving from A to B and their can be 50 trajectory, obstacles will follow one trajectory, i want to train the LSTM with trajectories of obstacle. According to your tutorial, i can train the one LSTM with only one trajectory. But read the research paper (https://ieeexplore.ieee.org/document/6566154), researcher train the single LSTM with more than one trajectory , please guide on this topic, it will be really helpful for my further research.
Thanks
Perhaps contact the authors of the paper and ask about their approach?
Hi Jason,
Can we apply LSTM for prediction of unevenly spaced time series ?
Yes, but it may assume the inputs are evenly spaced. You could also try using a zero padding between the intervals to achieve the same effect.
Hi Jason,
I really appreciate your work. I am trying to apply what I have learnt with your tutoriols on my machine learning problem.
I have drying rate data of 10 experiments that is how drying rate is changing over time. In each experiment I have known values of 6 other features such as Temp, pressure, velocity etc. The values of these features are fixed throughout the experiment, however, each experiment has different values of these features. I have combined all the experiments together in one file, like, the first column which represnets the time in the data has value form 1 to 120mins then again 1 to 120 mins (in this way 10 times) .
Should I be using multivariate time series forcasting in this case or should I take time as just one feature like temp, pressure? and is LSTM the suitable approach for such kind of problem?
My best advice is to brainstorm many different framings of the problem, prototype each and see what shows potential. This might help:
https://machinelearningmastery.com/how-to-define-your-machine-learning-problem/
Also, I don’t recommend pre-supposing a solution/algorithm, instead, I recommend testing a suite of methods (starting with simple linear methods) and discover what works/what is skillful. This might help:
https://machinelearningmastery.com/how-to-develop-a-skilful-time-series-forecasting-model/
Hi Jason. I have a question about the way model works.
I am confused between two methods. Which is correct?
1) The model uses no information of future (no actual value) and just use its own predictions for the next prediction of one prediction.
2) The model predicts a point for the next step and calculate the error, but forget about the prediction and uses the realization of that point (the actual value) for steps after that.
I thought the first way is right. For example, when I input data of 2001~2017, then I get predicted data of 2018.
Please answer which statement is right. Thanks!
You can use either approach for your own problem.
The latter approach is used to evaluate model performance, called walk-forward validation:
https://machinelearningmastery.com/backtest-machine-learning-models-time-series-forecasting/
I guess statement 1) is evaluation part, and statement 2) is validation part.
1. So for models’ validation use 2) method, and then for chosen model’s evaluation use method 1).
Did I understand right?
2. This code just have validation part but doesn’t have evaluation part.
Is it right?
I want to know these two questions are right. Thanks Jason!
I recommend not using the above tutorial as a starting point, instead start here:
https://machinelearningmastery.com/start-here/#deep_learning_time_series
Hi Jason,
That for this excellent blog,
I there any indicator, or an easy way to know if the time series is too random to predict?
How would you identify if the problem is the design, or unsolvable.
Another question,
How would you treat “spikes”
for example your output series looks like
0 0 0 0 0 0 1000 0 0 0 -1000 0
the optimizer will probably prefer to miss the 1000 prediction for the overall error reduction.
But it is the 1000 that you actually interested in predicting?
Yes, this is a good start:
https://machinelearningmastery.com/gentle-introduction-random-walk-times-series-forecasting-python/
Perhaps the spikes are anomalies and can be removed or smoothed over?
Hello,
I have a csv file contains sequences of n-grams like this: 121 235 658, 5 6 78, 965 2 4, ….
How can I use it in a neural network model?
Thank you
Thes is what I did:
———————————————————————————————-
# returns a dictionary of n-grams frequency for any list
def ngrams_freq(listname, n):
counts = dict()
# make n-grams as string iteratively
grams = [‘ ‘.join(listname[i:i+n]) for i in range(len(listname)-n)]
for gram in grams:
if gram not in counts:
counts[gram] = 1
else:
counts[gram] += 1
return counts
# returns the values of features for any list
def feature_freq(listname,n):
counts = dict()
# make n-grams as string iteratively
grams = [‘ ‘.join(listname[i:i+n]) for i in range(len(listname)-n)]
for gram in grams:
counts[gram] = 0
for gram in grams:
if gram in features:
counts[gram] += 1
return counts
# values of n for finding n-grams
n_values = [3]
# Base address for attack data files
add = “ADFA-LD/ADFA-LD/Attack_Data_Master/”
# list of attacks
attack = [‘Adduser’,’Hydra_FTP’,’Hydra_SSH’,’Java_Meterpreter’,’Meterpreter’,’Web_Shell’]
# initializing dictionary for n-grams from all files
traindict = {}
print(” Training data from Normal”)
Normal_list = []
in_address = “ADFA-LD/ADFA-LD/Training_Data_Master/”
k = 1
read_files = glob.glob(in_address+”/*.txt”)
for f in read_files:
with open(f, “r”) as infile:
globals()[‘Normal%s_list_array’ % str(k)] = infile.read().split()
Normal_list.extend(globals()[‘Normal%s_list_array’ % str(k)])
k += 1
#print(Normal_list)
# number of lists for distinct files
Normal_list_size = k-1
# combined list of all files
listname = Normal_list
# finding n-grams and extracting top 30%
for n in n_values:
print(” Extracting top 30% “+str(n)+”-grams from Normal……………………”)
dictname = ngrams_freq(listname,n)
#print(dictname)
# Creating feature list
features = []
#features.append(‘Label’)
for k,v in dictname.items():
features.append(k)
print(“\n Features created by taking top 30% frequent n-grams for all types……….\n”)
#print (features) #this contains sequences only
# Writing training data to file, this file contains sequences of 3-grams
print(“\nWriting Training data in training file…………………………….\n”)
with open(‘train1.csv’,’w’) as csvfile:
# writing features as header
writer = csv.DictWriter(csvfile, fieldnames = features, extrasaction=’ignore’)
writer.writeheader();
———————————————————————————————-
So my file train1.csv will contains only the sequences, if I want to do a sequence prediction model using this dataset , how will I do? knowing that I tried the code above as it is, I get trainx and test-x with a shape equals to 0.
Thank you
Sorry, I don’t understand what you’re input is. Perhaps start here:
https://machinelearningmastery.com/start-here/#nlp
Hi Jason,
Any chance this method or any known method of LSTM can be applied to extracting geometric shapes or identifying features? It could be either in 2D(slices) or 3D.
Perhaps try it and see?
Thanks json..
how can i predict for next few days ??
This is called multi-step forecasting and there are many examples here:
https://machinelearningmastery.com/start-here/#deep_learning_time_series
Thanks Jason for the effort and awesomeness you put in this website.
In many cases of training an LSTM for regression problems , i ran into the following problem:
the prediction result is always one value, in many cases, the mean. have you ever encountered such a problem? I appreciate any ideas?
Yes, it suggests that the chosen model/learning config has not learned the problem.
Hi Jason,
If I am using a trained LSTM to predict time-series data on the same input multiple times within a code, is it possible to get the same output every time?
If I use model.predict on an input 10 times (back-to-back), I get different answers every time. I am not sure if this is just the nature of LSTMs and how they run information through the state.
Thank you, I am a big fan of your blogs!
The same input should give the same output for a given model, if state is reset after each usage.
It is possible that each time you fit the model that you get different predictions with the same input. This is to be expected, more here:
https://machinelearningmastery.com/faq/single-faq/why-do-i-get-different-results-each-time-i-run-the-code
I did notice that the results were the same if I reset the state each time. Each time I predicted with the same input without resetting the state, it changes slightly, but gets more accurate each time. Thank you for your response!
Interesting.
Hi Jason,
I would have an overall question to the prediction of testX and trainX ( trainPredict = model.predict(trainX)). If I choose a batch-size different to 1 and want to print it with matplotlib it does just print one batch and not the whole series. I can’t really find a solution to that problem.
Thanks for answering.
Elisabeth
I’m not sure I follow, sorry.
Perhaps this tutorial will help:
https://machinelearningmastery.com/make-predictions-long-short-term-memory-models-keras/
Hai Jason,
I want to ask about each loss of epoch, does it mean RMSE value from model or not.
Best Regards
Derni
and i want to ask if it does not mean the RMSE value, which way that i can get the RMSE value from it
You can calculate the RMSE from the MSE by taking the square root.
Often MSE, not RMSE is used as the loss for regression problems.
You can learn more about loss functions here:
https://machinelearningmastery.com/how-to-choose-loss-functions-when-training-deep-learning-neural-networks/
Thank you for your reply, you just save my thesis. cheers..
Glad to hear that, good luck with your project!
hello,
I want to ask again, what is the ideal loss value form time series prediction, in this section, you get 0.0020 loss value, is that good or not ?
Good is relative, e.g. relative to a naive model.
More here:
https://machinelearningmastery.com/faq/single-faq/how-to-know-if-a-model-has-good-performance
The best loss will be 0.0, and might not be tractable/feasible.
Hi Jason,
Thanks for your articles on time series forecasting using LSTM. I am currently reading this topic with regards to my job and have come across with another similar article in this link:
https://www.kaggle.com/niyamatalmass/machine-learning-for-time-series-analysis/comments
I would like to ask what is the rationale in inverting the differenced value? Also, I didn’t really get the part on inversed scaling on forecasted values. Any help explaining would be much appreciated. Thanks!
Good question, this may help:
https://machinelearningmastery.com/machine-learning-data-transforms-for-time-series-forecasting/
and i search about good value of RMSE, but some source told me according your dependent variable and the other told me it is < 0.3. is that right or not?
It is problem and model specific and should be compared to a naive model to determine if the model is skillful.
Hi Jason,
I read your article, its very helpful.
You have used one column and convert that one single column of data into two columns of dataset like:
def create_dataset(dataset, look_back=1):
dataX, dataY = [], []
for i in range(len(dataset)-look_back-1):
a = dataset[i:(i+look_back), 0]
dataX.append(a)
dataY.append(dataset[i + look_back, 0])
return numpy.array(dataX), numpy.array(dataY)
I have dataset containing two columns and i want to use both columns one as dataX (column 0) and the other as dataY(column 1),mean column 0 is an input and column 1 is output of my data. I want to predict output based on input.
How i edit your code for this problem?
Thanks
Perhaps this will help:
https://machinelearningmastery.com/faq/single-faq/what-is-the-difference-between-samples-timesteps-and-features-for-lstm-input
How can i detect anomalies from data using LSTM?
Perhaps frame it as a time series classification problem.
You can get started here:
https://machinelearningmastery.com/start-here/#deep_learning_time_series
hai jason,
I want to ask again, as you mentioned before “We can see that the model has an average error of about 23 passengers (in thousands) on the training dataset, and about 52 passengers (in thousands) on the test dataset. Not that bad.”
How do you say it is in thousands?
It is the units of the variable we are predicting, according to the definition of the dataset.
why the RMSE value are high both train and test dataset ? i try to predict consumption energy from electronic device using LSTM too, but i got the RMSE value about 100. can i say my prediction have an average error about 100 watt in thousands too ?
It depends on the specific data and the specific model configuration.
would you like to explain me with your data ? i don’t get it. Thank you, FYI
I have 23141 sample of watts, with minimum value = 14 watt and the highest one is 1700 watt
Hi Jason,
Thank you for the nice posts.
I have a big database around 500 000 data.
My goal is to predict in the long term (IE about a thousand data)
I ran an LSTM on a GPU. The execution seems very long (days) and it gave me big errors (on train and test) besides the predicted values are inconsistent with the historical data and those desired. The same thing for a decoder encoder.
I tried, on the other hand, to forecast with backprpagation (MLP). This gave me an acceptable results in terms of errors and predictions.
How can you explain these results?
Perhaps the LSTM was a bad fit for your data?
Perhaps the LSTM needs tuning for your problem?
Perhaps your data needs to be scaled first?
…
Hi Jason, how should we give unseen data to this model, for example, we have data from 1949-01 to 1960-12, i want to predict for 1961-01. How should we do that. Please describe.
Great question, I answer it here:
https://machinelearningmastery.com/make-predictions-long-short-term-memory-models-keras/
I have gone through this blog earlier but my question is how to prepare sequence of unseen data for 30 days. Kindly share an unseen data i.e; X values which should be pass to model for better understand.
Sorry, I cannot write custom code for you.
I believe there are many examples on the blog that you can use a starting point and adapt for your use case.
Hi Jason,
This tutorial is so helpful to a newbie like me. Thank you. But I have a question: I still don’t understand what are the differences if we use “reshape(trainX, (trainX.shape[0], trainX.shape[1], 1))” and “reshape(trainX, (trainX.shape[0], 1, trainX.shape[1]))” to feed into our LSTM, please?
Perhaps this will help:
https://machinelearningmastery.com/index-slice-reshape-numpy-arrays-machine-learning-python/
This tutorial is so helpful to me. I have a question. If the prediction is a multidimensional array, it should be done, such as 3X3 or more latitudes like the one below.thanks.
[10 15 25 [20 25 45 [X1 X2 X3
20 25 45 30 35 65 X4 X5 X6
30 35 65],40 45 85] ,… , X7 X8 X9]
Perhaps this post will make things clearer:
https://machinelearningmastery.com/how-to-develop-lstm-models-for-time-series-forecasting/
Hi Jason.
Thanks for this tutorial.
As a machine learning scientist, which RNN network is best for Time Series Prediction?
What’s your idea about using Elman network?
Thanks
I recommend testing a suite of methods for your specific problem in order to discover what works best for your dataset.
Try this framework:
https://machinelearningmastery.com/how-to-develop-a-skilful-time-series-forecasting-model/
I was reading about the LSTM architecture and found that there is something called a hidden state that is used in LSTM. How can we set the number of hidden states used by LSTM? Is it the same as the lookback in this tutorial? Thank you.
I show how here:
https://machinelearningmastery.com/return-sequences-and-return-states-for-lstms-in-keras/
Hello, I’m beginner of machine learning and deep learning.
First of all, Thank you for this great information about LSTM.
I have a few questions about LSTM results.
I expect that predictive value is equal to actual data.
But the predictive value was one space behind the actual value.
(in your graph)
So I’m confused about LSTM results.
Could you explain about this results?
Thank you 🙂
Yes, your model has learned a persistence model:
https://machinelearningmastery.com/faq/single-faq/why-is-my-forecasted-time-series-right-behind-the-actual-time-series
Hi jason, thanks for the article.
But iam working on a lstm timeseries prediction problem in which i want to predict my variable for the next 10 days.I have to do it in such a way that the prediction for the first day will be used for the prediction of the second day and so on for next ten days.(Almost like a loop which inputs the output of previous step as input of upcoming step)
Is there a built in feature in keras which can be used for this?
No, you will have to create the input samples manually.
I am using LSTM for interpolatory time series prediction. I have time series data from 3 values of that parameter. I would like to predict for the parameter whose value is between these three values. How shall I include this parameter in my training data? Shall I include this as the feature? If I use this parameter as the feature, the values of the parameter will remain constant for that time series. Will this affect learning? Are there any other ways to include the parameter rather than as the feature?
Thank you.
Perhaps evaluate a few different framings of the problem and see what works/works best?
Are there any guidelines on how to frame the problem for parametric study? Thank you.
What do you mean exactly?
thank you for your great article. I used the code and now I have a problem.
after normalizing using MinMax scaler. as I want to invert the prediction to real data. the output of inverse_transform have different range in values.
what should I do.
you can see the image of actual and prediction data: https://ibb.co/9WCLgDn
Perhaps try scaling and inverting real values to confirm the transform is working correctly.
If it is, perhaps your model is predicting small values?
ValueError Traceback (most recent call last)
in ()
—-> 1 X_train_pred_lstm = model.predict(X)
/home/ubuntu/applications/remoteDisk/softwares/anaconda3/lib/python3.6/site-packages/keras/engine/training.py in predict(self, x, batch_size, verbose, steps)
1155 ‘divided by the batch size. Found: ‘ +
1156 str(x[0].shape[0]) + ‘ samples. ‘
-> 1157 ‘Batch size: ‘ + str(batch_size) + ‘.’)
1158
1159 # Prepare inputs, delegate logic to
predict_loop.ValueError: In a stateful network, you should only pass inputs with a number of samples that can be divided by the batch size. Found: 2552 samples. Batch size: 32.
i did create a stateful lstm and iam getting this error.
below i have given my code for model fit where i have clearly mentioned my batch_size as 1 . Still why am i getting this error
model = Sequential()
batch_size=1
model.add(LSTM(15,batch_input_shape=(batch_size,14, n_features),activation=’tanh’, kernel_initializer=’lecun_uniform’, return_sequences=False, stateful=True))
model.add(Dense(1))
model.compile(loss=’mean_squared_error’, optimizer=’adam’)
reduce_lr=ReduceLROnPlateau(monitor=’loss’, factor=0.1, patience=10, verbose=0, mode=’auto’, min_delta=0.0001, cooldown=0, min_lr=0)
early_stop = EarlyStopping(monitor=’loss’, patience=2, verbose=1)
# fit model
for i in range(2):
model.fit(X, y,epochs=1, batch_size=1, verbose=1, shuffle=False, callbacks=[reduce_lr,early_stop])
model.reset_states()
The error suggests you must change the dataset to match your batch size or change the batch size to match (to be divisible by) your dataset.
Hi Jason,
would it make sense to you, to use LSTM RNNs to predict weather (wind speed) given “standard” Numerical Weather Prediction data and historical wind measurements of a location? The goal is to increase the accuracy of a NWP model for a specific location. Is this something that seems feasible based on your experience ?
I’d encourage you to test a site of model types and model configurations to discover what works best for your specific dataset.
Try this framework:
https://machinelearningmastery.com/how-to-develop-a-skilful-time-series-forecasting-model/
thank you for what you have done , but i have a question about <>,about the function create_dataset, why dimensions reduced by 2 (len(dataset)-look_back-1) not just 1 ((len(dataset)-look_back)), is there anything import need pay attention to, or both right ?
Perhaps start with this post:
https://machinelearningmastery.com/how-to-develop-lstm-models-for-time-series-forecasting/
Sir, Can you explain how the scaling function works?
Yes, I explain more here:
https://machinelearningmastery.com/how-to-scale-data-for-long-short-term-memory-networks-in-python/
Jason,
Thank you for the tutorial. You have covered multivariate problem here, https://machinelearningmastery.com/multivariate-time-series-forecasting-lstms-keras/ . However, you have used reshape as (.shape[0], n_hours, n_features). In the example in this tutorial, you frame the problem as (.shape[0], .shape[1], 1). If we would take this approach and apply to the multivariate problem (similar to the one that is in the link above), is framing the problem as (.shape[0], n_hours, n_features) a correct approach?
Thank you.
There are many ways to frame a time series problem as a sequence prediction problem.
There is no such thing as “correct”, just different approaches.
I recommend exploring different framings and see what works best for your specific dataset.
Upon training the LSTM model exactly as in the example of airline-passengers dataset given above I have seen a considerable decrease n in loss. However, the accuracy metric does not increase and remains constant from epoch 1. Can you please explain why this is happening and if this is derogatory in any way?
We cannot measure accuracy for a regression problem, instead we measure error, such as mean squared error.
Can you please tell how to select the number of units in the LSTM layer i.e. the first argument of keras LSTM()?
Yes, I recommend testing a suite of different values to see what works best for your problem, more here:
https://machinelearningmastery.com/faq/single-faq/how-many-layers-and-nodes-do-i-need-in-my-neural-network
Hello Jason,
Thankyou very much for these wonderful examples that you bring to those that are just getting started in this ML world.
I just have a question about this example (i’m sorry if im going over something you have already discussed). I wanted to make a very basic prediction with a price data set WITHOUt scalling the data, but my prediction is a straight line… Could you help me understand where the error could be?
Please, find attached below the code I’ve used.
Thank you very much in advance!!
Monica
import numpy as np
import math as m
import matplotlib.pyplot as plt
import pandas as pd
from keras.models import Sequential
from keras.layers import Dense
from keras.layers import LSTM
from sklearn.preprocessing import MinMaxScaler
from sklearn.metrics import mean_squared_error
# convert an array of values into a dataset matrix
def create_dataset(dataset, look_back):
dataX, dataY = [], []
for i in range(len(dataset) – look_back – 1):
a = dataset[i:(i + look_back), 0]
dataX.append(a)
dataY.append(dataset[i + look_back, 0])
return np.array(dataX), np.array(dataY)
data= pd.read_csv(“Equity_080619_v3.csv”, sep= “;”, index_col=0)
print(data.head())
dataPOpen=data[[“PX_1”]]
# Conversion a dataframe para plotear
df = pd.DataFrame(data= dataPOpen)
df.info()
df.plot()
plt.show()
#me quedo solo con los valores de dataframe
dataf= dataPOpen.values
#dataf=dataPOpen
print(dataf)
########################################
######### TRAIN & TEST SUBSETS #########
########################################
train_size = int(len(dataf) * 0.7)
test_size = len(dataf) – train_size
train, test = dataf[0:train_size,:], dataf[train_size:len(dataf),:]
print(len(train), len(test))
# reshape into X=t and Y=t+1
look_back = 1
trainX, trainY = create_dataset(train, look_back)
testX, testY = create_dataset(test, look_back)
print(trainX)
print(trainY)
# reshape input to be [samples, time steps, features]
trainX = np.reshape(trainX, (trainX.shape[0], 1, trainX.shape[1]))
testX = np.reshape(testX, (testX.shape[0], 1, testX.shape[1]))
# create and fit the LSTM network
model = Sequential()
model.add(LSTM(4, input_shape=(1, look_back)))
model.add(Dense(1))
model.compile(loss=’mean_squared_error’, optimizer=’adam’)
model.fit(trainX, trainY, epochs=50, batch_size=1, verbose=2)
# make predictions
trainPredict = model.predict(trainX)
testPredict = model.predict(testX)
# shift train predictions for plotting
trainPredictPlot = np.empty_like(dataf)
trainPredictPlot[:, :] = np.nan
trainPredictPlot[look_back:len(trainPredict) + look_back, :] = trainPredict
# shift test predictions for plotting
testPredictPlot = np.empty_like(dataf)
testPredictPlot[:, :] = np.nan
testPredictPlot[len(trainPredict) + (look_back * 2) + 1:len(dataf) – 1, :] = testPredict
#plot baseline and predictions
#plt.plot(dataf)
plt.plot(trainPredictPlot)
plt.plot(testPredictPlot)
plt.show()
You may need to tune the model for your problem, or perhaps test a suite of different models and configurations.
This might help as a start:
https://machinelearningmastery.com/how-to-develop-a-skilful-time-series-forecasting-model/
I am using a LSTM model to make air pollution index prediction. I am taking a time step of 12 hours and predicting the 13th hour pollution level. Can you please tell me how a look ahead bias may arise in this time-series prediction and what are the remedies?
What I am doing is after prediction at a time ‘t’ in future I am appending that to the dataset so that I can use it for prediction of ‘t+1’ step. However, the prediction becomes stagnant after some time which is not what I want obviously. I am already using a prior sequence of 12 hours to predict the 13th hour and also tried with 24 and 48 time steps to include some more randomness in the sequences but it still seems to stagnate at some constant prediction. How can I resolve this issue any suggestions?
Perhaps try some alternate models/configs/framings?
Yes, perhaps start with this tutorial:
https://machinelearningmastery.com/how-to-develop-lstm-models-for-time-series-forecasting/
CAN WE USE LSTM FOR CLASSIFICATION PROBLEMS
Yes, I have an example here:
https://machinelearningmastery.com/how-to-develop-rnn-models-for-human-activity-recognition-time-series-classification/
Excuse me for my question which seems far from the objective of your course.
In fact, I wanted to write a python program with 2 subprograms “LSTM”.
Each sub-program is a code like what is described in “Time Series Prediction with LSTM Recurrent Neural Networks in Python with Keras” of the current course,
so that it’s two sub-programs runs as parallel functions.
I am trying to find out how to run parallel fit model, that’s each fit is a different LSTM parameters.
Thank you
Not sure I follow, do you mean using threads? why not run the models sequentially?
I need to use a parallel execution for time optimusation.. yes it’s a threads fit
Keras/TensorFlow already use multiple threads. Parallel execution requires multiple machines.
can you lead me to an example, please.
thank you
Sorry, I don’t have an example of parallizing across multiple machines.
Your create_dataset function is wrong. The range specified should be len(dataset) – look_back rather than len(dataset) – look_back – 1. Thanks for the wonderful tutorials though.
I am doing my thesis on cryptocurrency price forecasting specially on bitcoin price prediction
using deep learning models through time series forecasting . I face big challenge on implementation how can I use the LSTM time series prediction ?
This is a common question that I answer here:
https://machinelearningmastery.com/faq/single-faq/can-you-help-me-with-machine-learning-for-finance-or-the-stock-market
Hi Jason, I’m following your tutorials and found them very very useful.
In fact, with the code in your tutorials I’m having a good foundation for playing around with different ML algorithms.
But I’m stuck at some problem definition.
Can you please look at this stackoverflow question and answer/suggest some architecture, or how to proceed for this problem.
Basically the task is to build a RNN model based architecture for detection of malware using multiple API call sequences.
Thanks for taking time to read this comment. Waiting for suggestions.
I’m sorry for forgetting to add the so link
https://stackoverflow.com/questions/57070509/model-suggestion-for-detection-of-malware-based-on-multiple-api-call-sequences
here it is.
Thanks
Perhaps you can summarize the problem that you’re having briefly?
I’m trying to build a RNN (LSTM) model for classification of binary as benign/malware. The data structure I’ve presently looks as follows
{
“binary1”: {
“label”: 1,
“sequences”: [
[“api1″,”api2″,”api3”, …],
[“api1″,”api2″,”api3”, …],
[“api1″,”api2″,”api3”, …],
[“api1″,”api2″,”api3”, …],
…
]
},
“binary2”: {
“label”: 0,
“sequences”: [
[“api1″,”api2″,”api3”, …],
[“api1″,”api2″,”api3”, …],
[“api1″,”api2″,”api3”, …],
[“api1″,”api2″,”api3”, …],
…
]
},
…
}
Here each binary have variable number of sequences, and each sequence have variable number of API calls. I can pad the data so that all binaries will have equal number of sequences and each sequence also have equal number of API calls. But my question is how can I use this data for training?
The problem is that, all the sequences of the malicious binary may not be malicious sequences. So, if I use the label and indicate the model that all those sequences are malicious and if some of the sequences are similar in benign files also, the benign binary may be treated as malware.
To better understand the problem, treat each binary file as a person on twitter, and each API call sequences as a words in a tweet. A user may tweet so many tweets, but a few of them may be about sports (for eg). And in my training data I know which persons tweets about sports, but I don’t know which tweets are about sports. So, what I’m trying to do is classifying those persons whether they like sports or not based on all the tweets of the person.
In the same way, I know whether the binary is malicious or not, but I don’t know which API call sequences are responsible for maliciousness. And I want the model to identify those sequences from the training data. Is it possible? And what architecture should I use?
What I’m trying now is that, first each sequence is converted into a seq_score using LSTM model, and now multiple sequences will become an array of seq_score. Then I’m connecting this array to a Dense layer.
But I’m not sure, if it is a correct way. Can you suggest some architecture to deal with this?
Yes, this is what a model will learn.
I recommend testing a suite of model architectures in order to discover what works best.
I think an embedding front end followed by a stacked LSTM would do very well.
Also try embedding followed by a 1D CNN.
Did you just preprocess the whole data set (including the test set) before splitting it up?
I thought you emphasize that fitting should only be done on the train set, transform should be done on both train and test set
Yes, to simplify the example. In practice prepare the data prep on the training set, and apply to the test/val set.
Am working on link prediction method using LSTM and GRU to map the input sequence to
a fixed-sized vector, i built it using Learning Automta Enironment. and its gives me some error, i need your help,
this is working perfect but to implement the LSTM and GRU its gives error
def RandomEnviromentForActive(x_train, x_test,y_train):
#随机选择出一个分类器
Index = np.random.randint(1, 3)
#print(Index)
global IndexName
#选择使用SVC分类器
if Index == 1:
IndexName = ‘分类器是:SVC’
svc_model = svm.SVC(kernel=’rbf’, C= 1)
svc_model.fit(x_train, y_train)
pred_svc = svc_model.predict(x_test)
pred = pred_svc[0]
elif Index == 2:
IndexName = ‘分类器是:MPL分类器’
mpl_model = MLPClassifier(solver=’adam’, learning_rate=’constant’, learning_rate_init=0.01,max_iter = 500,alpha =0.01)
mpl_model.fit(x_train, y_train)
pred_mpl = mpl_model.predict(x_test)
pred = pred_mpl[0]
elif Index == 2:
IndexName = ‘分类器是:决策树’
estimator = DecisionTreeClassifier(max_leaf_nodes=3, random_state=0)
estimator.fit(x_train, y_train)
pred_dt = estimator.predict(x_test)
pred = pred_dt[0]
return pred
This is a common question that I answer here:
https://machinelearningmastery.com/faq/single-faq/can-you-read-review-or-debug-my-code
Thanks a lot for your wonderful insight into the beautiful world deep learning for predicting time series.
I am currently doing an M. Sc. project in which I intend to use Hidden Markov Model in hybridisation model with RNN (LSTM) to predict stock prices in the financial sector. The HMM is to be used to extract the necessary stock features before feeding the data into an RNN (LSTM) for prediction or generalisation
Could you kindly help me find a way around this hybridization.
Thank you
That sounds like a fun project.
Sorry, I don’t have any experience combining these two methods, I cannot give you good advice off the cuff.
Good luck with your project.
A wonderful tutorial, as always. I have a separate question as an aside – if I have a set of time dependent features (say X(t)) and I use a neural network to estimate another set of features Z(t) which I subsequently use as the RHS of a system of differential equation of f(X(t)), then after I numerically solve the differential equation and plot f vs t, how can I draw the 95% confidence interval to the solution?
This is challenging for neural nets.
I give some links to papers in this post:
https://machinelearningmastery.com/prediction-intervals-for-machine-learning/
Hi Jason.
I have a question regarding the time series prediction.
As we make the time series supervised from unsupervised so as to predict the test set.
But in test set we give all the points from the inputs to predict the output.
So, My question is if we want to predict the output without providing all the input in the test set can it be possible? like predicting the future results by just providing the initial value and the historical data.
Thank you
You must frame the problem then train the model in the way that you intend to use the model.
If you want to predict multiple steps with very little input, then prepare the data and fit the model on that data.
I hope that helps.
Hi Jason,
I got your point but how to train a model in a way that we can use that model? is there any link which I can refer to?
Regarding the prediction: to predict the data with very little input is there any example on which you have worked until now?
Yes, you can train the model, save the model, load it and start making predictions.
If you are having trouble saving, see this post:
https://machinelearningmastery.com/save-load-keras-deep-learning-models/
If you are having trouble making predictions, see this post:
https://machinelearningmastery.com/make-predictions-long-short-term-memory-models-keras/
And this:
https://machinelearningmastery.com/how-to-make-classification-and-regression-predictions-for-deep-learning-models-in-keras/
Hi Jason,
Thank you so much for this really helpful tutorial.
I am trying to imply this LSTM in sequence to sequence learning rather predicting the sequence in future. Let me explain it a little, suppose i have a 30 set of sequence of length 1000 (earthquake ground motion signature) and corresponding 30 set of sequence of response which is also length of 1000. I am training this input data with the output response data and making the network, then predicting the response sequence of of length 1000 given a unknown ground motion sequence.
Now my question is; is it necessary to supply the same length of x_train(ground motion sequence) and and y_train (response) for training purpose in building the net.
I want to predict the maximum or minimum value from that response sequence instead of training and predicting the whole sequence.
So is it possible to make x_train(30X1000X1) and (30X1X1){i.e. instead of 1000 make it 1}
Here I am attaching the code I have working with so far.
X_train_in_mat = scipy.io.loadmat(‘x_train.mat’)
Y_train_in_mat = scipy.io.loadmat(‘y_train.mat’)
input_matrix = []
output_matrix = []
for i in range(30):
input_matrix.append(X_train_in_mat[‘x_train’][i][0].T)
output_matrix.append(Y_train_in_mat[‘y_train’][i][0].T)
input_matrix = np.array(input_matrix)
output_matrix = np.array(output_matrix)
model = Sequential()
model.add(LSTM(50, input_shape=(1000,6),
return_sequences = True))
model.add(LSTM(50, return_sequences = True))
model.add(LSTM(50, return_sequences = True))
model.add(Dense(1))
model.compile(loss=’mean_squared_error’, optimizer=’adam’)
model.summary()
hist = model.fit(input_matrix, output_matrix, epochs=1000, batch_size=100, verbose=2)
plt.figure(figsize=(12,6))
plt.plot(hist.history[‘loss’], label=’train’)
plt.legend()
plt.show()
The model must be designed then trained in the manner in which you intend to use it to make predictions.
I hope that helps.
Great Lecture. I have to build an LSTM model for time series data, where I have to predict wind speed. My data is taken every 10 minutes and im using datasets from 2013 to 2014. I want to predict 6 hours in future, using say for example 5 days of observations hence I have to create a window containing the last 5 days observation to train the model.
How would I create the window of 5 days observation (720(5×144)) without having to use : t-2,t-1,t?
Thanks!
I recommend following this process:
https://machinelearningmastery.com/how-to-develop-a-skilful-time-series-forecasting-model/
The tutorials here will be a helpful first step:
https://machinelearningmastery.com/start-here/#deep_learning_time_series
sir,
Thats a great Lecture…how can we do this using tensorflow…
Thanks.
Yes, I don’t see why not. Although Keras running on top of tensorflow is significantly easier to use.
Hi Jason,
Yet again another great article. I have a question in regards to model.predict. Let’s say we have the airplane-passenger model trained and ready to go. How do we structure our input data to .predict future dates in our time series rather than our test/train data? Thanks.
The structure of the input will be one or more samples with the number of time steps and features that you have defined as expected by the model.
Perhaps this will help:
https://machinelearningmastery.com/make-predictions-long-short-term-memory-models-keras/
hi…
I am having the problem in my graph as of yours. If you look at the peak of the modeled output they are at t+1 step. can you explain to me the reason why is it that??
I am not bothered about the accuracy or anything. whatever value of prediction that I get should be at the same point on which my observation value is their.
Thankyou.
Perhaps this will help:
https://machinelearningmastery.com/faq/single-faq/why-is-my-forecasted-time-series-right-behind-the-actual-time-series
please provide me some approach of rectifying this. The book that I have purchased from is also not having any solution to this kind of problem.
I recommend testing a suite of different models for your problem in order to discover what works best.
I believe the tutorials here will give you some ideas:
https://machinelearningmastery.com/start-here/#deep_learning_time_series
please stick to my question. In my predicted result, it seems that it is of time step t+1 instead of time t which is also clearly seen in your graph. Can you give some explanation to that.
It suggests the model may not effective on this problem.
This is why I go on to provide more detailed examples here:
https://machinelearningmastery.com/start-here/#deep_learning_time_series
Nevertheless, it is a demonstrate for how to develop this type of model in the general case.
Does that help?
I already have you book. please solve my query.
hai Jason, is it avalaible this type of forecasting using GRU (gated recurrent unit). Could you please create the same tutorial but using GRU. Thank you????
You can adapt any of the examples to use GRU instead of LSTMs.
Thank you for writing this article. It helped me a lot to learn deep learning.
However, I don’t know if the LSTM model in this article is working properly.
The problem found in the graph seems to be that the predicted value converges with the value at the previous point in time. Did you know the problem? Than what’s the cause of the problem?
Agree, the model needs to be tuned to the problem, perhaps start with these examples:
https://machinelearningmastery.com/how-to-develop-lstm-models-for-time-series-forecasting/
Thank you for the great article. Your posts help me a lot with my thesis. 🙂
However I have some difficulties with LSTM forecast. Somehow my prediction is shifted by one comparing to the test values. If I shift them with one it alligns quite well with the test_y values, but I do not understand why is it shifted even compared to the test which is already shifted by one.
This is a common question that I answer here:
https://machinelearningmastery.com/faq/single-faq/why-is-my-forecasted-time-series-right-behind-the-actual-time-series
Hi Jason,
Thank you for this valuable tutorial. I see a one-period time shift in the forecasts you obtained. Is this normal in forecasting experiments? I also study on a hybrid artificial neural network algorithm and there is one-period time shift in the forecasts like in yours. Do you have any suggestions about this problem if it is really a problem? Thanks again.
No, it suggests a poor model:
https://machinelearningmastery.com/faq/single-faq/why-is-my-forecasted-time-series-right-behind-the-actual-time-series
Thank for your prompt reply 🙂
How do i predict the next 100 values? How do i prepare the dataset and send to the model?
You would prepare your data to have some number of inputs, and 100 outputs, then train the model.
Perhaps this will help:
https://machinelearningmastery.com/faq/single-faq/what-is-the-difference-between-samples-timesteps-and-features-for-lstm-input
By the way, Great article. I am a novice to Machine learning and this is one article in the internet , among all LSTM, where i really understood.
Thanks, I’m happy that it helped!
I’m using (LSTM) to predict Energy consumption in short term , I finshed it but when it comes to masure the accuracy for the model I got a lot of problem I tried many codes some of them get an error and the others give me a (0.00 accuracy ) , and I do not know what is the problem , this is my code if you have any solution , thank you so much
sorry this is the code
import numpy as np
import matplotlib.pyplot as plt
import pandas as pd
from pandas import datetime
import math, time
import itertools
from sklearn import preprocessing
import datetime
from operator import itemgetter
from sklearn.metrics import mean_squared_error
from math import sqrt
from keras.models import Sequential
from keras.layers.core import Dense, Dropout, Activation from keras.layers.recurrent import LSTM
def get_data():
dataset = pd.read_csv(‘datasetAmalSaturday22.csv’) df = pd.DataFrame(dataset) df.drop(df.columns[[4]], axis=1, inplace=True)
return df
df = get_data()
df.tail()
df[‘Y’] = df[‘Y’] /10000 df[‘M’] = df[‘M’] /10000 df[‘D’] = df[‘D’] /10000 df[‘Temp’] = df[‘Temp’] /10000 df[‘WD’] = df[‘WD’] / 10000 df[‘EC’] = df[‘EC’] / 10000 df.head(5)
def load_data(DEC, seq_len):
amount_of_features = len(DEC.columns)
data = DEC.as_matrix() #pd.DataFrame(stock) sequence_length = seq_len + 1
result = []
for index in range(len(data) – sequence_length):
result.append(data[index: index + sequence_length])
result = np.array(result)
row = round(0.9 * result.shape[0]) train = result[:int(row), :] x_train = train[:, :-1]
y_train = train[:, -1][:,-1]
x_test = result[int(row):, :-1] y_test = result[int(row):, -1][:,-1]
x_train = np.reshape(x_train, (x_train.shape[0], x_train.shape[1], amount_of_fe x_test = np.reshape(x_test, (x_test.shape[0], x_test.shape[1], amount_of_featur
return [x_train, y_train, x_test, y_test]
def build_model(layers): model = Sequential()
model.add(LSTM( input_dim=layers[0], output_dim=layers[1], return_sequences=True))
model.add(Dropout(0.2))
model.add(LSTM(
layers[2],
return_sequences=False)) model.add(Dropout(0.2))
model.add(Dense( output_dim=layers[2]))
model.add(Activation(“linear”))
start = time.time()
model.compile(loss=”mse”, optimizer=”rmsprop”,metrics=[‘accuracy’]) print(“Compilation Time : “, time.time() – start)
return model
def build_model2(layers): d = 0.2
model = Sequential()
model.add(LSTM(128, input_shape=(layers[1], layers[0]), return_sequences=True)) model.add(Dropout(d))
model.add(LSTM(64, input_shape=(layers[1], layers[0]), return_sequences=False)) model.add(Dropout(d))
model.add(Dense(16,init=’uniform’,activation=’relu’)) model.add(Dense(1,init=’uniform’,activation=’relu’)) model.compile(loss=’mse’,optimizer=’adam’,metrics=[‘accuracy’])
return model
window = 5
X_train, y_train, X_test, y_test = load_data(df[::-1], window) print(“X_train”, X_train.shape)
print(“y_train”, y_train.shape)
print(“X_test”, X_test.shape)
print(“y_test”, y_test.shape)
model = build_model2([6,window,1])
model.fit(
X_train,
y_train,
batch_size=512, nb_epoch=500, validation_split=0.1, verbose=0)
trainScore = model.evaluate(X_train, y_train, verbose=0)
print(‘Train Score: %.2f MSE (%.2f RMSE)’ % (trainScore[0], math.sqrt(trainScore[0]
testScore = model.evaluate(X_test, y_test, verbose=0)
print(‘Test Score: %.2f MSE (%.2f RMSE)’ % (testScore[0], math.sqrt(testScore[0])))
diff=[]
ratio=[]
p = model.predict(X_test) for u in range(len(y_test)):
pr = p[u][0] ratio.append((y_test[u]/pr)-1) diff.append(abs(y_test[u]- pr))
import matplotlib.pyplot as plt2
plt2.plot(p,color=’red’, label=’prediction’) plt2.plot(y_test,color=’blue’, label=’y_test’) plt2.legend(loc=’upper left’)
plt2.show()
df1= pd.DataFrame({‘Actual’: y_test.flatten()*10000, ‘Predicted’: p.flatten()*1000
df1
from sklearn import metrics
print(‘Mean Absolute Error:’, metrics.mean_absolute_error(y_test, p))
print(‘Mean Squared Error:’, metrics.mean_squared_error(y_test, p))
print(‘Root Mean Squared Error:’, np.sqrt(metrics.mean_squared_error(y_test, p)))
correct , total = 0 , 0
correct += (p == y_test).sum() total = len(y_test)
accuracy = 100 * correct / total print(‘Accuracy =%.2f’ % accuracy)
You cannot calculate accuracy for regression:
https://machinelearningmastery.com/faq/single-faq/how-do-i-calculate-accuracy-for-regression
so when we calculate the error for regression.
using MSE or MAE that’s the end !!!!
Correct. or RMSE or whatever score best captures your requirements.
hello , how can I use Cross Validation on this code ??
import numpy as np
import matplotlib.pyplot as plt
import pandas as pd
from pandas import datetime
import math, time
import itertools
from sklearn import preprocessing
import datetime
from operator import itemgetter
from sklearn.metrics import mean_squared_error
from math import sqrt
from keras.models import Sequential
from keras.layers.core import Dense, Dropout, Activation from keras.layers.recurrent import LSTM
def get_data():
dataset = pd.read_csv(‘datasetAmalSaturday22.csv’) df = pd.DataFrame(dataset) df.drop(df.columns[[4]], axis=1, inplace=True)
return df
df = get_data()
df.tail()
df[‘Y’] = df[‘Y’] /10000 df[‘M’] = df[‘M’] /10000 df[‘D’] = df[‘D’] /10000 df[‘Temp’] = df[‘Temp’] /10000 df[‘WD’] = df[‘WD’] / 10000 df[‘EC’] = df[‘EC’] / 10000 df.head(5)
def load_data(DEC, seq_len):
amount_of_features = len(DEC.columns)
data = DEC.as_matrix() #pd.DataFrame(stock) sequence_length = seq_len + 1
result = []
for index in range(len(data) – sequence_length):
result.append(data[index: index + sequence_length])
result = np.array(result)
row = round(0.9 * result.shape[0]) train = result[:int(row), :] x_train = train[:, :-1]
y_train = train[:, -1][:,-1]
x_test = result[int(row):, :-1] y_test = result[int(row):, -1][:,-1]
x_train = np.reshape(x_train, (x_train.shape[0], x_train.shape[1], amount_of_fe x_test = np.reshape(x_test, (x_test.shape[0], x_test.shape[1], amount_of_featur
return [x_train, y_train, x_test, y_test]
def build_model(layers): model = Sequential()
model.add(LSTM( input_dim=layers[0], output_dim=layers[1], return_sequences=True))
model.add(Dropout(0.2))
model.add(LSTM(
layers[2],
return_sequences=False)) model.add(Dropout(0.2))
model.add(Dense( output_dim=layers[2]))
model.add(Activation(“linear”))
start = time.time()
model.compile(loss=”mse”, optimizer=”rmsprop”,metrics=[‘accuracy’]) print(“Compilation Time : “, time.time() – start)
return model
def build_model2(layers): d = 0.2
model = Sequential()
model.add(LSTM(128, input_shape=(layers[1], layers[0]), return_sequences=True)) model.add(Dropout(d))
model.add(LSTM(64, input_shape=(layers[1], layers[0]), return_sequences=False)) model.add(Dropout(d))
model.add(Dense(16,init=’uniform’,activation=’relu’)) model.add(Dense(1,init=’uniform’,activation=’relu’)) model.compile(loss=’mse’,optimizer=’adam’,metrics=[‘accuracy’])
return model
window = 5
X_train, y_train, X_test, y_test = load_data(df[::-1], window) print(“X_train”, X_train.shape)
print(“y_train”, y_train.shape)
print(“X_test”, X_test.shape)
print(“y_test”, y_test.shape)
model = build_model2([6,window,1])
model.fit(
X_train,
y_train,
batch_size=512, nb_epoch=500, validation_split=0.1, verbose=0)
trainScore = model.evaluate(X_train, y_train, verbose=0)
print(‘Train Score: %.2f MSE (%.2f RMSE)’ % (trainScore[0], math.sqrt(trainScore[0]
testScore = model.evaluate(X_test, y_test, verbose=0)
print(‘Test Score: %.2f MSE (%.2f RMSE)’ % (testScore[0], math.sqrt(testScore[0])))
diff=[]
ratio=[]
p = model.predict(X_test) for u in range(len(y_test)):
pr = p[u][0] ratio.append((y_test[u]/pr)-1) diff.append(abs(y_test[u]- pr))
import matplotlib.pyplot as plt2
plt2.plot(p,color=’red’, label=’prediction’) plt2.plot(y_test,color=’blue’, label=’y_test’) plt2.legend(loc=’upper left’)
plt2.show()
df1= pd.DataFrame({‘Actual’: y_test.flatten()*10000, ‘Predicted’: p.flatten()*1000
df1
from sklearn import metrics
print(‘Mean Absolute Error:’, metrics.mean_absolute_error(y_test, p))
print(‘Mean Squared Error:’, metrics.mean_squared_error(y_test, p))
print(‘Root Mean Squared Error:’, np.sqrt(metrics.mean_squared_error(y_test, p)))
thanks 🙂
Cross validation is generally not appropriate for sequence prediction, in all of the examples we use walk-forward validation:
https://machinelearningmastery.com/backtest-machine-learning-models-time-series-forecasting/
At the end what the result of this validation , is it a accuracy number in (%) or just an error accuracy , ex : 0.0052 , because I still have problem with showing the accuracy as number with (%) , i’m using LSTM for prediction not classification , and all the solution I got for classification
thank you
Accuracy is invalid when predicting a numerical value.
Remove the accuracy metric and look at MSE error or similar.
if you can give me or direct me to the exact code that sutiable to my case that can show me the accuracy with % number
thank you again
Sure, see the many examples here:
https://machinelearningmastery.com/start-here/#deep_learning_time_series
hello
can you help me with the several ways to increase the accuracy of my model ?
thank you ..
Yes, right here:
https://machinelearningmastery.com/start-here/#better
Hi Jason
It is great case study. Just would like to know how can we decide lag (time step) ? every time lag 1 won’t give good accuracy
Test a range of different framings of the problem (lag sizes) and see what works best for your dataset.
Also accuracy is invalid for time series, you must measure forecast error.
Hi !
I have used your algorithm for predicting the number of users of a platform, however I would like to know how much data I can predict (5 min 10min …)?
Perhaps test different amounts of data and see what works best for your specific problem and model?
Hi again !
Thank you for your answer.
Yes I did, but still confused on how can I define how much data does the algorithm predict !
The input is defined by the input_shape argument on the model.
I copy and paste your code and your dataset, but it gives me the following error:
testX = numpy.reshape(testX, (testX.shape[0], 1, testX.shape[1]))
IndexError: tuple index out of range
Sorry to hear that, I recommend this tutorial instead:
https://machinelearningmastery.com/how-to-develop-lstm-models-for-time-series-forecasting/
Hi Jason,
Thank You for the great tutorial. I have one question about this prediction, how many steps do you predict? six months or ?
Hello Thank’s!
I have a question:
Why you reshape it like this
# reshape input to be [samples, time steps, features]
trainX = numpy.reshape(trainX, (trainX.shape[0], 1, trainX.shape[1]))
I think correct is:
trainX = numpy.reshape(trainX, (trainX.shape[0], trainX.shape[1], 1)),
because trainX.shape[1] – number of your timestamps, and 1 -is your unit (1 value)
Yes, you can use lag obs as timesteps or features, it is a design choice.
Hi Jason,
“Some sequence problems may have a varied number of time steps per sample. For example, you may have measurements of a physical machine leading up to a point of failure or a point of a surge. Each incident would be a sample of the observations that lead up to the event would be the time steps, and the variables observed would be the features.”
I have such a problem. I am carrying out an experiment, and I have data measurements of load applied at each time to a specimen for 1000 minutes, and the strength when it failed. The next specimen failed in 800 minutes, and another in 900 minutes. I have such data, where the input is the load sequences, and output is a strength. How do I build an LSTM model for it.
Also, if I need to predict the strength, for a load sequence at 500 minutes, how will it work
Probably zero pad sequences to the same length and use a masking input layer.
This will help:
https://machinelearningmastery.com/data-preparation-variable-length-input-sequences-sequence-prediction/
hi jason,
Whether LSTM architecture learn its required features on its own,(OR) should we mention to learn specific column featuresIn the dataset….I have big doubt on That..
Try multiple approaches and discover what works best for your data.
Jason,
Thank you for the great tutorial. I have one question about create_dataset and look_back. I created a dataset example.
Numbers = 1:100
x = pandas.DataFrame(range(1,101))
train = x.values
look_bank = 3
Is trainX and trainY correct?
trainX
array([[ 1, 2, 3],
[ 2, 3, 4],
[ 3, 4, 5],
[ 4, 5, 6],
[ 5, 6, 7],
[ 6, 7, 8],
[ 7, 8, 9],
[ 8, 9, 10],
[ 9, 10, 11],
[10, 11, 12],
[11, 12, 13],
[12, 13, 14],
[13, 14, 15],
[14, 15, 16],
[15, 16, 17],
[16, 17, 18],
[17, 18, 19],
[18, 19, 20],
[19, 20, 21],
[20, 21, 22],
[21, 22, 23],
[22, 23, 24],
[23, 24, 25],
[24, 25, 26],
[25, 26, 27],
[26, 27, 28],
[27, 28, 29],
[28, 29, 30],
[29, 30, 31],
[30, 31, 32],
[31, 32, 33],
[32, 33, 34],
[33, 34, 35],
[34, 35, 36],
[35, 36, 37],
[36, 37, 38],
[37, 38, 39],
[38, 39, 40],
[39, 40, 41],
[40, 41, 42],
[41, 42, 43],
[42, 43, 44],
[43, 44, 45],
[44, 45, 46],
[45, 46, 47],
[46, 47, 48],
[47, 48, 49],
[48, 49, 50],
[49, 50, 51],
[50, 51, 52],
[51, 52, 53],
[52, 53, 54],
[53, 54, 55],
[54, 55, 56],
[55, 56, 57],
[56, 57, 58],
[57, 58, 59],
[58, 59, 60],
[59, 60, 61],
[60, 61, 62],
[61, 62, 63],
[62, 63, 64],
[63, 64, 65],
[64, 65, 66],
[65, 66, 67],
[66, 67, 68],
[67, 68, 69],
[68, 69, 70],
[69, 70, 71],
[70, 71, 72],
[71, 72, 73],
[72, 73, 74],
[73, 74, 75],
[74, 75, 76],
[75, 76, 77],
[76, 77, 78],
[77, 78, 79],
[78, 79, 80],
[79, 80, 81],
[80, 81, 82],
[81, 82, 83],
[82, 83, 84],
[83, 84, 85],
[84, 85, 86],
[85, 86, 87],
[86, 87, 88],
[87, 88, 89],
[88, 89, 90],
[89, 90, 91],
[90, 91, 92],
[91, 92, 93],
[92, 93, 94],
[93, 94, 95],
[94, 95, 96],
[95, 96, 97],
[96, 97, 98]])
array([ 4, 5, 6, 7, 8, 9, 10, 11, 12, 13, 14, 15, 16, 17, 18, 19, 20,
21, 22, 23, 24, 25, 26, 27, 28, 29, 30, 31, 32, 33, 34, 35, 36, 37,
38, 39, 40, 41, 42, 43, 44, 45, 46, 47, 48, 49, 50, 51, 52, 53, 54,
55, 56, 57, 58, 59, 60, 61, 62, 63, 64, 65, 66, 67, 68, 69, 70, 71,
72, 73, 74, 75, 76, 77, 78, 79, 80, 81, 82, 83, 84, 85, 86, 87, 88,
89, 90, 91, 92, 93, 94, 95, 96, 97, 98, 99])
Or correct would be trainX and trainY
array([[ 1, 2, 3],
[ 2, 3, 4],
[ 3, 4, 5],
[ 4, 5, 6],
[ 5, 6, 7],
[ 6, 7, 8],
[ 7, 8, 9],
[ 8, 9, 10],
[ 9, 10, 11],
[10, 11, 12],
[11, 12, 13],
[12, 13, 14],
[13, 14, 15],
[14, 15, 16],
[15, 16, 17],
[16, 17, 18],
[17, 18, 19],
[18, 19, 20],
[19, 20, 21],
[20, 21, 22],
[21, 22, 23],
[22, 23, 24],
[23, 24, 25],
[24, 25, 26],
[25, 26, 27],
[26, 27, 28],
[27, 28, 29],
[28, 29, 30],
[29, 30, 31],
[30, 31, 32],
[31, 32, 33],
[32, 33, 34],
[33, 34, 35],
[34, 35, 36],
[35, 36, 37],
[36, 37, 38],
[37, 38, 39],
[38, 39, 40],
[39, 40, 41],
[40, 41, 42],
[41, 42, 43],
[42, 43, 44],
[43, 44, 45],
[44, 45, 46],
[45, 46, 47],
[46, 47, 48],
[47, 48, 49],
[48, 49, 50],
[49, 50, 51],
[50, 51, 52],
[51, 52, 53],
[52, 53, 54],
[53, 54, 55],
[54, 55, 56],
[55, 56, 57],
[56, 57, 58],
[57, 58, 59],
[58, 59, 60],
[59, 60, 61],
[60, 61, 62],
[61, 62, 63],
[62, 63, 64],
[63, 64, 65],
[64, 65, 66],
[65, 66, 67],
[66, 67, 68],
[67, 68, 69],
[68, 69, 70],
[69, 70, 71],
[70, 71, 72],
[71, 72, 73],
[72, 73, 74],
[73, 74, 75],
[74, 75, 76],
[75, 76, 77],
[76, 77, 78],
[77, 78, 79],
[78, 79, 80],
[79, 80, 81],
[80, 81, 82],
[81, 82, 83],
[82, 83, 84],
[83, 84, 85],
[84, 85, 86],
[85, 86, 87],
[86, 87, 88],
[87, 88, 89],
[88, 89, 90],
[89, 90, 91],
[90, 91, 92],
[91, 92, 93],
[92, 93, 94],
[93, 94, 95],
[94, 95, 96],
[95, 96, 97],
[96, 97, 98],
[97, 98, 99]]) #### Here
array([ 4, 5, 6, 7, 8, 9, 10, 11, 12, 13, 14, 15, 16, 17, 18, 19, 20,
21, 22, 23, 24, 25, 26, 27, 28, 29, 30, 31, 32, 33, 34, 35, 36, 37,
38, 39, 40, 41, 42, 43, 44, 45, 46, 47, 48, 49, 50, 51, 52, 53, 54,
55, 56, 57, 58, 59, 60, 61, 62, 63, 64, 65, 66, 67, 68, 69, 70, 71,
72, 73, 74, 75, 76, 77, 78, 79, 80, 81, 82, 83, 84, 85, 86, 87, 88,
89, 90, 91, 92, 93, 94, 95, 96, 97, 98, 99, 100]) #### Here
Thank you.
This tutorial will show you how:
https://machinelearningmastery.com/convert-time-series-supervised-learning-problem-python/
I do not undestaind. If I would want to predict the day of tomorow in sequence 1:10 and look back 3 day the correct matix is
X = array([[ 1, 2, 3],
[ 2, 3, 4],
[ 3, 4, 5],
[ 4, 5, 6],
[ 5, 6, 7],
[ 6, 7, 8],
[ 7, 8, 9]])
y =array([ 4, 5, 6, 7, 8, 9, 10])
Thank you?
Perhaps start with the simple examples here:
https://machinelearningmastery.com/how-to-develop-lstm-models-for-time-series-forecasting/
I implemented using LSTM. Just one question, shall we not split the data into train/ test before we do scaling on it? Is it not leaking info ? I got pretty good results but I am spicy. Then I split the dataset into train/test first and then the results are really poorly. And for multistep forecast it is even not converging.
Looking forward to your reply!
I recommend using walk-forward validation:
https://machinelearningmastery.com/backtest-machine-learning-models-time-series-forecasting/
How to covert Keras model in algorithm for real time implementation. How to I get the math model
You generally do not. You use the Keras API in production.
Saludos, gracias por la publicación, una consulta. Con que linea de código se predice los datos para los 5 meses siguientes ??
Thanks.
You can make a prediction by calling model.predict() and pass in one sample.
Perhaps this will help:
https://machinelearningmastery.com/how-to-make-classification-and-regression-predictions-for-deep-learning-models-in-keras/
I’m trying to measure the r^2 of the expected and predicted values.However there is an error when when I run it. how can you fix it
Perhaps post your code and error to stackoverflow.
May I check if you have any alternative dataset other than the link you provided?
When I copied this, it gave me an error:
dataset = pandas.read_csv(‘airline-passengers.csv’, usecols=[1], engine=’python’)
ParserError: ‘,’ expected after ‘ ” ‘
Sorry to hear that.
All dataset are available here:
https://github.com/jbrownlee/Datasets
Hi Jason,
Thanks for the simple and great explanation. I have always been so confused with many other explanations.
I am trying to learn and implement techniques such as Bayesian by Backprop – to include variational inference technique into LSTM for probability estimates. The problem statement I have is quite simple – given the failure time-series data for (say) 10 bearings, can I give a probabilistic estimate of a 11th bearing given the data for the first few time steps?
Does your book cover topics such as this? I am happy to pay a subscription to learn more in this regard.
Thanks
Not directly.
If you are predicting a category, you can predict the probabilistic outcome.
When predicting a numerical quantity, you might need to use an ensemble of models to predict multiple samples from which to construct a probability distribution.
Hi Jason,
Why do we have to put shuffle equal to False in LSTM for time series, as we convert time series to a regression one?
model.fit(trainX, trainY, epochs=1, batch_size=batch_size, verbose=2, shuffle=False)
We don’t have to, but it keeps all samples in an epoch/batch in the same order and allows state to be preserved across the batch in a meaningful way.
hi I have a question if I want to train my model with different times is it possible?
For example: giving 20 graph of same time and y then other 20 with different time and y.
will it be a probem?
Sorry, I don’t understand. Perhaps you can elaborate?
for example I have 10 files of data and all the 10 files has different time starting point and ending points but the Y axis is the same for all. So, will it be a problem to train such data?
I don’t think so.
So, can you give me an idea how should i train the model ?
Yes, see this:
https://machinelearningmastery.com/faq/single-faq/how-do-i-prepare-my-data-for-an-lstm
And this:
https://machinelearningmastery.com/faq/single-faq/what-is-the-difference-between-samples-timesteps-and-features-for-lstm-input
I was wondering if given *arbitrary timeseries*, is it always
feasibleto design design an ANN which performs better than ARIMA?For univariate time series, probably not.
When using inverse transform, I got this error. (ValueError: Found array with dim 3. Estimator expected <= 2.) So, I changed dimension (40,1,42) to (40,42). But, the values of inverse transform is not same with original input values. So, why is it?
Yes, the number of columns must be identical between transform and inverse transform.
Hi do you have any example for how to use reinforcement learning in Time series prediction?
Not yet.
Hi,
Thank you so much for your reply.
if I want to make the model learn in real time after the training. How should we do that? and Can I also fix some parameters while training the model?
Can you provide me any link for this or any guidance to a tutorial?
Thank you so much.
You can collect data and update the model dynamically.
You will need to evaluate different model update schedules to see what works best for your specific model and dataset.
Hi Dr. Brownlee,
I currently have a data that contains the 48 hours temperatures of 1000 patients. Nurses and automated thermometers check temperature every hour within 48 hours period. However, there are more than half of temperatures checked by nurses are missing. Do you think making 1000 patients into 1000 features is a good idea? If yes, could you please tell me why this is a good idea? I appreciate your answer.
Sincerely,
Zhiyuan
I forgot to mention, this is a missing data imputation problem.
It might be interesting to fit a model that learns across patients – e.g. patients are “samples”.
HI Jason
thank you for a such a informative post.
i was going through the code on making a prediction on the stock market.
however, I am getting the feeling that the code is not forecasting but in fact going back a day and getting the answer, isn’t it?
even on the graph the test and train prediction lines are a day later than the data.
how would you able to predict the day ahead?
i have read all the other post that you suggested to look at for forecasting but not finding the right code for it.
it will be great if you could help me on that.
many thanks
Generally, security prices are not predictable, you have learned a persistence model – which is the best we can do:
https://machinelearningmastery.com/faq/single-faq/why-is-my-forecasted-time-series-right-behind-the-actual-time-series
Sir,did you fixed that bug in displaying the future predictions in the plot
Sir I have dataset with 75 dates .I mean months.
train = 50 and test = 25
I want to make trainX = 51 and testX = 26 to predict the future value.
how can I do that
Can you help me with that sir?
Perhaps start here:
https://machinelearningmastery.com/how-to-develop-lstm-models-for-time-series-forecasting/
What bug?
That to predict the next month passengers
above code is not predicting the next month passengers.
how can i fix that?
Call model.predict() to make a prediction.
More help here:
https://machinelearningmastery.com/make-predictions-long-short-term-memory-models-keras/
thank you sir
You’re welcome.
Jason,
Thank you for the code and explanation.
I am still not sure how I can get the prediction, the next value.
In order to use the model.predict(X) I have to insert a value X. When I did (I insert the last number so i can get the prediction) it gave me an error msg: ‘ ‘float’ object has no attribute ‘ndim’
Your help is appreciated.
Thank you
Ofer
The LSTM expects one (or more) sample as input, the sample must be a 3d array, with [1, timesteps, features]
To make the code run with tensorflow version 2.0.0, I had to replace “from keras.x import X” with:
from tensorflow.keras.models import Sequential
from tensorflow.keras.layers import Dense
from tensorflow.keras.layers import LSTM
This works because Keras has become a part of the core TensorFlow API.
Hope this helps somebody!
The code is designed for standalone Keras 2.3 on TensorFlow 2.
You have changed it to use tf.keras – a diffrent API.
Hello,
I had run the code on standalone Keras 2.3 on TensorFlow 2.0 and the output was always optimized regardless the #neurons, #layers or #epochs, their change was never reflected to the output, even with 1 neuron, 1 layer and 1 epoch the error was minimum as if Keras neglected the user input and had internal values, don’t know why !
I made the change to use Keras from inside Tensorflow and now it works just fine.
Remain skeptical! If results sound too good to be true, they probably are.
Hi Jason,
I run LSTM with look back. I have 466 points in test input, but output has 465 points.
what does it mean and how can i predict next day?
Perhaps start with simpler tutorials here first:
https://machinelearningmastery.com/start-here/#deep_learning_time_series
Oh, i see. We want predict next t+1 then we have 465 points. But let me know how to predict number of passenger at 1961-01. I still confuse. Can you give me some simple code for this case?
Perhaps this will help:
https://machinelearningmastery.com/make-predictions-long-short-term-memory-models-keras/
I read some practical articles about lstm till now, yours was the best. The data are so intuitive and this adds intuition to my understanding of lstm, time dependency, words dependency, etc.
Thanks!
Thanks!
Hi Jason,
I used the same procedure in order to predict the volatility. I’m curious about the reason to normalize the output variable (= y variable). Is there any scientific research behind this normalization step? And if so, could you share it?
Thanks in advance!
Yes, to make the prediction problem simpler / more stable.
Hi Dr.! I have a doubt
For example, I have a dataset with data from different sources which are independent, they can not be combined. However, is possible to transform the data with a sliding window. The main problem is that I will have for example windows for the same period of time.
For example the first is from 8:00-9:00 and the second is also from 8:00-9:00. In the fitting phase, this period will appear two times. Is this really a problem? Or Is it ok to train the model with data from the same period (however, different data)?
Thanks in advance!
It sounds like a problem – test and see.
Perhaps explore whether you can frame the problem a different way or transform the data in some way.
So look_back is like number of lags right ?
Yes.
Hi Jason,
I am using similar code you have for an LSTM NN in tensorflow. I’m trying to understand why when re-arranging the feature columns, and leaving everything else the same, the network output is dramatically different. Seed is constant.
I can understand some slight changes, perhaps with the initial weight initilisation and the way connections are made, but there is a material difference in predicted output.
Any ideas why and how to correct, if at all possible? It seems like another unknown to factor for….
More background info not sure if relevant on how I’m processing the data:
About 60K time steps with 4 features (so 60,000 x 4). I take a window of 500 steps for each, “slice”. minmax scale each “Slice”. Output is multi-step approx 2-12 steps.
Thank you in advance for any help.
Perhaps keep the features the same and run the same code twice – I expect you will get different results each run:
https://machinelearningmastery.com/faq/single-faq/why-do-i-get-different-results-each-time-i-run-the-code
That was quick! The output is consistent if re-run, between sessions and days…. I can always replicate it, and when going back and forth with featurecolumn arrangement the reproduced output is similar. I can understand why BATCH size can affect results, although I always thought it was mainly for memory optimisation…
This is how I built my NN, maybe I am applying it incorrect?
Thanks once more…
train_data = tf.data.Dataset.from_tensor_slices((x_train,y_train))
train_data = train_data.cache().shuffle(BUFFER_SIZE).batch(BATCH_SIZE).repeat()
val_data = tf.data.Dataset.from_tensor_slices((x_val, y_val))
val_data = val_data.batch(BATCH_SIZE).repeat()
test_data = tf.data.Dataset.from_tensor_slices((x_test,y_test))
test_data = test_data.batch(TEST_SET).repeat()
model = tf.keras.models.Sequential()
model.add(tf.keras.layers.LSTM(32,input_shape=x_train.shape[-2:]))
model.add(tf.keras.layers.Dense(hz))
model.compile(optimizer=tf.keras.optimizers.Adam(lr=2e-4), loss=my_loss)
model.fit(train_data, epochs=EPOCHS,
steps_per_epoch=EVALUATION_INTERVAL,
validation_data=val_data,
validation_steps=VAL_STEP)
Interesting finding!
Hi Jason,
I am using LSTM (or similar deep networks) for predicting time series. For time series like y[n], the LSTM can predict y[n+1], and it is a function of previous samples [ f(y[n], … ,y[0]) ]. My question is whether LSTM works better than a trivial answer like y*[n+1]=y[n] (asterisks show the prediction of a sample) while in my problem loss function of this answer is smaller.
I mean for
the pervious sample as prediction: y*[n+1]=y[n]
RNN with LSTM : y*[n+1]=f(y[n], … ,y[0])
does RNN outperform? ( in my problem based on loss function it does not)
It depends on the dataset and the model. Run an experiment and discover if it works better than other methods.
Also, thank you so much for your help and your site
You’re welcome.
Hey, thanks a lot for the article, in addition to the time series, I wanted to provide some inputs to the LSTM model that are not changing with respect to time, can I please know if that is possible and useful?
Yes, you can use a second input to the model with the static data. The functional API can be used to achieve this:
https://machinelearningmastery.com/keras-functional-api-deep-learning/
Hey, I tried your tutorial to make a time series forecasting and it looks extremely accurate that it looks suspicious so I had a question about the following 2 lines in your code:
trainPredict = model.predict(trainX)
testPredict = model.predict(testX)
What is the method “predict” exactly doing and why would you use it on test data as well?
If you give the actual test data to the model is it then still really a forecasting?
Cheers
You can learn more about making predictions here:
https://machinelearningmastery.com/how-to-make-classification-and-regression-predictions-for-deep-learning-models-in-keras/
And here:
https://machinelearningmastery.com/make-predictions-long-short-term-memory-models-keras/
Hi,
Keras is actually just predicting the next value from each test input with predict function.
So, if you want a legit prediction, you should just predict the first point from test input, and then take the output to feed the input again, and so on. That’s called autonomous mode.
Keras it’s a really closed system based in Tensorflow, so there is many other variables that we are not aware about from Recurrent Neural Nets like LSTM.
In other words, the validation test that everybody does in Keras it’s suspicious because it’s wrong. Real validation should be taken by making autonomous and iterate over the lenght of testY.
I recommend you to use Tensorflow over Keras, to appreciate every detail from LSTM, but it’s quite tough to learn it.
I found this tutorial quite helpfull
https://medium.com/@erikhallstrm/hello-world-rnn-83cd7105b767
Try to forecast a sine wave first, it’s like the HelloWorld for the Recurrents.
In Keras i couldn’t even do that well because the cell state that LSTM haves it’s quite misleading.
Hi Jason
I notice that lot of cases time series prediction has delay problem, even if you take a look at your model predict the train data, the prediction of train data has delay effect(you can shift 1 lag to left the prediction of train data, it will ‘follow; quite nicely to the train data)
In essence model result seems to only follow the “up and down” of the “last” data of the train.
(if you latest data use to predict is high/up -> prediction will be up)
(if you latest data use to predict is low/down -> prediction will be down)
Model seems only follow the latest data, it doesn’t seems “learn” in away like , if the available data already in record high, next prediction will be sharp downturn
For this example, it’s seems okay, but for other time series, it could be problem.
I also has this problem, for my case i need to predict 1 month data but the third month of the latest available data( if we are in august, i need to predict nov data)
the shifting problem occurs even noticeable(shifting3 lag)
I also still have know idea how to solve, any idea?
Thanks
Mike
Yes, it is a common problem where the model learns a naive model (persistence) – meaning it does not have skill:
https://machinelearningmastery.com/faq/single-faq/why-is-my-forecasted-time-series-right-behind-the-actual-time-series
Is it possible to Run LSTM with more than 2(4) time series at a time
Sure.
Hello Jason. Impressive work. I am new to machine learning, deep learning and python programming. I would really appreciate it if you could point me out to right direction regarding the use of this project for forecasting 1 day, 2 days or “n” days in the future, using the model created. Can this LSTM method forecast and not only be compared to past prices of the stock? Does this method create an equation with coefficients (like a regression)?
Thanks in advance!
Thanks.
Start here:
https://machinelearningmastery.com/how-to-develop-lstm-models-for-time-series-forecasting/
Thanks a lot Jason!
You’re welcome.
What a great article – I’m busy learning LSTM and this has been such a massive help to me, and as i can tell by the number of posts, since 2016 on this same article you have provided a great service to students of ML and DL.
Jason, may good come your way.
Thanks, happy it helps.
Very well done for the job you do, bravo!
Wondering if you have an example/tutorial on how to make time-series predictions for more than one step-ahed (e.g., 1 week, 1 month predictions)?
I have successfully built my hybrid model for one-step ahed prediction, but I am struggling in adapting it for a more long term one. Any help/advise would be appreciated, thanks a lot!
Marco
Yes, see simple examples here:
https://machinelearningmastery.com/how-to-develop-lstm-models-for-time-series-forecasting/
Thanks for your example. I am not a researcher in this field but am stuck with it in a software project. I have a small amount of data and it is not repetitive.
I want to ask that if the data is not repetitive then using model.predict will return the same data as the training data but not much relation to the future data, is that right?
If the model predicts the input as output, this is a sign that the model does not have skill (e.g. it has learned to persist the last seen value). In which case it might be a good idea to try alternate data prep/models/model configs/etc.
Yes. I will research more about it. And do you have any other example for my case (data for a training period, not repetitive… need to forecast a short period)?
Yes, there are hundreds of examples of time series forecasting on the blog, perhaps start here:
https://machinelearningmastery.com/start-here/#deep_learning_time_series
Thank you so much
You’re welcome.
excuse me, Dr. 1 more question 😀 in LSTM, my prediction data always one step behind the real data in the graph in the graph, which configuration I can make prediction data be faster a time step.
Perhaps try some of these suggestions:
https://machinelearningmastery.com/improve-deep-learning-performance/
I have seen and followed a few examples. However, I still don’t understand why after LSTM finished learning from training data, It used test data as input for prediction and returns a highly accurate prediction result. So what is its purpose?
Perhaps this will help:
https://machinelearningmastery.com/time-series-forecasting-supervised-learning/
Thanks so much Dr. Jason for the tutorial, i’m a beginner sir.Im trying to incorporate CNN-LSTM into airline passenger problem.i copied some of your code in your previous blog https://machinelearningmastery.com/how-to-develop-lstm-models-for-time-series-forecasting/ but how can i reshape my input into [samples, subsequences, timesteps, features] unlike [samples, timesteps, features] in this tutorial.
You must choose a way to reshape the sequence for the model. There is no best way, perhaps try a few approaches and see what works well/best for you.
model = Sequential()
model.add(TimeDistributed(Conv1D(filters=64, kernel_size=1, activation=’relu’),input_shape =(None,look_back,n_features)))
model.add(TimeDistributed(MaxPooling1D(pool_size=2)))
model.add(TimeDistributed(Flatten()))
model.add(LSTM(4,input_shape=(1, look_back)))
model.add(Dense(1))
model.compile(loss=’mean_squared_error’, optimizer=’adam’)
model.fit(trainX, trainY, epochs=100, batch_size=1, verbose=2
Sir,is there any error in the above code
Sorry to hear that, this may help:
https://machinelearningmastery.com/faq/single-faq/why-does-the-code-in-the-tutorial-not-work-for-me
Thanks for sharing your vast amount of experience sir. I was able to resolve the problem days back using some heuristic approach
You’re welcome.
Hello,
First thank you a lot for your blog, it is really helpful.
Here my question, I am using LSTM to make prediction about the price of a certain product. I make a first try using the past 24 hours to predict the next 24 hours.
Now I am interested to add another feature, I want to use the information about the day of week because it gives a lot of information and I am pretty sur it will improve the prediction. But I am not completely sure how to add it.
As, I do windows as you presented, here it is how I feed my first model :
Price Product [t-24, t-23, t-22,… t-1] –> prediction [t, t+1, t+2, t+3,…, t23].
Now if I add my second feature, that I first hot encoded (if we are a Sunday):
Sunday : [t-24, t-23, t-22,… t-1] = [1, 1, 1,…1]
Saturday: [t-24, t-23, t-22,… t-1] = [0, 0, 0,…0]
… [t-24, t-23, t-22,… t-1] = [0, 0, 0,…0]
Monday : [t-24, t-23, t-22,… t-1] = [0, 0, 0,…0]
Price product : [t-24, t-23, t-22,… t-1] –> prediction : [t, t+1, t+2, t+3,…, t23].
I am not sure if it is a good way to feed like this my LSTM model, I just want to know your advice on it ?
My second idea was to transform my time data into a sin and a cos due to the fact that I have a clear periodicity and use something like this (I found it on a tutorial but I don’t clearly understand the meaning for the moment, I will investigate more on that) :
df[‘Day sin’] = np.sin(timestamp_s * (2 * np.pi / day))
df[‘Day cos’] = np.cos(timestamp_s * (2 * np.pi / day))
But if I do this I will have only two other features and not a feature for each day. What are your advices ? Or recommendations ?
Hope I was clear and Thank you a lot.
David
You’re welcome.
Yes, you can add as many varieties for a given time step as you want.
Perhaps compare to an integer encoded day of week, vs one hot encoded, vs embedding and see what works well/best.
Perhaps try a flag weekday vs weekend or similar.
Perhaps try an MLP or ML model to confirm your LSTM has skill against a naive model.
Hello,
I come back to you with another general question. After your advices, I also try to use an MLP model and it produces better results on my forecast than LSTM.
So perfect, I wanted to use it on my ‘Production set’. Let be a bit more precise, indeed my dataset is composed of data from 2015 to 2019, I decided to use data from 2015 to 2018 (included) as train set and 2019 data as validation set. I make sure to scaled my data very carefully, i.e. I used StandardScaler from sklearn scaler.fit_transform on data_2015 to 2018, and only scaler.transform on data_2019 (in order to avoid any possible leakage). And yes, I obtain quite good results, on my train and validation set.
I wanted to confirm this on data from 2020 (Production set). Unfortunately my results are really bad…
After some research, I came across another one of your articles about walk-forward validation. At the beginning, I just split my data 2015 to 2018 as train, and 2019 as validation. Now, I use this Walk-Forward method with TimeSeriesSplit from sklearn. But the problem remain the same…. good results on train-validation set and really poor results on 2020 data.
I know also that my data were quite sensitive about the corona-virus but as I used many others features as input, I was expecting that the general effect will be catch by my model (I hope I am understandable). But even so, I am a bit lost and I don’t think that my problem is due to that virus-effect. It feels that my model is suffering of leakage but I really don’t know how.
So yes please, I need some tips or advices to see where can be my problem ?
Perhaps you are overfitting the training set, perhaps try regularization methods:
https://machinelearningmastery.com/introduction-to-regularization-to-reduce-overfitting-and-improve-generalization-error/
In my model i also have the yearly cycle (with sin and cos), it’s useful if the data is not stationary (i guess). The thing is, it’s common practice to transform the data to be stationary. Does it make sense to create this variable of periodicity and the transform it?
Compare model performance with and without the transform and use whatever works best.
Hi Jason,
Excellent post, I was wondering if you could shed light in transfer learning for LSTMs.
I am currently working on a project about time-series forecasting using LSTMs layers. The dataset used for training and testing the model was collected among 443 people which worn a sensor that samples a physical variable ( 1 variable/measure) every 5 minutes, for each patient there are around 5000 records/readings.
Although, I can train and test my model under different scenarios, I am troubled finding information about how to apply transfer learning in such an architecture. I mean, I understand I can use inductive transfer-learning by copying the matrix-weights from the general model onto a secondary model (unknown person), then after I can re-train this model with specific data and evaluate the result.
But I would like to know if you could think of other ways to apply transfer-learning on this type of architecture or where to find information about it since there aren’t many scientific papers talking about it, mostly they talk about NLP and other type of applications but time series?
Cheers X )
Thanks!
Yes, transfer learning might help if you don’t have much data and you are able to train a model or models with a large amount of data that is related or similar to your domain in some way – even just for feature extraction at the same level of detail.
Perhaps try it and compare results to from-scratch models on your specific dataset. Compare results to MLP, CNN and hybrids as often LSTMs are not well suited to autoregression type problems.
Thanks Janson for this amazing resource you’ve created.
I’m very new to all this, but I thought I post an edit that might help show the difference between asking the model for a series of one-step predictions based on existing data, and walking forward in time to predict beyond existing data. (I see some questions on the matter here, and I experienced the same confusion). I tried to modify your example a little as possible. Not sure if I’m really doing this right, but it seems to work ok.
Thanks for sharing.
Hi Jason,
Why do LSTMs require training data in a ‘supervised form’ like other machine learning algorithms? I thought they should be trained sequentially (giving one sample at a time because the model implicitly remembers the past inputs).
1) Why do they require supervised data?
2) If they require supervised data, what’s the difference from other machine learning algorithms?
3) Why are LSTMs memory-less? If I give the same input to the network, I always get the same output regardless of the previous inputs.
LSTMs are a supervised learning algorithm, therefore they need data in a supervised learning format.
LSTMs can operate on input sequences. MLPs cannot. They treat each time step as a feature.
LSTMs preserve state across time steps and even across samples (sequences). They have memory. MLPs do not.
If you are getting the same result, perhaps the problem is too simple or the model is in appropriate and requires tuning, etc.
Thanks for the reply, Jason. I’m still not unclear. If LSTMs have memory, why do they need multiple previous inputs like this?
X1 X2 X3 Y
112 118 132 129
118 132 129 121
132 129 121 135
129 121 135 148
121 135 148 148
Shouldn’t this be enough?
X Y
112 118
118 132
132 129
129 121
121 135
They do not memorize past input sequences.
Instead, they develop an internal representation that is helpful to the model in making future predictions.
How to calculate the value of significance, confidence and T -test statistical figures of above LSTM model?
Perhaps this will help:
https://machinelearningmastery.com/statistical-significance-tests-for-comparing-machine-learning-algorithms/
I can’t thank you enough for you great work in Internet.
is there any function to know the training execution time? After training, not estimated.
Best regards,
You’re very welcome!
You could time it using Python timeit:
https://docs.python.org/3/library/timeit.html
Thank Your for the very great article!
My question is, how am I suppose to predict the following i.e. 30 element, that would come after the dataset?
So I have your trained model, and I would like to predict the next for example 30 element of the measured sequence.
Regards,
Logan
You can make a prediction by calling model.predict(), this will help:
https://machinelearningmastery.com/make-predictions-long-short-term-memory-models-keras/
And this:
https://machinelearningmastery.com/how-to-make-classification-and-regression-predictions-for-deep-learning-models-in-keras/
Hi Dr. Jason,
Thanks for the excellent post,im confused about the use of time steps and windows method. Why are we creating a new dataset or are we predicting for years ahead.
This will help you understand how we transform a time series into a supervised learning problem:
https://machinelearningmastery.com/time-series-forecasting-supervised-learning/
The result in the chart seems to be not aligned with the original Series.
Yes, this is common in tome series:
https://machinelearningmastery.com/faq/single-faq/why-is-my-forecasted-time-series-right-behind-the-actual-time-series
what the x and y-axis?
I have data related to rainfall it depends on humidity, temperature to predict supply hours in future, I have data for it from 2008 to 2018, how to deal it with the LSTM model as above example
Perhaps this will help:
https://machinelearningmastery.com/faq/single-faq/what-is-the-difference-between-samples-timesteps-and-features-for-lstm-input
I have data related to rainfall it depends on humidity, temperature to predict supply hours in future, I have data for it from 2008 to 2018, how to deal it with the LSTM model as above example
Güncel Çağrı Merkezi Data – Çağrı Merkezi Data, Güncel Data Hizmetleri En Güncel Datalar.
https://cagrimerkezidata.net
Perhaps try loading your data and compare the performance classical time series methods, ml methods, mlps, cnns and lstms in order to discover what works best.
This framework will help:
https://machinelearningmastery.com/how-to-develop-a-skilful-time-series-forecasting-model/
I am getting this error:
ValueError: operands could not be broadcast together with shapes (81367,4) (5,) (81367,4)
tried a lot but could not find any solution. Please help
Sorry to hear that, some of these tips may help:
https://machinelearningmastery.com/faq/single-faq/why-does-the-code-in-the-tutorial-not-work-for-me
Hi Jason, thanks for this awesome resource and by seeing your blog I’m also really interested in your book. I just had a question about this one, the look_back is used to be able to predict the passengers on the next month right? So if I want to predict the passengers for two years next, I should set the look_back as 24 right? But how can I display the future prediction on the graph? it seems like the predicted test data stops in the graph when the graph of the dataset ends. I hope you’ll be able to help me out here 🙂
best
This may help with making predictions on new data:
https://machinelearningmastery.com/make-predictions-long-short-term-memory-models-keras/
Hi, to anyone having the same question, below is how I managed to do it:
1. Set a for loop with range(number of future predictions)
2. predict using the model, the last element of the testX numpy array,
3. concatenate this last prediction
this will add the predictions to the testX array, also make sure you reshape your data correctly so you don’t encounter any errors.
However, I’m not still sure this is the best way to do so
Nice work!
Hi Jason,
Thanks for this amazing notebook and explanations again. I have a question about preparing lstm dataset. I have a data frame which include lots of features about building, for instance; square meter, outside temperature, wind power etc and the output is energy consumption value by kWh.
I want to build Keras model which feed by 2 dataset and give me one output. Actually I did it. and my rmse value is great. But I have a doubt about my lstm dataset. I used window frame method and build a dataset with 4 features like [“t-4”, “t-3”, “t-2”, “t-1”] and output is t. I feed the dataset with this data frame.
However is that true approach to build a lstm data frame?. Because I feel like it is like a cheating because I have already give the exact value energy consumption to the model when train it.
Thank you for your help.
Sounds correct, perhaps this will help:
https://machinelearningmastery.com/faq/single-faq/what-is-the-difference-between-samples-timesteps-and-features-for-lstm-input
By the way, I created my second dataset, just using the output values of my original dataframe. So , [“t-4”, “t-3”, “t-2”, “t-1” are all energy consumption values coming from past outputs.
Ensure the input data to your sample represents only data that you have available before a prediction is required. This is like a golden rule for time series.
Does anyone else getting error for the LSTM layer addition?
NotImplementedError: Cannot convert a symbolic Tensor (lstm/strided_slice:0) to a numpy array, when running the following code (keras version 2.4.3)
from keras.models import Sequential
from keras.layers import Dense
from keras.layers import LSTM
from sklearn.preprocessing import MinMaxScaler
from sklearn.metrics import mean_squared_error
# create and fit the LSTM network
look_back = 3
model = Sequential()
model.add(LSTM(4, input_shape=(1, look_back)))
model.add(Dense(1))
model.compile(loss=’mean_squared_error’, optimizer=’adam’)
These tips may help:
https://machinelearningmastery.com/faq/single-faq/why-does-the-code-in-the-tutorial-not-work-for-me
To anyone who encounter that problem, I solved it by downgrading numpy to version 1.19.5.
The latest Keras seems incompatible with latest numpy version.
You can do so with “pip install –user numpy==1.19.5 “.
See that post for more details:
https://stackoverflow.com/questions/64194077/notimplementederror-when-creating-keras-model-with-lstm-layer-in-visual-studio-2
Thank you for sharing!
This worked for me too, frustrating to try to figure out why the new NumPy doesn’t work…seems like there was some sort of variable/command change. Reading the code, and printing out the array, its type and dimensions, it seems like symbolic Tensor issues shouldn’t be an issue, but it keeps happening in the new NumPy versions.
Hi Ben…Just curious what error messages, etc you may have experienced.
Regards,
Hi jason,
Thanks for your amazing work. Please I just want to ask if RNN can be used for a normal regression problem?.. lets say you have your ‘Y’ variable and a list of ‘X’ variables as input and you just want to know their relationship and not necessarily a prediction over time as in time series regression. Can the RNN still work? Cos it seems RNN is only tailored to work on only sequential problems like time or temporal series regression
You’re welcome.
LSTMs/RNNs are only appropriate for sequence prediction problems. This may help:
https://machinelearningmastery.com/when-to-use-mlp-cnn-and-rnn-neural-networks/
Hi Jason,
Thanks a lot for this great post. I have couple of questions:
1-I’m using the window method to predict the next value based on the previous 10 values (time_step=1, features=10). LSTM is performing quite bad. I tuned the hyper parameters using Keras tuner for 300 trials, I used the best model and still the performance is not that good.
Could this mean that LSTM is not adequate for my time series? How do I know if the sequence of data could be predicted or not using LSTM ?
2- If I understood well, the window method: predict one value based on the last n values (as features). The time step method: predict n values based on the previous n values (is this correct )?
i appreciate any advices you might have.
It may mean the model is not appropriate for your data, or your data may need some preparation or an alternate configuration is required.
It is often a good idea to start with some naive models and compare everything to that, then move on to classical methods then ml, then finally neural nets.
You can learn more about the “window method” here:
https://machinelearningmastery.com/time-series-forecasting-supervised-learning/
And here:
https://machinelearningmastery.com/convert-time-series-supervised-learning-problem-python/
And in the context f LSTMs here:
https://machinelearningmastery.com/faq/single-faq/what-is-the-difference-between-samples-timesteps-and-features-for-lstm-input
I have run your code with your dataset and got the following error
CODE:
'''
ORIGINAL CODE
For completeness, below is the entire code example.
https://machinelearningmastery.com/time-series-prediction-lstm-recurrent-neural-networks-python-keras/
'''
# LSTM for international airline passengers problem with regression framing
import numpy
import matplotlib.pyplot as plt
from pandas import read_csv
import math
from keras.models import Sequential
from keras.layers import Dense
from keras.layers import LSTM
from sklearn.preprocessing import MinMaxScaler
from sklearn.metrics import mean_squared_error
# convert an array of values into a dataset matrix
def create_dataset(dataset, look_back=1):
dataX, dataY = [], []
for i in range(len(dataset)-look_back-1):
a = dataset[i:(i+look_back), 0]
dataX.append(a)
dataY.append(dataset[i + look_back, 0])
return numpy.array(dataX), numpy.array(dataY)
# fix random seed for reproducibility
numpy.random.seed(7)
# load the dataset
dataframe = read_csv('airline-passengers.csv', usecols=[1], engine='python')
dataset = dataframe.values
dataset = dataset.astype('float32')
# normalize the dataset
scaler = MinMaxScaler(feature_range=(0, 1))
dataset = scaler.fit_transform(dataset)
# split into train and test sets
train_size = int(len(dataset) * 0.67)
test_size = len(dataset) - train_size
train, test = dataset[0:train_size,:], dataset[train_size:len(dataset),:]
# reshape into X=t and Y=t+1
look_back = 1
trainX, trainY = create_dataset(train, look_back)
testX, testY = create_dataset(test, look_back)
# reshape input to be [samples, time steps, features]
trainX = numpy.reshape(trainX, (trainX.shape[0], 1, trainX.shape[1]))
testX = numpy.reshape(testX, (testX.shape[0], 1, testX.shape[1]))
# create and fit the LSTM network
model = Sequential()
model.add(LSTM(4, input_shape=(1, look_back)))
model.add(Dense(1))
model.compile(loss='mean_squared_error', optimizer='adam')
model.fit(trainX, trainY, epochs=100, batch_size=1, verbose=2)
# make predictions
trainPredict = model.predict(trainX)
testPredict = model.predict(testX)
# invert predictions
trainPredict = scaler.inverse_transform(trainPredict)
trainY = scaler.inverse_transform([trainY])
testPredict = scaler.inverse_transform(testPredict)
testY = scaler.inverse_transform([testY])
# calculate root mean squared error
trainScore = math.sqrt(mean_squared_error(trainY[0], trainPredict[:,0]))
print('Train Score: %.2f RMSE' % (trainScore))
testScore = math.sqrt(mean_squared_error(testY[0], testPredict[:,0]))
print('Test Score: %.2f RMSE' % (testScore))
# shift train predictions for plotting
trainPredictPlot = numpy.empty_like(dataset)
trainPredictPlot[:, :] = numpy.nan
trainPredictPlot[look_back:len(trainPredict)+look_back, :] = trainPredict
# shift test predictions for plotting
testPredictPlot = numpy.empty_like(dataset)
testPredictPlot[:, :] = numpy.nan
testPredictPlot[len(trainPredict)+(look_back*2)+1:len(dataset)-1, :] = testPredict
# plot baseline and predictions
plt.plot(scaler.inverse_transform(dataset))
plt.plot(trainPredictPlot)
plt.plot(testPredictPlot)
plt.show()
ERROR:
---------------------------------------------------------------------------
InvalidArgumentError Traceback (most recent call last)
~/anaconda3/envs/tfall/lib/python3.7/site-packages/tensorflow/python/framework/ops.py in _create_c_op(graph, node_def, inputs, control_inputs, op_def)
1879 try:
-> 1880 c_op = pywrap_tf_session.TF_FinishOperation(op_desc)
1881 except errors.InvalidArgumentError as e:
InvalidArgumentError: Shape must be at least rank 3 but is rank 2 for '{{node BiasAdd}} = BiasAdd[T=DT_FLOAT, data_format="NCHW"](add, bias)' with input shapes: [?,16], [16].
During handling of the above exception, another exception occurred:
ValueError Traceback (most recent call last)
in
45 # create and fit the LSTM network
46 model = Sequential()
---> 47 model.add(LSTM(4, input_shape=(1, look_back)))
48 model.add(Dense(1))
49 model.compile(loss='mean_squared_error', optimizer='adam')
~/anaconda3/envs/tfall/lib/python3.7/site-packages/tensorflow/python/training/tracking/base.py in _method_wrapper(self, *args, **kwargs)
520 self._self_setattr_tracking = False # pylint: disable=protected-access
521 try:
--> 522 result = method(self, *args, **kwargs)
523 finally:
524 self._self_setattr_tracking = previous_value # pylint: disable=protected-access
~/anaconda3/envs/tfall/lib/python3.7/site-packages/keras/engine/sequential.py in add(self, layer)
206 # and create the node connecting the current layer
207 # to the input layer we just created.
--> 208 layer(x)
209 set_inputs = True
210
~/anaconda3/envs/tfall/lib/python3.7/site-packages/keras/layers/recurrent.py in __call__(self, inputs, initial_state, constants, **kwargs)
658
659 if initial_state is None and constants is None:
--> 660 return super(RNN, self).__call__(inputs, **kwargs)
661
662 # If any of initial_state
orconstantsare specified and are Keras~/anaconda3/envs/tfall/lib/python3.7/site-packages/keras/engine/base_layer.py in __call__(self, *args, **kwargs)
944 if _in_functional_construction_mode(self, inputs, args, kwargs, input_list):
945 return self._functional_construction_call(inputs, args, kwargs,
--> 946 input_list)
947
948 # Maintains info about the Layer.call
stack.~/anaconda3/envs/tfall/lib/python3.7/site-packages/keras/engine/base_layer.py in _functional_construction_call(self, inputs, args, kwargs, input_list)
1082 # Check input assumptions set after layer building, e.g. input shape.
1083 outputs = self._keras_tensor_symbolic_call(
-> 1084 inputs, input_masks, args, kwargs)
1085
1086 if outputs is None:
~/anaconda3/envs/tfall/lib/python3.7/site-packages/keras/engine/base_layer.py in _keras_tensor_symbolic_call(self, inputs, input_masks, args, kwargs)
814 return tf.nest.map_structure(keras_tensor.KerasTensor, output_signature)
815 else:
--> 816 return self._infer_output_signature(inputs, args, kwargs, input_masks)
817
818 def _infer_output_signature(self, inputs, args, kwargs, input_masks):
~/anaconda3/envs/tfall/lib/python3.7/site-packages/keras/engine/base_layer.py in _infer_output_signature(self, inputs, args, kwargs, input_masks)
854 self._maybe_build(inputs)
855 inputs = self._maybe_cast_inputs(inputs)
--> 856 outputs = call_fn(inputs, *args, **kwargs)
857
858 self._handle_activity_regularization(inputs, outputs)
~/anaconda3/envs/tfall/lib/python3.7/site-packages/keras/layers/recurrent_v2.py in call(self, inputs, mask, training, initial_state)
1250 else:
1251 (last_output, outputs, new_h, new_c,
-> 1252 runtime) = lstm_with_backend_selection(**normal_lstm_kwargs)
1253
1254 states = [new_h, new_c]
~/anaconda3/envs/tfall/lib/python3.7/site-packages/keras/layers/recurrent_v2.py in lstm_with_backend_selection(inputs, init_h, init_c, kernel, recurrent_kernel, bias, mask, time_major, go_backwards, sequence_lengths, zero_output_for_mask)
1645 # Call the normal LSTM impl and register the CuDNN impl function. The
1646 # grappler will kick in during session execution to optimize the graph.
-> 1647 last_output, outputs, new_h, new_c, runtime = defun_standard_lstm(**params)
1648 _function_register(defun_gpu_lstm, **params)
1649
~/anaconda3/envs/tfall/lib/python3.7/site-packages/tensorflow/python/eager/function.py in __call__(self, *args, **kwargs)
3020 with self._lock:
3021 (graph_function,
-> 3022 filtered_flat_args) = self._maybe_define_function(args, kwargs)
3023 return graph_function._call_flat(
3024 filtered_flat_args, captured_inputs=graph_function.captured_inputs) # pylint: disable=protected-access
~/anaconda3/envs/tfall/lib/python3.7/site-packages/tensorflow/python/eager/function.py in _maybe_define_function(self, args, kwargs)
3442
3443 self._function_cache.missed.add(call_context_key)
-> 3444 graph_function = self._create_graph_function(args, kwargs)
3445 self._function_cache.primary[cache_key] = graph_function
3446
~/anaconda3/envs/tfall/lib/python3.7/site-packages/tensorflow/python/eager/function.py in _create_graph_function(self, args, kwargs, override_flat_arg_shapes)
3287 arg_names=arg_names,
3288 override_flat_arg_shapes=override_flat_arg_shapes,
-> 3289 capture_by_value=self._capture_by_value),
3290 self._function_attributes,
3291 function_spec=self.function_spec,
~/anaconda3/envs/tfall/lib/python3.7/site-packages/tensorflow/python/framework/func_graph.py in func_graph_from_py_func(name, python_func, args, kwargs, signature, func_graph, autograph, autograph_options, add_control_dependencies, arg_names, op_return_value, collections, capture_by_value, override_flat_arg_shapes)
997 _, original_func = tf_decorator.unwrap(python_func)
998
--> 999 func_outputs = python_func(*func_args, **func_kwargs)
1000
1001 # invariant: func_outputs
contains only Tensors, CompositeTensors,~/anaconda3/envs/tfall/lib/python3.7/site-packages/keras/layers/recurrent_v2.py in standard_lstm(inputs, init_h, init_c, kernel, recurrent_kernel, bias, mask, time_major, go_backwards, sequence_lengths, zero_output_for_mask)
1386 input_length=(sequence_lengths
1387 if sequence_lengths is not None else timesteps),
-> 1388 zero_output_for_mask=zero_output_for_mask)
1389 return (last_output, outputs, new_states[0], new_states[1],
1390 _runtime(_RUNTIME_CPU))
~/anaconda3/envs/tfall/lib/python3.7/site-packages/tensorflow/python/util/dispatch.py in wrapper(*args, **kwargs)
204 """Call target, and fall back on dispatchers if there is a TypeError."""
205 try:
--> 206 return target(*args, **kwargs)
207 except (TypeError, ValueError):
208 # Note: convert_to_eager_tensor currently raises a ValueError, not a
~/anaconda3/envs/tfall/lib/python3.7/site-packages/keras/backend.py in rnn(step_function, inputs, initial_states, go_backwards, mask, constants, unroll, input_length, time_major, zero_output_for_mask)
4341 # the value is discarded.
4342 output_time_zero, _ = step_function(
-> 4343 input_time_zero, tuple(initial_states) + tuple(constants))
4344 output_ta = tuple(
4345 tf.TensorArray(
~/anaconda3/envs/tfall/lib/python3.7/site-packages/keras/layers/recurrent_v2.py in step(cell_inputs, cell_states)
1364 z = backend.dot(cell_inputs, kernel)
1365 z += backend.dot(h_tm1, recurrent_kernel)
-> 1366 z = backend.bias_add(z, bias)
1367
1368 z0, z1, z2, z3 = tf.split(z, 4, axis=1)
~/anaconda3/envs/tfall/lib/python3.7/site-packages/tensorflow/python/util/dispatch.py in wrapper(*args, **kwargs)
204 """Call target, and fall back on dispatchers if there is a TypeError."""
205 try:
--> 206 return target(*args, **kwargs)
207 except (TypeError, ValueError):
208 # Note: convert_to_eager_tensor currently raises a ValueError, not a
~/anaconda3/envs/tfall/lib/python3.7/site-packages/keras/backend.py in bias_add(x, bias, data_format)
5961 if len(bias_shape) == 1:
5962 if data_format == 'channels_first':
-> 5963 return tf.nn.bias_add(x, bias, data_format='NCHW')
5964 return tf.nn.bias_add(x, bias, data_format='NHWC')
5965 if ndim(x) in (3, 4, 5):
~/anaconda3/envs/tfall/lib/python3.7/site-packages/tensorflow/python/util/dispatch.py in wrapper(*args, **kwargs)
204 """Call target, and fall back on dispatchers if there is a TypeError."""
205 try:
--> 206 return target(*args, **kwargs)
207 except (TypeError, ValueError):
208 # Note: convert_to_eager_tensor currently raises a ValueError, not a
~/anaconda3/envs/tfall/lib/python3.7/site-packages/tensorflow/python/ops/nn_ops.py in bias_add(value, bias, data_format, name)
3376 else:
3377 return gen_nn_ops.bias_add(
-> 3378 value, bias, data_format=data_format, name=name)
3379
3380
~/anaconda3/envs/tfall/lib/python3.7/site-packages/tensorflow/python/ops/gen_nn_ops.py in bias_add(value, bias, data_format, name)
689 data_format = _execute.make_str(data_format, "data_format")
690 _, _, _op, _outputs = _op_def_library._apply_op_helper(
--> 691 "BiasAdd", value=value, bias=bias, data_format=data_format, name=name)
692 _result = _outputs[:]
693 if _execute.must_record_gradient():
~/anaconda3/envs/tfall/lib/python3.7/site-packages/tensorflow/python/framework/op_def_library.py in _apply_op_helper(op_type_name, name, **keywords)
748 op = g._create_op_internal(op_type_name, inputs, dtypes=None,
749 name=scope, input_types=input_types,
--> 750 attrs=attr_protos, op_def=op_def)
751
752 # outputs
is returned as a separate return value so that the output~/anaconda3/envs/tfall/lib/python3.7/site-packages/tensorflow/python/framework/func_graph.py in _create_op_internal(self, op_type, inputs, dtypes, input_types, name, attrs, op_def, compute_device)
599 return super(FuncGraph, self)._create_op_internal( # pylint: disable=protected-access
600 op_type, captured_inputs, dtypes, input_types, name, attrs, op_def,
--> 601 compute_device)
602
603 def capture(self, tensor, name=None, shape=None):
~/anaconda3/envs/tfall/lib/python3.7/site-packages/tensorflow/python/framework/ops.py in _create_op_internal(self, op_type, inputs, dtypes, input_types, name, attrs, op_def, compute_device)
3563 input_types=input_types,
3564 original_op=self._default_original_op,
-> 3565 op_def=op_def)
3566 self._create_op_helper(ret, compute_device=compute_device)
3567 return ret
~/anaconda3/envs/tfall/lib/python3.7/site-packages/tensorflow/python/framework/ops.py in __init__(self, node_def, g, inputs, output_types, control_inputs, input_types, original_op, op_def)
2040 op_def = self._graph._get_op_def(node_def.op)
2041 self._c_op = _create_c_op(self._graph, node_def, inputs,
-> 2042 control_input_ops, op_def)
2043 name = compat.as_str(node_def.name)
2044
~/anaconda3/envs/tfall/lib/python3.7/site-packages/tensorflow/python/framework/ops.py in _create_c_op(graph, node_def, inputs, control_inputs, op_def)
1881 except errors.InvalidArgumentError as e:
1882 # Convert to ValueError for backwards compatibility.
-> 1883 raise ValueError(str(e))
1884
1885 return c_op
ValueError: Shape must be at least rank 3 but is rank 2 for '{{node BiasAdd}} = BiasAdd[T=DT_FLOAT, data_format="NCHW"](add, bias)' with input shapes: [?,16], [16].
Sorry to hear that, perhaps these tips will help:
https://machinelearningmastery.com/faq/single-faq/why-does-the-code-in-the-tutorial-not-work-for-me
Hi Jason,
is it ok to use LSTM for regression of non-temporal data, data that are not a time series?
can I apply is in a similar way for time series?
No.
I’ve read many articles about predicting stock using LSTM. What is the difference between using or not using the Regression layer to the LSTM?
I don’t believe you can predict stock prices:
https://machinelearningmastery.com/faq/single-faq/can-you-help-me-with-machine-learning-for-finance-or-the-stock-market
In this approach, I think the test data is biased and that could be the reason why we are seeing a lag between ground-truth and predictions in the plots. It is basically carrying forward the target values in a sense. The way the test data is being generated is possibly introducing the bias as the look-back data is being generated from the ground-truth instead of the model’s forecasted values. On the other hand, if the model’s forecasted values were used to generate the look-back data, it’s highly possible that the error eventually gets increased. That leaves me in a great confusion. What should be the ideal way to generate test-data for such problems ??
Yes, see this:
https://machinelearningmastery.com/faq/single-faq/why-is-my-forecasted-time-series-right-behind-the-actual-time-series
Hi Jason,
Nice tutorial. I have a question regarding the parameter of LSTM layer.
model.add(LSTM(32, input_shape=(1024,4)))
here I’m sure that block size is 32, but does this code mean window size is 1024 by 4. Please clarify if I’m wrong.
Thanks
This may help:
https://machinelearningmastery.com/faq/single-faq/what-is-the-difference-between-samples-timesteps-and-features-for-lstm-input
Hi Dr. Jason,
I’m a beginner, trying to learn new things, i removed the invert prediction and tried to run the program but I got an error after the epochs ran ,Singleton array 0.034482762 cannot be considered a valid collection.
When i changed the following code at the RMSE section from
trainScore = math.sqrt(mean_squared_error(trainY[0], trainPredict[:,0]))
testScore = math.sqrt(mean_squared_error(testY[0], testPredict[:,0]))
to
trainScore = math.sqrt(mean_squared_error(trainY, trainPredict[:,0]))
testScore = math.sqrt(mean_squared_error(testY, testPredict[:,0]))
I got the following result using the same dataset
Train Score: 0.11 RMSE
Test Score: 0.31 RMSE
My question is have i done the right thing looking at the error from Train Score and Test Score, especially changing trainY[0] to trainY and what is the meaning of the statement
Correct. You changed the shape of trainY because you removed the inverse_transform()
Hi,
when I am trying on my dataset (which is very small just 60 rows) the results are:
https://i.stack.imgur.com/Ab8dJ.png
The result seems no bad on picture, but the score is
Train Score: 209747.60 RMSE
Test Score: 59833.18 RMSE
what does RMSE indicate? Could you help me to undestand why this score is so high. What I know from net sources smaller the RMSE, good the model will be, But in figures the model seems good but values are so high. So, this is not good in this case?
RMSE is the roughly the size of the error. If I am predicting the GDP of a country in dollars, having a RMSE of 60 thousand is exceptionally good. But I see your training score is way larger than your test score. That doesn’t look right to me.
ok thanks for response,
what about this model? could you tell me is it good enough or not?
Epoch 100/100
1445/1445 – 1s – loss: 0.0020
Train Score: 2044.74 RMSE
Test Score: 1168.54 RMSE
r2-train: 0.414085
r2-test: 0.122926
MSE-train: 4180958.707879
MSE-test: 1365486.073809
I think it is not too bad but still a lot of room to improve before it can have some real use.
Hi Dr. Jason,
I am using your code to run a time series data that has 5 features, below is how I edited the code and the error I obtained concerning the reshaping.
def create_dataset(dataset,look_back=1):
dataX,dataY =[], []
for i in range(len(dataset)-look_back-1):
a=dataset[i:(i+look_back),0]
dataX.append(a)
dataY.append(dataset[i+look_back,0])
return numpy.array(dataX), numpy.array(dataY)
numpy.random.seed(7)
dataframe=read_csv(‘C:/Users/eddy/chengdurest991.csv’,usecols=[1,2,3,4,5])
dataset=dataframe.values
dataset=dataset.astype(‘float32′)
scaler=MinMaxScaler(feature_range=(0,1))
dataset = scaler.fit_transform(dataset)
train_size=int(len(dataset)*0.8)
val_size=int(train_size*0.2)
test_size=len(dataset)-train_size
train,val,test =dataset[0:train_size,:],dataset[0:val_size,:],dataset[train_size:len(dataset),:]
look_back=5
trainX,trainY=create_dataset(train,look_back)
valX,valY=create_dataset(val,look_back)
testX,testY=create_dataset(test,look_back)
trainX=numpy.reshape(trainX,(trainX.shape[0],1,trainX.shape[1]))
valX=numpy.reshape(valX,(valX.shape[0],1,valX.shape[1]))
testX=numpy.reshape(testX,(testX.shape[0],1,testX.shape[1]))
model = Sequential()
model.add(LSTM(4, input_shape=(1,look_back)))
model.add(Dense(1))
model.compile(loss=’mean_squared_error’,optimizer=’adam’)
model.fit(trainX,trainY,batch_size=5,verbose=2, validation_data=(valX,valY))
trainPredict=model.predict(trainX)
valPredict=model.predict(valX)
testPredict=model.predict(testX)
trainPredict=scaler.inverse_transform(trainPredict)
trainY=scaler.inverse_transform([trainY])
valPredict=scaler.inverse_transform(valPredict)
valY=scaler.inverse_transform([valY])
testPredict=scaler.inverse_transform(testPredict)
testY=scaler.inverse_transform([testY])
trainScore=math.sqrt(mean_squared_error(trainY[0],trainPredict[:,0]))
print(‘Train Score:% . 2f RMSE’ % (trainScore))
valScore=math.sqrt(mean_squared_error(valY[0],valPredict[:,0]))
print(‘val Score:% . 2f RMSE’ % (valScore))
testScore=math.sqrt(mean_squared_error(testY[0],testPredict[:,0]))
print(‘Train Score:% . 2f RMSE’ % (testScore))
trainPredictPlot=numpy.empty_like(dataset)
trainPredictPlot[:,:]=numpy.nan
trainPredictPlot[look_back:len(trainPredict)+look_back,:]=trainPredict
valPredictPlot=numpy.empty_like(dataset)
valPredictPlot[:,:]=numpy.nan
valPredictPlot[look_back:len(trainPredict)+(look_back*2)+1:len(dataset),:]=valPredict
testPredictPlot=numpy.empty_like(dataset)
testPredictPlot[:,:]=numpy.nan
testPredictPlot[look_back:len(testPredict)+(look_back*3)+1:len(dataset)-1,:]=testPredict
plt.plot(scaler.inverse_transform(dataset))
plt.plot(trainPredictPlot)
plt.plot(valPredictPlot)
plt.plot(testPredictPlot)
plt.show()
train.shape
(41472, 5)
val.shape
(8294, 5)
test.shape
(10368, 5)
Error obtained
Traceback (most recent call last):
File “C:\Users\eddy\anaconda3\envs\eny\lib\site-packages\IPython\core\interactiveshell.py”, line 3343, in run_code
exec(code_obj, self.user_global_ns, self.user_ns)
File “”, line 36, in
trainPredict=scaler.inverse_transform(trainPredict)
File “C:\Users\eddy\anaconda3\envs\eny\lib\site-packages\sklearn\preprocessing\_data.py”, line 461, in inverse_transform
X -= self.min_
ValueError: non-broadcastable output operand with shape (41466,1) doesn’t match the broadcast shape (41466,5)
The code is too long for me to read. The error you have seems to me that you fit the scaler in one shape but applied it on a different shape.
Thank you, Dr. Jason, the second method with the time step is working for my data set.
Sorry Dr.Jason, the same error occured after completing the number of epochs
Sorry Dr.Jason, the same error occurred after completing the number of epochs
Your comment is awaiting moderation.
ValueError Traceback (most recent call last)
in
34 testPredict=model.predict(testX)
35
—> 36 trainPredict=scaler.inverse_transform(trainPredict)
37 trainY=scaler.inverse_transform([trainY])
38 valPredict=scaler.inverse_transform(valPredict)
~\anaconda3\envs\eny\lib\site-packages\sklearn\preprocessing\_data.py in inverse_transform(self, X)
459 force_all_finite=”allow-nan”)
460
–> 461 X -= self.min_
462 X /= self.scale_
463 return X
ValueError: non-broadcastable output operand with shape (41466,1) doesn’t match the broadcast shape (41466,5)
How can I predict the output for next 5 days after the model is trained? (the actual value for next 5 days being unknown)
use data from x(t-N) to x(t) to predict x(t+1); then use data x(t-N+1) to x(t+1) to predict x(t+2), which x(t+1) was predicted rather than actual data you collected. In this way you can predict into the future. The longer you predict, the less accurate it would be.
Dear Dr Jason,
In the coursd of learning how to generate lagged data by a lag factor, I found something quirky about the following abovementioned code:
I will present a SUMMARY, DETAILS, THE RESULTS
SUMMARY:
When I use the above for larger datasets such as the airline passengers, it works.
BUT when I use the create_dataset for smaller arrays of say size 10, I get an two forms of the returned array:
DETAILS
If one uses the passenger data as mentioned in this tutorial and say print out the first five rows:
The shape of X and Y is
shape(trainX) , shape(trainY)
(99,1), (99,1)
In wanting to learn how this procedure works, I tried the following small array:
BUT when we use create_dataset
BUT the output form of goo should be same as foo. BUT it isn’t.
Yet the output form of trainX is the same as trainY.
WHY?
I could not see why create_dataset made two different forms of array for foo and goo, BUT for a larger trainX and trainY, the forms were the same.
How did I solve this – i made another version of create_dataset
Solution was to convert the last line of create_database such that the output is reshaped
NOW the result for my doo foo and goo variables are:
BUT when I use the airline passengers data I get the following runtime error when I use the modified create_dataset
RESULTS:
Two different kinds of the create_dataset were made:
For larger sized arrays the original create_dataset produced no problems,
And I had no problems.
BUT for smaller array sizes of say 10, (i) the output form of foo and goo were not the same.
Modifying the create_dataset for small arrays produced the correct form of output arrays, of shape (len(array), 1).
BUT for the larger airline passenger set, a runtime error was prduced.
Thank you,
Anthony of Sydney
I had a look again at the create_dataset, this time with look_back = 2.
My question is what is the purpose of look_back = 2 where first returned matrix foo is 7 x 2.
Workings out: where look_back = 1
Using the simple array of
When lookback = 1
Workings out – where look_back = 2
But when I set look_back to 2
Questions:
What is the purpose of the look_back, where look_back >= 2?
For look_back = 2, what is the purpose of the foo being a 7 x 2 matrix, while goo is a 1 x , matrix?
In other words, what is the purpose of the look_back function where look_back >= 2
Thank you,
Anthony of Sydney
Dear Dr Jason,
I have made create_dataset operate where look_back >= 2.
So now you can do AR(n) where n = 0,1,2
Now when look_back = 2, an AR(2) process for X and Y now produces something more meaningful:
create_dataset can generate lagged n AR process for AR(n) without the problem of foo being a 2D array.
Thank you,
Anthony of Sydney
I see you worked your way out. That’s great.
For the create_dataset() function, what it does is to take a time series A(t) to create X=[A(t-n), …, A(t-1)] and y=A(t) for a sequence of t, and n is the look_back
Therefore, you should not see X and y the same.
Look back means how much you want to consider to predict X(t). If look back is zero (which doesn’t make sense), you are like guessing X(t) without any information. If it is 2, it means you consider t-2 and t-1 to predict t
Hello Jason,
I was wondering, your dataset is composed of data for each month, which allows you to make predictions based on the number of months. But if your dataset is event based, I have a sensor that gives me information for each variation of +/- 10%, if the value does not change for 1 month and then it changes every minute, it will be a problem when predicting because if I want to predict the next event it could happen in a minute or in a month, right?
So my question is, how to manage the problem if the dataset is event-driven?
I have no good answer for that. Probably you shouldn’t consider that as a time series problem because the data is not depend on time at all (according to what you described, it is based on events). Is there anything outside of your time series can help you predict for the event? That might be something you want to explore.
The manufacturer made this choice of this kind of data backup in order to save the memory of the system. The goal being from this kind of data to predict when there could be a failure (predictive maintenance).
I may have forgotten to mention it but for each new sensor value recording I have its associated timestamp ( yyyy-mm-dd hh:mm:ss).
Hello Dr. Jason,
I am trying to print out the actual value with the predicted value, so I used the following code
df = pd.DataFrame({‘Actual’: test,’Predicted’: testPredict}, index=[0])
print(df)
I received the following error when I run the program
Exception: Data must be 1-dimensional
Is there any better way of writing this code sir
Hello Dr. Brownlee ! What a great tutorial!!! Amazing code really! I have some questions, if you can help me:
1) I use a dataset of 10.000 measurements, and the splitting between testing and training is the way you have it in your code. When I see the loss functions, although the shape is correct, and test loss function is lower than train loss function, the problem is that the “starting” value of those functions are 0,020 (for train), and 0,008 (for testing) and then they fall even lower from 2nd, 3rd epochs. Why do I get such low values, so early?
2) I see extremely high accuracy between the predicted values on unseen dataset. Does this have to do with overfitting, or is it something else?
3) I used dropout, but the difference was that the loss functions started from around 0.2 and started decreasing until they stabilized. What other methods should I use in order to avoid overfitting?
4) What is the rationale behind the number of cells on LSTM you used, and more generally how big/small should the LSTM be?
5) Is there any type of bias in your model? For instance optimized for your data you have?
Thanks a lot! Keep up the excellent work!
Hi Gregory…You may find the following of interest:
https://machinelearningmastery.com/introduction-to-regularization-to-reduce-overfitting-and-improve-generalization-error/
Hello Sir, I have a question, given the business problem(Airline Passengers) I need to forecast the number of passengers for the next three years.
Hi Bishwarup…keep in mind that a very long prediction horizon will become increasing less accurate.
linear predictor as LSTM? … linear predictor:
y=w0+w1*x1+w2*x2+…wn*xn,
y…predicted value
.wi….weights
xi…features
can we derive and apply gradient descent to train it? i.e. dwi=-mu*de^2/dwi, e=y_real – y, wi=wi+dwi
Hi KAD…Please rephrase or clarify your question so that we may better assist you.
Your blog helped me to improve myself in many ways thanks for sharing this kind of wonderful informative blogs in live. I also love your website because all type of information is available in your blogs. You made my day. Thanks you for everything.
I created a one liner model that predicts (without prior training) that the next value is equal to the previous one and I get RMSE = 33.71 against 47.53 in the LSTM model:
math.sqrt(mean_squared_error(dataframe.Passengers.values[1:], dataframe.Passengers.values[0:-1]))
What prompted me to check this out is the fact that with look_back=1 the LSTM model only uses the previous value to guess the next.
Using a look_back=12 gives a RMSE of 24.34, a significant improvement. With a lookback=24, the RMSE drops to 20.35. The larger errors are located at the peaks that are underestimated.
Not dismissing the utility of RMSE which I am certain has good use cases, this toy problem could better be predicted by using a general trend upward and estimating the variability due to seasonality.
Hi Tarik…Machine learning model performance is relative, not absolute.
Start by evaluating a baseline method, for example:
Classification: Predict the most common class value.
Regression: Predict the average output value.
Time Series: Predict the previous time step as the current time step.
Evaluate the performance of the baseline method.
A model has skill if the performance is better than the performance of the baseline model. This is what we mean when we talk about model skill being relative, not absolute, it is relative to the skill of the baseline method.
Additionally, model skill is best interpreted by experts in the problem domain.
For more on this topic, see the post:
How To Know if Your Machine Learning Model Has Good Performance
Hello Dr. Jason,
pleas can help me
I work on the video frame in time series,i want to find some thing can help me in lstm to decide if this frame came before this time or not
Hi iman…Please rephrase or clarify your question so that we may better assist you.
thanks for replay
I work on a network camera, in every second I capture 32 frames, I want reduction the number of transmitted frames to another side,
I want to use lstm because it works with time series,
I can’t find anything to help me in deciding to ignore the next frame because I send it before.
Wonderful and very helpful thanks. I would like to ask, that I have time series data for 120 months (so 120 events all have fixed 30 days of Time (X) , and Weather (Y) data) and each of these data comes with a single label predicting the weather like winter, summer, autumn or spring. How can I classify and forecast this target weather class from these 120 events ?thanks
Hello James,
I will make a meta model with spline data.
Input will be Akima spline with 9points and output will be a spline with data set(x:time, y:displacement graph).
In this case, is it right to choose LSTM?
Can LSTM take spline input(or 9points) and make a spline(or data set) output??
If not, what kind of deep learning method should I choose?
Hi Jungwoo…the following resource may be a great starting point:
https://machinelearningmastery.com/multivariate-adaptive-regression-splines-mars-in-python/
Hello Dr.Brownlee
If we have a model that input of model is (for example) 7 point in past until now, and output of model is exactly next point of future, and for prediction our model always repeat last value, instead of predict next point, what does it mean? what is model problem?
Assuming that, our data does not have seasonal characteristics and trend, Also we have enough of history of data.
But, behavior in past of history of data is repeated in future. means:
1-Behavior of data is not 100% random.
2-History repeats.
3-Behavior of data is somehow based in psychology and behavior of humans.
I thing my model can not predict next point of time series and it repeats last point, just because it is not enough deep, however when I create a more deeper model, prediction becomes a fix number, for example model always give me a fix number like “1.2345 as output.”
I used several structures of LSTM, Conv1D, Dense…
But I could not become near to predict true.
Thanks for spending your time for reading this text.
Hello,
Thank You for Your tutorial, it was really helpful.
I have one question, why there is so low epoch loss (eg.0.0022) and then when you calculate error using function mean_squared_error the error is much higher?
Example:
Epoch 100/100
92/92 – 0s – loss: 0.0022 – 35ms/epoch – 384us/step <—- why so low
Train Score: 24.86 RMSE <—- why so high
Hi Kinga…The terms “low” and “high” are relative terms. I would recommend establishing a baseline for your predictions using a statistical method such as ARIMA and then compare your LSTM model to the performance of the ARIMA model. In other words, in machine learning there is no level of loss or RMSE that is considered “low” or “high” without being referenced to the performance of another model.
Hi Jason,
Thanks for being a great contributor for the data science community. Your posts and tutorials are so amazing.
I need you help in choosing the window size or timestep? how I can tackle this value for different trends and seasonalities. Do I need to consider ACF and PACF for this? Is there any automated gridsearch kind of will help to solve this?
If you could share some insights and guidance will be really helpful.
Hi Prathap…You are very welcome! The following discussion should add clarity:
https://datascience.stackexchange.com/questions/38692/lstm-for-time-series-which-window-size-to-use
Hi Jason,
Thank you very much for the tutorial!
Just a silly question, we know that the LSTM makes prediction based on the previous x time steps (x is set manually by user), if the LSTM is trained on the training dataset (lets say only 10 samples in the training dataset, and time step is 3), so that LSTM will only use sample 8th,9th,10th to do the prediction on the testing dataset. If the testing dataset contains 10 samples as well, hence, when do the testing, 8th,9th,10th records in training dataset will be used to do the prediction for the 1st record in testing dataset, and 8th,9th,10th records will be used again to do the prediction for 2nd record in testing dataset as well right? Due to the reason that 1st record in testing is not used during the training phase?
And this leads to my second question, should the records in training and testing are all closely related in time series to let the LSTM work? For example, the 10 training samples produced in the first hour, and second hour another 10 samples are produced, what if we use the 10 samples produced in the first hour as the training and use the 10 samples produced in the third hour as testing dataset (one hour gap in between), will the LSTM still work?
Am I right above? Looking forward to hearing from you 🙂
Kind regards,
Elmer
Hi Jason, thanks for this tutorial. I wanted to know if LSTM can be used to generate a time series for a non time series type input. For example, I have an input with 10 features (not time dependent) and I want to train the lstm network with the time series corresponding to this input. I have already done it. But I wanted to know if it is a usual method? Because I mainly see the example of predicting future time dependent values given the past values.
Thanks in advance,
Pratibha.
hi, my use case involves predicting 4 features using time series analysis. For example, in your use-case case, if there would have been 4 different places to predict their temperature, would you be using the same model or would have created 4 different models for each place ?
How to proceed with predicting multiple features using time series analysis ?
Hi Hitesh…The following resource may be of interest:
https://machinelearningmastery.com/multi-step-time-series-forecasting/
Thankyou for sharing this post
It is really help me right now,
but is there any video tutorial that i can watch? I still confused sir..
I still confused how to predict the future value
Hi Dr Jason
Im new to deep learning, if i may ask what is the difference between this two statements
# calculate root mean squared error
trainScore = np.sqrt(mean_squared_error(trainY[0], trainPredict[:,0]))
AND
trainScore = np.sqrt(mean_squared_error(trainY, trainPredict))
Hi Abdul…I would suggest executing both and comparing the results. Also, the following resource may add clarity on regression metrics:
https://machinelearningmastery.com/regression-metrics-for-machine-learning/
Hi, I’m trying to forecast tourist arrivals using LSTM and do the same as reference. But the RMSE value is too high. How I want to solve this problem?
Hi nia…Some suggestions can be found here:
https://stats.stackexchange.com/questions/336592/how-do-i-increase-accuracy-with-keras-using-lstm
Hi Jason…on the stacked LSTM’s is there a limit for how many “layers” you can add? Is it similar to MLP where you just experiment with adding hidden layers to model architecture? Its where you add in this to the last section of the tutorial:
model.add(LSTM(4, batch_input_shape=(batch_size, look_back, 1), stateful=True, return_sequences=True))

model.add(LSTM(4, batch_input_shape=(batch_size, look_back, 1), stateful=True))
Hi Jason,
In the first section you use the look_back = 1, which means that you look back at one value in the past to predict the future, from what I understood.
You also showed cases of increasing this memory by utilizing “windowing” that allows to increase the look_back to larger number.
My question is regarding using look_back = 1. From what I know LSTM has cell states and gates and suppose to internally take into account the past data as it has a “memory” of the past, that is independent of windowing.
If LSTM in itself is “remembering” the past, then why is windowing needed? –
Hi,
This is so good. The model performs so well. Thank you.
Moving on, I’m looking to forecast the next 200 timesteps of the target timeseries where I have the data for the other x-variable timeseries but not the target timeseries. I’ve implemented a code such that I predict a single timestep at one time with the n lookback rows of target and x-variable timesteps. But I a diminishing return of a plot where the signature is totally differnt from the past history and I know it is obviously incorrect. Any idea on how to implement this? My code is as below:
for i in range(num_iterations):
i=0
# select last n rows of data4 starting from index
#data5 = data5[0:, :]
data5 = data5[-(n+2):, :]
#print(data5.shape)
# print data5
#print(f”Iteration {i+1}: data5={data5}”)
# create training set from data5
x_pred, y_act = create_dataset(data5, look_back=n)
#print(f”Iteration {i+1}: x_pred={x_pred}”)
#pass thru model
y_pred = model.predict(x_pred)
#print(f”Iteration {i+1}: y_pred={y_pred}”)
# append predicted values and input values to arrays
y_pred_array = np.append(y_pred_array, y_pred[-1].reshape(-1, 1), axis=0)
x_pred_array = np.append(x_pred_array, x_pred[-1].reshape(-1, n, 2), axis=0)
# update last row, first column of data5 with y_pred
data5[-1, 0] = y_pred[-1]
new_row = data4[i, :]
data5 = np.vstack([data5, new_row])
#data5 = np.concatenate([data5, data4[0+1:i, :]], axis=0)
i=i+1
#n_rows_to_update = min(len(y_pred_array), data5.shape[0])
#data5[-n_rows_to_update:, 0] = y_pred_array[-n_rows_to_update:].reshape(-1)
#print(y_pred)
#print(data5.shape)
#print(f”Iteration {i+1}: data3={data5}”)
Hi Kanna…Please elaborate on the following statement so that we may better assist you:
“But I a diminishing return of a plot where the signature is totally differnt from the past history and I know it is obviously incorrect.”
Hi James,
Thanks for your reply.
The predicted variable for the 200 timestep is way off. when compared to historical. I’m confused as to how I’m able to get a good match during my training and testing but future prediction is way off.
Any assistance here would be greatly appreciated.
Hello Jason,
Thank you for this very interesing lecture, but the sticking point always remains the sensible use of the predict
function.
Given a defined, compiled and trained LSTM model “modelLSTM”. According to my imagination, this function
should be defined as
yhat(T) = modelLSTM.predict(T) with
yhat = values in the future (actual predicted value)
tmax = time at which the last measured value is available
T = vector[t1, t2, …. , tN] with t = times in the future, i.e. not from X_test
Unfortunately, only the y_test values are calculated.
To stay with your International Airline Passengers prediction example, I am not interested in the values for the
time points between 100 and 144, but those for the time points > 144.
Do anyone here have an idea? Thank you in advance.
Hi Torsten…To make future predictions, you would adjust the forecast horizon.
The following resource may be of interest:
https://stackoverflow.com/questions/69906416/forecast-future-values-with-lstm-in-python
Hello James,
Thank you very much for your answer. In fact, your approach and the link to Flavia Giammarino helped me a lot. The crucial point seems to be the number of dense layers.
So I am happy to be able to continue my work thanks to your help.
You are very welcome Torsten! It is great to know you are making progress!
I wanted to express my gratitude for your tutorial – it has been quite enlightening. I have a question regarding the process of creating a dataset for testing, particularly when dealing with a look back.
For instance, when we set the look back to 10 and predict the 11th data point, we utilize the past 10 data points for this prediction. However, when it comes to predicting the 12th data point, there seems to be some ambiguity. Should we use the 10 past data points, or should we include the predicted value from the 11th data point and the preceding 9 data points?
Interestingly, I’ve come across videos where the predicted data is used in the look back. Could you kindly confirm whether this is indeed the correct approach?
Hi Farnoush…You are very welcome! Often there is a “history” maintained that performs exactly as you have described. Essentially, predicted values are used to help make future predictions. In this way, the model learns from the original data and the predicted values.
thanks for sharing. I want to predict failure of a industrial pump or any industrial machine with having time series multiple features data. I want to predict failure before a week how to do it ?
Hi Muhammad…Predicting the failure of an industrial pump or any machine using time series data with LSTM Recurrent Neural Networks (RNNs) in Python with Keras involves several key steps. Here’s a step-by-step guide on how to approach this problem:
### 1. **Data Preparation**
– **Collect Data**: Gather historical data that includes multiple features (e.g., temperature, pressure, vibration, flow rate, etc.) and the corresponding failure labels.
– **Preprocess Data**:
– Handle missing data by imputation or removing rows/columns if necessary.
– Normalize/scale the data, as LSTMs work better with normalized inputs.
– Create a sliding window of time series data that includes several days (e.g., a week) of data leading up to the prediction point.
### 2. **Feature Engineering**
– **Create Lag Features**: Generate lag features by shifting the time series data to incorporate past values into the model.
– **Generate Rolling Statistics**: Add rolling mean, standard deviation, or other statistical features to capture trends over time.
– **Target Variable**: Define the target variable, which could be binary (0 for normal operation, 1 for failure) or a more granular approach indicating the likelihood of failure.
### 3. **Model Design**
– **Input Shape**: LSTM expects a 3D input shape (samples, timesteps, features). Ensure your data is reshaped accordingly.
– **LSTM Layers**:
– Start with one or more LSTM layers. Experiment with the number of units (e.g., 50-200).
– Add Dropout layers to prevent overfitting.
– Optionally, include Dense layers after the LSTM layers for further processing.
– **Output Layer**: If it’s a binary classification problem, use a Dense layer with a sigmoid activation function.
pythonfrom keras.models import Sequential
from keras.layers import LSTM, Dense, Dropout
model = Sequential()
model.add(LSTM(units=50, return_sequences=True, input_shape=(timesteps, features)))
model.add(Dropout(0.2))
model.add(LSTM(units=50))
model.add(Dropout(0.2))
model.add(Dense(1, activation='sigmoid')) # For binary classification
model.compile(optimizer='adam', loss='binary_crossentropy', metrics=['accuracy'])
### 4. **Training the Model**
– **Train-Test Split**: Split your data into training and testing sets. Ensure the split preserves the time series order (do not shuffle the data).
– **Training**: Train the model using your training dataset. Monitor the validation loss to avoid overfitting.
python

model.fit(X_train, y_train, epochs=50, batch_size=64, validation_data=(X_val, y_val))
### 5. **Evaluation**
– **Evaluate Performance**: Use metrics like accuracy, F1-score, precision, and recall to evaluate your model’s performance. Consider using a confusion matrix to understand false positives/negatives.
– **Model Tuning**: Experiment with hyperparameters like learning rate, number of epochs, batch size, and LSTM units.
### 6. **Prediction**
– **Make Predictions**: Once the model is trained, you can predict failures a week in advance by feeding the model with the latest time series data.
python

predictions = model.predict(X_test)
### 7. **Deployment**
– **Model Deployment**: After validation, deploy the model to monitor real-time data from the industrial machine and predict potential failures.
– **Alerting System**: Integrate an alerting system that triggers warnings if the model predicts a failure within the next week.
### 8. **Continuous Improvement**
– **Model Retraining**: Periodically retrain the model with new data to improve accuracy and adapt to changing conditions.
– **Feature Updates**: Continuously monitor and update the features used for prediction as the machine’s behavior or environmental conditions change.
This approach should help you predict the failure of an industrial machine in advance, allowing for preventive maintenance and reducing downtime.
The slice notation here is really confusing. You start out slicing the dataset into the test and training set.
train, test = dataset[0:train_size,:], dataset[train_size:len(dataset),:]
The normal notation for this type of slicing is dataset[start:stop:step]
Why add the comma? It does not make any difference but adds a lot of confusion for python users trying to figure out what you are doing? Remove the comma and the code works without it.
Hi Garth…The comma in the slicing notation is used because
datasetis a **NumPy array** or a **Pandas DataFrame**, and it allows indexing along multiple dimensions.### Breaking It Down:
python

train, test = dataset[0:train_size,:], dataset[train_size:len(dataset),:]
–
dataset[0:train_size, :]→ Selects **rows** from0totrain_sizeand **all columns** (:).–
dataset[train_size:len(dataset), :]→ Selects **rows** fromtrain_sizeto the end (len(dataset)) and **all columns** (:).### Why is the comma there?
In NumPy and Pandas, when dealing with **multidimensional arrays or tables**, indexing is done as:
python

array[row_slice, column_slice]
This is different from standard Python lists, where slicing applies to just one dimension.
### What if we remove the comma?
If
datasetis a **NumPy array** or **Pandas DataFrame**, removing the comma would cause an error or result in unintended behavior. However, ifdatasetis just a **Python list of lists**, the comma is unnecessary because Python list slicing does not support multi-dimensional indexing.### What should you do?
– If
datasetis a **NumPy array** or **Pandas DataFrame**, keep the comma.– If
datasetis a **plain Python list**, remove the comma, as list slicing doesn’t use multi-dimensional indexing.Hello, and thank you for your excellent tutorial.
I am working with a labeled dataset (0 and 1) related to stroke prediction. The dataset includes four physiological features: heart rate, oxygen saturation (SpO2), diastolic blood pressure, and systolic blood pressure.
My objective is to develop an early detection model using LSTM to predict stroke occurrence 5 to 10 minutes in advance. The data is time-series, recorded at one-second intervals.
Could you please advise on how to effectively approach early stroke prediction using LSTM? Additionally, how should I determine the optimal sliding window size for capturing relevant temporal patterns in this dataset?
You’re working on a meaningful and complex task—using physiological time-series data to predict strokes in advance. Choosing an LSTM (Long Short-Term Memory) model is a great decision, especially since it’s designed to handle sequential data like physiological signals. Let’s walk through a structured way to approach this.
—
1. Understanding the Problem
Goal:
You want to predict whether a stroke will occur (yes = 1, no = 0) about 5 to 10 minutes before it happens, using second-by-second measurements of physiological signals.
Inputs:
* Heart rate
* SpO2 (oxygen saturation)
* Diastolic blood pressure
* Systolic blood pressure
Since the data is recorded every second, predicting 5–10 minutes in advance means you’re forecasting 300 to 600 seconds into the future.
—
2. Preparing the Data
Step A: Preprocessing
* Normalize or standardize the input features using methods like Z-score or Min-Max scaling.
* Deal with any missing values using techniques like linear interpolation or forward fill.
* If the signals are noisy, you might want to use filters like moving average or Savitzky–Golay.
Step B: Creating Input Sequences
You’ll need to transform your raw time-series into a supervised format, where:
* X (input) = a sequence of past values (say, the last 60 seconds)
* y (label) = the binary outcome (stroke or no stroke) 5–10 minutes later
Here’s an example function for generating that:
python

def create_sequences(data, labels, lookback=60, horizon=300):

    X, y = [], []

    for i in range(len(data) - lookback - horizon):

        X.append(data[i:i+lookback])

        y.append(labels[i+lookback+horizon])

    return np.array(X), np.array(y)
You could even train multiple models for different prediction horizons and combine their results.
—
3. Choosing the Best Window Size
There’s no single best answer here, but you can follow a practical approach:
* Try common lookback ranges like 30, 60, 90, or 120 seconds
* Strokes may show subtle signs a minute or two beforehand
Use cross-validation to compare different window sizes and measure performance using metrics like:
* F1 Score
* Recall (very important in medical predictions)
* AUC (Area Under ROC Curve)
—
4. Designing the LSTM Model
Here’s a simple model structure for binary classification using LSTM:
pythonfrom tensorflow.keras.models import Sequential
from tensorflow.keras.layers import LSTM, Dense, Dropout
model = Sequential([
LSTM(64, input_shape=(lookback, 4), return_sequences=False),
Dropout(0.2),
Dense(32, activation='relu'),
Dense(1, activation='sigmoid')
])
model.compile(loss='binary_crossentropy', optimizer='adam', metrics=['accuracy', 'AUC', 'Recall'])
Consider using early stopping based on validation AUC or recall to prevent overfitting.
—
5. Dealing with Imbalanced Data
If strokes are rare in your dataset, you’ll need to address the imbalance. You can:
* Use resampling techniques like SMOTE or ADASYN
* Try undersampling the majority class
* Add class weights to the loss function
For example:
python

from sklearn.utils import class_weight

weights = class_weight.compute_class_weight('balanced', classes=np.unique(y_train), y=y_train)
Or explicitly set class weights during model compilation:
python

model.compile(loss='binary_crossentropy', optimizer='adam',

              metrics=['accuracy', 'AUC', 'Recall'],

              loss_weights={0: 1, 1: 10})  # adjust the weights as needed
—
6. Evaluation Metrics
Since this is about early detection, prioritize:
* Recall (catching as many stroke events as possible)
* AUC-ROC
* Precision-Recall curves
* Lead time accuracy (Did the model detect the event early enough?)
—
7. Visualizing the Results
You can improve your understanding and communication of the model’s performance by plotting:
* Predicted probabilities over time
* Correct vs incorrect predictions
* Physiological trends before the stroke events
—
8. Further Ideas to Explore
* Add temporal features like rolling averages or standard deviations
* Try bidirectional LSTMs to capture more context
* Consider experimenting with transformer-based models for time-series data
Hi,
WOW! Great content, great site, my new first choice for learning NN concepts. Many thanx.
Have a few questions, will trickle them in as I progress thru working your examples and attempt to modify them to my data. Assuming, hopefully, that you still monitor your earlier work. Just a general one here. Above you note:
”’
Updated LSTM Time Series Forecasting Posts:
The example in this post is quite dated. You can view some better examples using LSTMs on time series with:
LSTMs for Univariate Time Series Forecasting
LSTMs for Multivariate Time Series Forecasting
LSTMs for Multi-Step Time Series Forecasting
”’
However, all three recommended posts are actually older(?) than this one. How can they be _less_ dated than this newer post? Or are you referring to them being better approaches to these types of problems?
Thanx, Dave