A prediction from a machine learning perspective is a single point that hides the uncertainty of that prediction.
Prediction intervals provide a way to quantify and communicate the uncertainty in a prediction. They are different from confidence intervals that instead seek to quantify the uncertainty in a population parameter such as a mean or standard deviation. Prediction intervals describe the uncertainty for a single specific outcome.
In this tutorial, you will discover the prediction interval and how to calculate it for a simple linear regression model.
After completing this tutorial, you will know:
- That a prediction interval quantifies the uncertainty of a single point prediction.
- That prediction intervals can be estimated analytically for simple models, but are more challenging for nonlinear machine learning models.
- How to calculate the prediction interval for a simple linear regression model.
Kick-start your project with my new book Statistics for Machine Learning, including step-by-step tutorials and the Python source code files for all examples.
Let’s get started.
- Updated Jun/2019: Corrected significance level as a fraction of standard deviations.
- Updated Apr/2020: Fixed typo in plot of prediction interval.

Prediction Intervals for Machine Learning
Photo by Jim Bendon, some rights reserved.
Tutorial Overview
This tutorial is divided into 5 parts; they are:
- What Is Wrong With a Point Estimate?
- What Is a Prediction Interval?
- How to Calculate a Prediction Interval
- Prediction Interval for Linear Regression
- Worked Example
Need help with Statistics for Machine Learning?
Take my free 7-day email crash course now (with sample code).
Click to sign-up and also get a free PDF Ebook version of the course.
Why Calculate a Prediction Interval?
In predictive modeling, a prediction or a forecast is a single outcome value given some input variables.
For example:
|
1 |
yhat = model.predict(X) |
Where yhat is the estimated outcome or prediction made by the trained model for the given input data X.
This is a point prediction.
By definition, it is an estimate or an approximation and contains some uncertainty.
The uncertainty comes from the errors in the model itself and noise in the input data. The model is an approximation of the relationship between the input variables and the output variables.
Given the process used to choose and tune the model, it will be the best approximation made given available information, but it will still make errors. Data from the domain will naturally obscure the underlying and unknown relationship between the input and output variables. This will make it a challenge to fit the model, and will also make it a challenge for a fit model to make predictions.
Given these two main sources of error, their point prediction from a predictive model is insufficient for describing the true uncertainty of the prediction.
What Is a Prediction Interval?
A prediction interval is a quantification of the uncertainty on a prediction.
It provides a probabilistic upper and lower bounds on the estimate of an outcome variable.
A prediction interval for a single future observation is an interval that will, with a specified degree of confidence, contain a future randomly selected observation from a distribution.
— Page 27, Statistical Intervals: A Guide for Practitioners and Researchers, 2017.
Prediction intervals are most commonly used when making predictions or forecasts with a regression model, where a quantity is being predicted.
An example of the presentation of a prediction interval is as follows:
Given a prediction of ‘y’ given ‘x’, there is a 95% likelihood that the range ‘a’ to ‘b’ covers the true outcome.
The prediction interval surrounds the prediction made by the model and hopefully covers the range of the true outcome.
The diagram below helps to visually understand the relationship between the prediction, prediction interval, and the actual outcome.
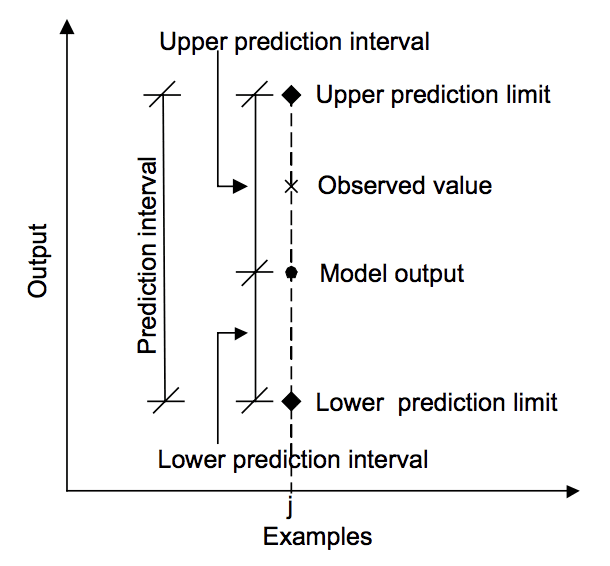
Relationship between prediction, actual value and prediction interval.
Taken from “Machine learning approaches for estimation of prediction interval for the model output”, 2006.
A prediction interval is different from a confidence interval.
A confidence interval quantifies the uncertainty on an estimated population variable, such as the mean or standard deviation. Whereas a prediction interval quantifies the uncertainty on a single observation estimated from the population.
In predictive modeling, a confidence interval can be used to quantify the uncertainty of the estimated skill of a model, whereas a prediction interval can be used to quantify the uncertainty of a single forecast.
A prediction interval is often larger than the confidence interval as it must take the confidence interval and the variance in the output variable being predicted into account.
Prediction intervals will always be wider than confidence intervals because they account for the uncertainty associated with e [error], the irreducible error.
— Page 103, An Introduction to Statistical Learning: with Applications in R, 2013.
How to Calculate a Prediction Interval
A prediction interval is calculated as some combination of the estimated variance of the model and the variance of the outcome variable.
Prediction intervals are easy to describe, but difficult to calculate in practice.
In simple cases like linear regression, we can estimate the prediction interval directly.
In the cases of nonlinear regression algorithms, such as artificial neural networks, it is a lot more challenging and requires the choice and implementation of specialized techniques. General techniques such as the bootstrap resampling method can be used, but are computationally expensive to calculate.
The paper “A Comprehensive Review of Neural Network-based Prediction Intervals and New Advances” provides a reasonably recent study of prediction intervals for nonlinear models in the context of neural networks. The following list summarizes some methods that can be used for prediction uncertainty for nonlinear machine learning models:
- The Delta Method, from the field of nonlinear regression.
- The Bayesian Method, from Bayesian modeling and statistics.
- The Mean-Variance Estimation Method, using estimated statistics.
- The Bootstrap Method, using data resampling and developing an ensemble of models.
We can make the calculation of a prediction interval concrete with a worked example in the next section.
Prediction Interval for Linear Regression
A linear regression is a model that describes the linear combination of inputs to calculate the output variables.
For example, an estimated linear regression model may be written as:
|
1 |
yhat = b0 + b1 . x |
Where yhat is the prediction, b0 and b1 are coefficients of the model estimated from training data and x is the input variable.
We do not know the true values of the coefficients b0 and b1. We also do not know the true population parameters such as mean and standard deviation for x or y. All of these elements must be estimated, which introduces uncertainty into the use of the model in order to make predictions.
We can make some assumptions, such as the distributions of x and y and the prediction errors made by the model, called residuals, are Gaussian.
The prediction interval around yhat can be calculated as follows:
|
1 |
yhat +/- z * sigma |
Where yhat is the predicted value, z is the number of standard deviations from the Gaussian distribution (e.g. 1.96 for a 95% interval) and sigma is the standard deviation of the predicted distribution.
We do not known in practice. We can calculate an unbiased estimate of the of the predicted standard deviation as follows (taken from Machine learning approaches for estimation of prediction interval for the model output):
|
1 |
stdev = sqrt(1 / (N - 2) * e(i)^2 for i to N) |
Where stdev is an unbiased estimate of the standard deviation for the predicted distribution, n are the total predictions made, and e(i) is the difference between the ith prediction and actual value.
Worked Example
Let’s make the case of linear regression prediction intervals concrete with a worked example.
First, let’s define a simple two-variable dataset where the output variable (y) depends on the input variable (x) with some Gaussian noise.
The example below defines the dataset we will use for this example.
|
1 2 3 4 5 6 7 8 9 10 11 12 13 14 15 16 17 |
# generate related variables from numpy import mean from numpy import std from numpy.random import randn from numpy.random import seed from matplotlib import pyplot # seed random number generator seed(1) # prepare data x = 20 * randn(1000) + 100 y = x + (10 * randn(1000) + 50) # summarize print('x: mean=%.3f stdv=%.3f' % (mean(x), std(x))) print('y: mean=%.3f stdv=%.3f' % (mean(y), std(y))) # plot pyplot.scatter(x, y) pyplot.show() |
Running the example first prints the mean and standard deviations of the two variables.
|
1 2 |
x: mean=100.776 stdv=19.620 y: mean=151.050 stdv=22.358 |
A plot of the dataset is then created.
We can see the clear linear relationship between the variables with the spread of the points highlighting the noise or random error in the relationship.

Scatter Plot of Related Variables
Next, we can develop a simple linear regression that given the input variable x, will predict the y variable. We can use the linregress() SciPy function to fit the model and return the b0 and b1 coefficients for the model.
|
1 2 |
# fit linear regression model b1, b0, r_value, p_value, std_err = linregress(x, y) |
We can use the coefficients to calculate the predicted y values, called yhat, for each of the input variables. The resulting points will form a line that represents the learned relationship.
|
1 2 |
# make prediction yhat = b0 + b1 * x |
The complete example is listed below.
|
1 2 3 4 5 6 7 8 9 10 11 12 13 14 15 16 17 18 19 |
# simple linear regression model from numpy.random import randn from numpy.random import seed from scipy.stats import linregress from matplotlib import pyplot # seed random number generator seed(1) # prepare data x = 20 * randn(1000) + 100 y = x + (10 * randn(1000) + 50) # fit linear regression model b1, b0, r_value, p_value, std_err = linregress(x, y) print('b0=%.3f, b1=%.3f' % (b1, b0)) # make prediction yhat = b0 + b1 * x # plot data and predictions pyplot.scatter(x, y) pyplot.plot(x, yhat, color='r') pyplot.show() |
Running the example fits the model and prints the coefficients.
|
1 |
b0=1.011, b1=49.117 |
The coefficients are then used with the inputs from the dataset to make a prediction. The resulting inputs and predicted y-values are plotted as a line on top of the scatter plot for the dataset.
We can clearly see that the model has learned the underlying relationship in the dataset.
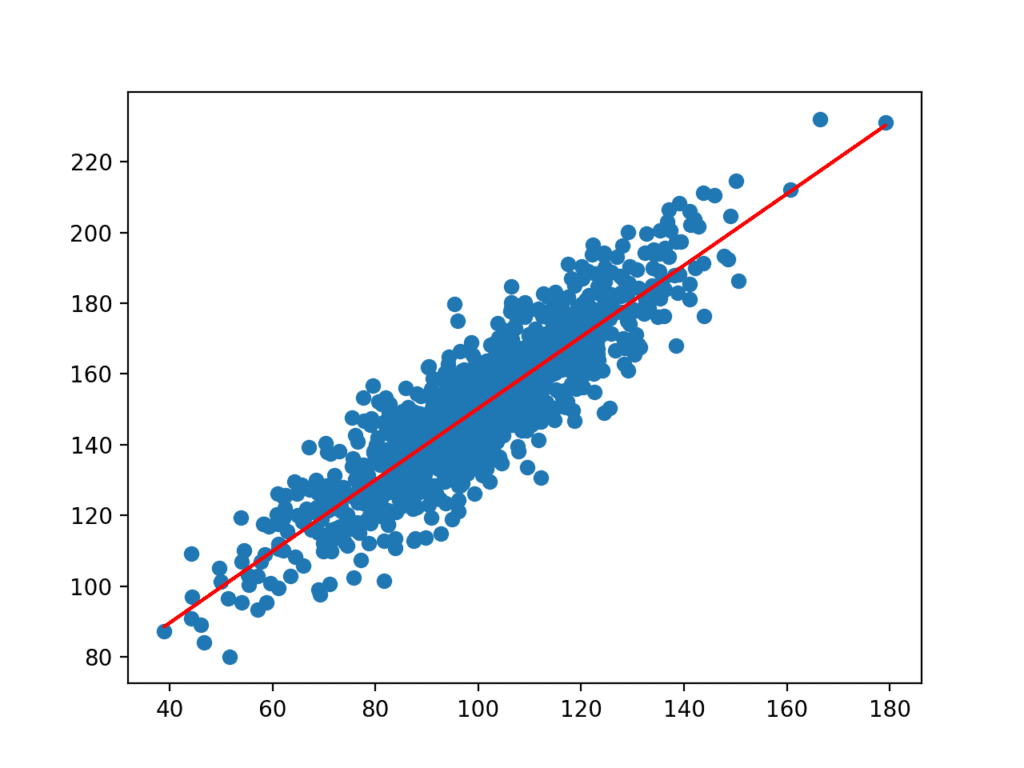
Scatter Plot of Dataset with Line for Simple Linear Regression Model
We are now ready to make a prediction with our simple linear regression model and add a prediction interval.
We will fit the model as before. This time we will take one sample from the dataset to demonstrate the prediction interval. We will use the input to make a prediction, calculate the prediction interval for the prediction, and compare the prediction and interval to the known expected value.
First, let’s define the input, prediction, and expected values.
|
1 2 3 |
x_in = x[0] y_out = y[0] yhat_out = yhat[0] |
Next, we can estimate the standard deviation in the prediction direction.
|
1 |
SE = sqrt(1 / (N - 2) * e(i)^2 for i to N) |
We can calculate this directly using the NumPy arrays as follows:
|
1 2 3 |
# estimate stdev of yhat sum_errs = arraysum((y - yhat)**2) stdev = sqrt(1/(len(y)-2) * sum_errs) |
Next, we can calculate the prediction interval for our chosen input:
|
1 |
interval = z . stdev |
We will use the significance level of 95%, which is 1.96 standard deviations.
Once the interval is calculated, we can summarize the bounds on the prediction to the user.
|
1 2 3 |
# calculate prediction interval interval = 1.96 * stdev lower, upper = yhat_out - interval, yhat_out + interval |
We can tie all of this together. The complete example is listed below.
|
1 2 3 4 5 6 7 8 9 10 11 12 13 14 15 16 17 18 19 20 21 22 23 24 25 26 27 28 29 30 31 32 33 34 35 36 37 |
# linear regression prediction with prediction interval from numpy.random import randn from numpy.random import seed from numpy import power from numpy import sqrt from numpy import mean from numpy import std from numpy import sum as arraysum from scipy.stats import linregress from matplotlib import pyplot # seed random number generator seed(1) # prepare data x = 20 * randn(1000) + 100 y = x + (10 * randn(1000) + 50) # fit linear regression model b1, b0, r_value, p_value, std_err = linregress(x, y) # make predictions yhat = b0 + b1 * x # define new input, expected value and prediction x_in = x[0] y_out = y[0] yhat_out = yhat[0] # estimate stdev of yhat sum_errs = arraysum((y - yhat)**2) stdev = sqrt(1/(len(y)-2) * sum_errs) # calculate prediction interval interval = 1.96 * stdev print('Prediction Interval: %.3f' % interval) lower, upper = yhat_out - interval, yhat_out + interval print('95%% likelihood that the true value is between %.3f and %.3f' % (lower, upper)) print('True value: %.3f' % y_out) # plot dataset and prediction with interval pyplot.scatter(x, y) pyplot.plot(x, yhat, color='red') pyplot.errorbar(x_in, yhat_out, yerr=interval, color='black', fmt='o') pyplot.show() |
Running the example estimates the yhat standard deviation and then calculates the prediction interval.
Once calculated, the prediction interval is presented to the user for the given input variable. Because we contrived this example, we know the true outcome, which we also display. We can see that in this case, the 95% prediction interval does cover the true expected value.
|
1 2 3 |
Prediction Interval: 20.204 95% likelihood that the true value is between 160.750 and 201.159 True value: 183.124 |
A plot is also created showing the raw dataset as a scatter plot, the predictions for the dataset as a red line, and the prediction and prediction interval as a black dot and line respectively.
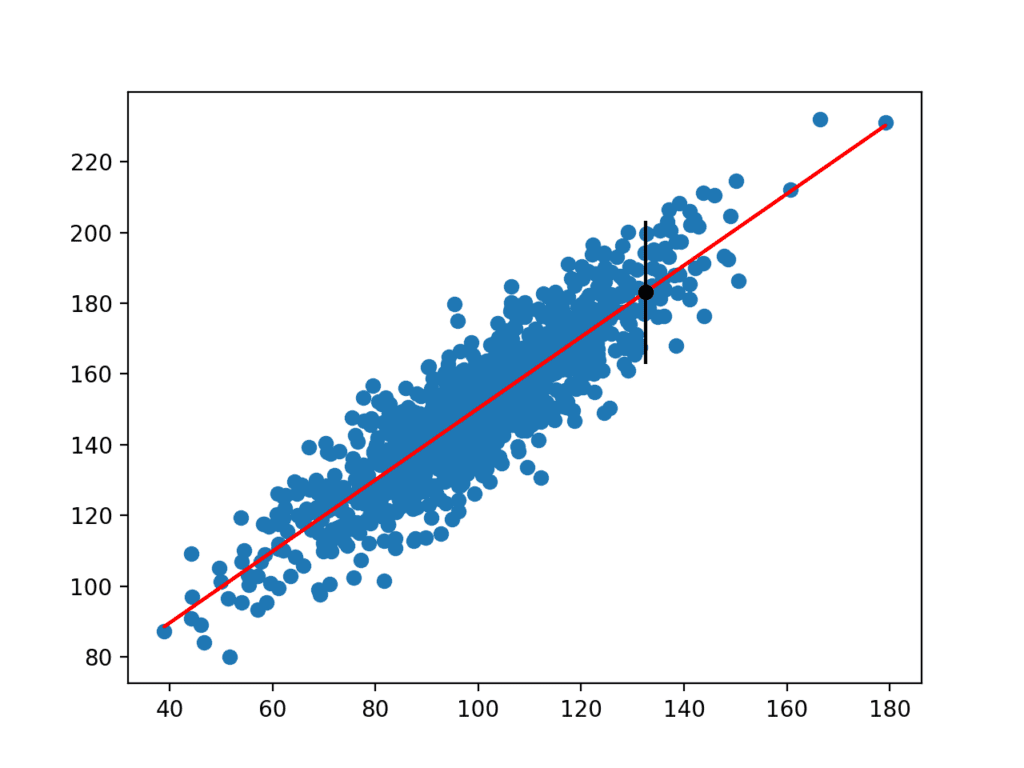
Scatter Plot of Dataset With Linear Model and Prediction Interval
Extensions
This section lists some ideas for extending the tutorial that you may wish to explore.
- Summarize the difference between tolerance, confidence, and prediction intervals.
- Develop a linear regression model for a standard machine learning dataset and calculate prediction intervals for a small test set.
- Describe in detail how one nonlinear prediction interval method works.
If you explore any of these extensions, I’d love to know.
Further Reading
This section provides more resources on the topic if you are looking to go deeper.
Posts
- How to Report Classifier Performance with Confidence Intervals
- How to Calculate Bootstrap Confidence Intervals For Machine Learning Results in Python
- Understand Time Series Forecast Uncertainty Using Confidence Intervals with Python
- Estimate the Number of Experiment Repeats for Stochastic Machine Learning Algorithms
Books
- Understanding The New Statistics: Effect Sizes, Confidence Intervals, and Meta-Analysis, 2017.
- Statistical Intervals: A Guide for Practitioners and Researchers, 2017.
- An Introduction to Statistical Learning: with Applications in R, 2013.
- Introduction to the New Statistics: Estimation, Open Science, and Beyond, 2016.
- Forecasting: principles and practice, 2013.
Papers
- A comparison of some error estimates for neural network models, 1995.
- Machine learning approaches for estimation of prediction interval for the model output, 2006.
- A Comprehensive Review of Neural Network-based Prediction Intervals and New Advances, 2010.
API
Articles
Summary
In this tutorial, you discovered the prediction interval and how to calculate it for a simple linear regression model.
Specifically, you learned:
- That a prediction interval quantifies the uncertainty of a single point prediction.
- That prediction intervals can be estimated analytically for simple models but are more challenging for nonlinear machine learning models.
- How to calculate the prediction interval for a simple linear regression model.
Do you have any questions?
Ask your questions in the comments below and I will do my best to answer.
Get a Handle on Statistics for Machine Learning!

Develop a working understanding of statistics
...by writing lines of code in python
Discover how in my new Ebook:
Statistical Methods for Machine Learning
It provides self-study tutorials on topics like:
Hypothesis Tests, Correlation, Nonparametric Stats, Resampling, and much more...
Discover how to Transform Data into Knowledge
Skip the Academics. Just Results.


Hi
any advice on how to draw prediction intervals for time series in Keras?
I don’t believe they are supported directly.
One of the methods described in this paper may be appropriate:
http://alumnus.caltech.edu/~amir/pred-intv-2.pdf
Inspired by your suggestions for extending your tutorial that I may wish to explore, I wrote some examples of calculating confidence and prediction intervals for linear and non-linear regression models using bootstrap: https://vladgladkikh.wordpress.com/2018/06/08/confidence-and-prediction-intervals-using-the-bootstrap/
Well done, very cool!
Dear Dr Jason,
I have mentioned elsewhere on your blog the difference between pyplot.plot(x,y) and pyplot.scatter(x,y).
This is another example to be careful when performing a scatter plot and a plot of x and y described above].
Lesson be careful when using pyplot.plot(x,y) and pyplot.scatter(x,y) especially when the data is not in time order. I have described this elsewhere on this blog.
Regards
Anthony of Belfield
Indeed.
Thank you for the post.
I ran the code and tried to draw the interval for every data point. Then I realized that the stdev for each data point is same and hence the interval is same for every one of them. There are a few points that I would like to ask you to please elaborate on:
1) naturally we expect higher confidence and subsequently tighter prediction intervals for the regions where there is more density of the training example, so how could this be taken into account?
2) probably the latter relates to the difference between methods for deriving the PI, i.e. frequentist vs Bayesian methods?
3) It feels like the stdev used in the calculation of the interval is meant to be the standard error. was it?
I believe the calculation is correct, you can confirm this independently based on a description on wikipedia:
https://en.wikipedia.org/wiki/Prediction_interval
And in the “forecasting principles”:
https://otexts.org/fpp2/prediction-intervals.html
Although, there are variations on the calculation that you may wish to explore.
Indeed, the standard deviation is supposed to capture a description of density, but it is crude. I would go do for a nonparametric percentile based approach myself in practice as I rarely used linear regression on challenging problems.
Hi Jason,
Thanks for the great article. It illustrates a very important concept.
Can this method be applied to all types of prediction models and not just for linear regression ? In other words, can we plug in any blackbox prediction model and this method of estimating prediction interval will still work ?
However, my intuition is the confidence interval of output yhat should be dependent on the value of input x. Since the density of x in the training data set is different, at least if the blackbox model is KNN, it should be more confident in its estimation when the input x is in a high density region.
I am thinking instead of calculating the stdev using the whole training data set e(i), should we use only a subset of e(j) where j is the neighborhood of the input x. In other words, we extract the neighborhood of input x from our testing data set and use their local stderr to estimate the confidence bound. Does it make more sense ?
Perhaps, if the distribution of the output variable is Gaussian.
Dear Julian,
Thank you for the useful link you provided regarding comparing regression models. Please, I want to make a day ahead prediction, do you have a tutorial in that?
Thak you so much for your efforts.
KJ
This post might help:
https://machinelearningmastery.com/multi-step-time-series-forecasting/
Hi!
Thanks for the great tutorial.
Do you know if there exists any open source implementations of the four methods you mentioned for constructing PIs for non-linear NN models?
(The Delta Method, from the field of nonlinear regression.
The Bayesian Method, from Bayesian modeling and statistics.
The Mean-Variance Estimation Method, using estimated statistics.
The Bootstrap Method, using data resampling and developing an ensemble of models.)
Best regards
I have many examples of the bootstrap method on the blog that you can adapt.
Hi,
Thank you for the tutorial. In the beginning, you state that the prediction interval is the upper prediction limit – lower prediction limit. However, at the end you get a 95% prediction interval of 20 and then associate this with a predicted value ± 20, giving a total interval of 40. Does the calculated prediction interval give you the spread both ways or just one way?
Generally, the interval is centered around the point forecast (e.g. both ways).
so why was that not the case in your example? You received the interval only one way and had to multiply by two to get the total prediction interval.
In the example the interval is symmetric.
Hi Jason,
many thanks for the great post!
Do you have any comment on how to calculate prediction interval at decision tree models, particularly for LightGBM? Any idea will be very helpful.
One unimportant typo : “Gaussian critical value of 1.69”.
Thanks
Thanks, fixed.
A quick and dirty method is to use the standard deviation on the predictions made from multiple parallel models.
Hi Jason,
Thanks for this awesome tutorial!
One question – I noticed you base the interval for 95% confidence on the sum of squared errors for your trainset predictions (i.e. the same y you trained the model on, and the yhat that came out of that training).
To produce confidence intervals which we expect to line up well with predictions on out-of-sample data (i.e. for 95% of true-y to be within our predicted 95% confidence band on out of sample data), I expect we’d want to base the interval bounds on the ssr of the y/yhat for some validation data set held out from training. Would you agree with that approach?
Here, we are calculating a prediction interval (for a point prediction).
If you are interested in a confidence interval (for the model), I recommend this post:
https://machinelearningmastery.com/confidence-intervals-for-machine-learning/
The link for the paper is broken.
Thanks, fixed.
Hi Jason,
I could have found a way to have a percentile estimate with LSTMs trained using Keras for time series forecasting.
I’ve just discovered the possibility to train a model over Quantile Loss functions. In such a way, training 3 models – yeah, this is a drawback – I can have each model predicting a quartile value and thus, have an estimate of my prediction range.
This is the post I read: https://towardsdatascience.com/deep-quantile-regression-c85481548b5a
What are your thoughts about it?
I have not read that post, perhaps contact the author directly?
what happens if noise is not gaussian. I can use qqnorm and find out that my residuals are not gaussian. In that case is my confidence & prediction interval by predict() function still relevant .
If they are nearly gaussian, linear methods may still be useful.
If not, more elaborate or algorithm-specific techniques may be required.
Hi Jason, a great read as always. Thanks for the constant effort and for providing your knowledge freely to the ml community.
I would to ask you whether you know of a similar method to provide confidence level for classification predictions. Does such a concept exist and if so any piece of literature would be much appreciated.
Thank you in advance.
Yes, right here:
https://machinelearningmastery.com/confidence-intervals-for-machine-learning/
Or perhaps, you mean predicting the probability of a class?
This can be achieved via model.predict_proba() in sklearn.
I am probably not expressing it correctly as I do not know if such a concept exists!
Is there a way to provide another metric alongside the prediction output of a classification, that depicts the percentage(or confidence) by which the model produces such output? I am talking about a metric different from accuracy, precision or recall.
As a concept it is discussed on the papers below, I am struggling a little with the comprehension but you will get an idea:
https://arxiv.org/pdf/1706.04599.pdf
https://www.cs.cornell.edu/~alexn/papers/calibration.icml05.crc.rev3.pdf
https://ieeexplore.ieee.org/stamp/stamp.jsp?tp=&arnumber=1262116&tag=1
Moreover, if I may add a very rough example, let’s say we have a dog breed classifier(does not have a “not dog” class, bear with me just for argument’s sake). When someone provides a horse image as input, the classifier will produce a dog breed, most likely comparable to the horse image, but not true in reality. The metric I am trying to talk about is one which would provide a very low confidence on the example above, so as to say that the aforementioned input is far from what the Neural Network knows how to classify. Thus telling to the consumer of the model to not rely on it for that input.
I am sorry for the messy explanation, but it is kind of messy in my head too…
Yes, I believe you want to use the prediction probability, the probability that the input belongs to each class.
Hi,
I think for 95% the Gaussian value should be 1.64 (“We will use the significance level of 95%, which is the Gaussian critical value of 1.96), correct me if I am wrong.
Thanks
Yes, it is not the critical value, it is the number of standard deviations. Fixed.
This may help:
https://en.wikipedia.org/wiki/1.96
Hi Jason!,
How would you evaluate that your prediction intervals are correct?.
What methodology to do that.
Thanks
Great question.
Estimate the prediction intervals for a test dataset. Then confirm that real test values fall within the intervals with the desired distribution.
Isn’t it a biased metric both measuring prediction interval and itself. We decide to std dev by comparing real values and forecasted values. we learn our std dev from real values, am i right? so it gets confusing.
Perhaps try it and see.
Hi Jason,
Nice work! Thanks for the effort!
I am interested in all the extensions listed above. I am wondering if you would add these.
Thanks!
Thanks.
Yes, I hope to get to them in the future.
Thanks Jason 🙂
In case it could be useful…In line 30 the typo has been already fixed, but in line 32 I think the the typo is still there: the true expected value should be ‘y_out’, instead of ‘yhat_out’ (as in the current code).
Nice work! Thanks for your contribution!
Oh man, that was silly.
Thanks! Fixed.
Hello Jason,
could you suggest please if the methods listed by you for non-linear models (delta method, Bayesian method, mean-variance, and bootstrap) can be used for time series problems?
As I understand, the order for time series is crucial so if we do shuffling we will distort the result.
Thanks,
Ros
Not directly. Time series models use customized methods – often built into the lib.
How much minimum and maximum prediction interval and confidence interval (in case of 95% & 97.5%) are accepted in machine learning predicted results?
It is relative to what you can tolerate for your project and what other methods can achieve.
Hello Jason,
Thanks for your valuable and useful posts! They are really helpful and inspiring. I have learnt a lot. Thank you very much for sharing so many interesting things in your blog.
I don’t know if I am wrong, but I think that there is a little typo in the complete code of “Worked example” Section: in lines 30 and 32, variables ‘y_out’ and ‘yhat_out’ should be probably exchanged, since ‘lower’ and ‘upper’ should be computed using ‘yhat_out’ and the true value is ‘y_out’. Please, correct me if I am wrong.
Thanks again, and congratulations for your interesting blog! 🙂
Thanks, fixed!
Hi,
What are good ways to determine prediction intervals for deep learning models such as the LSTM based models you have taught about in other posts.
Also, you have opened up the machine learning world for a lot of people in simple ways. I read two of your books, one on statistics and another machine learning from scratch and they are so straightforward and easy to understand! thank you!! never has my time been spent better in learning!
Thanks!
A good starting point is to fit multiple final models and use them to great a set of predictions from which an interval can be described.
Also, perhaps see the references on this topic in the “further reading” section.
Hello Jason, I’ve spent a lot of time reading your posts. Statistics and probability has always been a subject although being taught on an advanced level many times throughout my education, it’s something I always end up relearning as I never seem to truly internalize its nuance. It is very particular in its language and the declaration/definition of the space where just changing one term can alter the entire meaning of the statement. This makes it difficult.
With that being said, I would really appreciate if you can clarify a process for me. After reading multiple explanations of confidence intervals and standard errors throughout the years, I think I’m starting to internalize it more. However, what it still unclear to me is the correct technique to quantify ‘uncertainty’ of the model. You write here about prediction intervals i.e. the construction of this interval will contain the true value X% of the time. In simpler terms, 95% likelihood. It is analogous to confidence intervals except that confidence intervals can only be applied to a sample statistic of a specific distribution (like mean, standard deviation, with sufficient size N so that CLT can apply indicating that its sample statistics has a defined relationship in approximating the population parameters).
With that being said, (and excuse my wordiness this helps me clarify the statistical nuance). With that being said, I want to perform a simple calculation. I want to calculate the ‘volatility’ (using the colloquial term here) of a prediction estimate from day to day. I am not particularly concerned with whether it’s ‘precise’ or ‘accurate’ i.e. its proximity to the actual true, population value. I am simply concerned on measuring the volatility of this estimate. For example whether a model will produce predictions that will jump +5 one day, and the next will decrease -5. This is how I’m classifying ‘uncertainty’.
I know one way we can get this variance is getting the standard deviation of the predictions which describes its relation to the mean of predictions. We can even get its cumulative density function and evaluate various percentiles.
But let’s say for example the space of our prediction is not a normal distribution. It’s in fact (skewed), or actually, that it’s showing a specific functional form that may indicate a underlying bias within our predictions. In this context, what would be the suggested way to report this ‘uncertainty’. Does ‘uncertainty’ even make sense in this context considering there might be a bias/different data problem. Is this a ‘model stability’ question? Is there no way to measure the variance of a given prediction w.r.t. itself, and not in relation to ‘true’ population parameter.
One way I am thinking is getting the variance of that day’s prediction estimate in all the training samples, and getting a standard deviation of that value.
Actually through writing this I have distilled the problem in two questions:
1. How to measure model ‘volatility’ day to day? Is it possible to measure model volatility day to day if your underlying data distributions of your train-dev w.r.t. your test (what you’re evaluating) is different?
2. How to measure volatility (‘uncertainty’) within itself? The sample space of all potentially likely predictions that day. Is this essentially a model ‘stability’ question? From my thoughts, you can build 30 predictions for that day and calculate the prediction interval like you’ve outlined above. (not confidence interval right because it’s not a sample statistic) And I’m assuming this is still considered under the category of ‘model stability’? And I’m also assuming this is why it’s recommended to perform some ensemble to reduce inherent internal model stability.
If I solved my own questions, please let me know! But anything that you can write (and/or link resources) to help me clarify these processes and internalize them even more will help.
That is a massive comment!
The uncertainty of the model depends on the model. Some models natively predict a probability, e.g. logistic regression, some don’t, e.g. decision tree.
Volatility – for a time series – that is not my area of expertise sorry. This might help:
https://machinelearningmastery.com/develop-arch-and-garch-models-for-time-series-forecasting-in-python/
For stationary data and a stochastic model, the variance or standard deviation of multiple models fit on the same data is a useful measure of the model’s stability:
https://machinelearningmastery.com/how-to-reduce-model-variance/
Not sure if I have answered your question, perhaps you can rephrase in a sentence or two? (sorry, I have hundreds of comments to read/reply to daily)
Hi Jason,
Great post!
I’m using a 1D CNN (architecture similar to WaveNet) to forecast financial time series data. My intuition tells me that a prediction made 1 year ahead of today should be much less “accurate” compared to predictions made at t+1 for instance.
I’ve looked at several approaches like gaussian process (gpflow library) or even using “dropout” models to generate either confidence intervals or prediction intervals. However, I could not find a good implementation using a 1D CNN as a model. What resource would you recommend looking at?
Agreed.
Fitting multiple (say 30) final models and using the distribution of point predictions as a prediction interval is a quick and effective method.
Super appreciate your quick answer. Understood, will try that out.
According to Gal & Ghahramani “optimising any NN with dropout is equivalent to a form of approximate Bayesian inference.” In fact, what they recommend is using MC Dropout at every weight layer at test time. So, instead of getting a point estimate we get a predicted mean and variance. This PyData talk by Andrew Rowan clearly describes this process https://www.youtube.com/watch?v=I09QVNrUS3Q. What do you think?
I’m not up to speed on it. Perhaps try it and see if it meets your project needs.
“In simple cases like linear regression, we can estimate the confidence interval directly.”
do you mean “prediction interval”?
Also, the link of “A Comprehensive Review of Neural Network-based Prediction Intervals and New Advances” is expired
Thanks, fixed.
Yes. Fixed, thanks!
Running the example estimates the yhat standard deviation and then calculates the confidence interval.
=> Isn’t it “calculated the prediction interval”?
Thanks, fixed!
Hi! Thanks for your post. Just one notation remark. I think it’s a little bit misleading to write “interval = number” as you have in your code and it’s even mathematically incorrect to say like that. Actually z*stdev has its own name, it’s called margin of error (moe).
Thanks Elena.
Hi!
In a classification problem, is there a way to get the prediction intervals for the probabilities?
Hmm, I think there is more to it. Off the cuff, I’d recommend checking the literature.
Hi Jason,
Greetings!
I am working on KDE model and after I want to prediction intervals, I read some literature in my field and I am sharing the reference of paper “https://www.sciencedirect.com/science/article/pii/S0925231220315617” page no. 555, equation no. 13 and 14.
I am not being able to judge which method he is applying to calculate the upper and lower bounds in that paper, can you please have a look?
Thanks
Hi Ehtisham…Do you have a question about someone else’s:
Research paper?
Blog post?
Diagram?
Code?
I’m eager to help, but reading a paper (or someone else’s material) to the level required to then explain it to you requires a large amount of time and effort. I just don’t have the capacity to this for every request that I get.
My best advice is to contact the author and ask your questions directly.
I believe an honest academic will want their work read and understood.
If you prepare well (e.g. do your homework), if you’re courteous (e.g. humble, polite, and not demanding), and if you are clear with your questions (e.g. specific), I would expect a helpful response.
Hi! Thank for your post!
I’m working in a delivery time project. I’m using predicting intervals with LGBM and XGBoost. With the last one I get much better results but with a bigger range of interval. Any suggestion of how can I get a smaller predicting interval but keeping the performance?
Many thanks!
Hi Ignacio…You may want to investigate optimization techniques:
https://machinelearningmastery.com/optimization-for-machine-learning-crash-course/
Hi James
please introduce a reference to me for learning calculation of limitation bounds of a prediction model. I mean that if we train a prediction model for a dataset that does not represent the larger group we may not use it for test data out of this range. for example if we train a linear regression model for x between 1 and 10 to predict y we cannot use it for x=100 and it will have large error in x=100 if we use the model for prediction.
Thank you
sorry Hi Jason