Some machine learning algorithms will achieve better performance if your time series data has a consistent scale or distribution.
Two techniques that you can use to consistently rescale your time series data are normalization and standardization.
In this tutorial, you will discover how you can apply normalization and standardization rescaling to your time series data in Python.
After completing this tutorial, you will know:
- The limitations of normalization and expectations of your data for using standardization.
- What parameters are required and how to manually calculate normalized and standardized values.
- How to normalize and standardize your time series data using scikit-learn in Python.
Kick-start your project with my new book Time Series Forecasting With Python, including step-by-step tutorials and the Python source code files for all examples.
Let’s get started.
- Updated Apr/2019: Updated the link to dataset.
- Updated Aug/2019: Updated data loading to use new API.
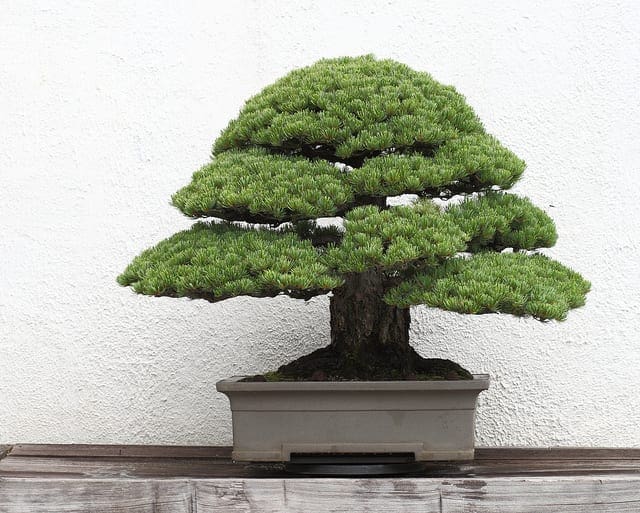
How to Normalize and Standardize Time Series Data in Python
Photo by Sage Ross, some rights reserved.
Minimum Daily Temperatures Dataset
This dataset describes the minimum daily temperatures over 10 years (1981-1990) in the city Melbourne, Australia.
The units are in degrees Celsius and there are 3,650 observations. The source of the data is credited as the Australian Bureau of Meteorology.
Below is a sample of the first 5 rows of data, including the header row.
|
1 2 3 4 5 6 |
"Date","Temperatures" "1981-01-01",20.7 "1981-01-02",17.9 "1981-01-03",18.8 "1981-01-04",14.6 "1981-01-05",15.8 |
Below is a plot of the entire dataset.
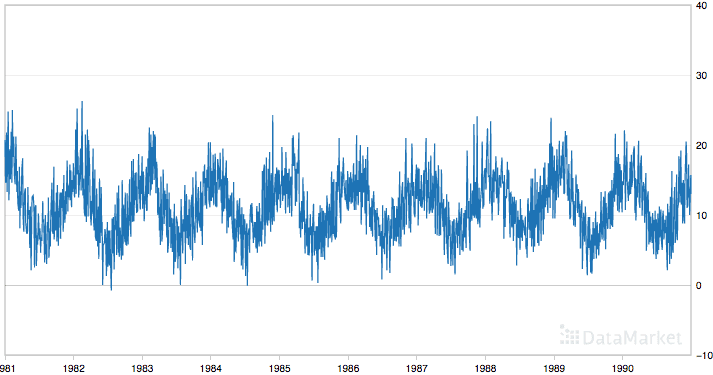
Minimum Daily Temperatures
The dataset shows a strong seasonality component and has a nice, fine-grained detail to work with.
This tutorial assumes that the dataset is in your current working directory with the filename “daily-minimum-temperatures-in-me.csv“.
Stop learning Time Series Forecasting the slow way!
Take my free 7-day email course and discover how to get started (with sample code).
Click to sign-up and also get a free PDF Ebook version of the course.
Normalize Time Series Data
Normalization is a rescaling of the data from the original range so that all values are within the range of 0 and 1.
Normalization can be useful, and even required in some machine learning algorithms when your time series data has input values with differing scales.It may be required for algorithms, like k-Nearest neighbors, which uses distance calculations and Linear Regression and Artificial Neural Networks that weight input values.
Normalization requires that you know or are able to accurately estimate the minimum and maximum observable values. You may be able to estimate these values from your available data. If your time series is trending up or down, estimating these expected values may be difficult and normalization may not be the best method to use on your problem.
A value is normalized as follows:
|
1 |
y = (x - min) / (max - min) |
Where the minimum and maximum values pertain to the value x being normalized.
For example, for the temperature data, we could guesstimate the min and max observable values as 30 and -10, which are greatly over and under-estimated. We can then normalize any value like 18.8 as follows:
|
1 2 3 4 |
y = (x - min) / (max - min) y = (18.8 - -10) / (30 - -10) y = 28.8 / 40 y = 0.72 |
You can see that if an x value is provided that is outside the bounds of the minimum and maximum values, that the resulting value will not be in the range of 0 and 1. You could check for these observations prior to making predictions and either remove them from the dataset or limit them to the pre-defined maximum or minimum values.
You can normalize your dataset using the scikit-learn object MinMaxScaler.
Good practice usage with the MinMaxScaler and other rescaling techniques is as follows:
- Fit the scaler using available training data. For normalization, this means the training data will be used to estimate the minimum and maximum observable values. This is done by calling the fit() function,
- Apply the scale to training data. This means you can use the normalized data to train your model. This is done by calling the transform() function
- Apply the scale to data going forward. This means you can prepare new data in the future on which you want to make predictions.
If needed, the transform can be inverted. This is useful for converting predictions back into their original scale for reporting or plotting. This can be done by calling the inverse_transform() function.
Below is an example of normalizing the Minimum Daily Temperatures dataset.
The scaler requires data to be provided as a matrix of rows and columns. The loaded time series data is loaded as a Pandas Series. It must then be reshaped into a matrix of one column with 3,650 rows.
The reshaped dataset is then used to fit the scaler, the dataset is normalized, then the normalization transform is inverted to show the original values again.
|
1 2 3 4 5 6 7 8 9 10 11 12 13 14 15 16 17 18 19 20 21 |
# Normalize time series data from pandas import read_csv from sklearn.preprocessing import MinMaxScaler # load the dataset and print the first 5 rows series = read_csv('daily-minimum-temperatures-in-me.csv', header=0, index_col=0) print(series.head()) # prepare data for normalization values = series.values values = values.reshape((len(values), 1)) # train the normalization scaler = MinMaxScaler(feature_range=(0, 1)) scaler = scaler.fit(values) print('Min: %f, Max: %f' % (scaler.data_min_, scaler.data_max_)) # normalize the dataset and print the first 5 rows normalized = scaler.transform(values) for i in range(5): print(normalized[i]) # inverse transform and print the first 5 rows inversed = scaler.inverse_transform(normalized) for i in range(5): print(inversed[i]) |
Running the example prints the first 5 rows from the loaded dataset, shows the same 5 values in their normalized form, then the values back in their original scale using the inverse transform.
We can also see that the minimum and maximum values of the dataset are 0 and 26.3 respectively.
|
1 2 3 4 5 6 7 8 9 10 11 12 13 14 15 16 17 18 |
Date 1981-01-01 20.7 1981-01-02 17.9 1981-01-03 18.8 1981-01-04 14.6 1981-01-05 15.8 Name: Temp, dtype: float64 Min: 0.000000, Max: 26.300000 [ 0.78707224] [ 0.68060837] [ 0.7148289] [ 0.55513308] [ 0.60076046] [ 20.7] [ 17.9] [ 18.8] [ 14.6] [ 15.8] |
There is another type of rescaling that is more robust to new values being outside the range of expected values; this is called Standardization. We will look at that next.
Standardize Time Series Data
Standardizing a dataset involves rescaling the distribution of values so that the mean of observed values is 0 and the standard deviation is 1.
This can be thought of as subtracting the mean value or centering the data.
Like normalization, standardization can be useful, and even required in some machine learning algorithms when your time series data has input values with differing scales.
Standardization assumes that your observations fit a Gaussian distribution (bell curve) with a well behaved mean and standard deviation. You can still standardize your time series data if this expectation is not met, but you may not get reliable results.
This includes algorithms like Support Vector Machines, Linear and Logistic Regression, and other algorithms that assume or have improved performance with Gaussian data.
Standardization requires that you know or are able to accurately estimate the mean and standard deviation of observable values. You may be able to estimate these values from your training data.
A value is standardized as follows:
|
1 |
y = (x - mean) / standard_deviation |
Where the mean is calculated as:
|
1 |
mean = sum(x) / count(x) |
And the standard_deviation is calculated as:
|
1 |
standard_deviation = sqrt( sum( (x - mean)^2 ) / count(x)) |
For example, we can plot a histogram of the Minimum Daily Temperatures dataset as follows:
|
1 2 3 4 5 |
from pandas import read_csv from matplotlib import pyplot series = read_csv('daily-minimum-temperatures-in-me.csv', header=0, index_col=0) series.hist() pyplot.show() |
Running the code gives the following plot that shows a Gaussian distribution of the dataset, as assumed by standardization.
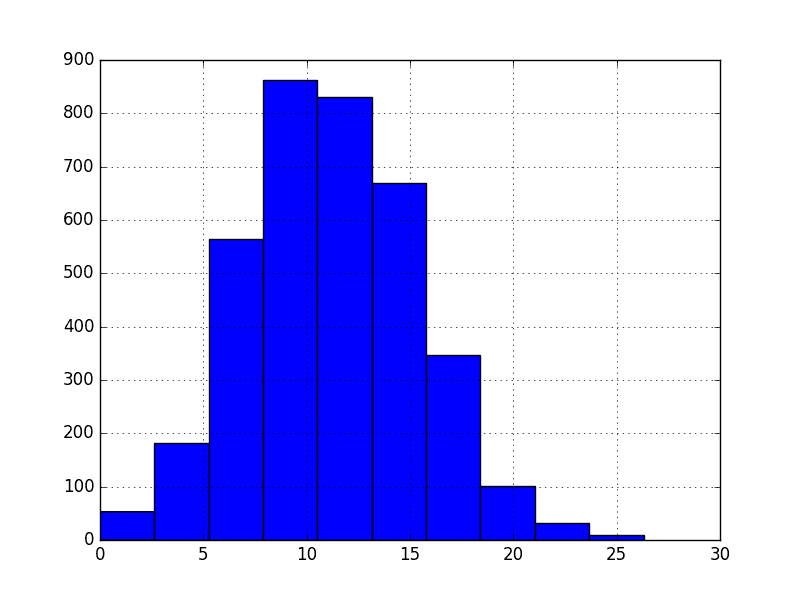
Minimum Daily Temperatures Histogram
We can guesstimate a mean temperature of 10 and a standard deviation of about 5. Using these values, we can standardize the first value in the dataset of 20.7 as follows:
|
1 2 3 4 |
y = (x - mean) / standard_deviation y = (20.7 - 10) / 5 y = (10.7) / 5 y = 2.14 |
The mean and standard deviation estimates of a dataset can be more robust to new data than the minimum and maximum.
You can standardize your dataset using the scikit-learn object StandardScaler.
Below is an example of standardizing the Minimum Daily Temperatures dataset.
|
1 2 3 4 5 6 7 8 9 10 11 12 13 14 15 16 17 18 19 20 21 22 |
# Standardize time series data from pandas import read_csv from sklearn.preprocessing import StandardScaler from math import sqrt # load the dataset and print the first 5 rows series = read_csv('daily-minimum-temperatures-in-me.csv', header=0, index_col=0) print(series.head()) # prepare data for standardization values = series.values values = values.reshape((len(values), 1)) # train the standardization scaler = StandardScaler() scaler = scaler.fit(values) print('Mean: %f, StandardDeviation: %f' % (scaler.mean_, sqrt(scaler.var_))) # standardization the dataset and print the first 5 rows normalized = scaler.transform(values) for i in range(5): print(normalized[i]) # inverse transform and print the first 5 rows inversed = scaler.inverse_transform(normalized) for i in range(5): print(inversed[i]) |
Running the example prints the first 5 rows of the dataset, prints the same values standardized, then prints the values back in their original scale.
We can see that the estimated mean and standard deviation were 11.1 and 4.0 respectively.
|
1 2 3 4 5 6 7 8 9 10 11 12 13 14 15 16 17 18 |
Date 1981-01-01 20.7 1981-01-02 17.9 1981-01-03 18.8 1981-01-04 14.6 1981-01-05 15.8 Name: Temp, dtype: float64 Mean: 11.177753, StandardDeviation: 4.071279 [ 2.33888328] [ 1.65113873] [ 1.87219948] [ 0.84058266] [ 1.13533032] [ 20.7] [ 17.9] [ 18.8] [ 14.6] [ 15.8] |
Summary
In this tutorial, you discovered how to normalize and standardize time series data in Python.
Specifically, you learned:
- That some machine learning algorithms perform better or even require rescaled data when modeling.
- How to manually calculate the parameters required for normalization and standardization.
- How to normalize and standardize time series data using scikit-learn in Python.
Do you have any questions about rescaling time series data or about this post?
Ask your questions in the comments and I will do my best to answer.
Want to Develop Time Series Forecasts with Python?

Develop Your Own Forecasts in Minutes
...with just a few lines of python codeDiscover how in my new Ebook:
Introduction to Time Series Forecasting With Python
It covers self-study tutorials and end-to-end projects on topics like: Loading data, visualization, modeling, algorithm tuning, and much more...
Finally Bring Time Series Forecasting to
Your Own Projects
Skip the Academics. Just Results.


I assume that this works like a treat for data sets that you can fit into memory … But what about very large data sets that simply would never fit into a single machine. Would you recommend other techniques?
Great question Marek.
I would suggest estimating the parameters required (min/max for normalization and mean/stdev for standardization) and using those parameters to prepare data just in time prior to use in a model.
Does that help?
Hey Jason,
I am doing a time series forecasting of air pollution pollution. I am planning to use air pollutant data and I am planning to use meteorological factors such as air temperature as well. Can you suggest me the tests I should be performing on the data and the good time series models to use .
Regards
Ankit
Yes, I recommend following this process:
https://machinelearningmastery.com/how-to-develop-a-skilful-time-series-forecasting-model/
Hey Jason,
Can u please explain the difference between standardisation and normalisation.
Also StandardScaler() is not working in my r environment.
Regards
Priyanka
Yes, right here:
https://machinelearningmastery.com/faq/single-faq/what-is-the-difference-between-standardization-and-normalization
IMO
If you have kind of stream data, you need to define a range of data to evaluate.
If you just have distributed data, you need to mapreduce.
Hello Jason,
thank you for your example. I am learning Python und Pandas. Why do you need to reshape the Series.values?
# prepare data for standardization
values = series.values
values = values.reshape((len(values), 1))
Bye
Great question, it’s because the sklearn tools prefer a 2D matrix and the series is 1D.
We just need to be explicit in the numpy array about the number of rows and cols and sklearn will then not throw out a warning.
Does that help?
Yep! Thank you Jason 🙂
In relation to this topic, how do you usually handle variables of mixed types (e.g. a mixture of categorical, continuous, ordinal variables) in a classifier (e.g. logistic regression, SVM, etc.)? I first perform dummy coding on categorical variables, followed by mixing them with the other variables (after normalizing them to [0, 1]); not sure if this is the best practice. On the other hand, the same question for applying clustering algorithms (say, k-means, spectral clusterings). Thank you.
Hi Barnett, yes exactly as you describe.
I try integer encodings if there is an ordinal relationship.
For categorical variables, I use dummy (binary) variables.
I try to make many different views/perspectives of a prediction problem, including transforms, projections and feature selection filters. I then test them all on a suite of methods and see which representations are generally better at exposing the structure of the problem. While that is running, I do the traditional careful analysis, but this automated method is often faster and results in non-intuitive results.
I was not able to run this using the data set as is. In the csv file, there is a footer with 3 columns and some data contains questions marks. However, after removing this and replacing it works )
Thanks for the tip Magnus.
Yes, the tutorial does assume a well-formed CSV file.
A raw download from DataMarket does contain footer info that must be deleted.
What is the mathmatical function to denormalize if the function
y = (x – min) / (max – min) is our normalize function.
solve foe x
Thank you for the nice tutorial.
I wonder how you would normalize the standard deviation for replicate measurements?
Let’s assume that we have three measurements for each day instead of only one and that you would want to plot the temperature normalized to its mean as a time series for a single month. Would the standard deviation for each day have to be normalized as well?
Great question,
Generally, this is a problem specific question and you can choose the period over which to standardize or normalize.
I would prefer to pick min/max or mean/stdev that are suitable for the entire modeling period per variable.
Try other approaches, and see how they fair on your dataset.
Let’s say I have a time series and normalize the data in the range 0,1. I train the model and run my predictions in real time. Later, an “extreme event” occur with values higher than the max value in my training set. The prediction for that event might then saturate, giving me a lower forecast compared to the observation. How to deal with this?
I suppose one possibility is to use e.g. extreme event analysis to estimate a future max value and use this as my max value for normalization. However, then my training data will be in a narrower range, e.g. 0 to 0.9. Of course, I can do this anyway without an analysis. My question is related to e.g. forecasts of extreme weather phenomena or earthquakes etc.
How is it possible to forecast, accurately, an extreme event, when we don’t have this in the training set? After all, extreme events are often very important to be able to forecast.
Great question Magnus.
This is an important consideration when scaling.
Standardization will be more robust. Normalization will require you to estimate the limits of expected values, to detect when new input data exceeds those limits and handle that accordingly (report an error, clip, issue a warning, re-train the model with new limits, etc.).
As for the “best” thing to do, that really depends on the domain and your project requirements.
What about if the data is highly asymmetric with a negative (or positive) skew, and therefore far from being Gaussian?
If I choose a NN, I assume that my data should be normalised. If I standardise the data it will still be skewed, so when using a NN is it better to transform the data to remove the skew? Or is neural networks a bad choice with skewed data?
Consider a power transform like a box-cox to make the data more Gaussian, then standardize.
I don’t think this way of scaling time series works. For instance, the standardization method in python calculates the mean and standard deviation using the whole data set you provide. But in reality, we won’t have that. As a result, scaling this way will have look ahead bias as it uses both past and future data to calculate the mean and std. So we need to figure out a way to calculate the mean and the std based on the data we have at a given point in time.
Yes, you might be better off estimating the coefficients needed for scaling based on domain knowledge.
What if the code shows “NO module named sklearn.preprocessing”. I already downloaded scipy 0.18.1 version.
It sounds like sklearn is not installed.
Hi Jason, thanks for your great work.
I have a question: how to properly normalize train, validation and test dataset for trading forex? Those datasets are splitted in order of time, so training is before validation that is before test. I don’t want to use future data for normalization since i don’t have to use future information for preprocessing my data…
Now my results using Reinforcement Learning are not great but i think that great part of the work is done by normalize well my datasets.
My strategy now is doing standardization for every episode(one week of data) of training/test/validation with mean and standard deviation of 3 weeks before…
I would recommend estimating the min/max or mean/stdev from training data and domain knowledge and scaling the data manually.
Thanks for the reply. It’s exactly what i’m doing now. Probably there is no other standard possibility than domain knowledge. Would be interesting to find something standard but it seems impossible.
Thank you for good information!
And.. Can i standardize & normalize a nominal(categorical) variable?
I’m glad you found it useful.
You can encode a nominal variable as integers and then use a one hot encoding.
What if all my time series have a trend upwards. Or even worse what if half of my time series have a trend upwards and the rest half of them have a trend downwards?
Would detrending the time series be helpful? (“removing” the slope and subtracting the mean)
If yes, what kind of detrending would be useful? Should I detrend each sequence separately from all the others or detrend them all together or detrend them in groups?
But this does not seem like normalization/standardization because you cannot revert the process if you do it separately for each sequence you have lost information.
What are your thoughts on this approach? Thank you
Yes, treat each series separately, make each stationary.
Use differencing:
https://machinelearningmastery.com/difference-time-series-dataset-python/
But if you normalize by this way, you are using information from future, therefore the model will overfit. Let’s say you normalize the columns to train my model with the mean and the std of their content, but a new input data cannot be normalized following the old criteria, and neither the new one (the mean and the std of the last N rows) because of the trend, or the std…
What about using this instead: http://scikit-learn.org/stable/modules/preprocessing.html#custom-transformers
Yes, I would recommend estimating the normalization coefficients (min/max) using training data only.
Ok, that makes sense. But even with your training data you’d have the same problem: working with a timeseries dataset, if you normalize/scale using the min/max of whole training dataset, you are taking into account values of future data as well, and in a real prediction you won’t have this information, right?
Moreover, how would you normalize/scale future data? Using the same saved preprocessing model of your training data, or creating a new MinMaxScaler() using the last N rows? What if the new values are slightly different of the training ones?
That’s why I’ve posted the log1p solution, which is the same as log(1+x) and which will thus work on (-1;∞). Or what about this one:
http://timvieira.github.io/blog/post/2014/02/11/exp-normalize-trick/
I think would be very interesting that you pointing this out in the post because I’m afraid it can affect dramatically to model’s accuracy…
This was my point. If normalizing you need to select min/max values based on available data and domain knowledge (to guestimate the expected max/min that will ever be seen).
Same idea with estimating the mean/stdev for standardization.
If evaluating a model, these estimates should be drawn from the training data only and/or domain expertise.
I hope that is clearer.
I think the best approach would be the following:
scaler = StandardScaler() # or MinMaxScaler()
scaler_train = scaler.fit(X_train)
X_train = scaler_train.transform(X_train)
scaler_full = scaler.fit(X) # X_train + X_test
X_test = scaler_full.transform(X_test)
Further reading:
https://www.researchgate.net/post/If_I_used_data_normalization_x-meanx_stdx_for_training_data_would_I_use_train_Mean_and_Standard_Deviation_to_normalize_test_data
https://stats.stackexchange.com/questions/267012/difference-between-preprocessing-train-and-test-set-before-and-after-splitting/270284
http://sebastianraschka.com/Articles/2014_about_feature_scaling.html
Hi Jason, thank you for your post.
I have question.
I have timestamp and system-up-time where up-time is # of hrs system has been up in its lifetime.
Now I have to predict system failure based on the age of the system or system-up-time hrs.
# of failures might grow based on the age of the system or how many hrs its been running.
I have limited training data and the max up-time hrs in the training data is 1,000 hrs and age is 1,200 hrs. But in real time it could go beyond 100,000 hrs and age could go beyond 150,000 hrs.
How do I standardize timestamp and up-time hrs.
Consider looking into survival analysis:
https://en.wikipedia.org/wiki/Survival_analysis
Hi Jason,
Thank you for your comprehensive explanation. I have a noisy time series with missing data and outliers. Not even sure if the data is normal. Does standardization works in my case? My sample size can be quite big. Looking forward to your feedback.
Hmm, perhaps not. But I generally recommend testing and getting data rather than using opinions/advice. I’m often wrong.
Perhaps try to patch the missing data and trim the outliers as secondary steps and see if that impacts model skill.
Let me know how you go.
Hi! I did not manage to max the MinMaxScaler work for my tensors of rank 5. Someone knows how to scale across all dimensions of a tensor? I guess you could flatten it scale it and then reshape it back. but I prefer not to get lost with all the dimensions. What I did for now is to make my own normalize to scale numpy tensors if someone bumps into the same problem.
class normalize():def fit(self, train, interval=(0,1)):
self.min, self.max = train.min(), train.max()
self.interval = interval
return self
def transform(self, train, val, test):
def trans(x):
y = ((self.interval[1]-self.interval[0])*x + \
(self.interval[0]*self.max-self.interval[1]*self.min)) / \
(self.max-self.min)
return y
train_norm = trans(train)
val_norm = trans(val)
test_norm = trans(test)
return train_norm, val_norm, test_norm
def inverse_transform(self, train_norm, val_norm, test_norm):
def inv_trans(y):
x = ((self.max-self.min)*y + \
(self.interval[1]*self.min-self.interval[0]*self.max)) / \
(self.interval[1]-self.interval[0])
return x
train = inv_trans(train_norm)
val = inv_trans(val_norm)
test = inv_trans(test_norm)
return train, val, test
The sklearn tools will apply across all columns of your data.
Hi,
Would it also be a valid approach to convert the time series to unit vectors before a machine operation such as clustering?
Thanks,
Joel
Perhaps, try it and see how it impacts model skill.
Hi @Jason,
1. What’s difference in Normalize and Standardize time-series data with other data?
2. Should we Normalize and Standardize or both to the time-series data?
3. Can you please update this very good tutorial with “How to save data Normalize and
Standardize and reuse same for test data”?
Thanks,
Khalid
No difference, other than you might need to account for an increasing level (trend).
Depends on the algorithm and the data, try both and evaluate the effects.
You can save a series using NumPy or Pandas.
Hi Jason,
I just would like to ask if the normalization of data only happens during training? During testing where no output data is provide do I need still to normalize data? Thank you.
Great question.
Any transforms performed to data prior to training must also be performed to test or any other data.
What kind of preprocessing required for traffic flow analysis based on time series data? I am referring Highways agency network journey time and traffic flow data of 9 fields namely Link reference, Link description, Date, Time Period, Average journey time, Average speed, Data Quality, Link Length, Flow etc. Which techniques to try for preprocessing such data of 3 months Jan – March 2015? Thanks
Perhaps try a few methods and see what results in models with better skill.
Have you tried using the (from sklearn.preprocessing import Imputer) function?
Is it better than this or are they the same?
I have an example of using the Imputer here:
https://machinelearningmastery.com/handle-missing-data-python/
Choose the method that you prefer.
On what basis we choose data scaling method(Normalization/Standardization)?
Standardization is for gaussian data.
Normalization can be used for gaussian or non-gaussian.
Scaling is appropriate for methods that use distances or weightings.
If in doubt, compare model skill with and without scaling.
using the MinMaxScaler model in sklearn to normalize the features of a model during the training session, one can save the scaler and load it later from a file in forecasting session, for example, is that Possible? is that a good solution
https://stackoverflow.com/questions/41993565/save-minmaxscaler-model-in-sklearn
Is there another more efficient way?
I would recommend saving the coefficients or saving the object via pickle.
Thanks for your advice
Hi Jason, great article.
One question that always bugs me, what is the proper way to standardize data in case when you have multiple instances with multiple parameters each? For example, you are measuring M parameters (time series) for N devices, during T seconds, and you want to perform some analysis/ML on these devices. How would you standardize the data in this case?
Thanks!
It comes down to how you want to model the data, e.g. one model per sensor, group of sensors, all sensors.
Standardize by variable and model.
Does that help?
Hi Jason,
Thank you for your response. So the idea is to have one model which includes values of all parameters (sensors) to be able to integrate the relation between parameters as well.
When you say standardize by variable and model, what would that mean in this case? Find Min/Max or Mean/StdDev for all values of a single parameter (belonging to different instances)? So one statistic for all values of a single parameter for all instances? Standardizing parameter per “per-dataset” and not “per-instance”?
Thanks again!
Yes, each variable and model, if you choose to model the sensors separately.
Hi
Thank you for the post, it was really helpful.
I am using sklearn’s Normalizer for normalization of data before prediction. How do we revert back the predicted data to the original values?
Thank you
Call the invert_transform() function.
Hi Jason,
How would you normalize columns in a dataframe that contains NaN values?
Thanks,
Tom
Ignore/replace/remove/impute the nan values.
Hello Jason,
Are you normalizing/standardizing only the value field? Or the time series as well?
Also, I ran my standarzing/normalizing on my value field and it reported back the exact same histogram when plotted, is this not meant to normalize the data??
Thanks
For univariate data, we prepare the entire series.
The shape will be the same, but the min/max will be different when normalizing and standardizing a Gaussian.
Hi Jason
Thanks for the great tutorial. I keep getting the error “cannot reshape array of size 7300 into shape (3650,1).
I get this error with other sample datasets I tried.
Is there something that I am missing?
Perhaps this tutorial will help you understand numpy arrays:
https://machinelearningmastery.com/index-slice-reshape-numpy-arrays-machine-learning-python/
Hi Jason.
I have a n*n*n matrix contain a sample, time-steps, features for the stock market.
How would you Standardize Time Series Data in n*n dimension and prepare for LSTM?
Thanks,
Not sure what your data dimensions represent. Generally, rescale each series, e.g. series-wise.
Hello Jason,
Great tutorial. I have a question though, there can be multiple outliers which can affect mean and in turn affect both normalization as well as standardization, so why don’t we use median? as it is less prone to outliers and will produce more robust results?
Sounds like a good idea for Gaussian distributed data with outliers.
Should we also normalise the output (y)? Or is it good to have only the inputs (X) normalised?
Yes, the output or target variable should be standardized or normalized.
what about Date will it get normalized automatically?
Date is removed.
Great article.
Jason, one question regarding the difference between the results achied after applying the standartization and stationarity transformation. isn’t it true that data is deemed stationary if it is centerd around the mean and the variation is stable…which , as it appears , is the result of the standartization transformation
Thanks in advance for the clarification and sorry for the silly questions )
It is stationary if it does not have a systematic structure, like trend or seasonality:
https://machinelearningmastery.com/time-series-data-stationary-python/
thanks for another great article.
why not “scaling down” but normalizing?
x………………….y
if we have negative values in an array [5, -7, -3, 6, 7, 9, 10]
after scaling down…………………………..[..-0.7……………….1]
if i normalize…………………………………..[…..0………………..1]
in scaling down I keep the weight of -7 (being -0.7) to pull my Fx to West/negative direction
in normalizing -7 becomes 0 and 10 becomes 1….
-7 will have no weight in
Yes, often very few values are on the boundary. If you have many values on the boundarty, perhaps normalize to a different range.
-7 will have no weight in my equation -0.7x vs 0.x….Meanwhile 10y will be 1.y pulling all the way to East…
Yes, perhaps just standardize or shift the normalized range to [-1, 1] or [0.1, 0.9] and see if it makes a difference to the model skill.
Hi Jason
Its me again. your avid follower.
Does a predicted values (target values) using normalise feature variables is a normalise value? or do we need to transpose the predicted value ?
Thanks again.
What does “transpose the predicted value” mean?
Hi Jason,
Sorry to make you confuse. What I mean when we make prediction on the hold out target value not known to us, and our predictor or features variables are normalise. Does the output of our prediction are normalise value and we need to inverse before submitting to the competition?
Thank you Jason.
Yes.
Does the scaling range dependent on the activation function? For example, I have X_train and Y_train. X_train and Y_train have positive and negative values between (-2,2). Tanh activation function can have a value between (-1,1). Similarly, ReLU can have an only a positive value greater than 1.
Shall I scale my data to (-1,1) range if I am using Tanh activation function? Similarly, is it necessary to scale the data between (0,1) for ReLU activation function?
I am having an issue with using ReLU activation function for data scaled between (0,1). The solution diverges for (0,1) scaling with ReLU activation function. However, if I use (-1,1) scaling ReLU activation function, the solution does not diverge.
Thank you.
Typically, yes.
Although, I recommend using whatever gives the best result, rather than what is dogma.
Thank you, Jason. I was wondering if the scaling can a problem with blowing up the prediction results? If I change the scaling range, the solution does not blow up. Or, can the blowing up of the prediction related to the choice of activation function?
Thank you.
Yes, both. I recommend carefully choosing the activation function, then scale the data accordingly. Then vary the scale/config to see how it impacts model performance.
Hello,
I would like to ask this: Isn’t the way you scale data (ie using the entire training set) essentially using information from the future to scale information from the past? I mean, if you use the data points after say 28/02 and get the mean of the entire dataset and use it to scale data points before 28/02, aren’t you essentially ‘cheating’ by using information not actually available at a point before the end of February? Isn’t it like using (unavailable) information from (the future) 2020 to scale my data now, in (the present) 2019?
Thanks!
Correct, you should prepare the scaling on the training set, and apply it to train and test.
I typically do it in one shot for brevity.
Appreciate the answer! I also would like to ask, if I create multiple features based on my original time series (eg moving averages of various periods of stock price returns), so I end up with multivariate time series, how should I conduct my scaling (for train and test sets)? Should I scale my original time series train set and then create the other features? Or in some other way?
Thanks!
Scale first, then shift.
Do you mean scale on the entire original time series dataset prior to the train/test set split? Or on the original dataset’s part, which I will keep for training?
Also, is there any chance you could include a small chapter in the post dealing with multivariate, time series or not, scaling? Or is it obvious how to do it and I am missing something?
Thanks a lot!
Calculate scaling stats on the training dataset, scale columns before transforming into a supervised learning problem.
Here’s an example:
https://machinelearningmastery.com/machine-learning-data-transforms-for-time-series-forecasting/
Ok, so if I understand correctly the workflow should be like this, and please correct me if I am wrong:
Initial Univariate Time Series -> Calculate scaling stats on the training part of it (say 90%) -> Apply scaling on the entire univariate Time Series -> Then calculate the various other indicators turning the dataset to multivariate. (This makes more sense to me).
OR
Initial Univariate Time Series -> Calculate various indicators, turning the dataset to multivariate -> Scale each column separately according to its training size (eg 90%).
Also, I would like to ask when to inverse transform my model’s predictions to calculate the error metrics, as this is a bit confusing for me as well. Do I have to do an inverse transform on my y_pred and compare that with the original y_test? I believe you had a post about this as well but cannot remember which one it was.
Thanks a lot, and sorry for bombarding you!
I think scale first, more on order here:
https://machinelearningmastery.com/machine-learning-data-transforms-for-time-series-forecasting/
Try both and see what works best for your specific dataset.
The above linked tutorial shows how to reverse the operations.
Is it possible to get exactly the same values from minmax normalization and standardization for a timeseries?
https://stackoverflow.com/questions/56084988/zscore-v-s-minmax-normalization-why-their-results-look-the-same
I don’t see why not.
Jason,
Is it an acceptable practice to Standartize data and then apply power transformation to that data? Or usually, it’s one or another?
I would do the power transform first. More on the order of transforms here:
https://machinelearningmastery.com/machine-learning-data-transforms-for-time-series-forecasting/
Thank you for the link. I have seen it. I wonder if there is a paper that supports power transformation for data prior to fitting ANN and explains the effect it has on the final results (better accuracy/recall/precision)
All I was able to find was that since ANN is non-parametric, then PT is not required.
Probably not, it is a very general technique. It is described in many textbooks, for example:
https://machinelearningmastery.com/books-on-time-series-forecasting-with-r/
Reason why I am asking is that I have applied standardization for lasso feature selection. And now I would like to apply PT to those selected lags. I cannot find anything similar in the literature. Thank you.
I want to save the normalized data as a file because I need to feed that data to CNN. How to do that?? Ideas will be appreciated.
You can save a numpy array using the savetext() function:
https://docs.scipy.org/doc/numpy/reference/generated/numpy.savetxt.html
Hi Jason, do you have a method of combining a 10 minute sensor dataset with a fault dataset? I want to join them on the timestamp but the fault data only has a start and stop field. Thanks, Paul.
Perhaps a database join in SQL?
Perhaps an hstack() in numpy?
Hi Jason,
The data normalisation usually happens irrespective of target column, say minmax applies on each column individually, like-wise mean and sd specific to the column,
is there any method that normalise predictors based on target?
Thanks
Not that I’m aware.
Isn’t this just plain normalization and standardization ? I would image most time-series data are non-stationary meaning variance of the distribution changes over time. Is it good practice to Standardize over a rolling window to reflect this non-stationary data ?
Yes.
Yes, good question. Better to make the data nonstationary prior to scaling if possible.
Hi Jason, thanks for another great implementation article. I have a similar question regarding the scaling of the time series data. What´s your approach towards scaling (normalizing) the time series data for forecasting on rolling bases? In this case, I guess the X chunks of features and y target values should be normalized separately?
Again thanks for your great posts.
Hi Andrew…The following may help add clarity:
http://ceur-ws.org/Vol-2191/paper10.pdf
Thanks for article. I have a question: if we have video classification and for each video we extract let’s say 50 frames, how can we apply standardization? I mean we should standardize each frame of each subject separately or all frames of one subject together or…
Yes, see this post:
https://machinelearningmastery.com/how-to-manually-scale-image-pixel-data-for-deep-learning/
Hi, thanks for your text.
I would like to ask it is not possible to expect the range of the data after performing standardisation right? the most likely is to be between [-3, 3] but is possible to fall over that range right?
Correct.
Nice post and great thanks for your efforts. May I ask one question? My data looks like this https://drive.google.com/open?id=1Cqat4Aw2noexzGipfieF-y2S-Iu4jWjF
I can plot the hist on this data and the hist looks like clearly not gaussian. I tried the boxcox transformation, but the transformed data still not like Gaussian distribution. Do you have any idea how to make this data look more Gaussian so that I can build a machine learning model to predict the future?
Thanks in advance.
Data does not have to be Gaussian to use ml methods. Many nonlinear methods make no assumptions about the form of the data – try a decision tree, SVM, or a knn for example!
Hello jason,
I have a dataset of rssi samples. Its a time series data containing a lot more noise content. Now, I am interested to extract patterns in it. How can I do it by applying normilization?
The above example shows how to normalize a time series dataset.
What problem are you having exactly?
Hi Jason,
Thanks for the post. I have a question concerning a model that I’m building. I have time series data that I’m inputting using a sliding window method. So each sample contains multiple values from the time series data, i.e. y(t) = [x(t),x(t-1),x(t-2)]. In a situation like this, do I need to normalize the time series data before or after applying the sliding window? I think the latter makes more sense because it makes sure that each feature in the dataset is normalized, but the former makes sure the time series data itself is normalized. I’d really be interested to hear your opinion on this. Thanks a lot in advance!
You can scale the data prior to making the data supervised/sliding window.
Hi Jason,
So we can fit_transform and transform, our train/test dataset respectively to input into training out model. After prediction, do we have to inverse_transform the predictions also since the model was trained on scaled data? Thank you!
Yes, I show how here:
https://machinelearningmastery.com/machine-learning-data-transforms-for-time-series-forecasting/
Thank you! These articles have been very helpful. I feel like the more I read about time series forecasting and how to prepare my time-series data, the more confusing it can get. My current dataset consists of multivariate independent features, trying to predict 1 variable. I set up my training and test sets and scale/transform the sets before fitting it to a SVR model. Now I see some examples where people reshape before scaling/transforming like np.reshape(-1,1). Is this necessary and how does reshaping tie into multivariate features? This ties into an error I am getting such that since I am predicting 1 variable which ends up being a 1-d array. So as mentioned above, I tried to inverse_transform this y_pred but the sklearn transformer throws an error saying ‘expected 2d array.’
Thanks.
Yes, the sklearn transformers always expect 2d data, rows and cols.
Ah, I see. So reshaping isn’t necessary when working with multivariate features to a SVR model or why would we reshape our data input to a model?
Typically we reshape data to meet the expectations of an API, such as a model or a data transform.
More on reshaping in the general sense here:
https://machinelearningmastery.com/index-slice-reshape-numpy-arrays-machine-learning-python/
Suppose our demand of milk product is in direct relation with rainfall. So
i have to estimate the day ahead demand of the product using rainfall data which is available to us.
What i am doing is, since the demand of 2019 and 2018 is different from the demand of 2020, i have standardized the demand of 2019 by subtracting the mean and divided by std deviation of January 2019 dataset. Then searched the corresponding demand wrt to a particular rainfall value. Now i have trained the model on standardized values then while making forecast i have to de standardized the series.
So my question is which series is to use to calculate the mean and std deviation for de standardization of the forecast dataset.
Please help
You can choose the framing of the prediction task.
For example, you can choose to make a prediction that will be standardized based on the prior months data or the year befores value, etc. As long as you are consistent it should be fine – if I understood your question correctly.
Hi Jason, Thanks for your reply.
What I am doing is using January 2019 Rainfall and sales dataset to forecast sales of January 2020 (so the test data is not available to me, I am making real-time forecasts). Since the sales of 2019 and 2020 are different (as every year sales are increasing) so to avoid this discrepancy I have standardized the training set i.e. January 2019 sales and trained the model on these standardized values with Rainfall data of January 2019. Now I have the Rainfall forecast of January 2020 (from NWP) to predict the sales of January 2020, here is my question-
Since I have trained the model on standardized values, so my forecast will also be standardized values like (-1.4, 0.8, 0.9 etc). So which dataset I should use to de-standardize my forecast ??
Please Help
If you standardize using jan 2019, then you inverse the transofrm using the same coefficients, from jan 2019.
Thank you for your article.
I got a question about standardization of your data when you want to do a cross-validation using the ‘holdout validation’ method. Do you compute the mean and the standard deviation over the whole data set (test data set + learning data set) and the mean/std for the test data set and another mean/std for the learning data set?
Ideally, per-variable of the training set.
Hi Jason. Thank you for this article, quite helpful. I Just have a question regarding standadization. Should it be perfomed on the whole dataset of just a subset on the data i.e. on the training data only?
You’re welcome.
It is fit on the training set then applied on the train and test sets. We do it this way to avoid data leakage.
Jason, when you say fitting on the training set and transform on the same and test dataset, aren’t we inducing a leakage within the training set itself.
I mean assuming the dataset is sorted in time, the first value in train set is now modified based on stats derived from future values within the same set.
So is a leakage within the training set fine because our model sees it as a whole when it comes to timestamped observations?
In supervised learning we assume observations are stationary/iid, that there is no “time” effect on observations.
If there is, then it must be addressed as you say or the effect must be removed and the data made stationary.
so does we need to normalize/standardize our testing data also?
means we have done feature scaling for training, but our testing data is coming sample by sample, so there we cannot apply feature scaling at each time instant!
please provide some valuable feedback.
Test data should be prepared using the same method as training data.
Can we normalize time series data using histogram binning Method?
You can use binning on a time series, yes.
Hello jason,
I have a data set contains The same Time series “Sensor readings” for different days and I want to make a deep learning model to predict this values so what I did that I splatted the data into Time series data according to the day then I normalized it separately (min-max) (the readings have different ranges for example the max value for the first day 100 but the max for second is 48) but I’m really confiused do I need to normalize it using the max/min over all days or what I did was right?” When I trained my model with the separately normalized Time series it gave me better results than when together normalized”
For time series, you will need to fit the transform on the training set and apply it to new data.
Test with and without the transform and use whatever works best.
sir in my research work i initialy forecastingvegetable price using nn so i hv to scale my price data before training ? and second doubt is which prprocessing technique to use for nnlike mlp.plz can u suggest me as early as possible.
It is a good idea to scale data prior to modeling.
It is also a good idea to try a suite of different data preparations in order to discover what works best for your dataset.
Hi Jason,
I want to apply Deep Neural Network and LSTM, In the Data Preparation phase I have attributes that contain the total number of medications such as Gastrointestinal Medication it contains the total number of Gastrointestinal medication ( the values to this attribute is 0,1,2), in another attribute in the dataset such as Cardiovascular Medication it contains the values (0,1,2,3,4,5,6,7,8,9,10), another attribute Ear, nose and oropharynx Medication contains 0,1 it means the patient used no drugs or one drug.
My question is Can I apply the data normalization in these attributes or not?
<>
The attribute that contains 0,1 definitely I will not apply the normalization. but in the attributes that contain 0,1,2 values, or the examples I mentioned previously do I have to apply the normalization ??
Thanks!!
Yes, normalization sounds like a good thing to try.
Compare model performance with and without the data preparation and use the approach that results in the best performance.
Ok I will, thanks alot
I have a population dataset and there are attribute, whose min and max would be unknow, and I want to normalize the dataset. There is one issue, I am facing, i.e. the dataset is every growing over time and on addition of new data, affects the mean and due to which, the value in some cases fall out of range (0 to 1). Is there any technique, which normalizes the new data without renormalizing the older values and still have the range in between 0 to 1?
Perhaps guess at reasonable min and max?
Perhaps use standardization instead and estimate mean and stev from the sample?
Hey, thanks for the explanations. I was wondering, in general, will normalization always help in training an MLP? What possible dangers can normalization in this way pose to a supervised
learning problem? Are there dimensions that does not make sense to normalize for one reason or another? What are the implications if the normalization becomes a feature in the NN? What if the randomly initialized weights are a lot larger than the normalized numbers?
It can help:
https://machinelearningmastery.com/how-to-improve-neural-network-stability-and-modeling-performance-with-data-scaling/
A possible risk is data leakage:
https://machinelearningmastery.com/data-preparation-without-data-leakage/
Is it wise to normalise/standardise a time series if it has already been tranformed using say a log tranformation to make the data stationonary?
It depends on the data and the mode, but yes it is often a good idea.
Hello Jason –
How do we scale datetime columns? For instance, I have a column with dates…would I need to scale them prior to training? What method for the datetime column would you recommend?
Typically date/time columns are removed.
Nevertheless, perhaps you can try an integer encoding followed by an embedding or normalization.
thanks for this tutorial, it seems the output of the standardization/ normalization is just the temperature column without the DateTime column. what if I want an output of the DateTime column appended to the standardized/normalized temp column.
I mean I want the output as a series with the DateTime column, however, the temperature column being standardized.
is that possible, if yes, how can I do it?
Yes, you would have to store the date/time column in another variable, scale the temp then reconstruct the data frame.
Or use a ColumnTransformer class to selectively transform one column.
Thank you very much for this helpful tutorial. Let’s say I have a human movement dataset in which one movement with multiple repetitions is performed by many subjects. Now CSV file of every subject has a varying length of timestamps (i.e. varying number of rows in each file and the number of columns are same). Is there any method by which I can equalize the timestamps of each movement for model training?
If you’re using an advanced model like an LSTM, you can zero-pad all sequences to the same length and use a masking layer to skip the zero padded values.
Hi Jason,
Thank you for your articles, they’re always incredibly helpful.
What would be your advice for normalising/standardising when each time series sample has a different mean and variance? E.g. say you are developing a model to classify/forecast time series where each sample (input time series) is related but has a different mean and variance due to external factors. Grouping together all of the training points and taking the mean and standard deviation would be meaningless. You could normalise/standardise on a sample-by-sample basis (i.e. for each sample time series, training or real input, translate and scale that sample based on its own statistics before passing it into the model), but those ‘normalised/standardised’ values might not map well onto the other samples, and the model (neural network in my case) wouldn’t really interpret the data very well.
You can try a power transform because the variance is changing. If the mean is changing, take difference.
Hi Jason,
Thank you for your description.
The data is time series, it means the time is important. So, in your guideline, after normalizing data we just have normalized values and we don’t have time column. If we wanna cluster our data after normalization we need the time column.
How can we normalize our data while we keep our time too.
Thanks
You can always save your time column in another array and combine it with the normalized data later.
Hey
Thanks for the tutorial.
How do you avoid lookahead bias in case of time series data ?
Thanks
Simply hold the “future” data from visible to the model. For example, if we train the model with data from time 0 to time T, nothing in time T+k should be ever provided. In next round if we train with another time window, we have to make sure the model’s memory (e.g., in case of LSTM) are cleared. You should never train with a time window but compute the test score with an overlapping window.
So for normalizing data on time T, we will use data from time 0 to time T only, right ?
Yes, you’re right.
Hello, Jason.
Is it okay to use normalization and standardization simultaneously? Are there any studies on the union between the two transformation techniques?
Hi Eduard…the following will provide more on these topics:
https://machinelearningmastery.com/standardscaler-and-minmaxscaler-transforms-in-python/
Regards,
Hi Jason,
How would would normalise when the length of time interval isn’t the same at each timepoint.
For example:
Timepoint1 – Day 3 – x1
Timepoint2 – Day 6 – x2
Timepoint3 – Day 10 – x3
Timepoint4 – Day 13 – x4
Timepoint5 – Day 21 – x5
Timepoint6 – Day 24 – x6
Timepoint7 – Day 31 – x7
Timepoint8 – Day 38- x8
Timepoint9 – Day 45 – x9
Timepoint10 – Day 52 – x10
Timepoint11 – Day 59 – x11
Thanks,
Paddy
Hi Paddy…Some time series data is discontiguous.
This means that the interval between the observations is not consistent, but may vary.
You can learn more about contiguous vs discontiguous time series datasets in this post:
Taxonomy of Time Series Forecasting Problems
There are many ways to handle data in this form and you must discover the approach that works well or best for your specific dataset and chosen model.
The most common approach is to frame the discontiguous time series as contiguous and the observations for the newly observation times as missing (e.g. a contiguous time series with missing values).
Some ideas you may want to explore include:
Ignore the discontiguous nature of the problem and model the data as-is.
Resample the data (e.g. upsample) to have a consistent interval between observations.
Impute the observations to form a consistent interval.
Pad the observations for form a consistent interval and use a Masking layer to ignore the padded values.
Hi Jason,
Do exogenous variables in ARIMAX model need to be standardized before using them? Scale of my variables differ a lot (there is GDP, but also some indexes ranging from 0 to 1).
Thanks,
Jan
Hi Jan…My recommended would normalization based upon the following resouce:
https://machinelearningmastery.com/normalize-standardize-time-series-data-python/
Lets say i use the first 8 years to train, and the last 2 years to test my model. Should i normalize before doing the train/test split? Or the normalization is performed after that? In the case of the normalization being performed after the split, should i need to use two different scalers, one for the train part and one for the test part?
scaler_train = MinMaxScaler()
scaler_test = MinMaxScaler()
x_train_scaled = scaler_train.fit_transform(x_train)
x_test_scaled = scaler_test.fit_transform(x_test)
I understand that if we have multivariate data, then we can go for normalization/ standardization techniques because we would like the different variables in a defined range and which sounds logical. But in this case for example we only have ONE variable, my question is do we really need to normalize/ standardize our data for it? I am not sure to logically understand/ accept these techniques for univariate data.
Great question Saadoon! The following resource may be of interest:
https://medium.com/@urvashilluniya/why-data-normalization-is-necessary-for-machine-learning-models-681b65a05029
while I try run the program it returns an error
ValueError Traceback (most recent call last)
Input In [39], in ()
1 # prepare data for normalization
2 values = series.values
—-> 3 values = values.reshape((len(values), 1))
4 # train the normalization
5 scaler = MinMaxScaler(feature_range=(0, 1))
ValueError: cannot reshape array of size 7300 into shape (3650,1)