Differencing is a popular and widely used data transform for time series.
In this tutorial, you will discover how to apply the difference operation to your time series data with Python.
After completing this tutorial, you will know:
About the differencing operation, including the configuration of the lag difference and the difference order.
How to develop a manual implementation of the differencing operation.
How to use the built-in Pandas differencing function.
Kick-start your project with my new book Time Series Forecasting With Python, including step-by-step tutorials and the Python source code files for all examples.
Let’s get started.
Updated Apr/2019: Updated the link to dataset.
How to Difference a Time Series Dataset with Python Photo by Marcus, some rights reserved.
Why Difference Time Series Data?
Differencing is a method of transforming a time series dataset.
It can be used to remove the series dependence on time, so-called temporal dependence. This includes structures like trends and seasonality.
Differencing can help stabilize the mean of the time series by removing changes in the level of a time series, and so eliminating (or reducing) trend and seasonality.
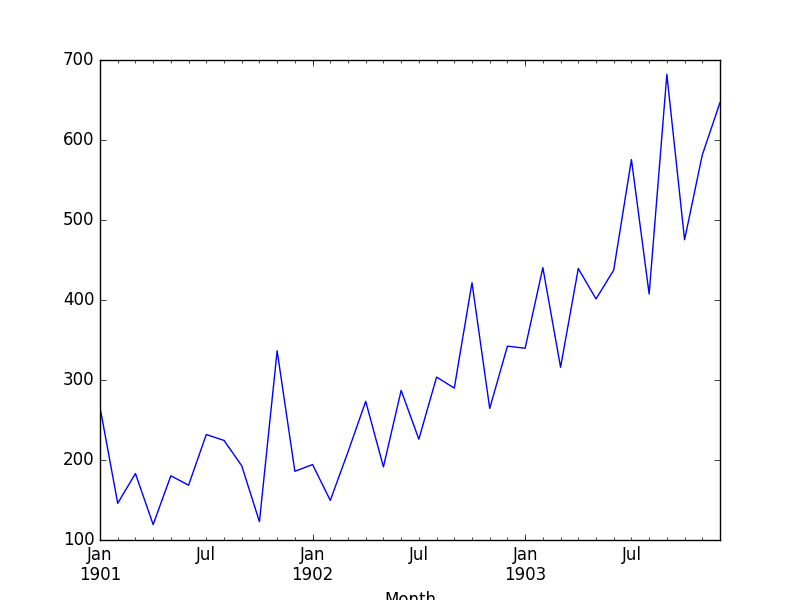
Running the example creates the plot that shows a clear linear trend in the data.
Shampoo Sales Dataset Plot
Manual Differencing
We can difference the dataset manually.
This involves developing a new function that creates a differenced dataset. The function would loop through a provided series and calculate the differenced values at the specified interval or lag.
The function below named difference() implements this procedure.
1
2
3
4
5
6
7
# create a differenced series
def difference(dataset,interval=1):
diff=list()
foriinrange(interval,len(dataset)):
value=dataset[i]-dataset[i-interval]
diff.append(value)
returnSeries(diff)
We can see that the function is careful to begin the differenced dataset after the specified interval to ensure differenced values can, in fact, be calculated. A default interval or lag value of 1 is defined. This is a sensible default.
One further improvement would be to also be able to specify the order or number of times to perform the differencing operation.
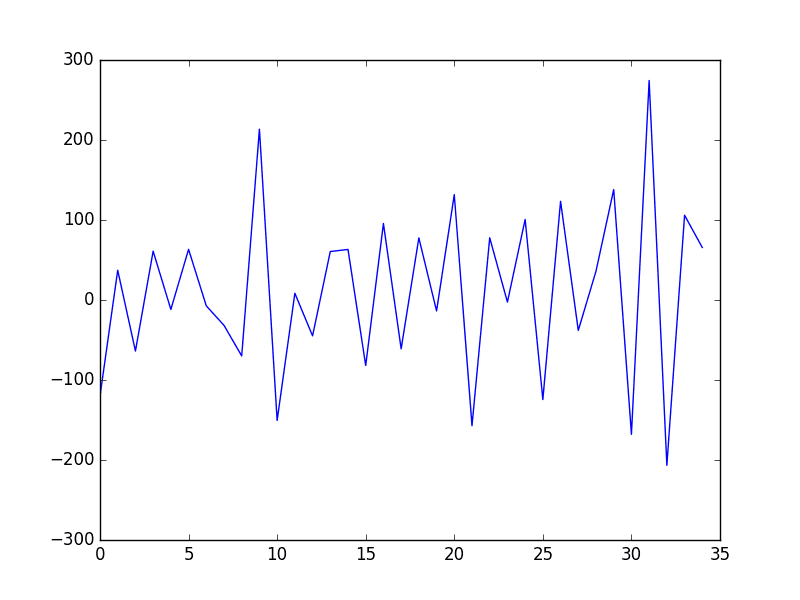
The example below applies the manual difference() function to the Shampoo Sales dataset.
Running the example creates the differenced dataset and plots the result.
Manually Differenced Shampoo Sales Dataset
Automatic Differencing
The Pandas library provides a function to automatically calculate the difference of a dataset.
This diff() function is provided on both the Series and DataFrame objects.
Like the manually defined difference function in the previous section, it takes an argument to specify the interval or lag, in this case called the periods.
The example below demonstrates how to use the built-in difference function on the Pandas Series object.
Are difference functions only useful to remove structures like trends and seasonality,
or can they also be used to build features from trends in data sets?
What other techniques are available to use trends and seasonality in a constructive way in time series predictions?
Hi there,I log on to your new stuff named “How to Difference a Time Series Dataset with Python – Machine Learning Mastery” regularly.Your humoristic style is awesome, keep up the good work! And you can look our website about proxy list.
for “value = int(dataset[i])-int(dataset[i-interval])”
why it shows “TypeError: only length-1 arrays can be converted to Python scalars”
thanks in advance!
Hi Jason, thanks for posting this, but I’m curious what to do about the NAs after using the diff() function? I’m guessing that data should just be removed? Or should they just be imputed?
I TRIED TO RUN YOUR CODE, BUT I RECEIVED THIS MASSAGE
(data_string, format))
ValueError: time data ‘190Sales of shampoo over a three year period’ does not match format ‘%Y-%m’
How does one invert the differencing after the residual forecast has been made to get back to a forecast including the trend and seasonality that was differenced out?
I need to know, how to get the forecast values of unseen data if the data were differenced by first_order.
Detail:
I am doing univariate ARIMA forecasting for oil prices 3 times a day. The data was uneven so interpolated with forward-fill with an hourly rate. I did forecasting using first-order-differencing. To compare test_data and predictions, I reversed the predictions and test-data (integration).
Now the question is what I do when I don’t have test data but I have forecast unseen data. How would I integrate the predictions back to normal then the different predictions?
can u please tell me hoe to extract forecasted value in graph.i got predicted value,but not able to extract forecasted value in python using arima model
# Next -take the exponent of the series from above (anti-log) which will be the predicted value?—?the time series forecast model.
##Now plot the predicted values with the original.
#Find the RMSE
predictions_ARIMA=np.exp(predictions_ARIMA_log)
#Future Prediction
#Predict for 5 year. We have 144 data points + 60 for next 5 yrs. i.e. predict for 204 data points
results_ARIMA.plot_predict(1,204)
# create a differenced series
def difference(dataset, interval=1):
diff = list()
for i in range(interval, len(dataset)):
value = dataset[i] – dataset[i – interval]
diff.append(value)
return Series(diff)
error on
value = dataset[i] – dataset[i – interval]
TypeError: unsupported operand type(s) for -: ‘str’ and ‘str’
Hi Jason, thanks for your very informative tutorials. I’m a PhD student using a time series of ocean data to create a multiple linear regression model (statsmodels GLSAR, as there is autocorrelation of residuals). I’m using the model to then predict past (rather than future) values, but these are for single data points rather than a continuous time series.
However, the dependent variable I am using is not stationary (shows seasonality), and the independent variables show a mix of trend, seasonality and stationarity.
I have a couple of questions:
1) If I want to remove stationarity, I assume I use a mix of differencing and removing trends where applicable, and then create my model. How do I then apply this model to my predictions? Is it the same, or do I need to add the trends/differences back before using it to predict, somehow?
2) I’m using an algorithm to find the combination of independent variables that give the highest R-squared value for my regression. Machine learning is growing in use in my speciality, and I would like to try it. Do you think this sounds suitable? I have 13 years of twice-daily data for training.
I hope this is clear, happy to answer any questions.
Yes, differencing to remove trend, seasonal differencing to remove seasonality. Just like you propagate the differencing down the training set, you can also propagate it down the test set. Then invert the differencing on the predictions to get the original scale.
I recommend testing a suite of methods and use controlled experiments to discover what works best.
I have a data in which I have two indexes, the id and date, each id has a series of dates, and I want to extract the difference between dates for each id.
Developing custom code to meet the requirements of your project. Engineering, not machine learning.
I don’t have the capacity to do engineering for you sorry. If it is challenging you can try posting your question to stackoverflow or hire an engineer?
Hey Jason, love your tutorials! I wanted to ask you how we could plot the trend line if we difference. I’ve been looking everywhere online and I can’t find how?
if i use built it differencing —- diff = series.diff()
how could i inverse it >?
Also is it possible to use built in differencing in multivariate data? how?
What is the discrepancy between what is referred to as ‘log difference’ and ‘first difference’ when differencing a time series? I am looking to use ACF/PACF with stationary/transformed data to estimate my ARIMA parameters but I keep running into these two ‘differences’ and I can’t tell if they’re used interchangeably or not. Also if there is a discrepancy how can we use log difference in our code using pandas?
PS: Jason, your website has helped me during my academic career and now in my early-career as an intern who is hoping to get a full time job soon – I just wanted to thank you for all the work you’ve done.
Thanks for your tutorials. I have a question. After differencing, I am getting a stationary series and that I want to confirm it by doing an ADF Test. This is my code –
from pandas import read_csv
from statsmodels.tsa.stattools import adfuller
series = read_csv(‘D:/Management Books/BSE Index Daily Closing.csv’, header=0, index_col=0, squeeze=True)
X = series.values
diff = series.diff()
X = diff(X)
result = adfuller(X)
print(‘ADF Statistic: %f’ % result[0])
print(‘p-value: %f’ % result[1])
print(‘Critical Values:’)
for key, value in result[4].items():
print(‘\t%s: %.3f’ % (key, value))
When I run it, I get an error like
TypeError Traceback (most recent call last)
in
4 X = series.values
5 diff = series.diff()
—-> 6 X = diff(X)
7 result = adfuller(X)
8 print(‘ADF Statistic: %f’ % result[0])
I like your tutorials very much and its very clear always. I am working on timeseries data(year wise).just started with univariate time series(values in million), there is trend but no seasonality and applied ARIMA model. Few questions in that.
1. I I have applied my model without doing any feature engineering and scaling since its a univariate and i got expected and predicted values nicely. Is this correct or i need to apply diff() function to make the data stationary before apply the model?
2. Then ARIMA(p,d,q) adjusting this parameter i got finalized value like(1,2,0) based on MAPE metric. Is this Correct?
Here itself i can able to identify best value of p (Partial auto correlation), d(differencing value)
and q(Auto correlation).
3. Then what is the purpose of Dicky fuller test and Rolling mean?
4. If the third parameter q=0 means then it can be call it as ARIMA model?.
(if i give any value to q means it asked me to make data stationary. so i make it zero).
5. Can i use df.diff().diff()? . if so can i call it as 2 nd order difference?. Is this meaningful?
(then only the p-value become less than 0.5)
kindly answer my question . Awaiting for your valuable reply.
(1, 2) the I in ARIMA will do the differencing, hence it should make the data stationary by figuring out the right parameter (p,d,q). If you disagree with the fitted result, you can always override it.
(3) Dicky-Fuller test is to check if the series is stationary. Rolling mean is just another name for moving average.
(4) q is the MA parameter, d=0 means stationary
(5) Yes, that is the case of d=2
Thank you for this amazing tutorial! I have one question after reading this: If the data after differencing by subtracting the previous observation from the current observation is seasonal, does that mean the original data is seasonal as well?
i have a question. if the data that we have is in each year (from 2009 to 2020). it is obvious that we have no seasonality, but according to ADF test, it is a non stationary data. Would differencing will make the data stationary or it won’t make any difference?


Hi there, here is a recent work on time series that gives a time series a symbolic representation.
https://arxiv.org/ftp/arxiv/papers/1611/1611.01698.pdf
Thanks for sharing.
Have a question. What if the difference is negative?
Some differences will be positive, some negative.
Hi, which will be the most pythonic way to set the negative difeferece as zero. Let say that I have some bookings for t+1 and a forecast.
My approach is make it work first, then make it readable.
Are difference functions only useful to remove structures like trends and seasonality,
or can they also be used to build features from trends in data sets?
What other techniques are available to use trends and seasonality in a constructive way in time series predictions?
You can use the transformed variables and extracted structures as features, but check that they lift the skill of the model.
See this post on feature engineering in time series forecasting:
https://machinelearningmastery.com/basic-feature-engineering-time-series-data-python/
Thanks for these posts, Dr. Brownlee! I like the picture of the beach
Thanks Chris.
Hi there,I log on to your new stuff named “How to Difference a Time Series Dataset with Python – Machine Learning Mastery” regularly.Your humoristic style is awesome, keep up the good work! And you can look our website about proxy list.
Thanks.
Thank you for valuable insights. Could you please explain how would it be possible to take the third or second difference ?
You apply the difference operation to the already differenced series.
for “value = int(dataset[i])-int(dataset[i-interval])”
why it shows “TypeError: only length-1 arrays can be converted to Python scalars”
thanks in advance!
Perhaps ensure that you have copied all of the code from the example?
Hi Jason, thanks for posting this, but I’m curious what to do about the NAs after using the diff() function? I’m guessing that data should just be removed? Or should they just be imputed?
Removed.
I TRIED TO RUN YOUR CODE, BUT I RECEIVED THIS MASSAGE
(data_string, format))
ValueError: time data ‘190Sales of shampoo over a three year period’ does not match format ‘%Y-%m’
THANK YOU IN ADVANCE
It looks like you might not have deleted the file footer or downloaded the data in a different format.
Here is a direct link to the data file ready to use:
https://raw.githubusercontent.com/jbrownlee/Datasets/master/shampoo.csv
Do you perform differencing on just the output data or do you difference the features if they are time dependent as well?
Both inputs and outputs.
How does one invert the differencing after the residual forecast has been made to get back to a forecast including the trend and seasonality that was differenced out?
Good question, I show how in this post:
https://machinelearningmastery.com/remove-trends-seasonality-difference-transform-python/
Copy Paste ?
https://www.m-asim.com/2018/10/12/how-to-difference-a-time-series-dataset-with-python/
Thanks for this awesome content by the way !
That’s a shame. I’ll ask him to take it down. Google will also penalize him ferociously.
Doing this, I will have no value for the first observation, I mean Yt-Yt-1 will be my first value and I will have an observation less?
Yes.
How to undifference?
Add the values back.
how to do that
This tutorial has an example of differencing and inverse differencing:
https://machinelearningmastery.com/machine-learning-data-transforms-for-time-series-forecasting/
Hi Jason! As always a great tutorial.
I need to know, how to get the forecast values of unseen data if the data were differenced by first_order.
Detail:
I am doing univariate ARIMA forecasting for oil prices 3 times a day. The data was uneven so interpolated with forward-fill with an hourly rate. I did forecasting using first-order-differencing. To compare test_data and predictions, I reversed the predictions and test-data (integration).
Now the question is what I do when I don’t have test data but I have forecast unseen data. How would I integrate the predictions back to normal then the different predictions?
the ARIMA will perform the differencing and inverse-differencing for you via the d parameter.
Otherwise, you can do it manually, here’s code to do it:
https://machinelearningmastery.com/machine-learning-data-transforms-for-time-series-forecasting/
can u please tell me hoe to extract forecasted value in graph.i got predicted value,but not able to extract forecasted value in python using arima model
predictions_ARIMA_diff=pd.Series(results_ARIMA.fittedvalues, copy=True)
print(predictions_ARIMA_diff.head())
predictions_ARIMA_diff_cumsum=predictions_ARIMA_diff.cumsum()
print(predictions_ARIMA_diff_cumsum.head())
predictions_ARIMA_log=pd.Series(ts_log[0],index=ts_log.index)
predictions_ARIMA_log=predictions_ARIMA_log.add(predictions_ARIMA_diff_cumsum, fill_value=0)
predictions_ARIMA_log.head()
# Next -take the exponent of the series from above (anti-log) which will be the predicted value?—?the time series forecast model.
##Now plot the predicted values with the original.
#Find the RMSE
predictions_ARIMA=np.exp(predictions_ARIMA_log)
plt.plot(ts)
plt.plot(predictions_ARIMA)
plt.title(‘RMSE: %.4f’% np.sqrt(sum((predictions_ARIMA-ts)**2)/len(ts)))
#Future Prediction
#Predict for 5 year. We have 144 data points + 60 for next 5 yrs. i.e. predict for 204 data points
results_ARIMA.plot_predict(1,204)
You can plot a forecast using matplotlib, e.g. the plot() function.
Hi Jason,
Can you perform differencing while also adding a lag of a variable (dependent or independent) in the equation?
Thanks
Sure.
Great python tutorial on time series.
Thanks! I’m glad it helped.
unable to run
# create a differenced series
def difference(dataset, interval=1):
diff = list()
for i in range(interval, len(dataset)):
value = dataset[i] – dataset[i – interval]
diff.append(value)
return Series(diff)
error on
value = dataset[i] – dataset[i – interval]
TypeError: unsupported operand type(s) for -: ‘str’ and ‘str’
Sorry to hear that, this might help:
https://machinelearningmastery.com/faq/single-faq/why-does-the-code-in-the-tutorial-not-work-for-me
Just read the error. Clearly
datasetis an array of strings while it should be floats/ints.Hi Jason, thanks for your very informative tutorials. I’m a PhD student using a time series of ocean data to create a multiple linear regression model (statsmodels GLSAR, as there is autocorrelation of residuals). I’m using the model to then predict past (rather than future) values, but these are for single data points rather than a continuous time series.
However, the dependent variable I am using is not stationary (shows seasonality), and the independent variables show a mix of trend, seasonality and stationarity.
I have a couple of questions:
1) If I want to remove stationarity, I assume I use a mix of differencing and removing trends where applicable, and then create my model. How do I then apply this model to my predictions? Is it the same, or do I need to add the trends/differences back before using it to predict, somehow?
2) I’m using an algorithm to find the combination of independent variables that give the highest R-squared value for my regression. Machine learning is growing in use in my speciality, and I would like to try it. Do you think this sounds suitable? I have 13 years of twice-daily data for training.
I hope this is clear, happy to answer any questions.
Yes, differencing to remove trend, seasonal differencing to remove seasonality. Just like you propagate the differencing down the training set, you can also propagate it down the test set. Then invert the differencing on the predictions to get the original scale.
I recommend testing a suite of methods and use controlled experiments to discover what works best.
Hi Jason, thank you for this great tutorial,
I would like to know how to difference a time series date attribute to get a series of durations ?
Sorry, I don’t understand your question. Can you please elaborate?
I have a data in which I have two indexes, the id and date, each id has a series of dates, and I want to extract the difference between dates for each id.
Great. Sounds like you will need to develop some custom code.
what do you propose?
Developing custom code to meet the requirements of your project. Engineering, not machine learning.
I don’t have the capacity to do engineering for you sorry. If it is challenging you can try posting your question to stackoverflow or hire an engineer?
Hey Jason, love your tutorials! I wanted to ask you how we could plot the trend line if we difference. I’ve been looking everywhere online and I can’t find how?
Thanks!
If you plot the raw data (before differencing) you should be able to see the trend if present.
if i use built it differencing —- diff = series.diff()
how could i inverse it >?
Also is it possible to use built in differencing in multivariate data? how?
You can see examples of differencing and inverse differencing here:
https://machinelearningmastery.com/machine-learning-data-transforms-for-time-series-forecasting/
What is the discrepancy between what is referred to as ‘log difference’ and ‘first difference’ when differencing a time series? I am looking to use ACF/PACF with stationary/transformed data to estimate my ARIMA parameters but I keep running into these two ‘differences’ and I can’t tell if they’re used interchangeably or not. Also if there is a discrepancy how can we use log difference in our code using pandas?
PS: Jason, your website has helped me during my academic career and now in my early-career as an intern who is hoping to get a full time job soon – I just wanted to thank you for all the work you’ve done.
I’ve not heard the terms, sorry.
You can log the data, you can difference the data, and you can do both with different order.
Hi Jason,
Thanks for your tutorials. I have a question. After differencing, I am getting a stationary series and that I want to confirm it by doing an ADF Test. This is my code –
from pandas import read_csv
from statsmodels.tsa.stattools import adfuller
series = read_csv(‘D:/Management Books/BSE Index Daily Closing.csv’, header=0, index_col=0, squeeze=True)
X = series.values
diff = series.diff()
X = diff(X)
result = adfuller(X)
print(‘ADF Statistic: %f’ % result[0])
print(‘p-value: %f’ % result[1])
print(‘Critical Values:’)
for key, value in result[4].items():
print(‘\t%s: %.3f’ % (key, value))
When I run it, I get an error like
TypeError Traceback (most recent call last)
in
4 X = series.values
5 diff = series.diff()
—-> 6 X = diff(X)
7 result = adfuller(X)
8 print(‘ADF Statistic: %f’ % result[0])
TypeError: ‘Series’ object is not callable
Please lemme know how to rectify the error.
You’re welcome.
Perhaps try extracting the numpy array from the series after differencing?
Hi Jason,
Thanks a lot for your helped. It worked. Bingo !!!!!!
Well done, I’m happy to hear that!
Hi Jason
How do we convert the values back to original scale to be able to compare prediction with actual?
You can call inverse_transform(), see this tutorial for more information:
https://machinelearningmastery.com/convert-time-series-supervised-learning-problem-python/
Hi Jason,
I like your tutorials very much and its very clear always. I am working on timeseries data(year wise).just started with univariate time series(values in million), there is trend but no seasonality and applied ARIMA model. Few questions in that.
1. I I have applied my model without doing any feature engineering and scaling since its a univariate and i got expected and predicted values nicely. Is this correct or i need to apply diff() function to make the data stationary before apply the model?
2. Then ARIMA(p,d,q) adjusting this parameter i got finalized value like(1,2,0) based on MAPE metric. Is this Correct?
Here itself i can able to identify best value of p (Partial auto correlation), d(differencing value)
and q(Auto correlation).
3. Then what is the purpose of Dicky fuller test and Rolling mean?
4. If the third parameter q=0 means then it can be call it as ARIMA model?.
(if i give any value to q means it asked me to make data stationary. so i make it zero).
5. Can i use df.diff().diff()? . if so can i call it as 2 nd order difference?. Is this meaningful?
(then only the p-value become less than 0.5)
kindly answer my question . Awaiting for your valuable reply.
(1, 2) the I in ARIMA will do the differencing, hence it should make the data stationary by figuring out the right parameter (p,d,q). If you disagree with the fitted result, you can always override it.
(3) Dicky-Fuller test is to check if the series is stationary. Rolling mean is just another name for moving average.
(4) q is the MA parameter, d=0 means stationary
(5) Yes, that is the case of d=2
Thank you so much for your reply.
Hi Jason,
Thank you for this amazing tutorial! I have one question after reading this: If the data after differencing by subtracting the previous observation from the current observation is seasonal, does that mean the original data is seasonal as well?
Hi JK…The following may help add clarity:
https://machinelearningmastery.com/time-series-seasonality-with-python/
https://machinelearningmastery.com/remove-trends-seasonality-difference-transform-python/
i have a question. if the data that we have is in each year (from 2009 to 2020). it is obvious that we have no seasonality, but according to ADF test, it is a non stationary data. Would differencing will make the data stationary or it won’t make any difference?
Hi SNA…We recommend that you try differencing and also not differencing and compare the results.