Time series datasets may contain trends and seasonality, which may need to be removed prior to modeling.
Trends can result in a varying mean over time, whereas seasonality can result in a changing variance over time, both which define a time series as being non-stationary. Stationary datasets are those that have a stable mean and variance, and are in turn much easier to model.
Differencing is a popular and widely used data transform for making time series data stationary.
In this tutorial, you will discover how to apply the difference operation to your time series data with Python.
After completing this tutorial, you will know:
The contrast between a stationary and non-stationary time series and how to make a series stationary with a difference transform.
How to apply the difference transform to remove a linear trend from a series.
How to apply the difference transform to remove a seasonal signal from a series.
Kick-start your project with my new book Deep Learning for Time Series Forecasting, including step-by-step tutorials and the Python source code files for all examples.
Let’s get started.
How to Remove Trends and Seasonality with a Difference Transform in Python Photo by NOAA, some rights reserved.
Tutorial Overview
This tutorial is divided into 4 parts; they are:
Stationarity
Difference Transform
Differencing to Remove Trends
Differencing to Remove Seasonality
Stationarity
Time series is different from more traditional classification and regression predictive modeling problems.
The temporal structure adds an order to the observations. This imposed order means that important assumptions about the consistency of those observations needs to be handled specifically.
For example, when modeling, there are assumptions that the summary statistics of observations are consistent. In time series terminology, we refer to this expectation as the time series being stationary.
These assumptions can be easily violated in time series by the addition of a trend, seasonality, and other time-dependent structures.
Stationary Time Series
The observations in a stationary time series are not dependent on time.
Time series are stationary if they do not have trend or seasonal effects. Summary statistics calculated on the time series are consistent over time, like the mean or the variance of the observations.
When a time series is stationary, it can be easier to model. Statistical modeling methods assume or require the time series to be stationary.
Non-Stationary Time Series
Observations from a non-stationary time series show seasonal effects, trends, and other structures that depend on the time index.
Summary statistics like the mean and variance do change over time, providing a drift in the concepts a model may try to capture.
Classical time series analysis and forecasting methods are concerned with making non-stationary time series data stationary by identifying and removing trends and removing stationary effects.
Making Series Data Stationary
You can check if your time series is stationary by looking at a line plot of the series over time.
Sign of obvious trends, seasonality, or other systematic structures in the series are indicators of a non-stationary series.
A more accurate method would be to use a statistical test, such as the Dickey-Fuller test.
Should you make your time series stationary?
Generally, yes.
If you have clear trend and seasonality in your time series, then model these components, remove them from observations, then train models on the residuals.
If we fit a stationary model to data, we assume our data are a realization of a stationary process. So our first step in an analysis should be to check whether there is any evidence of a trend or seasonal effects and, if there is, remove them.
Statistical time series methods and even modern machine learning methods will benefit from the clearer signal in the data.
Need help with Deep Learning for Time Series?
Take my free 7-day email crash course now (with sample code).
Click to sign-up and also get a free PDF Ebook version of the course.
Difference Transform
Differencing is a method of transforming a time series dataset.
It can be used to remove the series dependence on time, so-called temporal dependence. This includes structures like trends and seasonality.
Differencing can help stabilize the mean of the time series by removing changes in the level of a time series, and so eliminating (or reducing) trend and seasonality.
Differencing is performed by subtracting the previous observation from the current observation.
1
difference(t) = observation(t) - observation(t-1)
Inverting the process is required when a prediction must be converted back into the original scale.
This process can be reversed by adding the observation at the prior time step to the difference value.
1
inverted(t) = differenced(t) + observation(t-1)
In this way, a series of differences and inverted differences can be calculated.
Lag Difference
Taking the difference between consecutive observations is called a lag-1 difference.
The lag difference can be adjusted to suit the specific temporal structure.
For time series with a seasonal component, the lag may be expected to be the period (width) of the seasonality.
Difference Order
Some temporal structure may still exist after performing a differencing operation, such as in the case of a nonlinear trend.
As such, the process of differencing can be repeated more than once until all temporal dependence has been removed.
The number of times that differencing is performed is called the difference order.
Calculating Differencing
We can difference the dataset manually.
This involves developing a new function that creates a differenced dataset. The function would loop through a provided series and calculate the differenced values at the specified interval or lag.
The function below named difference() implements this procedure.
1
2
3
4
5
6
7
# create a differenced series
def difference(dataset,interval=1):
diff=list()
foriinrange(interval,len(dataset)):
value=dataset[i]-dataset[i-interval]
diff.append(value)
returnSeries(diff)
We can see that the function is careful to begin the differenced dataset after the specified interval to ensure differenced values can, in fact, be calculated. A default interval or lag value of 1 is defined. This is a sensible default.
One further improvement would be to also be able to specify the order or number of times to perform the differencing operation.
The function below named inverse_difference() inverts the difference operation for a single forecast. It requires that the real observation value for the previous time step also be provided.
1
2
3
# invert differenced forecast
def inverse_difference(last_ob,value):
returnvalue+last_ob
Differencing to Remove Trends
In this section, we will look at using the difference transform to remove a trend.
A trend makes a time series non-stationary by increasing the level. This has the effect of varying the mean time series value over time.
The example below applies the difference() function to a contrived dataset with a linearly increasing trend.
Running the example first prints the contrived sequence with a linear trend. Next, the differenced dataset is printed showing the increase by one unit each time step. The length of this sequence is 19 instead of 20 as the difference for the first value in the sequence cannot be calculated as there is no prior value.
Finally, the difference sequence is inverted using the prior values from the original sequence as the primer for each transform.
In this section, we will look at using the difference transform to remove seasonality.
Seasonal variation, or seasonality, are cycles that repeat regularly over time.
A repeating pattern within each year is known as seasonal variation, although the term is applied more generally to repeating patterns within any fixed period.
There are many types of seasonality. Some obvious examples include; time of day, daily, weekly, monthly, annually, and so on. As such, identifying whether there is a seasonality component in your time series problem is subjective.
The simplest approach to determining if there is an aspect of seasonality is to plot and review your data, perhaps at different scales and with the addition of trend lines.
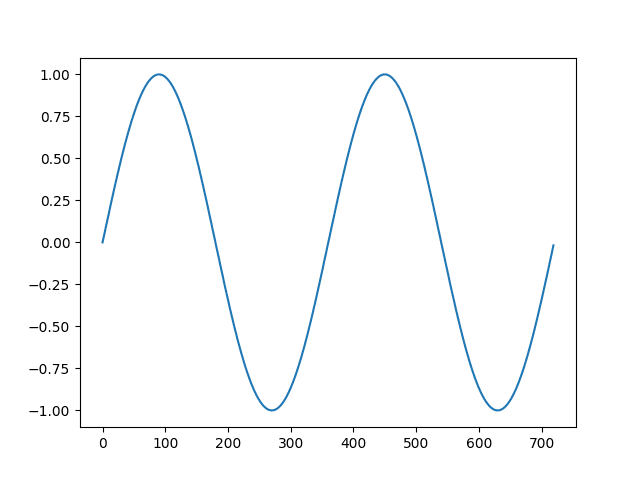
The example below applies the difference() function to a contrived seasonal dataset. The dataset includes two cycles of 360 units each.
Running the example first creates and plots the dataset of two cycles of the 360 time step series.
Line plot of a contrived sesonal dataset
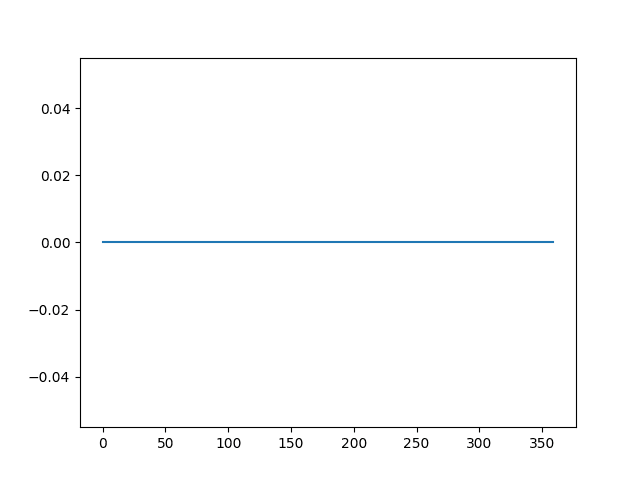
Next, the difference transform is applied and the result is plotted. The plot shows 360 zero values with all seasonality signal removed.
In the de-trending example above, differencing was applied with a lag of 1, which means the first value was sacrificed. Here an entire cycle is used for differencing, that is 360 time steps. The result is that the entire first cycle is sacrificed in order to difference the second cycle.
Line plot of the differenced seasonal dataset
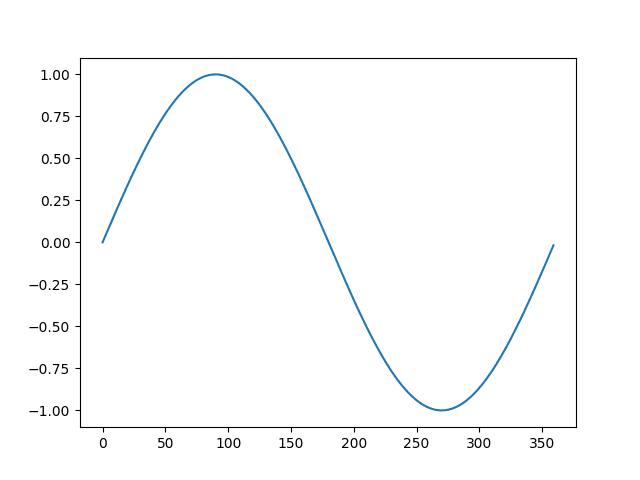
Finally, the transform is inverted showing the second cycle with the seasonality restored.
Line plot of the differenced dataset with the inverted difference transform
In this tutorial, you discovered the distinction between stationary and non-stationary time series and how to use the difference transform to remove trends and seasonality with Python.
Specifically, you learned:
The contrast between a stationary and non-stationary time series and how to make a series stationary with a difference transform.
How to apply the difference transform to remove a linear trend from a series.
How to apply the difference transform to remove a seasonal signal from a series.
Do you have any questions about making time series stationary?
Ask your questions in the comments and I will do my best to answer.
Develop Deep Learning models for Time Series Today!
Excellent article, explains a lot. Just learned about standard deviations so this is a nice compliment to that.
I find it interesting how removing trends and seasonality resembles how some networks (such as convnet) drive towards transforming inputs into (translation) invariant outputs.
First, my best wishes for the New Year and thank you again for the helpful post.
I have a question concerning predicting the first order difference and recovering the initial data.
I have a panel data with autocorrelated dependent variable y lagged with 12 time steps with the independent variables X.
After taking the first order difference, I forecast that new dependent variable based on the differentiated independent variables, let’s call these y’ and X’.
y’_{i, t+1} = y_{i, t+1} – y_{i, t}
X’_{i, t} = X_{i, t} – X_{i, t-1}
and
y’_{i, t} = f(X_{i, t-1})
I run my regression model and find an R-squared of 27%.
To recover the prediction of my initial dependent variable my operation is:
\hat{y}'{i, t} = y_{i, t-12} + \sum_{s=t-11}^{t}\hat{y}’_{i, s}
(because I am not supposed to know the real ys for months t-11 through t)
My R-squared drops to -8% while the R-squared for \sum_{s=t-11}^{t}\hat{y}’_{i, s} is around 30%.
I was wondering if you can detect something wrong in that reasoning or if it is something normal.
Also, is there a way to work with non-stationary data and adjust the residual errors in the end to take into account the autocorrelation. I have some other problems in which the dependent variable can be constant for several time steps (a risk measure based on daily observations calculated over a one year time window and the time step is one month).
Thank you!
Hi Jason,
How to detrend using a scientifically determined trend approximation.
In my case, I have a measure called: GHI, which in simple terms: the amount of sun rays ground receives from the Sun. Used in energy fields of studies especially solar energy.
So, a real GHI measured usings sensors, and a clear_GHI, estimated following The Ineichen and Perez clear sky model.
The trend is very obvious, as you can see here: https://pvlib-python.readthedocs.io/en/latest/clearsky.html at least in the location I’m interested in.
First thought, I calculated
ghi / clear_ghi
But this seems very bad, since, values close to zero, at sunrise and sunset, are so fragile to division, as those values might not be so correct.
Hi Jason,
Thank you for your explination it was very useful.
My q is why we need to remove seasonality and trend..can you summarize the reasons in clear points ?
Thanks for this great article. I have few doubts and I will try to put them here in words:
1) Most of the practical time series have seasonal patterns and a trend. For making this stationary we need to remove both the seasonality as well as trend. Is it correct?
2) Models like SARIMAX(Seasonal ARIMA) have a parameter ‘d’ for differencing and a seasonal parameter too. So does it mean that the the original time series data can be fed directly to this model and let the ‘d’ difference term remove trend and seasonality parameter take care of the seasonality factor.
3) It gets confusing here because at one point we say to remove both trend and seasonality, and then talk about SARIMAX model which can handle non-stationary data.
I hope you read my confused mind. Looking forward to hear from you.
Best Regards
Chandan
Yes, if the data has trend and seasonality, both should be removed before modeling with a linear algorithm.
Yes, no need to make the data stationary when using SARIMA, as you will specify how to de-trend and de-seasonalize the model as part of the config. You can make it stationary beforehand if you wish.
So if I understand this well, we usually remove trend and seasonality by difference(with lag=1 or lag=seasonality), log transforms etc. mainly for two purposes:
– By verifying if the residuals have no pattern and is stationary
– ACF and PACF do not show high variations
And then by looking at the ACF and PACF we choose parameters which we feed to original data series when using SARIMA.
Online searches show conflicting results and I would like to know your opinion. If we use MLP, is it necessary to remove trend and seasonality? If yes, then what is the point of actually using ANN, if simple ARIMA (or ARMA) can get the job done?
Can you please help me to find out -How does one invert the differencing after the residual forecast has been made to get back to a forecast including the trend and seasonality that was differenced out? After differencing the original data set 1 time and completing the prediction, how do I invert or reverse the differencing so that I can get the predicted data without differences?
I am not sure if my time series data is has seasonality or trend since it looks kinda like random noise. So I assume the data is stationary already. Does it hurt to perform differencing for stationary data before training, or should I leave differencing out?
Great Article….
1. If our dataset have trend and seasonality but the model perform well on that without removing trend and seasonality. So the question is that should we remove seasonality and trend for that model or not?
2.And plz provide the link of your article of complete project of removing seasonality and trend for model. if any?
If you get better performance by not making the series stationary, then don’t make it stationary. But be sure you are making a fair comparison between the two models.
I’m developing a time-series forecasting application for 15-minute data. I want to try out differencing (been applying more traditional scaling), but also want to leave out outliers (entire days that do not apply or where the data will corrupt the training), but this then introduces outliers in the differenced set!
How do you suggest I can handle outliers using differencing?
I have a daily time-scale data series comprising 200 records. In order to plot seasonality, shall i keep freq 1? When i set it 1, i observe a straight line and when i make it 7 then i see an alternating current pattern. Can you please guide, what value of freq should i rely on?
Thank you for your excellent article and website. Quite some work you have put into this.
I was just wondering if you would always remove seasonality from your data. Wouldn’t your algorithm get some insight from knowing of this seasonal pattern, when forecasting or am I missing something?
so we keep differencing until we notice a linear trend? btw add a grayish border around the input tags to make it visible. I can help with the code if u want.
Thanks for all your awesome material. There might be a typo in one of the comments in the first block of code after the title ‘Differencing to Remove Seasonality’ on line 17. It reads..
If I use either Fourier transform or Wavelet transform instead of differencing transform to denoise my non-stationary data, is it correct to say that I have also make it stationary? or is differencing transform required to make data stationary?
Thank you for the great post. I have a small question if you can assist me with.
The time-series I am working with clearly has seasonal variation, but the ADF test shows that the data is indeed stationary. so that means I can start with d=0 and D=0?
Thank you for the great article!
I had to differentiate my Series twice in order to become stationary.
I then fed the double-differentiated Serie to my model and gained a forecast.
Now I struggle to transform the forecast back since I have no values for the one-time differentiated series.
I assume it should be possible with a recursive approach but can’t get it right. Do you have any advice?
I have a small question, should I consider a trend to be present in a typical DC-Motor current consumption plot (current v/s time), like this one http://tiny.cc/xoqtsz
If a dataset needs to be differenced. Do you also have too difference transform? Or when would someone need to use transform in addition to differencing the dataset?
Would one just try both differencing & differencing transform to see what results look best?
If I used the Python auto ARIMA pmdarima would you know if that differences that data automatically? I know it can select different ARIMA models including SARIMA.
import pmdarima as pm
model = pm.auto_arima(need_to_train, seasonal=True)
Im guessing I shouldn’t be differencing the data if using this, would you have any recommendations?
I noticed that in your other post (LSTM) for time series using machine learning that you also differenced the shampoo sales dataset. Is differencing the data good for ML too? I may try that differencing datasets for ML & Arima. For some reason I thought differencing datasets was only for statistic models like VAR, ARIMA, SARIMA and not ML practices…
Hello Jason,
Thank you for your very helpful article.
I have a time series dataset with several features : some features are stationary and some features are not stationary.
I guess I only need to difference the non stationary features right ? The stationary features does not have to be modified ?
The dataset that I have is an electricity type data set from a building power meter and I can find I can train a decent NN model with including a lot of weather data and also a lot of one hot encoding dummy variables for time-of-week. (day, hour, month number, etc.)
I am experimenting in Python with the Tensorflow Keras library and I know the default during the training process randomly shuffles the data. Is this a No-No for a time series type problem where the random shuffle will take out the seasonality from the data? (stationary/non-stationary) The results shuffling the data really aren’t that bad at a glance but not-randomly shuffling the data the results for MLP NN are poor, like the model doesn’t train well.
I know some other times series forecast methods can include ARIMA, LSTM, etc. but I was curious to inquire if MLP can be used for these purposes too? What I ultimately need is a short term forecast method that can incorporate hourly weather forecast (from a web API) to forecast future hourly building electricity. Any tips greatly appreciated.
Cool thanks for all the info. So if I used multivariate sliding window for MLP NN, is Ok when training the model that shuffle_data == True? or should I not shuffle training data…? Thanks so much!
I have a few questions on how to de-seasonalize my multivariate data set.
The data contains some categorical and some continuous features. I can see that there is both a weekly and daily cycle in my target column values – how would I perform two different seasonal differences?
An additional complexity is that other features have different seasonal periods – for example, my “temperature” column has a different period than my energy “usage in kwh” column. How would you proceed in that case? Can you simply perform seasonal adjustment independently across features and then join the features all back together when modelling?
Thanks for your articles and your continual answers to questions – I have been referencing them heavily during this project!
Thanks for the help Jason! I have another related question – some of my features are things like “day of week”, which is a categorical value. I am a bit confused how to how de-seasonalize such data since it is by nature cyclical – should I just remove the entire feature itself?
I want to convert the data to a supervised learning problem by computing lag and stats features based on my target. In this case, should we first difference the target column to make it stationary before generating the extra lag features ?
I actually wanted to know if generating lags features based on residual time series (i.e. differenced time series) was the right approach for a supervised learning problem because I haven’t see it in practice yet.
In order to find seasonality and forecast:
1_ can we Fourier transfer the series, find freq components, add them, inverse Fourier transfer the added components to have seasonality, subtract seasonality from the series, forecast subtracted series, and add back the seasonality to forecast?
2_ while we can easily have seasonality component from decomposition, why people do other approaches to find it? It is not accurate?
Hello. These posts have been very useful to me.
In my study, I have a multivariate time series, some variables are stationary and others aren’t. When transforming with simple difference ( df.diff() ) the whole data, I question myself: is it bad to transform data already stationary? But transforming just some does not seem reasonable… The other thing is that, after the transform, some variables become flat (almost constant throughout time). Does this mean that I should transform data with for example more lag? yearly?
Probably not, if some variables are not stationary, consider making them stationary and compare the performance of the model fit on the raw data directly.
I continually read about stationarity testing in the context of time series forecasting. Do you need to test and account for stationarity only in the context of time series classification? Or is it just a test and see type of scenario? I can’t seem to find any authoritative literature that states the underlying assumptions of classification models that require stationarity.
Stationarity is usually an assumption when we apply ARMA model, for example. In simple regression, we also care about stationarity because of the i.i.d. assumption.
How to get back the original values from the first difference? As I am trying to forecast the future values of commodity price using ARIMA and as the dataset was non-stationary, I took the first difference of the price and trained the model on the first difference. From the predicted output, how to get back the original forecasted price? I am really confused about this part.
Hello. When i make my data stationary with this method, im having a lot of zeroes and my prediction is being flat (LSTM) but if i run this multiple times my p value is being 0 (rounded probably) and my predictions are being much better. How would you explain that?
Thanks!


Excellent article, explains a lot. Just learned about standard deviations so this is a nice compliment to that.
I find it interesting how removing trends and seasonality resembles how some networks (such as convnet) drive towards transforming inputs into (translation) invariant outputs.
On that note, theres a tangentially related article that I thought you might enjoy – http://news.mit.edu/2012/brain-waves-encode-rules-for-behavior-1121
Earl Miller is doing some really fascinating work, and so are you.
Nice!
Incredibly helpful – thanks for this!
Thanks, I’m glad to hear that.
In time series if both trend and seasonality is present then first whether we remove trend and then seasonality or vice varsa to fit the model.
Remove seasonality then trend.
Why does it make a difference which one you remove first?
Because they interact linearly.
How I can remove seasonality without knowing the lag of period?
Why not just find out the structure of the seasonality?
Can you give an example of how you might find the structure or the ideal lag width? If that’s above somewhere I am sorry…
Yes, use a grid search of different lag values and use the value that results in the best performance on your test harness.
Hi Jason!
First, my best wishes for the New Year and thank you again for the helpful post.
I have a question concerning predicting the first order difference and recovering the initial data.
I have a panel data with autocorrelated dependent variable y lagged with 12 time steps with the independent variables X.
After taking the first order difference, I forecast that new dependent variable based on the differentiated independent variables, let’s call these y’ and X’.
y’_{i, t+1} = y_{i, t+1} – y_{i, t}
X’_{i, t} = X_{i, t} – X_{i, t-1}
and
y’_{i, t} = f(X_{i, t-1})
I run my regression model and find an R-squared of 27%.
To recover the prediction of my initial dependent variable my operation is:
\hat{y}'{i, t} = y_{i, t-12} + \sum_{s=t-11}^{t}\hat{y}’_{i, s}
(because I am not supposed to know the real ys for months t-11 through t)
My R-squared drops to -8% while the R-squared for \sum_{s=t-11}^{t}\hat{y}’_{i, s} is around 30%.
I was wondering if you can detect something wrong in that reasoning or if it is something normal.
Also, is there a way to work with non-stationary data and adjust the residual errors in the end to take into account the autocorrelation. I have some other problems in which the dependent variable can be constant for several time steps (a risk measure based on daily observations calculated over a one year time window and the time step is one month).
Thank you!
You can invert the differenced prediction using real or predicted obs, depending on what is available.
Hi Jason,
How to detrend using a scientifically determined trend approximation.
In my case, I have a measure called: GHI, which in simple terms: the amount of sun rays ground receives from the Sun. Used in energy fields of studies especially solar energy.
So, a real GHI measured usings sensors, and a clear_GHI, estimated following The Ineichen and Perez clear sky model.
The trend is very obvious, as you can see here: https://pvlib-python.readthedocs.io/en/latest/clearsky.html at least in the location I’m interested in.
First thought, I calculated
ghi / clear_ghi
But this seems very bad, since, values close to zero, at sunrise and sunset, are so fragile to division, as those values might not be so correct.
I think of
clear_ghi – ghi
Thank you so much !
Perhaps you mean seasonal cycle instead of trend?
You can remove the seasonal cycle by seasonal differencing.
Many thanks Jason, your blog is amazing. I will give it a try
Thanks.
Hi Jason,
Thank you for your explination it was very useful.
My q is why we need to remove seasonality and trend..can you summarize the reasons in clear points ?
It makes the problem a lot simpler to model.
The trend and seasonality are the easy parts, so easy that we want to remove them now so we can focus on the hard parts of the problem.
Hi Jason,
Thanks for this great article. I have few doubts and I will try to put them here in words:
1) Most of the practical time series have seasonal patterns and a trend. For making this stationary we need to remove both the seasonality as well as trend. Is it correct?
2) Models like SARIMAX(Seasonal ARIMA) have a parameter ‘d’ for differencing and a seasonal parameter too. So does it mean that the the original time series data can be fed directly to this model and let the ‘d’ difference term remove trend and seasonality parameter take care of the seasonality factor.
3) It gets confusing here because at one point we say to remove both trend and seasonality, and then talk about SARIMAX model which can handle non-stationary data.
I hope you read my confused mind. Looking forward to hear from you.
Best Regards
Chandan
Yes, if the data has trend and seasonality, both should be removed before modeling with a linear algorithm.
Yes, no need to make the data stationary when using SARIMA, as you will specify how to de-trend and de-seasonalize the model as part of the config. You can make it stationary beforehand if you wish.
I hope that helps.
Thanks for replying Sir.
So if I understand this well, we usually remove trend and seasonality by difference(with lag=1 or lag=seasonality), log transforms etc. mainly for two purposes:
– By verifying if the residuals have no pattern and is stationary
– ACF and PACF do not show high variations
And then by looking at the ACF and PACF we choose parameters which we feed to original data series when using SARIMA.
The SARIMA can model the trend and seasonality directly.
I got you Sir. But SARIMA needs to be fed with parameters and I have seen your posts that you use ACF and PACF charts to deduce them.
You can also use grid search:
https://machinelearningmastery.com/how-to-grid-search-sarima-model-hyperparameters-for-time-series-forecasting-in-python/
Hi Jason,
First of all thank you so much for creating these posts!
I was also reading this post of yours (https://machinelearningmastery.com/regression-tutorial-keras-deep-learning-library-python/) that uses SciKit’s pipelines, and was wondering if there is an estimator for differencing the series and in this case if it would be beneficial or even a good practice to use it in the pipeline.
Kind regards,
João
Good point.
I’ve not seen one, but it would be valuable!
Why do we always prefer stationary data to perform time series analysis?
what is that which refrains us to analyse non- stationary data?
A stationary time series is much simpler to model.
Jason,
Online searches show conflicting results and I would like to know your opinion. If we use MLP, is it necessary to remove trend and seasonality? If yes, then what is the point of actually using ANN, if simple ARIMA (or ARMA) can get the job done?
It is often a good idea and will make the dataset easier to model.
Try with/without for your data and model and compare the results.
Hi Jason,
Can you please help me to find out -How does one invert the differencing after the residual forecast has been made to get back to a forecast including the trend and seasonality that was differenced out? After differencing the original data set 1 time and completing the prediction, how do I invert or reverse the differencing so that I can get the predicted data without differences?
You can invert the difference by adding the removed value and propagating this down the series.
I have an example here you can use:
https://machinelearningmastery.com/machine-learning-data-transforms-for-time-series-forecasting/
Hello sir, is differencing the same as sliding window? if not, have any link to learn it ?
No, sliding window is a way to frame a time series problem, differencing is a way to remove trend/seasonality from time series data.
I am not sure if my time series data is has seasonality or trend since it looks kinda like random noise. So I assume the data is stationary already. Does it hurt to perform differencing for stationary data before training, or should I leave differencing out?
Try modeling with an without differencing and compare model error.
Great Article….
1. If our dataset have trend and seasonality but the model perform well on that without removing trend and seasonality. So the question is that should we remove seasonality and trend for that model or not?
2.And plz provide the link of your article of complete project of removing seasonality and trend for model. if any?
If you get better performance by not making the series stationary, then don’t make it stationary. But be sure you are making a fair comparison between the two models.
Yes, see this post:
https://machinelearningmastery.com/time-series-forecast-study-python-monthly-sales-french-champagne/
Excellent piece.
I was wondering though can I apply the same procedure to data that has both seasonality and trend, say stock data for instance?.
Yes – in general. As for stocks, they are not predictable.
hi
I have a time-series data of 65 years. I don’t know the exact periodicity. What should be my approach to remove seasonality from the dataset
Plot the data a few different ways?
Test if it is stationary, and try removing cycles a few diffrent ways and see if it changes the result?
it’s a daily time scale data. It is stationary. Can you suggest some methods for removing the cycles?
Please suggest some literature also if possible.
Seasonal differencing.
Hi Jason,
Thanks for the incredibly useful articles!
I’m developing a time-series forecasting application for 15-minute data. I want to try out differencing (been applying more traditional scaling), but also want to leave out outliers (entire days that do not apply or where the data will corrupt the training), but this then introduces outliers in the differenced set!
How do you suggest I can handle outliers using differencing?
Many Thanks
You’re welcome.
In differencing… hmmm. Probably remove them or replace them with the mean or the last sensible value.
how to difference ts data by using R
Sorry, I don’t have examples of working with time series in R.
Hi Jason!
I have a daily time-scale data series comprising 200 records. In order to plot seasonality, shall i keep freq 1? When i set it 1, i observe a straight line and when i make it 7 then i see an alternating current pattern. Can you please guide, what value of freq should i rely on?
What do you mean by “freq”?
Hi Jason,
Thank you for your excellent article and website. Quite some work you have put into this.
I was just wondering if you would always remove seasonality from your data. Wouldn’t your algorithm get some insight from knowing of this seasonal pattern, when forecasting or am I missing something?
Cheers
Michael
Thanks.
Yes, always remove. It is too simple and distracting to the model. Get the model to predict the hard part of the problem.
so we keep differencing until we notice a linear trend? btw add a grayish border around the input tags to make it visible. I can help with the code if u want.
No, we difference until the data is reported as stationary.
Please explain what is difference between white noise and stationary series …
White noise has no signal. Hopefully the stationary series has some signal in it we can model.
If one variable was differenced in a multivariate forecasting problem, should the variable be inverted back before we use the model to predict?
Why? Sorry, I don’t follow the rationale.
Generally, you can model your problem anyway you wish, discover what works best for your dataset.
I think you would feed the differenced variable to your model, then invert the forecast it provides.
Thanks for all your awesome material. There might be a typo in one of the comments in the first block of code after the title ‘Differencing to Remove Seasonality’ on line 17. It reads..
# define a dataset with a linear trend
but maybe should read say something like
# define a dataset with seasonality
Thanks! Fixed.
Hi Jason, thanks for the valuable info!
I have one question:
If I use either Fourier transform or Wavelet transform instead of differencing transform to denoise my non-stationary data, is it correct to say that I have also make it stationary? or is differencing transform required to make data stationary?
I don’t recall if a FFT makes the series stationary.
Hi Jason,
Thank you for the great post. I have a small question if you can assist me with.
The time-series I am working with clearly has seasonal variation, but the ADF test shows that the data is indeed stationary. so that means I can start with d=0 and D=0?
Please assist!
Thank you
Perhaps try modeling with the data as is and with the data after seasonal differencing or with an SARIMA and compare the predictive skill of each.
Thank you for the great article!
I had to differentiate my Series twice in order to become stationary.
I then fed the double-differentiated Serie to my model and gained a forecast.
Now I struggle to transform the forecast back since I have no values for the one-time differentiated series.
I assume it should be possible with a recursive approach but can’t get it right. Do you have any advice?
I got there eventually by taking more input from the original series, so taking the first n elements of the training and working upwards from there.
Well done!
You must perform the operations in reverse order.
If you’re unsure, see this:
https://machinelearningmastery.com/machine-learning-data-transforms-for-time-series-forecasting/
Thank you!
You’re welcome.
Hello Jason, thanks for the great article!
I have a small question, should I consider a trend to be present in a typical DC-Motor current consumption plot (current v/s time), like this one http://tiny.cc/xoqtsz
This can help you create plots:
https://machinelearningmastery.com/time-series-data-visualization-with-python/
Hi Jason,
If a dataset needs to be differenced. Do you also have too difference transform? Or when would someone need to use transform in addition to differencing the dataset?
Would one just try both differencing & differencing transform to see what results look best?
You can difference manually. Some models will difference for you, like SARIMA/ARIMA.
Hi Jason,
If I used the Python auto ARIMA
pmdarimawould you know if that differences that data automatically? I know it can select different ARIMA models including SARIMA.import pmdarima as pmmodel = pm.auto_arima(need_to_train, seasonal=True)Im guessing I shouldn’t be differencing the data if using this, would you have any recommendations?
ARIMA has the “d” argument as input that controls differencing.
I don’t know about “auto_arima”, but I would guess it tests different d values.
Hi Jason,
I noticed that in your other post (LSTM) for time series using machine learning that you also differenced the shampoo sales dataset. Is differencing the data good for ML too? I may try that differencing datasets for ML & Arima. For some reason I thought differencing datasets was only for statistic models like VAR, ARIMA, SARIMA and not ML practices…
Yes, it is a good idea to make a time series stationary before modeling, although each model/dataset us different. Test to confirm.
ARIMA/SARIMA will difference for you as part of the model configuration.
Should people difference time series datasets whether its for ML or ARIMA based on same strategies? (IE, augmented dickey fuller P-value)
Yes, although ARIMA will difference for you.
Hello Jason,
Thank you for your very helpful article.
I have a time series dataset with several features : some features are stationary and some features are not stationary.
I guess I only need to difference the non stationary features right ? The stationary features does not have to be modified ?
Thank you !
You’re welcome.
Yes, it is a good idea to make feature stationary prior to modeling. Differencing is a great way to do that.
Hi Jason,
The dataset that I have is an electricity type data set from a building power meter and I can find I can train a decent NN model with including a lot of weather data and also a lot of one hot encoding dummy variables for time-of-week. (day, hour, month number, etc.)
I am experimenting in Python with the Tensorflow Keras library and I know the default during the training process randomly shuffles the data. Is this a No-No for a time series type problem where the random shuffle will take out the seasonality from the data? (stationary/non-stationary) The results shuffling the data really aren’t that bad at a glance but not-randomly shuffling the data the results for MLP NN are poor, like the model doesn’t train well.
I know some other times series forecast methods can include ARIMA, LSTM, etc. but I was curious to inquire if MLP can be used for these purposes too? What I ultimately need is a short term forecast method that can incorporate hourly weather forecast (from a web API) to forecast future hourly building electricity. Any tips greatly appreciated.
Yes, you can use MLP, CNN and LSTM. It requires first converting the data to a supervised learning problem using a sliding window:
https://machinelearningmastery.com/time-series-forecasting-supervised-learning/
Then evaluating models in a way that respects the temporal ordering of obs, called walk-forward validation:
https://machinelearningmastery.com/backtest-machine-learning-models-time-series-forecasting/
You can see tens of tutorials and my book on this here:
https://machinelearningmastery.com/start-here/#deep_learning_time_series
Cool thanks for all the info. So if I used multivariate sliding window for MLP NN, is Ok when training the model that
shuffle_data == True? or should I not shuffle training data…? Thanks so much!Yes, as long as all data in the training dataset is in the past compared to the test set.
Hi Jason,
I have a few questions on how to de-seasonalize my multivariate data set.
The data contains some categorical and some continuous features. I can see that there is both a weekly and daily cycle in my target column values – how would I perform two different seasonal differences?
An additional complexity is that other features have different seasonal periods – for example, my “temperature” column has a different period than my energy “usage in kwh” column. How would you proceed in that case? Can you simply perform seasonal adjustment independently across features and then join the features all back together when modelling?
Thanks for your articles and your continual answers to questions – I have been referencing them heavily during this project!
You can apply weekly differencing first, plot and if the daily cycle is still obvious, apply daily differencing.
You would apply differencing per variable based on the cycles you observe for that variable.
Thanks for the help Jason! I have another related question – some of my features are things like “day of week”, which is a categorical value. I am a bit confused how to how de-seasonalize such data since it is by nature cyclical – should I just remove the entire feature itself?
No need to difference categorical data, I don’t think the concept makes sense.
Hi Jason,
I want to convert the data to a supervised learning problem by computing lag and stats features based on my target. In this case, should we first difference the target column to make it stationary before generating the extra lag features ?
Thank you in advance.
Hi Amine…You may find the following resource of interest:
https://machinelearningmastery.com/convert-time-series-supervised-learning-problem-python/#:~:text=A%20key%20function%20to%20help,values%20added%20to%20the%20end).
Thank you for your reply.
I actually wanted to know if generating lags features based on residual time series (i.e. differenced time series) was the right approach for a supervised learning problem because I haven’t see it in practice yet.
In order to find seasonality and forecast:
1_ can we Fourier transfer the series, find freq components, add them, inverse Fourier transfer the added components to have seasonality, subtract seasonality from the series, forecast subtracted series, and add back the seasonality to forecast?
2_ while we can easily have seasonality component from decomposition, why people do other approaches to find it? It is not accurate?
Simple seasonal differencing works great too.
Hello. These posts have been very useful to me.
In my study, I have a multivariate time series, some variables are stationary and others aren’t. When transforming with simple difference ( df.diff() ) the whole data, I question myself: is it bad to transform data already stationary? But transforming just some does not seem reasonable… The other thing is that, after the transform, some variables become flat (almost constant throughout time). Does this mean that I should transform data with for example more lag? yearly?
You’re welcome.
There’s no need to difference data that is already stationary. Not bad, but you are adding unneeded complexity.
Yes, but some of the variables are not stationary. Thus my thought, should I transform the whole dataset when only some variables are not stationary?
Thank you so much
Probably not, if some variables are not stationary, consider making them stationary and compare the performance of the model fit on the raw data directly.
I continually read about stationarity testing in the context of time series forecasting. Do you need to test and account for stationarity only in the context of time series classification? Or is it just a test and see type of scenario? I can’t seem to find any authoritative literature that states the underlying assumptions of classification models that require stationarity.
Stationarity is usually an assumption when we apply ARMA model, for example. In simple regression, we also care about stationarity because of the i.i.d. assumption.
How to get back the original values from the first difference? As I am trying to forecast the future values of commodity price using ARIMA and as the dataset was non-stationary, I took the first difference of the price and trained the model on the first difference. From the predicted output, how to get back the original forecasted price? I am really confused about this part.
Hi Anupam…The following discussion may prove beneficial:
https://stats.stackexchange.com/questions/130448/how-to-undifference-a-time-series-variable
Hello. When i make my data stationary with this method, im having a lot of zeroes and my prediction is being flat (LSTM) but if i run this multiple times my p value is being 0 (rounded probably) and my predictions are being much better. How would you explain that?
Thanks!
Hi McanP…Please review the following for more insight:
https://machinelearningmastery.com/get-the-most-out-of-lstms/