Time Series data must be re-framed as a supervised learning dataset before we can start using machine learning algorithms.
There is no concept of input and output features in time series. Instead, we must choose the variable to be predicted and use feature engineering to construct all of the inputs that will be used to make predictions for future time steps.
In this tutorial, you will discover how to perform feature engineering on time series data with Python to model your time series problem with machine learning algorithms.
After completing this tutorial, you will know:
- The rationale and goals of feature engineering time series data.
- How to develop basic date-time based input features.
- How to develop more sophisticated lag and sliding window summary statistics features.
Kick-start your project with my new book Time Series Forecasting With Python, including step-by-step tutorials and the Python source code files for all examples.
Let’s dive in.
- Updated Jun/2017: Fixed a typo in the expanding window code example.
- Updated Apr/2019: Updated the link to dataset.
- Updated Aug/2019: Updated data loading to use new API.
- Updated Sep/2019: Fixed bug in data loading.

Basic Feature Engineering With Time Series Data in Python
Photo by José Morcillo Valenciano, some rights reserved.
Feature Engineering for Time Series
A time series dataset must be transformed to be modeled as a supervised learning problem.
That is something that looks like:
|
1 2 3 |
time 1, value 1 time 2, value 2 time 3, value 3 |
To something that looks like:
|
1 2 3 |
input 1, output 1 input 2, output 2 input 3, output 3 |
So that we can train a supervised learning algorithm.
Input variables are also called features in the field of machine learning, and the task before us is to create or invent new input features from our time series dataset. Ideally, we only want input features that best help the learning methods model the relationship between the inputs (X) and the outputs (y) that we would like to predict.
In this tutorial, we will look at three classes of features that we can create from our time series dataset:
- Date Time Features: these are components of the time step itself for each observation.
- Lag Features: these are values at prior time steps.
- Window Features: these are a summary of values over a fixed window of prior time steps.
Before we dive into methods for creating input features from our time series data, let’s first review the goal of feature engineering.
Stop learning Time Series Forecasting the slow way!
Take my free 7-day email course and discover how to get started (with sample code).
Click to sign-up and also get a free PDF Ebook version of the course.
Goal of Feature Engineering
The goal of feature engineering is to provide strong and ideally simple relationships between new input features and the output feature for the supervised learning algorithm to model.
In effect, we are are moving complexity.
Complexity exists in the relationships between the input and output data. In the case of time series, there is no concept of input and output variables; we must invent these too and frame the supervised learning problem from scratch.
We may lean on the capability of sophisticated models to decipher the complexity of the problem. We can make the job for these models easier (and even use simpler models) if we can better expose the inherent relationship between inputs and outputs in the data.
The difficulty is that we do not know the underlying inherent functional relationship between inputs and outputs that we’re trying to expose. If we did know, we probably would not need machine learning.
Instead, the only feedback we have is the performance of models developed on the supervised learning datasets or “views” of the problem we create. In effect, the best default strategy is to use all the knowledge available to create many good datasets from your time series dataset and use model performance (and other project requirements) to help determine what good features and good views of your problem happen to be.
For clarity, we will focus on a univariate (one variable) time series dataset in the examples, but these methods are just as applicable to multivariate time series problems. Next, let’s take a look at the dataset we will use in this tutorial.
Minimum Daily Temperatures Dataset
In this post, we will use the Minimum Daily Temperatures dataset.
This dataset describes the minimum daily temperatures over 10 years (1981-1990) in Melbourne, Australia.
The units are in degrees Celsius and there are 3,650 observations. The source of the data is credited as the Australian Bureau of Meteorology.
Below is a sample of the first 5 rows of data, including the header row.
|
1 2 3 4 5 6 |
"Date","Temperature" "1981-01-01",20.7 "1981-01-02",17.9 "1981-01-03",18.8 "1981-01-04",14.6 "1981-01-05",15.8 |
Below is a plot of the entire dataset.
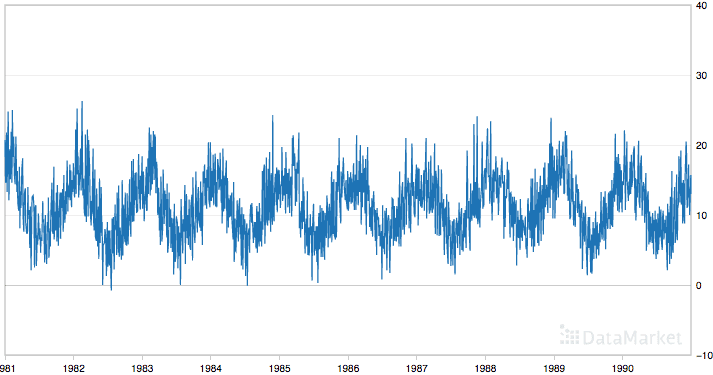
Minimum Daily Temperatures
The dataset shows an increasing trend and possibly some seasonal components.
Date Time Features
Let’s start with some of the simplest features that we can use.
These are features from the date/time of each observation. In fact, these can start off simply and head off into quite complex domain-specific areas.
Two features that we can start with are the integer month and day for each observation. We can imagine that supervised learning algorithms may be able to use these inputs to help tease out time-of-year or time-of-month type seasonality information.
The supervised learning problem we are proposing is to predict the daily minimum temperature given the month and day, as follows:
|
1 2 3 |
Month, Day, Temperature Month, Day, Temperature Month, Day, Temperature |
We can do this using Pandas. First, the time series is loaded as a Pandas Series. We then create a new Pandas DataFrame for the transformed dataset.
Next, each column is added one at a time where month and day information is extracted from the time-stamp information for each observation in the series.
Below is the Python code to do this.
|
1 2 3 4 5 6 7 8 9 |
# create date time features of a dataset from pandas import read_csv from pandas import DataFrame series = read_csv('daily-minimum-temperatures.csv', header=0, index_col=0, parse_dates=True, squeeze=True) dataframe = DataFrame() dataframe['month'] = [series.index[i].month for i in range(len(series))] dataframe['day'] = [series.index[i].day for i in range(len(series))] dataframe['temperature'] = [series[i] for i in range(len(series))] print(dataframe.head(5)) |
Running this example prints the first 5 rows of the transformed dataset.
|
1 2 3 4 5 6 |
month day temperature 0 1 1 20.7 1 1 2 17.9 2 1 3 18.8 3 1 4 14.6 4 1 5 15.8 |
Using just the month and day information alone to predict temperature is not sophisticated and will likely result in a poor model. Nevertheless, this information coupled with additional engineered features may ultimately result in a better model.
You may enumerate all the properties of a time-stamp and consider what might be useful for your problem, such as:
- Minutes elapsed for the day.
- Hour of day.
- Business hours or not.
- Weekend or not.
- Season of the year.
- Business quarter of the year.
- Daylight savings or not.
- Public holiday or not.
- Leap year or not.
From these examples, you can see that you’re not restricted to the raw integer values. You can use binary flag features as well, like whether or not the observation was recorded on a public holiday.
In the case of the minimum temperature dataset, maybe the season would be more relevant. It is creating domain-specific features like this that are more likely to add value to your model.
Date-time based features are a good start, but it is often a lot more useful to include the values at previous time steps. These are called lagged values and we will look at adding these features in the next section.
Lag Features
Lag features are the classical way that time series forecasting problems are transformed into supervised learning problems.
The simplest approach is to predict the value at the next time (t+1) given the value at the previous time (t-1). The supervised learning problem with shifted values looks as follows:
|
1 2 3 |
Value(t-1), Value(t+1) Value(t-1), Value(t+1) Value(t-1), Value(t+1) |
The Pandas library provides the shift() function to help create these shifted or lag features from a time series dataset. Shifting the dataset by 1 creates the t-1 column, adding a NaN (unknown) value for the first row. The time series dataset without a shift represents the t+1.
Let’s make this concrete with an example. The first 3 values of the temperature dataset are 20.7, 17.9, and 18.8. The shifted and unshifted lists of temperatures for the first 3 observations are therefore:
|
1 2 3 4 |
Shifted, Original NaN, 20.7 20.7, 17.9 17.9, 18.8 |
We can concatenate the shifted columns together into a new DataFrame using the concat() function along the column axis (axis=1).
Putting this all together, below is an example of creating a lag feature for our daily temperature dataset. The values are extracted from the loaded series and a shifted and unshifted list of these values is created. Each column is also named in the DataFrame for clarity.
|
1 2 3 4 5 6 7 8 |
from pandas import read_csv from pandas import DataFrame from pandas import concat series = read_csv('daily-min-temperatures.csv', header=0, index_col=0) temps = DataFrame(series.values) dataframe = concat([temps.shift(1), temps], axis=1) dataframe.columns = ['t-1', 't+1'] print(dataframe.head(5)) |
Running the example prints the first 5 rows of the new dataset with the lagged feature.
|
1 2 3 4 5 6 |
t-1 t+1 0 NaN 20.7 1 20.7 17.9 2 17.9 18.8 3 18.8 14.6 4 14.6 15.8 |
You can see that we would have to discard the first row to use the dataset to train a supervised learning model, as it does not contain enough data to work with.
The addition of lag features is called the sliding window method, in this case with a window width of 1. It is as though we are sliding our focus along the time series for each observation with an interest in only what is within the window width.
We can expand the window width and include more lagged features. For example, below is the above case modified to include the last 3 observed values to predict the value at the next time step.
|
1 2 3 4 5 6 7 8 |
from pandas import read_csv from pandas import DataFrame from pandas import concat series = read_csv('daily-min-temperatures.csv', header=0, index_col=0) temps = DataFrame(series.values) dataframe = concat([temps.shift(3), temps.shift(2), temps.shift(1), temps], axis=1) dataframe.columns = ['t-3', 't-2', 't-1', 't+1'] print(dataframe.head(5)) |
Running this example prints the first 5 rows of the new lagged dataset.
|
1 2 3 4 5 6 |
t-3 t-2 t-1 t+1 0 NaN NaN NaN 20.7 1 NaN NaN 20.7 17.9 2 NaN 20.7 17.9 18.8 3 20.7 17.9 18.8 14.6 4 17.9 18.8 14.6 15.8 |
Again, you can see that we must discard the first few rows that do not have enough data to train a supervised model.
A difficulty with the sliding window approach is how large to make the window for your problem.
Perhaps a good starting point is to perform a sensitivity analysis and try a suite of different window widths to in turn create a suite of different “views” of your dataset and see which results in better performing models. There will be a point of diminishing returns.
Additionally, why stop with a linear window? Perhaps you need a lag value from last week, last month, and last year. Again, this comes down to the specific domain.
In the case of the temperature dataset, a lag value from the same day in the previous year or previous few years may be useful.
We can do more with a window than include the raw values. In the next section, we’ll look at including features that summarize statistics across the window.
Rolling Window Statistics
A step beyond adding raw lagged values is to add a summary of the values at previous time steps.
We can calculate summary statistics across the values in the sliding window and include these as features in our dataset. Perhaps the most useful is the mean of the previous few values, also called the rolling mean.
For example, we can calculate the mean of the previous two values and use that to predict the next value. For the temperature data, we would have to wait 3 time steps before we had 2 values to take the average of before we could use that value to predict a 3rd value.
For example:
|
1 2 3 |
mean(t-2, t-1), t+1 mean(20.7, 17.9), 18.8 19.3, 18.8 |
Pandas provides a rolling() function that creates a new data structure with the window of values at each time step. We can then perform statistical functions on the window of values collected for each time step, such as calculating the mean.
First, the series must be shifted. Then the rolling dataset can be created and the mean values calculated on each window of two values.
Here are the values in the first three rolling windows:
|
1 2 3 4 |
#, Window Values 1, NaN 2, NaN, 20.7 3, 20.7, 17.9 |
This suggests that we will not have usable data until the 3rd row.
Finally, as in the previous section, we can use the concat() function to construct a new dataset with just our new columns.
The example below demonstrates how to do this with Pandas with a window size of 2.
|
1 2 3 4 5 6 7 8 9 10 11 |
from pandas import read_csv from pandas import DataFrame from pandas import concat series = read_csv('daily-min-temperatures.csv', header=0, index_col=0) temps = DataFrame(series.values) shifted = temps.shift(1) window = shifted.rolling(window=2) means = window.mean() dataframe = concat([means, temps], axis=1) dataframe.columns = ['mean(t-2,t-1)', 't+1'] print(dataframe.head(5)) |
Running the example prints the first 5 rows of the new dataset. We can see that the first two rows are not useful.
- The first NaN was created by the shift of the series.
- The second because NaN cannot be used to calculate a mean value.
- Finally, the third row shows the expected value of 19.30 (the mean of 20.7 and 17.9) used to predict the 3rd value in the series of 18.8.
|
1 2 3 4 5 6 |
mean(t-2,t-1) t+1 0 NaN 20.7 1 NaN 17.9 2 19.30 18.8 3 18.35 14.6 4 16.70 15.8 |
There are more statistics we can calculate and even different mathematical ways of calculating the definition of the “window.”
Below is another example that shows a window width of 3 and a dataset comprised of more summary statistics, specifically the minimum, mean, and maximum value in the window.
You can see in the code that we are explicitly specifying the sliding window width as a named variable. This lets us use it both in calculating the correct shift of the series and in specifying the width of the window to the rolling() function.
In this case, the window width of 3 means we must shift the series forward by 2 time steps. This makes the first two rows NaN. Next, we need to calculate the window statistics with 3 values per window. It takes 3 rows before we even have enough data from the series in the window to start calculating statistics. The values in the first 5 windows are as follows:
|
1 2 3 4 5 6 |
#, Window Values 1, NaN 2, NaN, NaN 3, NaN, NaN, 20.7 4, NaN, 20.7, 17.9 5, 20.7, 17.9, 18.8 |
This suggests that we would not expect usable data until at least the 5th row (array index 4)
|
1 2 3 4 5 6 7 8 9 10 11 |
from pandas import read_csv from pandas import DataFrame from pandas import concat series = read_csv('daily-min-temperatures.csv', header=0, index_col=0) temps = DataFrame(series.values) width = 3 shifted = temps.shift(width - 1) window = shifted.rolling(window=width) dataframe = concat([window.min(), window.mean(), window.max(), temps], axis=1) dataframe.columns = ['min', 'mean', 'max', 't+1'] print(dataframe.head(5)) |
Running the code prints the first 5 rows of the new dataset.
We can spot check the correctness of the values on the 5th row (array index 4). We can see that indeed 17.9 is the minimum and 20.7 is the maximum of values in the window of [20.7, 17.9, 18.8].
|
1 2 3 4 5 6 |
min mean max t+1 0 NaN NaN NaN 20.7 1 NaN NaN NaN 17.9 2 NaN NaN NaN 18.8 3 NaN NaN NaN 14.6 4 17.9 19.133333 20.7 15.8 |
Expanding Window Statistics
Another type of window that may be useful includes all previous data in the series.
This is called an expanding window and can help with keeping track of the bounds of observable data. Like the rolling() function on DataFrame, Pandas provides an expanding() function that collects sets of all prior values for each time step.
These lists of prior numbers can be summarized and included as new features. For example, below are the lists of numbers in the expanding window for the first 5 time steps of the series:
|
1 2 3 4 5 6 |
#, Window Values 1, 20.7 2, 20.7, 17.9, 3, 20.7, 17.9, 18.8 4, 20.7, 17.9, 18.8, 14.6 5, 20.7, 17.9, 18.8, 14.6, 15.8 |
Again, you can see that we must shift the series one-time step to ensure that the output value we wish to predict is excluded from these window values. Therefore the input windows look as follows:
|
1 2 3 4 5 6 |
#, Window Values 1, NaN 2, NaN, 20.7 3, NaN, 20.7, 17.9, 4, NaN, 20.7, 17.9, 18.8 5, NaN, 20.7, 17.9, 18.8, 14.6 |
Thankfully, the statistical calculations exclude the NaN values in the expanding window, meaning no further modification is required.
Below is an example of calculating the minimum, mean, and maximum values of the expanding window on the daily temperature dataset.
|
1 2 3 4 5 6 7 8 9 10 |
# create expanding window features from pandas import read_csv from pandas import DataFrame from pandas import concat series = read_csv('daily-min-temperatures.csv', header=0, index_col=0) temps = DataFrame(series.values) window = temps.expanding() dataframe = concat([window.min(), window.mean(), window.max(), temps.shift(-1)], axis=1) dataframe.columns = ['min', 'mean', 'max', 't+1'] print(dataframe.head(5)) |
Running the example prints the first 5 rows of the dataset.
Spot checking the expanding minimum, mean, and maximum values shows the example having the intended effect.
|
1 2 3 4 5 6 |
min mean max t+1 0 20.7 20.700000 20.7 17.9 1 17.9 19.300000 20.7 18.8 2 17.9 19.133333 20.7 14.6 3 14.6 18.000000 20.7 15.8 4 14.6 17.560000 20.7 15.8 |
Summary
In this tutorial, you discovered how to use feature engineering to transform a time series dataset into a supervised learning dataset for machine learning.
Specifically, you learned:
- The importance and goals of feature engineering time series data.
- How to develop date-time and lag-based features.
- How to develop sliding and expanding window summary statistic features.
Do you know of more feature engineering methods for time series?
Let me know in the comments below.
Do you have any questions?
Ask your questions in the comments below and I will do my best to answer.
Want to Develop Time Series Forecasts with Python?

Develop Your Own Forecasts in Minutes
...with just a few lines of python codeDiscover how in my new Ebook:
Introduction to Time Series Forecasting With Python
It covers self-study tutorials and end-to-end projects on topics like: Loading data, visualization, modeling, algorithm tuning, and much more...
Finally Bring Time Series Forecasting to
Your Own Projects
Skip the Academics. Just Results.


Awesome introduction to Feature Engineering with Time Series. I thought that it was something only for scientific minds but actually it is so easy. I enjoyed the easy way that you have explained it. I am ready now for any challenge using Time Series in my domain of expertise. Thanks!!!!
I’m glad to hear it Dario.
min mean max t+1
0 NaN NaN NaN 20.7
1 NaN NaN NaN 17.9
2 NaN NaN NaN 18.8
3 NaN NaN NaN 14.6
4 17.9 19.133333 20.7 15.8
why you shift 2 step instead of 1? to make it
min mean max t+1
0 NaN NaN NaN 20.7
1 NaN NaN NaN 17.9
2 NaN NaN NaN 18.8
3 17.9 19.133333 20.7 14.6
great post btw… thanks !!
Hi Fai, the shifting can get confusing.
I try to explain it above by showing how the groups of observations in the window look each row as we build them up. I guess it didn’t work as an explanatory tool:
Thx for the reply. Thats a good explanatory tool. But i was wondering
if shift by 1 step, we could have the following window observations,
and we can have enough data in row 4 for calculating statistic with 3 values per window.
1, NaN
2, NaN, 20.7
3, NaN, 20.7, 17.9
4, 20.7, 17.9, 18.8
so why should we shift by 2 step instead (we can only start calculating at row5)
1, NaN
2, NaN, NaN
3, NaN, NaN, 20.7
4, NaN, 20.7, 17.9
5, 20.7, 17.9, 18.8
If you’re asking why a window size of “3” or a window size of “2” or even “1”, no reason. Just for demonstration purposes.
We can use autocorrelation to find good window sizes (ACF (AutoCorrelation Function) and correlograms) and I will get into this future posts.
Does this help at all? Or am I still misunderstanding?
Hi Jason,
Actually, I have the same concern. There are two concepts we are applying here.
1. Rolling Window. The size is 3, and that’s not the concern.
2. Lagging. The shift is 2, and the question is: why don’t we use time steps 1, 2, and 3 to create features for time step 4? Why did we use time steps 1, 2, and 3 to create features in time step 5? By features I mean (min, max, & mean of 3 leading measurements)
Instead of: shifted = temps.shift(width – 1)
why don’t we use: shifted = temps.shift(1)
There is no reason. It is a bug. The shift should always be 1 and not window_size related.
sorry can u explain more how to use auto correlation for finding good window size?
Yes, see this post:
https://machinelearningmastery.com/gentle-introduction-autocorrelation-partial-autocorrelation/
Yes, I’m confused as well. It seems like the mean is done with (t-4, t-3, t-2). I expected it to be done with (t-3, t-2, t-1). Can you explain why it’s not?
0 (t+1) (t-1) (t-2) (t-3) (t-4) mean(t-2, t-1) mean(t-3, t-2, t-1) mean(t-4, t-3, t-2)
1 20.7 NA NA NA NA NA NA NA
2 17.9 20.7 NA NA NA NA NA NA
3 18.8 17.9 20.7 NA NA 19.3 NA NA
4 14.6 18.8 17.9 20.7 NA 18.35 19.13333 NA
5 15.8 14.6 18.8 17.9 20.7 16.7 17.1 19.13333
It was arbitrary. You can calculate it anyway you like.
Hi Jason, nice introduction. If you are interested in more statistical features tale a look at
http://rsif.royalsocietypublishing.org/content/10/83/20130048.full and the associted github repo.
I find it the most complete work for ts features engineering
Thanks for sharing Hicham.
Great reference Hichman, thank you! And thank you Jason – you’re blog, site, and explanations are stellar.
Hi,
In rolling mean why do you take lag of raw variables.why do you not take raw variables instead?
In this case, the data is univariate, there are no other variables beyond those that are “invented” like lag vars.
Hi Jason:
When you write “predict the daily maximum temperature” did you mean “predict the daily minimum temperature” ?
I did Daniel, thanks. Fixed.
I got error when reading the data. Where exactly did you spot the questionmarks?
You can use a text editor and the find-replace feature.
how to create lagged variable for test data? we do not know any info in test data, right?
The lag for the test data will be the end of the train data.
You can prepare the data using the function in this post:
https://machinelearningmastery.com/convert-time-series-supervised-learning-problem-python/
Hi Jason,
Thank for great article.
May I ask which comes first?
Splitting Train/Test Sets on original Time Series dataset
Or
Splitting Train/Test Sets on Transformed (E.g. after being features engineered) dataset?
Please advise,
Shaun
Great question.
Scaling is applied to each variable.
Transform to supervised happens before split.
But, you need to ensure that any scaling is learned on the training set only and apply to the test set – so there is no data leakage.
Not sure if that helps?
It would be greate if you added some comments about forecasting time series with machine learning techniques like Nearest Neighbor or SVR methods.
Great suggestion, I hope to cover it in the future.
Hello !
There is a task for the Time Series Forecasting with the LSTM.
Multiple input variables:
1 year
2. Month
3. Day of the week
4. Date of the month
5. Hour of the day
…
Hour of day.
Business hours or not.
Weekend or not.
Imprint – the number of sales
It is required to help – how to implement the algorithm in Python with Keras.
Thank you !
I would recommend using any of my many posts on LSTMs for time series as a starting point and adapt it to your problem.
I love this sentence: complexity exists in the relationships between input and output data!
Because the output data may or may not be a straightforward outcome of the input data, what we are trying to do is to establish a predictable relationship between A and B. By feature engineering, we are hoping to reduce the complexity and difficulty of the establishment with intermediate features that may be more informative and closer to B.
We always hope to build a closer bridge to save time and energy.
Thank you so much for that punctual summary and great explanation! It is very inspiring and helpful.
By the way, what do you mean here “In the case of time series, there is no concept of input and output variables”? Aren’t we always provided a time series that comes with its time step (input) and its value (Y)? Do you mean concept of input and output variables for unknown new features we are going to invent?
Thanks.
Thanks!
I guess I meant that we have really only have lags obs in univariate time series.
Hi, Jason! This is a great piece!
I have a question on how to sample this kind of data set.
My understanding is that since the features are generated from a time series, there is time dependency among rows and across the variables. So it may require different treatment than the normal data sets which we assume the rows are independent between one another.
Could you please help to advise on the sampling method applied on this kind of data set?
Thank you very much!
Yes, you can use walk-forward validation to evaluate models on sequence prediction problems.
See this post:
https://machinelearningmastery.com/backtest-machine-learning-models-time-series-forecasting/
Hi, Jason.
What do you think about combining Date Time Features with Lag Features? Is this approach justified?
Thanks a lot.
Perhaps.
I would recommend doing the experiment and using the results/data to decide whether it is a good idea for your specific forecasting problem.
Hello,
I have a time series data(csv), which is multimodal(obtained from different sensors).My task is to implement multiclass classification, by extracting features from this data.Can you give me a starting point? any posts for classification
Good question.
I don’t have post on time series classification. I hope to have some in the future.
It depends on what you want to do. And what the time series represent. Have the whole time series the same label for example.
You could try and play around with calculating statistical features (in time and frequency domain) of the whole time series (not so valuable if you only have one time series) or split time series into windows and calculate features on those (for every sensor).
As with all classification you need good amount of representation of labels in the different classes. So as I see it you either need multiple datasets or that the data varies enough so you could split it up and label each part.
After calculating some generic statistical features you could dig a bit deeper and see if you can develop some more specific features connected to your problem.
I’m having a bit of trouble with your terminology. You use “t-1” and “t+1” and refer to the use of the lagged “t-1” value to predict the “t+1” value using supervised machine learning. Wouldn’t it be more accurate to say we use “t-1” to predict the value at “t”? And in using an ML algorithm, would the value at “t” be the “target variable”?
To clarify the context of my question, here is some background. I’m experimenting with an ML example to predict sales of items for a future month given history of sales. My training data has lagged monthly sales for the prior 3 months and for each training row, the target variable is the monthly sales for the current month. As I read your excellent post, I began wondering if I’m supposed to be adding one more feature to each training row… the sales for the NEXT month (t+1).
One follow up question is whether or not you have found it useful to add a “recent growth” feature. This in my example would highlight a hot new product or one that is beginning to fall off a cliff.
Thanks so much for a great article!
Yes, t+1 should have been t. I cleaned up this terminology in my book on the topic.
you nailed it right. awesome material. Thanks.
Thanks.
Thank you for an excellent series of articles. I have gone through multiple books on video tutorials and I always find that any questions that I have after going through some other piece of content are answered in your blog posts.
There is one question which I have not found an answer to: is it better to provide the mean , standard deviation or any other statistical derivative of the univariate time series data or just provide the raw lagged data itself? Will this depend on the domain of the data (for example, will the answer very if the data consist of stock prices as compared to the data of temperature) or is this more of a problem of statistics independent of the domain.
In other words, if I have to answer the question should I provide the mean of the data instead of the raw data (and assuming that the data is stock prices), should I look into research literature of machine learning or the literature of financial markets?
Thank you for any inputs
Yes, it depends on the data and on the method you are using to address it.
E.g. it may make sense for ML algorithms, but not for an ARIMA or ETS method.
As for stock prices, they are not predictable:
https://machinelearningmastery.com/faq/single-faq/can-you-help-me-with-machine-learning-for-finance-or-the-stock-market
In the date time features I am getting the complete date 1981-01-01 in the temperature column any idea why. ( note I am reading the file in as a read_csv and not series)
Thanks
Brian
Perhaps this is a change in a recent version of Pandas?
If data is non-stationary, do we make transformation and differencing to remove unconstant variance and trend first before doing features?
You can use a power transform to adjust a changing variance, then a difference to remove trend/seasonality.
Thank you for this great read.
I want each row in an hourly format, but the algorithm to predict what will be the value in 24 hours.
The reason for that is that hourly changes in the predicted variable are too small, but I do want to make a prediction even hour of the day.
1. Does it make sense to calculate a new column with
.shift(-24)and use it as the predicted value?2. Assuming you don’t have enough temperatures data from Melbourne.
Assuming you want to use other cities to make a general model (that way you have more data).
Assuming the temperatures values are different, but they behave similar.
Does it make sense to use
.pct_changeinstead of raw values (even formax,minandmean) calculations?I’m not sure I follow, sorry.
Thank you for a great article!
I was wondering when doing the shift, is it necessary to include the features for the “shifted” period too?
For example, say it’s a time series that is highly dependent on sales last year and whether it’s a Holiday or not, and I want to predict the sales.
Then I have one feature that is the sales for the same date last year and one feature that is Holiday (1/0).
If I want to predict the sales for 16th April 2018, it’s not a holiday so that feature would be 0 and I would just use the sales for the same date 2017. But the feature for sales last year, would be affected because the Easter was that date 2017.
Would I then need to add a feature like “same date last year Holiday” that is 1/0, or is that covered by the other features?
Hope that is understandable…
Thanks for an amazing blog!
Sure.
Hey Jason,
while running the code for rolling window, it is giving the error:
“cannot handle this type -> object”
I am running the code for the dataset you have taken
Are you using Python 3 and statmodels 8+?
Hi,
Thanks again for a good post. Do you know about Python Featuretools and Autokeras? It would be nice to see a comparison with these tools.
Thanks for suggestions Magnus.
Wow. Once again, you’ve explained the concepts perfectly.
After 5 other articles on this same topic, I now understand.
Very appreciative!
I’m glad it helped Jon!
Hi Jason,
Thank you very much for this useful post. but please can you show how we can code non linear window as you mentioned here “Additionally, why stop with a linear window? Perhaps you need a lag value from last week, last month, and last year. Again, this comes down to the specific domain.
In the case of the temperature dataset, a lag value from the same day in the previous year or previous few years may be useful.”
Thank you again!
Thanks for the suggestion.
Hey Jason!
Your tutorials are always very helpful! I had a quick question. If I just wanted to use a standard linear regression with these types of features. What are some common methods for filling in the NaN values on the shifted variables?
The rows with NaNs must be dropped.
Okay, great thanks for the info. Do you have a tutorial that uses this concept and shows how to build the predictions? With a linear regressor or random forest for example? If not could you give a high level explanation of the steps that you might use? In the meantime I might write some code to get some feedback.
I may, perhaps check here:
https://machinelearningmastery.com/start-here/#deep_learning_time_series
Perhaps this:
https://machinelearningmastery.com/multi-step-time-series-forecasting-with-machine-learning-models-for-household-electricity-consumption/
These are the steps for any project:
https://machinelearningmastery.com/start-here/#process
Hi Jason!
Thank you for the great article! It is really helpful. I have a question if you don’t mind. Is there any method for determining the window size if I were to compute rolling window statistic? Thank you in advance!
Perhaps test a suite of different configurations to see what works well/best for your specific dataset and choice of model.
Hi Jason!
First,thanks for the article. But I have some questions. In your case,you only predict the next time series,that is t+1. But what if I need to predict the next two series or maybe more?
For a linear model like ARIMA, you can call forecast() or predict() and specify the number of step to forecast.
Noticed some questions that can be related back to this:
series = Series.from_csv(‘daily-min-temperatures.csv’, header=0)
FutureWarning: from_csv is deprecated. Please use read_csv(…) instead.
I tested a few options to use read_csv, and this looks like a match (don´t forget to import pandas as pd):
series = pd.read_csv(‘daily-min-temperatures.csv’, index_col=0, squeeze=True)
Copy/paste error, should be:
series = pd.read_csv(‘daily-min-temperatures.csv’, index_col=0, parse_dates=True, squeeze=True)
Thanks for sharing.
hi i think this part of the code is wrong:
from pandas import read_csv
from pandas import DataFrame
series = read_csv(‘daily-min-temperatures.csv’, header=0, index_col=0)
dataframe = DataFrame()
dataframe[‘month’] = [series.index[i].month for i in range(len(series))]
dataframe[‘day’] = [series.index[i].day for i in range(len(series))]
dataframe[‘temperature’] = [series[i] for i in range(len(series))]
print(dataframe.head(5))
it gives me the following error:
AttributeError: ‘str’ object has no attribute ‘month’
Thanks, I have updated the example.
Hi Jason,
First, thanks for the tutorial!
How do we decide the width of the window? Should we use the frequency? Is there a general rule? Thanks!
Perhaps test a range of configurations and discover what works best for your dataset?
Also an ACF/PACF plot can be insightful.
These are helpful to me. Thanks a lot! Can I practice this and put it on my github? Obviously, the source link will upload together.
If it is not public.
Hi Jason,
Thank you for this great work. I have a question and hope you don’t mind. I am trying to building a weekly sales forecast model with Xgboost. My goal is using the model to predict the sales of future 8 weeks. But I am confused with the lag and diff features. I created many features like lag 2, lag 3, lag 4, lag 5 and diff 2, diff 3, diff 4,diff 5. It shows a great performance in my train set and test set based on historical data. Meanwhile I also checked the feature importance. Those lag and diff features rank top among all features. But when I want to predict the sales of future weeks. I don’t have the actual sales, so many feature gonna to be NaN and the predict result seems to be unreasonable. May I ask did you face this issue before? How should I deal with lag, diff feature on future time window? Thanks!
David
Good question.
Yes, you must chose your input variables (frame the prediction problem) based on the data that you do have available at the time you need to make a prediction. E.g. if you won’t have specific lab obs at the time of prediction, then don’t frame the problem to include that data.
Does that help?
Hi Jason,
Thank you for the reply. I had tried to remove the diff variables from my data frame, but the loss function became bigger both on train set and test set. May I ask can I use the prediction result from other univariate forecast method like ARIMA, Prophet as future sales value to do diff feature, then as a input for my Xgboost model? Is my thought make sense?
Best regards,
David
Perhaps try it?
HI Jason,
Hope you are doing good. i have a clarification based on finding lags.I’m trying to convert time series problem into regression. for that how can i find lags based on date,product and location. I mean the order of sorting before finding the lag.
Thanks!
Thanks.
See this:
https://machinelearningmastery.com/time-series-forecasting-supervised-learning/
Hi how to forecast time series data using sliding window method
I have not found any forecast method in this tutorial using sliding windows
Please share link which you have forecast time series data using sliding window method
See the examples here:
https://machinelearningmastery.com/start-here/#deep_learning_time_series
Excellent !
I’m happy to hear that it was helpful!
Hi Jason, this is a great tutorial!
I have two questions:
1. With data transformations (Power transform, seasonal difference, trend difference, standardization, normalization) as in your post
“4 Common Machine Learning Data Transforms for Time Series Forecasting”,
when to perform feature engineering – with the transformed data or with the raw data?
2. And should the engineered features be also transformed likewise, if they have been derived from transformed data? As I understand (not sure if I am right) , engineered features require transformation only if they have been obtained from raw data.
Thanks!
Either or both, perhaps experiment.
I would probably derive them from raw data then subject them to the same types of data prep, where relevant.
Great intro, thank you for this! One observation is that it probably woulf be better to transform date-time features to cyclic variables to capture the cyclic patterns of time. I believe this article demonstrates this well: http://blog.davidkaleko.com/feature-engineering-cyclical-features.html
Thanks.
Hi Jason,
Thank you for the tutorial. I have a question regarding multivariate time series classification. I have measurement of 20 sensors at each instant. Since, I am also interested in temporal information, I concatenate my features over multiple time instants, like 10 time instants. So, each sample will have 20 * 10 =200 length. My question is do I have to perform data standardization/ scaling after concatenating features in multiple time instants or before that? Thanks!
Probably scale data prior to transforming it into a supervised learning problem. E.g. for each variable.
Hello Jason,
Thanks a lot for the tutorial. I have an additional question: if I have a dataset of hourly close price for a stock price and I want to create training datasets. For each sample I will need the past 6 hours and the past 6 days as features. How I will convert the hourly data set to a training dataset with 6 past hours price and 6 past days price?
Thank you very much in adance!
This will help:
https://machinelearningmastery.com/time-series-forecasting-supervised-learning/
And this:
https://machinelearningmastery.com/convert-time-series-supervised-learning-problem-python/
And this:
https://machinelearningmastery.com/faq/single-faq/can-you-help-me-with-machine-learning-for-finance-or-the-stock-market
I want to apply “sliding window” approach on my dataset of window size of 5 seconds.can you please help me in this with some example.
This will help you to understand the sliding window:
https://machinelearningmastery.com/time-series-forecasting-supervised-learning/
This code will help you prepare your data:
https://machinelearningmastery.com/convert-time-series-supervised-learning-problem-python/
Dear Jason
First of all, thank you for this nice explanation!
I was hoping you could maybe shed some light on a problem I am dealing with.
I am currently working on a thesis for a master’s in artificial intelligence where we want to study if we can predict/detect acute exacerbation (events) in copd patients based on daily step data alone.
There are several patients in de dataset who suffered from an event (or multiple events) of which we know the date it started and the duration. We only have the number of steps per day for a period of approximately 90 days on average.
Thus, we have the available data: (i) date (day-month-year), (ii) number of steps, and (iii) event or not (1/0).
The last variable can be expanded by including a label for the 7 days prior the onset of an event. Then we have three possible labels for a day: event, no event or risk.
A first approach is to consider this as a classification problem. For this problem, I would extract features (a nicely explained in this post) and use these to predict to which class a data point belongs (i.e. event, no event or risk). The hypothesis here would be that if we could correctly predict a certain day to be a risk, that it would be able to predict/detect an event before it occurs.
I was wondering about your opinion about this method, and if this kind of feature extraction would be useful for a classification (rather than a prediciton) problem.
Thank you in advance!
Kind regards
Arne
Perhaps develop some prototypes to test your ideas on real data.
Hello Jason,
Have you looked into using TSFresh for generating time series features ?
Not at this stage, I’ll add it to the list.
How do I refer the time series data of the temperature given in this article, if it is reproduce or used in technical report, book, manuscript, etc.?
The details of the dataset are here:
https://raw.githubusercontent.com/jbrownlee/Datasets/master/daily-min-temperatures.names
Hi Jason,
Thank you for sharing this post! I am having a difficult time comprehending how the data should be structured for time-series forecasting. In particular, I do not get what each row in the training set looks like.
For example, say that you have a target variable (Y) for several years (t) and a few features that were measured at the same time as Y (A and B). With the training set, does the model learn the value of Y when A and B are measured for that same year, or should you lag A and B? Written another way, should Y_t = A_t-1 + B_t-1 or Y_t = A_t + b_t for each row in the data?
My intuition is that A and B should be lagged, because if we truly care about forecasting we won’t know the values of A, B, and Y in the future.
I hope this question makes sense, it’s been troubling me for a while!
I recommend starting here:
https://machinelearningmastery.com/time-series-forecasting-supervised-learning/
Hi Jason
I have a dataset where the sales have correlation with lagged values of personal income..increase in personal income affects the sales some periiods down the line.I am having problems in determining the lag window..can u advise?
Test a suite of values and use the window size that results in the best model skill.
Hi,
I am currently working on my master thesis about hazardous event prediction in drilling with ML where we want to predict/detect kick or loss circulation (hazards in drilling) according to time-series rig data.
totally, I have some features (maybe 20 or more) and I have to choose 6-7 (best-fit) out of them to build my ML model. The prediction is a multivariate time-series problem as the hazard occurrence is based on more than one factor.
Would you please guide me on how should I choose 6-7 features out of 20 in this case?
Thanks
Perhaps this will help:
https://machinelearningmastery.com/feature-selection-with-real-and-categorical-data/
I have a naive question.when adding domain specific features, if we use for example auto regression mode with lag=2 to do the time series analysis, would we write the model as x_t = a1*x_t-1 + a2*x_t-2+b*f1 where f1 is the additional domain feature? thank you.
That looks about right.
Hi Jason,
“lag features are the classical way that time series forecasting problems are transformed into supervised learning problems.”
I cannot get the reason why we need to lag time series data.
I mean if I have a set of predictors like economic variables and I have to predict a binary variable, why using the variables I have is not enough? why adding the lagged versions of them?
The problem can still be supervised learning..I do not get it
Thanks in advance
Luigi
Good question, see this:
https://machinelearningmastery.com/time-series-forecasting-supervised-learning/
Hi, appreciate your great explanations, awesome! I wonder how will you load a statistics feature-engineered time series dataset/dataframe into ARIMA? Would appreciate if you have example or article. Thanks!
Thanks!
I don’t have an article on this topic, sorry.
I want to extract time domain and frequency domain features of a time series, using a sliding window. the sampling rate is 1000Hz. I don’t know how to choose the right size for the window. I saw you mentioned that ACF can be helpful, but I couldn’t get how it can be useful after reading the article.
also for the rolling() function, there are options available for choosing the type of window :
https://docs.scipy.org/doc/scipy/reference/signal.windows.html#module-scipy.signal.windows
how to choose one?
This tutorial will help you with ACF and PACF plots:
https://machinelearningmastery.com/gentle-introduction-autocorrelation-partial-autocorrelation/
hi Jason
Can u show an example of lagged on multivariate indexes with multi-time step
Thanks
Perhaps the examples here will help as a first step:
https://machinelearningmastery.com/how-to-develop-lstm-models-for-time-series-forecasting/
Hi Jason,
Thanks a lot for another great article.. I have one quick question – suppose we have an extension of the temperature prediction.. So, i want to be able to predict temperature in the next time stamp for a particular state or country.. Do i create these features for each state/country separately? please advise on how to create features for such problem.
Thanks
To make a prediction, you will require whatever inputs are expected by the model. This assumes those inputs are available or can be constructed. If not, you may need to change the framing of the problem based on only the data that is available at prediction time.
Hello Mr.Brownlee
This tutorial was so helpful for me, thank you so much.
I just have a question:
In time series problems can we tune the hyper parameters with GridSearchCV or RandomSearchCV approaches ? or there are different ways that we should use ?
Best regards.
Yes you can. But depends on how to implement your model. GridSearchCV and RandomSearchCV looks like referring to the one from scikit-learn. It assumes a model that follows the scikit-learn API. As long as your model is created as such, it should work.
Suppose that data coming in at a high frequency, meaning that all of the mentioned computations would be very expensive. How do we handle feature engineering at the production time?
Hi KL…Your question falls into the category of machine learning in operations. The following is a great starting point:
https://www.coursera.org/specializations/machine-learning-engineering-for-production-mlops?utm_source=gg&utm_medium=sem&utm_campaign=28-MLOps-DL.ai-US&utm_content=B2C&campaignid=13572037851&adgroupid=120618068101&device=c&keyword=mlops%20coursera&matchtype=p&network=g&devicemodel=&adpostion=&creativeid=528598123150&hide_mobile_promo&gclid=Cj0KCQiAmKiQBhClARIsAKtSj-kTX7CAJxkQWAtoIM5QJQcb_9e1BhozWdb7RH2ZrST2a9jcs1dhsn4aAhyAEALw_wcB
Hi, thank you so much…I have implemented multivariate time-series in python, thanks to your tutorial, but I keep noticing that the model performance is the same or even worse when I use multiple variables (multivariate) comprared to univariate. Actually I am trying to build features that are useful for better prediction but I am having no luck doing so….Can you suggest anything to resolve this issue? Thank you
Hi Zaid…You are very welcome! The following is a great place to start regarding your question:
https://machinelearningmastery.com/feature-selection-time-series-forecasting-python/
Hi Jason,
For multivariate time series forecasting, let’s say I want to use last 10 rows to predict the next 1 rows. If I split train and test data first, then I create new column in both datasets, which is mean of all the rows of target variable (separately mean calculated on training and test datasets). I am not using rolling mean here. Also I create additional column which is deviation from the mean for each row. Is it correct feature generation without data leakage?
Hi Ajinkya…The following resource may be of interest to you:
https://spotintelligence.com/2023/08/04/data-leakage-in-machine-learning/#:~:text=Split%20Data%20Before%20Preprocessing%3A%20Ensure,feature%20engineering%20or%20data%20cleaning.