Feature selection is the process of reducing the number of input variables when developing a predictive model.
It is desirable to reduce the number of input variables to both reduce the computational cost of modeling and, in some cases, to improve the performance of the model.
Statistical-based feature selection methods involve evaluating the relationship between each input variable and the target variable using statistics and selecting those input variables that have the strongest relationship with the target variable. These methods can be fast and effective, although the choice of statistical measures depends on the data type of both the input and output variables.
As such, it can be challenging for a machine learning practitioner to select an appropriate statistical measure for a dataset when performing filter-based feature selection.
In this post, you will discover how to choose statistical measures for filter-based feature selection with numerical and categorical data.
After reading this post, you will know:
- There are two main types of feature selection techniques: supervised and unsupervised, and supervised methods may be divided into wrapper, filter and intrinsic.
- Filter-based feature selection methods use statistical measures to score the correlation or dependence between input variables that can be filtered to choose the most relevant features.
- Statistical measures for feature selection must be carefully chosen based on the data type of the input variable and the output or response variable.
Kick-start your project with my new book Data Preparation for Machine Learning, including step-by-step tutorials and the Python source code files for all examples.
Let’s get started.
- Update Nov/2019: Added some worked examples for classification and regression.
- Update May/2020: Expanded and added references. Added pictures.

How to Develop a Probabilistic Model of Breast Cancer Patient Survival
Photo by Tanja-Milfoil, some rights reserved.
Overview
This tutorial is divided into 4 parts; they are:
- Feature Selection Methods
- Statistics for Filter Feature Selection Methods
- Numerical Input, Numerical Output
- Numerical Input, Categorical Output
- Categorical Input, Numerical Output
- Categorical Input, Categorical Output
- Tips and Tricks for Feature Selection
- Correlation Statistics
- Selection Method
- Transform Variables
- What Is the Best Method?
- Worked Examples
- Regression Feature Selection
- Classification Feature Selection
1. Feature Selection Methods
Feature selection methods are intended to reduce the number of input variables to those that are believed to be most useful to a model in order to predict the target variable.
Feature selection is primarily focused on removing non-informative or redundant predictors from the model.
— Page 488, Applied Predictive Modeling, 2013.
Some predictive modeling problems have a large number of variables that can slow the development and training of models and require a large amount of system memory. Additionally, the performance of some models can degrade when including input variables that are not relevant to the target variable.
Many models, especially those based on regression slopes and intercepts, will estimate parameters for every term in the model. Because of this, the presence of non-informative variables can add uncertainty to the predictions and reduce the overall effectiveness of the model.
— Page 488, Applied Predictive Modeling, 2013.
One way to think about feature selection methods are in terms of supervised and unsupervised methods.
An important distinction to be made in feature selection is that of supervised and unsupervised methods. When the outcome is ignored during the elimination of predictors, the technique is unsupervised.
— Page 488, Applied Predictive Modeling, 2013.
The difference has to do with whether features are selected based on the target variable or not. Unsupervised feature selection techniques ignores the target variable, such as methods that remove redundant variables using correlation. Supervised feature selection techniques use the target variable, such as methods that remove irrelevant variables..
Another way to consider the mechanism used to select features which may be divided into wrapper and filter methods. These methods are almost always supervised and are evaluated based on the performance of a resulting model on a hold out dataset.
Wrapper feature selection methods create many models with different subsets of input features and select those features that result in the best performing model according to a performance metric. These methods are unconcerned with the variable types, although they can be computationally expensive. RFE is a good example of a wrapper feature selection method.
Wrapper methods evaluate multiple models using procedures that add and/or remove predictors to find the optimal combination that maximizes model performance.
— Page 490, Applied Predictive Modeling, 2013.
Filter feature selection methods use statistical techniques to evaluate the relationship between each input variable and the target variable, and these scores are used as the basis to choose (filter) those input variables that will be used in the model.
Filter methods evaluate the relevance of the predictors outside of the predictive models and subsequently model only the predictors that pass some criterion.
— Page 490, Applied Predictive Modeling, 2013.
Finally, there are some machine learning algorithms that perform feature selection automatically as part of learning the model. We might refer to these techniques as intrinsic feature selection methods.
… some models contain built-in feature selection, meaning that the model will only include predictors that help maximize accuracy. In these cases, the model can pick and choose which representation of the data is best.
— Page 28, Applied Predictive Modeling, 2013.
This includes algorithms such as penalized regression models like Lasso and decision trees, including ensembles of decision trees like random forest.
Some models are naturally resistant to non-informative predictors. Tree- and rule-based models, MARS and the lasso, for example, intrinsically conduct feature selection.
— Page 487, Applied Predictive Modeling, 2013.
Feature selection is also related to dimensionally reduction techniques in that both methods seek fewer input variables to a predictive model. The difference is that feature selection select features to keep or remove from the dataset, whereas dimensionality reduction create a projection of the data resulting in entirely new input features. As such, dimensionality reduction is an alternate to feature selection rather than a type of feature selection.
We can summarize feature selection as follows.
- Feature Selection: Select a subset of input features from the dataset.
- Unsupervised: Do not use the target variable (e.g. remove redundant variables).
- Correlation
- Supervised: Use the target variable (e.g. remove irrelevant variables).
- Wrapper: Search for well-performing subsets of features.
- RFE
- Filter: Select subsets of features based on their relationship with the target.
- Statistical Methods
- Feature Importance Methods
- Intrinsic: Algorithms that perform automatic feature selection during training.
- Decision Trees
- Wrapper: Search for well-performing subsets of features.
- Unsupervised: Do not use the target variable (e.g. remove redundant variables).
- Dimensionality Reduction: Project input data into a lower-dimensional feature space.
The image below provides a summary of this hierarchy of feature selection techniques.
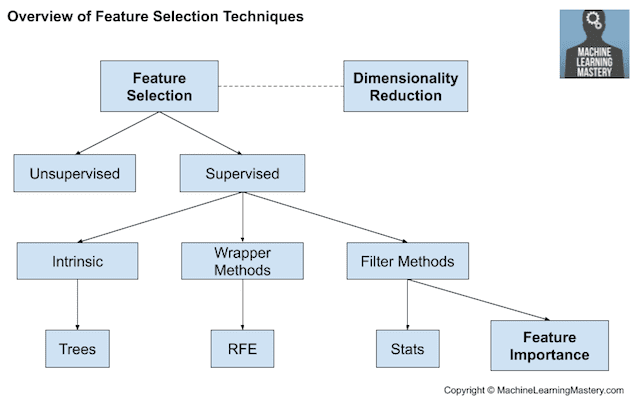
Overview of Feature Selection Techniques
In the next section, we will review some of the statistical measures that may be used for filter-based feature selection with different input and output variable data types.
Want to Get Started With Data Preparation?
Take my free 7-day email crash course now (with sample code).
Click to sign-up and also get a free PDF Ebook version of the course.
2. Statistics for Filter-Based Feature Selection Methods
It is common to use correlation type statistical measures between input and output variables as the basis for filter feature selection.
As such, the choice of statistical measures is highly dependent upon the variable data types.
Common data types include numerical (such as height) and categorical (such as a label), although each may be further subdivided such as integer and floating point for numerical variables, and boolean, ordinal, or nominal for categorical variables.
Common input variable data types:
- Numerical Variables
- Integer Variables.
- Floating Point Variables.
- Categorical Variables.
- Boolean Variables (dichotomous).
- Ordinal Variables.
- Nominal Variables.
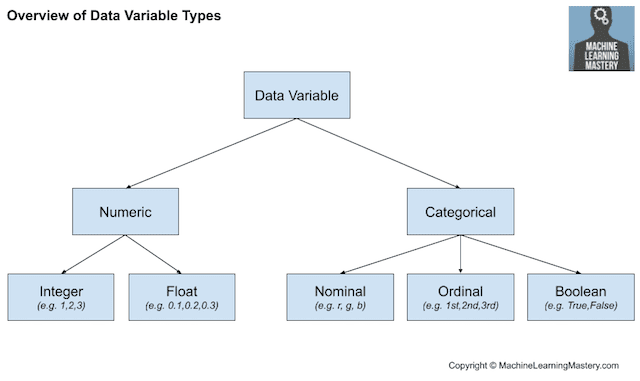
Overview of Data Variable Types
The more that is known about the data type of a variable, the easier it is to choose an appropriate statistical measure for a filter-based feature selection method.
In this section, we will consider two broad categories of variable types: numerical and categorical; also, the two main groups of variables to consider: input and output.
Input variables are those that are provided as input to a model. In feature selection, it is this group of variables that we wish to reduce in size. Output variables are those for which a model is intended to predict, often called the response variable.
The type of response variable typically indicates the type of predictive modeling problem being performed. For example, a numerical output variable indicates a regression predictive modeling problem, and a categorical output variable indicates a classification predictive modeling problem.
- Numerical Output: Regression predictive modeling problem.
- Categorical Output: Classification predictive modeling problem.
The statistical measures used in filter-based feature selection are generally calculated one input variable at a time with the target variable. As such, they are referred to as univariate statistical measures. This may mean that any interaction between input variables is not considered in the filtering process.
Most of these techniques are univariate, meaning that they evaluate each predictor in isolation. In this case, the existence of correlated predictors makes it possible to select important, but redundant, predictors. The obvious consequences of this issue are that too many predictors are chosen and, as a result, collinearity problems arise.
— Page 499, Applied Predictive Modeling, 2013.
With this framework, let’s review some univariate statistical measures that can be used for filter-based feature selection.
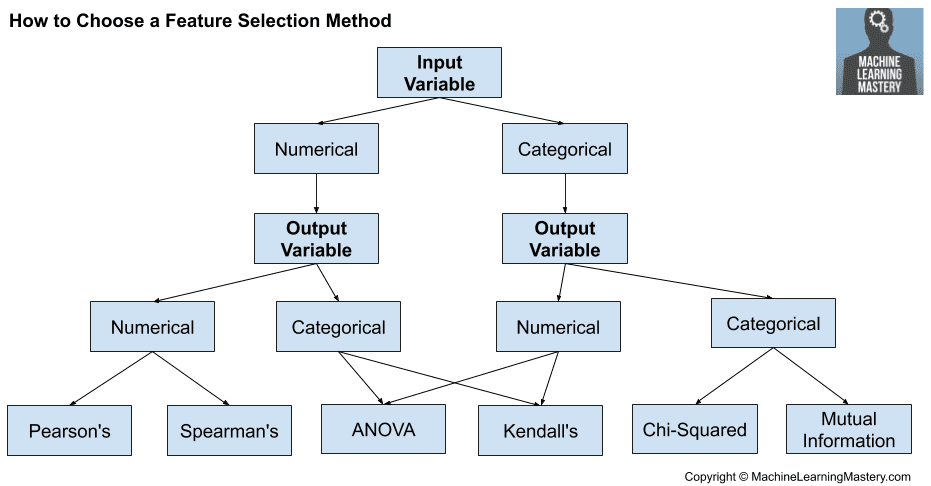
How to Choose Feature Selection Methods For Machine Learning
Numerical Input, Numerical Output
This is a regression predictive modeling problem with numerical input variables.
The most common techniques are to use a correlation coefficient, such as Pearson’s for a linear correlation, or rank-based methods for a nonlinear correlation.
- Pearson’s correlation coefficient (linear).
- Spearman’s rank coefficient (nonlinear)
Numerical Input, Categorical Output
This is a classification predictive modeling problem with numerical input variables.
This might be the most common example of a classification problem,
Again, the most common techniques are correlation based, although in this case, they must take the categorical target into account.
- ANOVA correlation coefficient (linear).
- Kendall’s rank coefficient (nonlinear).
Kendall does assume that the categorical variable is ordinal.
Categorical Input, Numerical Output
This is a regression predictive modeling problem with categorical input variables.
This is a strange example of a regression problem (e.g. you would not encounter it often).
Nevertheless, you can use the same “Numerical Input, Categorical Output” methods (described above), but in reverse.
Categorical Input, Categorical Output
This is a classification predictive modeling problem with categorical input variables.
The most common correlation measure for categorical data is the chi-squared test. You can also use mutual information (information gain) from the field of information theory.
- Chi-Squared test (contingency tables).
- Mutual Information.
In fact, mutual information is a powerful method that may prove useful for both categorical and numerical data, e.g. it is agnostic to the data types.
3. Tips and Tricks for Feature Selection
This section provides some additional considerations when using filter-based feature selection.
Correlation Statistics
The scikit-learn library provides an implementation of most of the useful statistical measures.
For example:
- Pearson’s Correlation Coefficient: f_regression()
- ANOVA: f_classif()
- Chi-Squared: chi2()
- Mutual Information: mutual_info_classif() and mutual_info_regression()
Also, the SciPy library provides an implementation of many more statistics, such as Kendall’s tau (kendalltau) and Spearman’s rank correlation (spearmanr).
Selection Method
The scikit-learn library also provides many different filtering methods once statistics have been calculated for each input variable with the target.
Two of the more popular methods include:
- Select the top k variables: SelectKBest
- Select the top percentile variables: SelectPercentile
I often use SelectKBest myself.
Transform Variables
Consider transforming the variables in order to access different statistical methods.
For example, you can transform a categorical variable to ordinal, even if it is not, and see if any interesting results come out.
You can also make a numerical variable discrete (e.g. bins); try categorical-based measures.
Some statistical measures assume properties of the variables, such as Pearson’s that assumes a Gaussian probability distribution to the observations and a linear relationship. You can transform the data to meet the expectations of the test and try the test regardless of the expectations and compare results.
What Is the Best Method?
There is no best feature selection method.
Just like there is no best set of input variables or best machine learning algorithm. At least not universally.
Instead, you must discover what works best for your specific problem using careful systematic experimentation.
Try a range of different models fit on different subsets of features chosen via different statistical measures and discover what works best for your specific problem.
4. Worked Examples of Feature Selection
It can be helpful to have some worked examples that you can copy-and-paste and adapt for your own project.
This section provides worked examples of feature selection cases that you can use as a starting point.
Regression Feature Selection:
(Numerical Input, Numerical Output)
This section demonstrates feature selection for a regression problem that as numerical inputs and numerical outputs.
A test regression problem is prepared using the make_regression() function.
Feature selection is performed using Pearson’s Correlation Coefficient via the f_regression() function.
|
1 2 3 4 5 6 7 8 9 10 11 |
# pearson's correlation feature selection for numeric input and numeric output from sklearn.datasets import make_regression from sklearn.feature_selection import SelectKBest from sklearn.feature_selection import f_regression # generate dataset X, y = make_regression(n_samples=100, n_features=100, n_informative=10) # define feature selection fs = SelectKBest(score_func=f_regression, k=10) # apply feature selection X_selected = fs.fit_transform(X, y) print(X_selected.shape) |
Running the example first creates the regression dataset, then defines the feature selection and applies the feature selection procedure to the dataset, returning a subset of the selected input features.
|
1 |
(100, 10) |
Classification Feature Selection:
(Numerical Input, Categorical Output)
This section demonstrates feature selection for a classification problem that as numerical inputs and categorical outputs.
A test regression problem is prepared using the make_classification() function.
Feature selection is performed using ANOVA F measure via the f_classif() function.
|
1 2 3 4 5 6 7 8 9 10 11 |
# ANOVA feature selection for numeric input and categorical output from sklearn.datasets import make_classification from sklearn.feature_selection import SelectKBest from sklearn.feature_selection import f_classif # generate dataset X, y = make_classification(n_samples=100, n_features=20, n_informative=2) # define feature selection fs = SelectKBest(score_func=f_classif, k=2) # apply feature selection X_selected = fs.fit_transform(X, y) print(X_selected.shape) |
Running the example first creates the classification dataset, then defines the feature selection and applies the feature selection procedure to the dataset, returning a subset of the selected input features.
|
1 |
(100, 2) |
Classification Feature Selection:
(Categorical Input, Categorical Output)
For examples of feature selection with categorical inputs and categorical outputs, see the tutorial:
Further Reading
This section provides more resources on the topic if you are looking to go deeper.
Tutorials
- How to Calculate Nonparametric Rank Correlation in Python
- How to Calculate Correlation Between Variables in Python
- Feature Selection For Machine Learning in Python
- An Introduction to Feature Selection
Books
- Applied Predictive Modeling, 2013.
- Feature Engineering and Selection, 2019.
- Feature Engineering for Machine Learning, 2018.
Articles
- Feature selection, scikit-learn API.
- What are the feature selection options for categorical data? Quora.
Summary
In this post, you discovered how to choose statistical measures for filter-based feature selection with numerical and categorical data.
Specifically, you learned:
- There are two main types of feature selection techniques: supervised and unsupervised, and supervised methods may be divided into wrapper, filter and intrinsic.
- Filter-based feature selection methods use statistical measures to score the correlation or dependence between input variables that can be filtered to choose the most relevant features.
- Statistical measures for feature selection must be carefully chosen based on the data type of the input variable and the output or response variable.
Do you have any questions?
Ask your questions in the comments below and I will do my best to answer.
Get a Handle on Modern Data Preparation!

Prepare Your Machine Learning Data in Minutes
...with just a few lines of python code
Discover how in my new Ebook:
Data Preparation for Machine Learning
It provides self-study tutorials with full working code on:
Feature Selection, RFE, Data Cleaning, Data Transforms, Scaling, Dimensionality Reduction,
and much more...


Hi Jason,
Thank you for the nice blog. Do you have a summary of unsupervised feature selection methods?
All of the statistical methods listed in the post are unsupervised.
Hi
Actually I’ve got the same question like Mehmet above. Please correct me if I’m wrong, the talk in this article is about input variables and target variables. With that I understand features and labels of a given supervised learning problem.
But in your answer it says unsupervised! I’m a bit confused.
Thanks.
They are statistical tests applied to two variables, there is no supervised learning model involved.
I think by unsupervised you mean no target variable. In that case you cannot do feature selection. But you can do other things, like dimensionality reduction, e.g. SVM and PCA.
But the two code samples you’re providing for feature selection _are_ from the area of supervised learning:
– Regression Feature Selection (Numerical Input, Numerical Output)
– Classification Feature Selection (Numerical Input, Categorical Output)
Do you maybe mean that supervised learning is _one_ possible area one can make use of for feature selection BUTthis is not necessarily the only field of using it?
Perhaps I am saying that this type of feature selection only makes sense on supervised learning, but it is not a supervised learning type algorithm – the procedure is applied in an unsupervised manner.
OK I guess know I understand what you mean.
Feature selection methods are used by the supervised learning problems to reduce the numer of input features (or as you call them “the input variables”), however ALL of these methods themself work in an unsupervised manner to do so.
That is my understanding.
What do you mean by unsupervised – like feature selection for clustering?
Hello Sir,
If we have no target variable, can we apply feature selection before the clustering of a numerical dataset?
No. Feature selection requires a target – at least all of the supervised methods do.
You can use unsupervised methods to remove redundant inputs. I don’t have an example of this yet.
Hi jason, thanks for the post!
I have used pearson selection as a filter method between target and variables. My target is binary however, and my variables can either be categorical or continuous. Is the Pearson correlation still a valid option for feature selection? If not, could you tell me what other filter methods there are whenever the target is binary and the variable either categorical or continuous?
No, Pearson’s is not appropriate. Consider anova f.
Hi Jason, in Herman’s case is it valid to split the predictor variables into 2 groups (numerical and categorical variables) and analyze them separately with the target variable? what do you think? thanks!
Hi Jenry…You may find the following resource of interest:
https://inria.github.io/scikit-learn-mooc/python_scripts/03_categorical_pipeline_column_transformer.html
Thanks again for short and excellent post. How about Lasso, RF, XGBoost and PCA? These can also be used to identify best features.
Yes, but in this post we are focused on univariate statistical methods, so-called filter feature selection methods.
Thanks for your time for the clarification.
Thanks for sharing. Actually I was looking for such a great blog since a long time.
Thanks!
I hope it helps.
Pleasegivetworeasonswhyitmaybedesirabletoperformfeatureselectioninconnection with document classification.
What would feature selection for document classification look like exactly? Do you mean reducing the size of the vocab?
quite an informative article with great content
Thanks!
Hi Jason! Thanks for this informative post! I’m trying to apply this knowledge to the Housing Price prediction problem where the regressors include both numeric features and categorical features. In your graph, (Categorical Inputs, Numerical Output) also points to ANOVA. To use ANOVA correctly in this Housing Price case, do I have to encode my Categorical Inputs before SelectKBest?
Yes, categorical variables will need to be label/integer encoded at the least.
Hello Jason!, as in YXZ’s case
I have a continuous numerical output and a set of non-binary categorical inputs, is it recommended to encode those categorical inputs as dummy variables or use a label/integer encoder for those variables? And I also would like to know how to apply a “reverse” Kendall Rank Correlation method for this case or ANOVA, considering my output is continuous, which is my best option?
Regards
I would recommend using an integer/ordinal encoding and trying a feature selection method designed for categorical data or RFE a decision tree.
Hi Jason! I have dataset with both numerical and categorical features. The label is categorical in nature. Which is the best possible approach to find feature importance? Should I OneHotEncode my categorical features before applying ANOVA/Kendall’s?
Use separate statistical feature selection methods for different variable types.
Or try RFE.
Hey Jason,
Thanks a lot for this detailed article.
I have a question, after one hot encoding my categorical feature, the created columns just have 0 and 1. My output variable is numerical and all other predictors are also numerical. Can i use pearson/spearman correlation for feature selection here (and for removing multicollinearity as well) ??
Now since one hot encoded column has some ordinality (0 – Absence, 1- Presence) i guess correlation matrix will be useful.
I tried this and the output is making sense business wise. Just wanted to know your thoughts on this, is this fundamentally correct ??
No, spearman/pearson correlation on binary attributes does not make sense.
You perform feature selection on the categorical variables directly.
(0 – Absence, 1- Presence) is Boolean, how it is Ordinal?
Yes, categorical/boolean.
It can be modeled as an ordinal relationship if you want, but it may not make sense for some domains.
Thanks a lot for your nice post. I’m way new to ML so I have a really rudimentary question. Suppose I have a set of tweets which labeled as negative and positive. I want to perform some sentiment analysis. I extracted 3 basic features: 1. Emotion icons 2.Exclamation marks 3. Intensity words(very, really). My question is: How should I use these features with SVM or other ML algorithms? In other words, how should I apply the extracted features in SVM algorithm?
should I train my dataset each time with one feature? I read several articles and they are just saying: we should extract features and deploy them in our algorithms but HOW?
Help me, please
The text will need a numeric representation, such as a bag of words.
This is called natural language processing, you can get started here:
https://machinelearningmastery.com/start-here/#nlp
Thank you sir
You’re welcome.
Hey jason,
Can you please say why should we use univariate selection method for feature selection?
Cause we should use correlation matrix which gives correlation between each dependent feature and independent feature,as well as correlation between two independent features.
So, using correlation matrix we can remove collinear or redundant features also.
So can you please say when should we use univariate selection over correlation matrix?
Yes, filter methods like statistical test are fast and easy to test.
You can move on to wrapper methods like RFE later.
hi Jason
thnx for your helpful post
i want to know which method to use?
input vairables are
1. age
2.sex(but it has numbers as 1 for males and 2 for females)
3. working hours-
4. school attainment (also numbers)
the output is numeric
could you plz help
Perhaps note whether each variable is numeric or categorical then follow the above guide.
Hi, Jason!
Do you mean you need to perform feature selection for each variable according to input and output parameters as illustrated above? Is there any shortcuts where I just feed the data and produce feature scores without worrying on the type of input and output data?
Yes, different feature selection for diffrent variable types.
A short cut would be to use a different approach, like RFE, or an algorithm that does feature selection for you like xgboost/random forest.
Hello Jason,
Thank you for your nice blogs, I read several and find them truly helpful.
I have a quick question related to feature selection:
if I want to select some features via VarianceThreshold, does this method only apply to numerical inputs?
Can I encode categorical inputs and apply VarianceThreshold to them as well?
Many thanks!
Thanks!
Yes, numerical only as far as I would expect.
Hi Jason!
Is there any way to display the names of the features that were selected by SelectKBest?
In your example it just returns a numpy array with no column names.
Yes, you can loop through the list of column names and the features and print whether they were selected or not using information from the attributes on the SelectKBest class.
Hi Jason,
Many thanks for this detailed blog. A quick question on the intuition of the f_classif method.
Why do we select feature with high F value? Say if y takes two classes [0,1], and feature1 was selected because it has high F-statistic in a univariate ANOVA with y, does it mean that the mean of feature11 when y = 0, is statistically different from the mean of feature 1 when y = 1? and therefore feature 1 likely to be useful in predicting y?
Yes, large values. But don’t do it manually use a built-in selection method.
See the worked examples at the end of the tutorial as a template.
hi jason,
so im working with more than 100 thousand samples dota2 dataset which consist of the winner and the “hero” composition from each match. I was trying to build winner of the match prediction model similiar to this [http://jmcauley.ucsd.edu/cse255/projects/fa15/018.pdf]. so the vector input is
Xi= 1 if hero i on radiant side, 0 otherwise.
X(119+i) = 1 if hero i on dire side, 0 otherwise
The vector X consist 238 entri since there are 119 kind of heroes. Each vector represent the composition of the heroes that is played within each match. Each match always consist of exactly 10 heroes (5 radiant side 5 dire side).
From this set up i would have a binary matrix of 100k times (222 + 1) dimension with row represent how many samples and columns represent features, +1 columns for the label vector (0 and 1, 1 meaning radiant side win)
so if i dot product between two column vector of my matrix, i can get how many times hero i played with hero j on all the samples.
so if i hadamard product between two column vector of my matrix and the result of that we dot product to the vector column label i can get how many times hero i played with hero j and win.
with this i can calculate the total weight of each entri per samples that corresponding to the vector label. i could get very high coorelation between this “new features” to the label vector. but i cant find any references to this problem in statistics textbook on binary data.
Not sure I can offer good advice off the cuff, sorry.
Hi Jason, Thanks for this article. I totally understand this different methodologies. I have one question.
If lets say. I have 3 variables. X,Y,Z
X= categorical
Y= Numerical
Z= Categorical, Dependent(Value I want to predict)
Now, I did not get any relationship between Y and Z and I got the Relationship between Y and Z. Is it possible that if we include X, Y both together to predict Z, Y might get the relationship with Z.
If is there any statistical method or research around please do mention them. Thanks
I would recommend simply testing reach combination of input variables and use the combination that results in the best performance for predicting the target – it’s a lot simpler than multivariate statistics.
One recommendation is to use the DSD (Definitive Screening Design), a type of statistical Design of Experiments (DoE), which can “estimate of main effects that are unbiased by any second-order effect, require only one more than twice as many runs as there are factors, and avoid confounding of any pair of second-order effects” [1]
The DSD can also be augmented with two-level categorical factors “where the experiment can estimate quadratic effects, the estimation of which decreases as more categorical factors are added” [2]
We use this method to assist in feature selection in CNNs intended for industrial process applications.
[1] B. Jones and C. J. Nachtsheim, “A Class of Three-Level Designs for Definitive Screening in the Presence of Second-Order Effects,” Journal of Quality Technology, vol. 43, no. 1, pp. 1-15, 2011
[2] B. Jones and C. J. Nachtsheim, “Definitive Screening Designs with Added Two-Level Categorical Factors,” Journal of Quality Technology, vol. 45, no. 2, pp. 121-129, 2013
Great suggestion, thanks for sharing George!
When having a dataset that contains only categorical variables including nominal, ordinal & dichotomous variables, is it incorrect if I use either Cramér’s V or Theil’s U (Uncertainty Coefficient) to get the correlation between features?
Thanks
San
I don’t know off-hand, sorry.
Very good article.
I have detected outliers and wondering how can I estimate contribution of each feature on a single outlier?
We are talking about only one observation and it’s label, not whole dataset.
I couldn’t find any reference for that.
This sounds like an open question.
Perhaps explore distance measures from a centroid or to inliers?
Or univariate distribution measures for each feature?
Thank you for quick response.
That’s one class multivalve application.
For a single observation, I need to find out the first n features that have the most impact on being in that class.
From most articles, I can find the most important features over all observations, but here I need to know that over a selected observations.
Simply fit the model on your subset of instances.
1) In case of feature selection algorithm (XGBosst, GA, and PCA) what kind of method we can consider wrapper or filter?
2) what is the difference between feature selection and dimension reduction?
XGBoost would be used as a filter, GA would be a wrapper, PCA is not a feature selection method.
Feature selection chooses features in the data. Dimensionality reduction like PCA transforms or projects the features into lower dimensional space.
Technically deleting features could be considered dimensionality reduction.
Thank you so much for your time to respond. Would you like to share some of the material on the same (so I can use it for my thesis as a reference)?
In addition, I am excited to know the advantages and disadvantaged in this respect; I mean when I use XGBoost as a filter feature selection and GA as a wrapper feature selection and PCA as a dimensional reduction, Then what may be the possible advantages and disadvantages?
best regards!
If you need theory of feature selection, I recommend performing a literature review.
I cannot help you with advantages/disadvantages – it’s mostly a waste of time. I recommend using what “does” work best on a specific dataset, not what “might” work best.
I didn’t get your point.
I have 1 record which is outlier. and wanted to know which features had the most contribution on that record to get outlier.
Thank you and sorry if question is confusing
I suggested that it is an open question – as in, there are no obvious answers.
I suggested to take it on as a research project and discover what works best.
Does that help, which part is confusing – perhaps I can elaborate?
Thank you
Should research on that
Thanks for the suggestion.
Do the above algorithms keep track of ‘which’ features have been selected, or only selects the ‘best’ feature data? Aafter having identified the ‘best k features’, how do we extract those features, ideally only those, from new inputs?
Yes, you can discover which features are selected according to their column index.
Hi Jason,
thanks again you for the nice overview. Here is relatively new package introducing the Phi_K correlation coefficient that claims that it can be used across categorical, ordinal and numerical features. It is also said to capture non-linear dependency.
https://phik.readthedocs.io/en/latest/#
best wishes
Oliver
Thanks for sharing.
Hi Jason, Thanks for the amazing article.
A question on using ANOVA. Given Categorical variables and a Numerical Target, would you not have to assume homogeneity of variance between the samples of each categorical value. From what I learned, ANOVA require the assumption of equal variance.
Perhaps.
Often the methods fail gracefully rather than abruptly, which means you can use them reliably when when assumptions are violated.
Hello Jason,
Thank you for your explanation and for sharing great articles with us!
You have clearly explained how to perform feature selection in different variations in the “How to Choose Feature Selection Methods For Machine Learning” table.
+ Numerical Input, Numerical Output:
Pearson’s correlation coefficient (linear). Spearman’s rank coefficient (nonlinear)
+ Numerical Input, Categorical Output:
ANOVA correlation coefficient (linear). Kendall’s rank coefficient (nonlinear).
+ Categorical Input, Numerical Output:
ANOVA correlation coefficient (linear). Kendall’s rank coefficient (nonlinear).
+ Categorical Input, Categorical Output:
Chi-Squared test (contingency tables). Mutual Information.
I would like to ask some questions about the dataset that contains a combination of numerical and categorical inputs.
1- Which methods should we apply when we have a dataset that has a combination of numerical and categorical inputs? (e.g: Total Input: 50; Numerical:25 and Categorical:25. Task: Classification problem with the categorical values)
2- Should I apply one of the label encoding methods (encoding depending on the labels in the feature let’s say I applied one-hot, target encoding). Get the numerical values from the categorical input. Then, my problem becomes into the Numerical Input, Categorical Output. In this time, should I apply to the ANOVA correlation coefficient (linear) and Kendall’s rank coefficient (nonlinear) techniques?
3- OR, What would be the better approaches to apply feature selection techniques to the classification (Categorical Output) problem that includes a combination of numerical and categorical input?
Thank you.
You’re welcome.
You would use a separate method for each data type or a wrapper method that supports all inputs at once.
Hello Jason,
Thanks for the great article. I am understanding the concepts.
I have few questions.
1. I have a dataset in which I have numerical data like numberOfBytes, numberOfPackets. Also I have certain other features like IP address (like 10, 15,20,23,3) and protocol like (6,7,17 which represent TCP, UDP, ICMP).
In this case is feature like IP address, protocol are numerical or categorical????. Actually they represent categories and are nominal values but they are represented as numbers. The target is again numbers(1- tcp traffic, 2 – udp normal traffic, 3 icmp normal trafic, 4 – malicious traffic) . Can I consider IP address, Protocol as categorical? Can I consider target as Categorical?
2. The dataset is a mix of numerical and categorical data. So what feature selection can be done for these kinds of datasets.
3. Kindly validate my pipeline –
1) load dataset.
2) Split dataset into train-test split
3) Perform getdummies and drop one dummy for each IP address and protocol.
4) Label encoding for target
5) For training set perform Feature selection using chisquare or mutal info.
6) Select the top 20 features
7) Scale the features…
8) Perform cross validation for model and take the mean accuracy.
Should we do encoding(dummies or onehot) before feature selection? Should we scale the encoded features?
4) From your experience, what would you do for datasets having mix of categorical and numerical variables and categorical target variables. Seen that you mentioning doing feature selection for each type of variables separately. Can you share an example for that.
What are the other alternatives for such problems.
5) Say I used XGBoost classifer to select the best features. Can we use these best features given by XGBoost for doing classification with another model say logistic regression. I always see examples where features returned by XGBoost is used by the same model to perform classification.
Perhaps you can find an appropriate representation for IP addresses in the literature, or trial a few approaches you can conceive.
Perhaps you can use RFE that is agnostic to variable types:
https://machinelearningmastery.com/rfe-feature-selection-in-python/
Perhaps encoding is required prior to some selection techniques. It depends.
XGB does not perform feature selection, it can be used for feature importance scores.
I have a mixture of numeric, ordinal, and nominal attributes.
For the first two, Pearson is used to determine the correlation with the target.
For the nominal type, I still cannot find a good reference on how we should handle it for correlation. Encode it to numeric doesn’t seem correct as the numeric values would probably suggest some ordinal relationship but it should not for nominal attributes.
Any advice?
I also tested the model performance based on the transformed attribute that gives higher correlation with the target, but however, the model performance did not improve as expected. any suggestions what can i explore further?
Nominal is “Categorical” now follow the above advice based on the type of the output variable.
Hi Jason, when the output, i.e. the label is 0 or 1 meant to represent Bad and Good, is this considered as numeric output or categorical output?
It is a number that we can map to a category in our application.
So this response variable should be considered as categorical target or numeric target.
Categorical.
Jason you have not shown the example of categorical input and numerical output.
You can reverse the case for: Numerical Input, Categorical Output
Sir,
In my dataset, 29 attributes are yes/no values(binary) and the rest is numeric(float)type attributes. Class has 7 values(multiclass). I want to try this dataset for classification. Which techniques of feature selections are suitable? Please give me a hand!
With respect!
Thaung
Some ideas:
Perhaps establish a baseline performance with all features?
Perhaps try separate feature selection methods for each input type?
Perhaps try a wrapper method like RFE that is agnostic to input type?
Hi Jason and thanks a lot for this wonderful and so helpful work.
1- wrapper methods : does the model get rid of irrelevant features or it just assigns small weights.?
2-filter methods: when using univariate techniques, how to detect or prevent redundant among the selected variables ?
3- What about t-statistic ?
Thanks in advance.
Wrapper tests different subsets of features and chooses a subset that gives best skill.
Deleting redundant features is performed without the target. e.g. highly correlated features can be dropped.
Yes, I have read this. I don’t have an example.
Thanks a lot.
You’re welcome.
Hello Sir,
I am new to this subject, I want to apply UNSUPERVISED MTL NN model for prediction on a dataset, for that I have to first apply clustering to get the target value. I want to apply some feature selection methods for the better result of clustering as well as MTL NN methods, which are the feature selection methods I can apply on my numerical dataset.
The above tutorial explains exactly, perhaps re-read it?
So we train the final ML model on the features selected in the feature selection process??
We fit_transform() xtrain, so do we need to transform() xtest beforr evaluation???
Yes, you can call fit_transform to select the features then fit a model.
Ideally, you would use feature selection within a modeling Pipeline.
So what I can ask after this knowledgeable post.
I have dataset in which
I am having more than 80 features in which one feature is categorical( IP address)(will convert it to numeric using get_dummies))) and all other are numerical. The response variable is 1(Good) and -1(Bad)
What i am going to do is remove constant variable using variance threshold in sklearn. then remove correleated features using corr() function.
After doing all this want to apply kbest with Pearson Correlation Coefficient and fisher to get a set of ten good performing features.
So am I doing it in right way??
And Can I use pearson in case of my dataset, as my dataset having both categorical ( which will be converted to numeric using get_dummies) and numeric features. And my response variable is 1 and -1
If the target is a label, then the problem is classification and Pearson’s correlation is inappropriate.
Hi Jason,
Thanks a lot for the article.
I have both numerical and categorical features. Should I normalize/scale numerical features before doing filter methods or wrapper methods?
Perhaps try it and see if it makes a difference with your choice of data and model.
Hi Jason, can you kindly provide the reference (paper/book) of the Figure flow chart 3: How to Choose Feature Selection Methods For Machine Learning, which I can use for my thesis paper citation? That would be great.
You can cite this web page directly. This will help:
https://machinelearningmastery.com/faq/single-faq/how-do-i-reference-or-cite-a-book-or-blog-post
Good article.
My data has thousand features. Out of which 10 percent features are categorical and the rest features are continuous. The output is a categorical.
Will RFE take both categorical and continuous input
For feature selection. If yes can I add a cutoff value for selecting features ?
Yes, it supports both feature types:
https://machinelearningmastery.com/rfe-feature-selection-in-python/
Yes, you can specify the number of features to select.
Thank’s for the link and response
You’re welcome.
Hi,
Great article.
I have features based on time.
What is the best methods to run feature selection over time series data?
Thanks!
ACF and PACF for lag inputs:
https://machinelearningmastery.com/gentle-introduction-autocorrelation-partial-autocorrelation/
Is it appropriate or useful to use a Chi-squared test with (a) numeric input and numeric output; (b) categorical input and numeric output? I also understood from the article that you gave the most common and most suited tests for these cases but not an absolute list of tests for each case. Am I correct?
It can be done, but my understanding is that it is intended for categorical inputs and a categorical output variable:
https://machinelearningmastery.com/chi-squared-test-for-machine-learning/
Hi, Great article! I have a question regarding how RFE rank their feature importances beforehand, as far I understood its based on how high the absolute of coef is (for linear regression), correct me me if i’m wrong because sometimes when I manually rank feature’s coef after fitting linear regression, it doesn’t match with RFE.ranking_
Thanks!
Good question, you can learn more about RFE here:
https://machinelearningmastery.com/rfe-feature-selection-in-python/
Thanks for the informative article Jason.
I understand that this post is concentrating on supervised methods – ie we are considering the dtypes for each distinct pairing of input variable and the target output variable that we wish to predict and then select the appropriate statistical method(s) to evaluate the relationship based on the input/output variable dtype combinations, as listed in your article.
I wish to better understand what you call unsupervised ie removing redundant variables (eg to prevent multicollinearity issues).
If I am not thinking about the problem in terms of input variable and output variable, but rather I just want to know how any 2 variables in my dataset are related then I know that first I need to check if the scatterplot for the 2 variables shows a linear or monotonic relation.
I think the logic is then, if the 2 attributes show a linear relationship then use Pearson correlation to evaluate the relationship between the 2 attributes. If the 2 attributes show a monotonic relationship (but not linear) then use a rank correlation method eg Spearman, Kendall.
My question is, how does the dtype of each attribute in the attribute pair factor in in this non input/output variable context? Is the “How to Choose Feature Selection Methods For Machine Learning” decision tree only applicable in an input/output variable context, or do the combinations of dtypes also factor in to the situation that I describe?
For example, I want to know if attribute 1 & 2 in my dataset are correlated with one and other. Neither attribute is an output variable, ie I am not trying to make a predicition. If attribute 1 is a categorical attribute and attribute 2 is a numerical attribute then I should use one of ANOVA or Kendal as per your decision tree? Or is this decision tree not applicable for my situation?
A lot of the online examples I see just seem to use Pearson correlation to represent the bivariate relationship, but I know from reading your articles that this is often inappropriate. I’m really struggling to understand the rules for each distinct situation, including which assumptions can be ignored in real world contexts and which can’t, so that I know which type of correlation is appropriate to use in which situation.
If you could provide any clarity or pointers to a topic for me to research further myself then that would be hugely helpful, thank you
Removing low variance or highly correlated inputs is a different step, prior to feature selection described above.
The same types of correlation measure can be used, although I would personally stick to pearson/spearmans for numerical and chi squared for categorical. E.g. type with type, not across type. Keep it very simple.
Hi, Why did you say Kendhall and not Kruskal-Wallis for non-parametric instead of ANOVA?
By the way, your articles are my bible! Really thanks in advance
Thanks!
Kendall’s is commonly used for non-parametric estimation of correlation (rank correlation).
Kruskal-Wallis is commonly used for non-parametric comparison of sample means
Hi!! as we know to make a more robust model we try to check it by doing cross-validation, So while doing cross-validation in each fold suppose I get different results, how should I proceed?
By different results I mean we get different useful feature each time in the fold.
Yes, the cross-validation procedure evaluates your modeling pipeline.
It is not about what specific features are chosen for each run, it is about how does the pipeline perform on average.
Once you have an estimate of performance, you can proceed to use it on your data and select those features that will be part of your final model.
Does that help?
Hi, thanks for the article!
For input numerical, output categorical:
Interestingly the references are not straight forward, and they almost don’t intersect (apart from ROC).
1) Feature Engineering and Selection, 2019: http://www.feat.engineering/greedy-simple-filters.html#
->It doesn’t comment about Kendall, only about Anova F-Test (slightly)
->t-test and ROC are mentioned as options, but not in this article
2) Applied Predictive Modeling, 2013. Chapter 18
->Anova is mentioned once, pg. 467 (slightly) -> but not in the categorical chapter (18.2)
->Chi2 in feature selection, not found
-> ROC mentioned, but not in this article
Would it be possible to explain why Kendall, for example or even ANOVA are not given as options?
Many thanks!
Sure, there’s lots of approaches that can be used.
You can use any correlation technique you like, I have listed the ones that are easy to access in Python for common use cases.
Thank you, and I really appreciate you mentioning good academic references. It definitely makes your articles outstand if compared to the vastly majority of other articles, which are basically applying methods in already developed Python packages and referencing it to the package documentation itself or non-academic websites.
Thanks!
Hi Jason,
Thank you for your precious article. Can you please explain to me if it’s reasonable to use feature selection approaches like “Pearson’s correlation coefficient” or “Spearman’s rank coefficient” to select the best subset of data for a Deep Neural Network, Random Forest or adaptive neuro-fuzzy inference system (ANFIS)?
Thanks,
Masoud
It depends on the specific data and model.
I recommend testing a suite of techniques and discover what works best for your specific project.
Thank you for your comment.
You’re welcome.
Thank you for the post. I would like to know that when you do the scoring, you get the number of features. But how do you know which features they are? Sometimes machine makes mistake and we have to use logic to see if it makes sense or not.
You’re welcome.
Good question, this tutorial shows you how to list the selected features:
https://machinelearningmastery.com/feature-selection-with-numerical-input-data/
Great article. Just one comment, spearman correlation is not really nonlinear right? it describes the monotonicity of the relationship. If there is non-linear relationship of order greater than 1 then Spearman correlation might even read as 0.
It is nonparametric.
Thanks Jason for the article..
I just realized spearman correlation test is for the numeric variables and doesn’t support categorical variables.
Is there any NON-PARAMETRIC test for the categorical variables?
I don’t think “nonlinear” makes sense for discrete probability distributions.
Thanks Jason for the clarification.
Yes, the data is categorical and its discrete probability distribution.
Does it mean that there is an underlying hypothesis/assumption that non-parametric approaches means assuming non-linear relationship?
Sorry, to ask questions. But I really like your articles and the way you give an overview and hence developed a lot on interest in your articles.
No, it’s just that the concept of “linear” or “nonlinear” is not valid for discrete distributions.
Great Article Jason!!
Just a few questions, please-
1)Is it better to do SelectKBest & mutual_info_classif, before dummification of categorical variables or post dummification?
2) If the relationship is non-linear would Chi-square and the other measure you described in the article, gives zero, because it failed to identify the linear relationship? Or are there any measures which would account to even the non-linear relationship between the input and output?
Perhaps experiment before and after and see what works best for your dataset (e.g. results in the best performing models).
No, not zero, but perhaps a misleading score.
Refer to an interesting article on Feature selection here.
https://www.analyticsvidhya.com/blog/2020/10/a-comprehensive-guide-to-feature-selection-using-wrapper-methods-in-python/
Thanks for sharing. That site is COVERED in ads. Yuck!
Loved the article!!!
But I have a doubt!
suppose we select 10 best features using univariate analysis(pearson correlation and SelectKBest).
But What will we do, if the selected features are strongly correlated.?
for example, if there are two features with strong positive correlation, then should we remove or not remove one of them? How will we decide which to remove and which to keep?
Thanks!
Some models are not bothered by correlated features.
Also, compare results to other feature selection methods, like RFE.
Hi Jason Brownlee thanks for the nice article. i am v new in ML. i want to work in unsupervised ML or DL.
I have data of human navigation and want to work on step detection. i want to extract features as many as possible from the data. Could you guide me that how i can do it with your algorithm. Looking for the kind response. Thanks
Perhaps start here:
https://machinelearningmastery.com/start-here/#dataprep
Hi
It is not clear for me how to proceed in case of a mix of categorical and numerical fetaures.
One approach is to select numerical and categorical features separately and combine the results.
Another approach is to use a wrapper methods like RFE to select all features at once.
https://machinelearningmastery.com/rfe-feature-selection-in-python/
Hi Jason, Thanks again for these precious tutorials.
When using the f_regression(), I check the score for each feature (given by the attribute scores_), does it represent the strength of the pearson’s correlation ?
Thanks in advance.
Juste a complement to my last question:
Because I read somewhere that the pearson’s coefficient that’s usually between -1 and 1 is converted to F-score .
Not quite (if I recall correctly), but you can interpret as a relative importance score so variables can be compared to each other.
Thanks Jason.
You’re welcome.
Thanks Jason, I refer to this article often. For an ensemble of models (not just a random forest, say a random forest + logistic reg + Naive bayes), would you try separate supervised feature selection for each model, with the result being different inputs for each model? Thanks!
Thanks.
Yes, I tried that, you can see an example here:
https://machinelearningmastery.com/feature-selection-subspace-ensemble-in-python/
Hello Jason,
Thank you for this great article. I would like to ask you about a problem I have been dealing with recently. I am working with a data that has become high dimentional data (116 input) as a result of one hot encoding. In this data, all input variables are categorical except one variable . The output variable is also categorical. What feature selection technique would you recommend for this kind of problem?
Thanks!
Perhaps try RFE on the integer encoded inputs as a first step:
https://machinelearningmastery.com/rfe-feature-selection-in-python/
Hi Jason,
thanks for this post.
I am running through a binary classification problem in which I used a Logistic Regression with L1 penalty for feature selection stage.
Now after this I have plotted the correlation matrix (pearson as my ifeature are all numerical) between the features and I still see quite a bit of multicollinearity off-diagonal.
So my question is: can this be acceptable or the multicollinearity (high correlation between features) is such a strong assumption that maybe I should use another approach for feature selection?
Many thanks
Luigi
Not sure Pearson’s correlation coefficient is appropriate when the target is binary.
Removing colinear inputs can improve the performance of linear models like logistic regression, it’s a good idea.
Hello Jason,
What should i do if i have both numerical and categorical data as input?
Can i test the numerical and categorical variables separately and merge the best variables from both tests?
Great question!
You can select from each type separately and aggregate the results. It’s not perfect, but a starting point.
Alternately, you can use an approach like RFE:
https://machinelearningmastery.com/rfe-feature-selection-in-python/
Thank you.
Doing a filter method test on mixed type data should be avoided then. Right?
I would not go that far. I would say it is a challenge and must be handled carefully.
Hi Jason,
my dataset has about 340 numerical features and there are lots of correlations between them. Of course I can calculate the correlation matrix using Pearson’s or Spearman’s correlation.
But then, what are strategies for feature selection based on that?
Thanks
Frank
Remove the features with the largest sum correlation across all pairs.
Or just trial different feature selection methods / algorithms that perform auto feature selection and discover what works best empirically for your dataset. I strongly recommend the approach for fast and useful outcomes.
Thanks, I’ll try using the sum of correlations (sum of absolute values, I guess).
If there was a group of features which were all highly correlated with each other, those features would get a high sum of correlations and would all get removed. But I should keep at least one of them.
I’m somehow thinking about clustering the features based on their correlation for a while now. Has this been done before? Whould it be possible to do that with sklearn?
Yes. There is probably a standard algorithm for the approach, I recommend checking the literature. I don’t have a tutorial on the topic.
No this approach is not available in sklearn. Instead, sklearn provide statistical correlation as a feature importance metric that can then be used for filter-based feature selection. A very successful approach.
Is there any feature selection method that can deal with missing data? I tried a few things with sklearn, but it was always complaining about NaN. If I drop all the rows that have no missing values then there is little left to work with. I’m hoping that I need to this step only after the feature selection.
There may be. Generally, it is a good idea to address the missing data first.
Hi Jason, Thanks so much for these precious tutorials.
I have a graph features and also targets. But my first impression was the similar features values do not provide the same value target. Do you think I should try to extract another graph features that can use in order to find a high correlation with the output and what happen if even I can find a high correlation? The variance of the target values confusing me to know what exactly to do.
Thanks in advance for any advice.
You’re welcome.
Perhaps try it and compare results.
Hi Jason,
What approach do you suggest for categorical nominal values , like nationwide zip codes?
Using one hot encoding results in too many dimensions for RFE to perform well
RFE as a starting point, perhaps with ordinal encoding and scaling, depending on the type of model.
Hi Jason,
This is a wonderful article. I wonder if there are 15 features, but only 10 of them are learned from the training set. What happens to the rest 5 features? Will them be considered as noise in the test set?
Xin
Thanks!
There there are features not related to the target variable, they should probably be removed from the dataset.
Hello Jason
First, as usual wonderful article!
I have unsupervised problem that I didn’t know from where to start….
I have about 80 different features , that compound 10 different sub models.
I want to build 8 different sub model (each of them with his own behavior) , each of them compound from ~10 parameters .
So, my problem is not a dimension reduction problem , but features splitting problem that will divided my features into subset
May you give me any hint
Thanks
Not sure I follow sorry.
Perhaps you can prototype a few approaches in order to learn more about what works/what is appropriate for your problem.
I will try to explain by an example…
I receive mixed features of several sub-systems.
When I select the features manually, I succeed to split them into subsets that each subset describes correctly the specific sub-system that they belong to and Unsuperviesd model is very accurate (the disadvantage in this method it’s takes a lot of time).
I am looking for a method/algorithm that automatically will group together paramters that belong to the specific subsystem.
I hope my explanation was clear enough.
Thanks,
Still not sure I follow, sorry.
Perhaps you can pre-define the groups using clustering and develop a classification model to map features to groups?
Hi Jason,
What a great piece of work! It is just amazing how well everything is explained here! Thank you so much for putting it all together for everyone who is interested in ML.
Mutalib
Thanks!
Hello Jason, regarding feature selection, I was wondering if I could have your idea on the following: I have a large data set with many features (70). By doing preprocessing (removing features with too many missing values and those that are not correlated with the binary target variable) I have arrived at 15 features. I am now using a decision tree to perform classification with respect to these 15 features and the binary target variable so I can obtain feature importance. Then, I would choose features with high importance to use as an input for my clustering algorithm. Does using feature importance in this context make any sense?
It only makes sense if the procedure results in better results than other procedures you try.
Dear sir , I have used backward feature selection technique and wrapper method and Infogain with the Ranker search method in weka simulation tool and find the common features of these techniques for our machine learning model, is it good way to find features ?? please reply
Good features are those that result in a model with good performance.
Evaluate a model with the selected features to find out.
Hello Jason, It’s a great post !. I have a dataset with numeric, categorical and text features. can i apply any technique other than running model over them to find if the text feature is a significant identifier ?. Thanks in advance
Thanks!
You can prepare/select each type of data separately, or use RFE to select all variables together.
Hi. I am doing a machine learning project to predict and classify Gender-Based violence cases. My dataset has both binary values, numeric values and categorical data. which feature selection algorithm should I use. The dataset doesn’t have a target variable.
Perhaps try RFE:
https://machinelearningmastery.com/rfe-feature-selection-in-python/
hi,
I have an unsupervised dataset (ie no target variable) and os i gonna perform clustering
What is the best way to perform feature selection?
Maybay pca or df.corr() will be good techniques?
Perhaps start by choosing a clustering metric, then choose features that result in the best performing of your chosen metric using your chosen clustering algorithm.
Do you have any tutorial about this?
Sorry I do not. This might help:
https://machinelearningmastery.com/faq/single-faq/how-do-i-evaluate-a-clustering-algorithm
Hi, I have a dataset and i want to find out the most significant feature out of my dataset. I used SelectKBest with f_regression to evaluate the most significant feature. Also i used RFE using linear Regression and found out the same most significant feature. However when I used RFE using Gradient Boosting Method I observed that the most signifcant feature obtained is different than the linear method. Could you advise how to interpret this result ? how can I decide which feature is the most significant one in such a case?
just for reference:
Adjusted R squared value in case of linear regression is : 0.816
Adjusted R squared value in case of Gradient Boosting regressor is : 0.890
Thanks in advance.
To get an idea of significant features, perhaps you can use feature importance instead.
Thanks Jason for the clarification. This means since i can get the features importance for Gradient Boosting Model, so i can consider the most significant feature based on the higher value in features importance!
Yes.
Dear Jason, always thankful for your precise explanations and answers to the questions. God bless you!
You’re welcome!
CORRECTION:
just for reference:
Adjusted R squared value in case of linear regression is : 0.710
Adjusted R squared value in case of Gradient Boosting regressor is : 0.890
Hi Jason, Thanks for the writing! I have a question. Can I use both correlation and pca together ? For example , I want to drop highly correlated features first through correlation technique and for remaining features I want to use PCA (two components).
You’re welcome.
Yes, but no need, one or the other is preferred. PCA will do all the work.
Great brother,
good stuff,
can you share a blog on which method is best suitable for which for different datasets.
We cannot know what algorithm is best for each dataset, instead, we must run experiments in order to discover what works well/best given the time and resources we have available.
What is means by Features Coefficient ?
Not sure what you mean.
Perhaps you mean coefficients from a linear model for each feature, used in feature selection or feature importance.
thanks, in the correlation method, I want to know what features are selected? (name of features)
Perhaps this will help:
https://machinelearningmastery.com/how-to-connect-model-input-data-with-predictions-for-machine-learning/
Can you give an example on Spearman’s correlation coefficient application in feature selection for a regression problem with time series?
Thanks for the suggestion.
Hi Jason, I had a question. The StandardScaler (Python) scales the data such that it has zero mean and unit variance.
Can I still use the KBest Feature Selection method (with f_classif function which is based on the f-statistic) after scaling the data using StandardScaler?
I’m a bit confused as f-statistic is based on the variance values.
Perhaps try it and see if it improves model performance or not.
I just realised, unit variance does not mean the variance is 1 haha. My question is answered, thank you!
Unit variance does mean a variance of 1. But it is a statistical term, it does not suggest that variance is 1 or has a limit at 1.
What if we have both numeric and categorical variables? Did we have to change the categorical into the numerical before doing feature selection?
Perhaps you can use a method like RFE:
https://machinelearningmastery.com/rfe-feature-selection-in-python/
Thanks Jason for the reply.
Suppose XGBoost classifer returned the feature importance for my 5 dummy variables of IP address. The feature importance is given as below.
IP_1 -.50
IP_1-.40
IP_1-.30
IP_1- .20
IP_1-.10
So what is the feature importance of the IP address feature.
2) Can I use the feature importance returned by XGBoost classifer to perform Recursive Feature elimination and evaluation of kNN classifer manually with a for loop. KNN classifer donot have feature importance capability. So can I use the features sorted with the feature importance returned by XGBoost to evaluate the accuracy of kNN classifer. If the accuracy drops significantly while eliminating the feature, I will keep the feature, Other wise I will drop it.
I will not use RFE class for this, but will perform it in for loop for each feature taken from the sorted(asc) feature importance.
In short, tree classifier like DT,RF, XGBoost gives feature importance. Can I use the feature importance of these classifiers to evaluate the accuracy of SVM(polynomial kernel which dont have feature importance) and kNN classifier.
Thankyou.
I don’t think it is valid to combine or transfer importance scores. Perhaps you can pick a representation for your column that does not use dummy varaibles.
No, you cannot use feature importance with RFE. You could use an XGBoost model with RFE.
How can I combine/fuse two different feature selection approaches, for example, filter and wrapper, to improve existing method?
See this example:
https://machinelearningmastery.com/feature-selection-subspace-ensemble-in-python/
Hi,
I have two questions:
1) When should I use feature selection and when should I use feature extraction (e.g. Dimensionality reduction)?
2) In case of feature selection: if I have a set of features including numerical and categorical features, and a multi-class categorical target:
a) which feature selection should I consider and why?
b) should I encode the target into numerical values before or after feature selection?
Thank you so much.
Use the method that gives the best results for a specific dataset and model.
You can use RFE that supports different feature types or select different feature types separaetly.
Hi Jason, thanks for the post!
There’s a problem bothering me. I was trying to find the importance of features to select those more valuable features and my models are supervised regression models. I used the ‘Convert to supervised learning’ before training which is helpful. However, I got confused about at what time to do the feature selection, before or after the process of ‘Convert to supervised learning’?
PS:(I was trying to predict the hourly PM2.5 concentrations, and I had some features such as meteorological variables. Can you give me some advice about some methods, I will try them all. )
Thank you very much!
If your data is time series, you may need specialized methods for feature selection. Sorry, I don’t have tutorials on the topic.
If you’re trying to select which lag variables to use, perhaps an ACF or PACF plot is a good start.
Thank for replying! I had already chosen my lag time using ACF and PACF. The problem is when I tried to do the feature importance, I found that other features (e.g. meteorological variable) are almost useless compared to the target variable (PM2.5), and I tried to train the model only with the target variable and it turns out to perform best.
However, the consequence is unacceptable if we consider the relationship of the features. So, where does the confusing outcome originate from?
I learned that a CNN layer may be able to reduce the dimension and extract the importance of features, do you have any tutorials about this?
Thanks again!
If the goal is the best model performance and adding some features results in worse performance, the answer is pretty clear – don’t add those features.
Hi Jason,
Thanks so much for a great post. I have always wondered how best to select which is the best feature selection technique and this post just clarified that. I read in one of your response that this post only covers univariate data. I have two questions:
1) Is there any post of yours that you can suggest for feature selection with multivariate data?
2) Will this be applicable when one is working with classifying rare events data?
I would appreciate this. Thanks so much, YOU ARE SAVING LIVES !!!!!!!!!
All feature selection methods are designed for multivariate data, e.g. choosing a subset of input features.
Perhaps test a suite of methods and discover what works well for your specific dataset and model.
Hi Jason,
Thank you so much for an AWESOME post. It was very helpful. You mentioned in one of your response that this methods are applicable to univariate data. I
was wondering if you could point me in the right direction to one of your post that considers when we have a multivariate dataset.
Also, would this feature selection techniques apply to when one is working with a dataset with Rare Events where more 50% of the input variables contains zero values which makes up about 85% per column . I specifically worked on dataset from an IOT device. Please, your input would be highly appreciated.
Again Thanks for your posts, I have learnt so much from them.
They are for multivariate data.
What about using variance inflation fraction(vif) for model selection
May be. Variance inflation factor is to see how much did collinearity created variance. That might tell you if one feature is orthogonal to all other. But not if two or more features combined can provide enough coverage. This part should be more important in feature selection.
Dear Jason. Please allow me to ask,
Namely, I have 100 feature (column) of frequency band that recorded in 12 simultaneous recording site (rows, index1), from one person at a several times/around 30 times (rows, index2). Then we do it again for other different person.
For input feature of supervised regression machine learning (SVR) algorithm, I would like to select the several important feature (out of 100 feature) from single electrode (out-of-12 recording sites) using statistical feature selection, correlation method, as described by Hall et al.
https://www.lri.fr/~pierres/donn�es/save/these/articles/lpr-queue/hall99correlationbased.pdf
I understand how to do statistical feature selection in general using correlation coefficient. https://machinelearningmastery.com/feature-selection-with-real-and-categorical-data/
What I would like to do is selecting best feature from best recording sites given there are several features and several recording sites at the same time.
How can I solve this?
My Idea is
A. first, convert the 100 of feature column from separate 12 electrode into 1200 feature pandas column of each frequency-electrode pairs, then perform Correlation Feature Selection (CFS) as usual to get the most important feature and most important electrode at the same time
B. first, perform Correlation Feature Selection of 100 feature column from all pooled-in electrode data. After that select the single electrode of choice based on highest Spearman coefficient.
C ??
I believe this kind of question appear in other areas as well, and there is common solution. Probably like: selecting smoke detector feature from most correlated detector among several other implanted at the same sites, selecting several vibration feature from most correlated seismograph sensor among several sensor implanted at the same area, selecting eeg feature and eeg channel that most correlated with given task.
Ensemble learning may solve the problem by incorporating all sensors, but feature selection will simplify a lot.
Thank you for your support!!
I think B makes more sense if you can tell that feature 1 from site 1 is measuring the same thing as feature 1 from site 2, etc. This is trying to extract which feature you measured is more important. The other way is to consider all 100 features (regardless of site) and apply PCA to do dimensionality reduction. This way, you didn’t select features but you transformed the features into fewer number.
I think B makes more sense if you can tell that feature 1 from site 1 is measuring the same thing as feature 1 from site 2, etc.
Yes Sir, that is actually my intention. Thank you for the encouragement!!
You’re welcomed.
Dear jason
When we want to use feature selection method, and we use kfold cross validation with e.g 5 iteration, in each iteration number of features that leads to best performance are diffrent, how finally i can tell wich number of features leads to best performance?
For accuracy, we will average the results for all iterations, but what should i do with number of features?
Best regards
Cross validation is to give a score to a model. In this feature selection case, you have different subset of input but same output, so you build a few different models, each using a different subset of input. Then you run CV to compare the different models and find which one doing the best job to predict the output.
CV is to give a score to your model. That could mean the number of features, selection of hyperparameters, or even selection of different models. CV needs folds because we want to measure the model not once but many times and take the average for better confidence. So if you are not sure how many features you need for your model, you can do the same in comparing your different options.
Hi Jason,
for Pearson’s Correlation Coefficient: you referenced f_regression(). Shouldn’t it be r_regression()?
Cheers,
Benjamin
No. That’s correct. Please read the explanation here: https://scikit-learn.org/stable/modules/generated/sklearn.feature_selection.f_regression.html
what if the number of features are mixture of numerical and categorical columns ,
Same. You just don’t need to convert the numerical columns.
Hi Jason!
I have a scenario. I have input features say A_1,A_2,A_3,B_1,B_2,B_3,B_4,C_1,C_1 and output is Y.
How do I find out which group of features are important??
Generally we find it feature wise and I get result as A_1,B_2,….
But how to find which group is important? Like:
A,B,C
Hi Chandan…Please provide a more direct question regarding our code listings or other content so that we may better assist you.
Hi jason,
If we use k_fold cross validation, and then use one of feature selection methods, and e.g we have 5 itteration
Then, how can we know wich features of each itteration are best features overally?
I mean we can calculate Mean accuracy for all itterations but how can know wich features, at all are good for classification
Best regards
Hi Shervin…The following may be of interest to you:
https://machinelearningmastery.com/feature-selection-for-regression-data/
Nice article, thanks for sharing the informative post.
https://www.igmguru.com/data-science-bi/power-bi-certification-training/
Thank you for the feedback.
Hi Jason,
Thanks for your nice blog!
I have a question,how to implement feature selection for vector/set features?
For example, output is whether user will click an article, i.e. label = 0/1.
Inputs are:
1. article tag list: tag1, tag2, tag3, tag4
2. user clicked article tag list: tag1, tag2, tag3, …
The inputs are lists (sets) of categorical (or numerical) features.
Do you have any suggestions on this kind of features? Thanks!
Hi Simon…If you are considering regression, the following should add clarity.
https://machinelearningmastery.com/feature-selection-for-regression-data/
hi,why you didnt split data into train and test and then applying feature selection?
Hi Robert…the following will hopefully add clarity regarding the process:
https://stackoverflow.com/questions/56308116/should-feature-selection-be-done-before-train-test-split-or-after#:~:text=The%20conventional%20answer%20is%20to,%2C%20from%20the%20Test%2DSet.
Hi, Jason
Please, how could I do the feature selection in the case: “Categorical Input, Numerical Output”? I am obtaining error appling “Numerical Input, Categorical Output in reverse”.
Thanks for your interesenting blog!! I love it.
Hi Jessica…Can you post your exact error message so that I may better assist you?
Hi,
I want to ask question. What we want o predict while building prediction models?
Hi Liya…The following may help clarify:
https://towardsdatascience.com/classification-regression-and-prediction-whats-the-difference-5423d9efe4ec
Hi Sir,
Unsupervised learning methods for feature selection?
Can I use LDA for “Categorical Input, Numerical Output”?
LDA: Linear discriminant analysis is used to find a linear combination of features that characterizes or separates two or more classes (or levels) of a categorical variable.
Hi Alex…You may find the following of interest:
https://machinelearningmastery.com/linear-discriminant-analysis-for-machine-learning/
Hi, Thank you for the great article.
I would like to understand some issues as I am new to machine learning. I have a dataset with numerical inputs and categorical output(the Target feature is Graduate, Dropout, and Enrolled) I first encoded it with Label encoder, then used Pearson correlation for feature selection, and also used ExtraTreesClassifier for feature importance.
1. are the steps wrong?
2. I also attempted the Anova(SelectKBest) for feature selection but I am a bit confused about what the (n_samples, n_features, and n_informative)are.
According to the sample, you dropped its (n_samples=100, n_features=20, n_informative=2) is this a rule of thumb or??
Hi Joy…I see no issues with your steps. The ANOVA parameters were selected as a example and are were not intended to be the optimal selection.
Hi Jason,
I am dealing with a binary classification problem. I am having 53 participants. For each participant, there are 344850 features. So, my feature matrix size is 53×344850. With this, I have used an SVM classifier with 5-fold cross-validation and I got 73% accuracy.
Now, I am using a supervised feature selection algorithm.
In the first approach, I applied 53×344850 to feature selection and selected 10% best features. This means, that now I have a 53×34485 feature matrix. This matrix, I have used for 5-fold cross-validation and got 96% accuracy.
In the second approach, as I need to 5-fold cross-validation so I have done splitting. After, splitting suppose for the first case I have 43×344850 in training and 10×344850 in testing. I have applied feature selection on only the training set so now I have 43×34485 and selected the same index of features from the test set so I have 10×34485(but didn’t apply feature selection on the test set). Now, I have trained SVM classifier with the training set and tested using the test set. Accuracy, in this case, is only 70%.
Can you suggest to me which approach is right? Or do you have any other suggestions than are most welcome?
Hi Shankar…the following may be of interest:
https://neptune.ai/blog/the-ultimate-guide-to-evaluation-and-selection-of-models-in-machine-learning
https://machinelearningmastery.com/evaluate-performance-deep-learning-models-keras/
Hi,
Thanks for the reply. But, still unable to get an answer from your suggested links.
Hi Jason,
I am facing a regression problem and I have a lot of categorical non-ordinal features. Following your guide I have tried to use ANOVA test that should give me a score on how much each categotical feature influences my continous numerical target.
I have tried this test to check whether the order of my encoding is important.
1. First encode the categorical feature using the LabelEncoder. Call this feature feature1_encoded
2. Swap two random label given by the encoder and map these values to feature1_encoded. Call this feature feature1_encoded_mod
3. Perform the ANOVA test using sklearn.preprocessing.LabelEncoder using as X the two features created previosuly and as y the target numerical variable.
4. It gives me two different score. I was expecting that the results was the same thanks to non-ordinality of the test.
Thank you for your precious guides!
Hi Luigi…Please clarify your question so that we may better assist you.
Hi J,
Thanks for the great article! I am also new into data science and I want to know if the problem I a facing can be solved using a ML model (specifically ANOVA to discriminate). I have a dataset with cathegorical data: FUN or non-FUNC for a set of variants. For each variant I made measurement with 6 different programs obtaining a numerical value. The data has a normal distribution for each population (FUNC and non-FUNC). I want to know which of the 6 programs is better classifier of variants, for that I am performing logistic regression model and ROC curve.
I know my question maye be quite open, but I would like to know if this is the most suitable way to discriminate to know this issue, or I am going through an incorrect path?
Thank you very much!
Hi Jason,
If the dataset contains both numerical and categorical values and the categorical values are label encoded.
1.Though these are label encoded still these are considered to be categorical right?
2.How to select feature selection method in this case?
Hi veda…The following may be of interest to you:
https://inria.github.io/scikit-learn-mooc/python_scripts/03_categorical_pipeline_column_transformer.html
Hi Jason:
You have an excellent web site with advanced topics in ML. However, in the Automatic Feature Selection section, you are missing out on some of the easier tools that do feature selection without having to set the number of features you want to select (which is difficult to do) as well as whether to use forward or backward selection. There is a new python library called featurewiz which avoids both these difficulties. It is fast, effective and easy to use (working just like an scikit-learn estimator). Hence it can be used with the fit and transform methods of sklearn.
I believe your page on feature selection could use an explanation of this featurewiz library.
https://github.com/AutoViML/featurewiz
Thanks for your consideration,
Ram
Thank you very much for uploading your very useful content! I just want to report a possible typo in the section with the name “Classification Feature Selection: (Numerical Input, Categorical Output)” where it says “A test regression problem is prepared using the make_classification() function.” I guess that it was supposed to say “a test classification problem is prepared…” Thank you again for your effort!
Thank you Elias! We appreciate the support and feedback on our content!
Hi James,
I have a doubt, can we use ‘mutual_info_regression’ for numerical and categorical inputs and numerical outputs?
Similarly, can we use ‘mutual_info_classif’ for numerical and categorical inputs and categorical outputs?
If not, what could be better option.
Hi Kavya…Your understanding is correct! Please move forward with your idea and let us know what you find.
Hello James,
What is the steps for ML? Let me clarify you. I am folowing this steps sequently this steps: Deal with Outliers, Impute missing Values, Label Encode/One Hot encode categorical values, Apply Dimensionality Reduction, Apply Feature Selection. That is correct?
Also, if we conveerted all matematical results to numerical values by using encding methods, that is categorical input to numerical output. i could not clearly understand. Thank for your effort. This artical help to improve myself.
Hi Batuhan…Your understanding is correct! I would also recommend that you investigat the use of machine learning pipelines:
https://www.analyticsvidhya.com/blog/2022/01/a-guide-to-understand-machine-learning-pipeline-with-case-study/
https://www.kaggle.com/code/pouryaayria/a-complete-ml-pipeline-tutorial-acu-86
That is very good explanation about feature selection.
Thanks a lot.
My question is related to whether it makes sense or not if we use feature selection methods (supervised or unsupervised) on principal components to select the best components, and then using those components in classification algorithm, like SVM, DT, LR…
To be honest, to me, it seems a bit confusing. When I use fisher score, the data learns from y (class labels 0-1). Then, when we fit those data to the classification model, then we use that class labels again. I am not sure how it makes sense. Do you have any suggestion?
I want to validate my model at the end.
Hi Tayfun…You may find the following resources helpful:
https://machinelearningmastery.com/feature-selection-with-optimization/
https://machinelearningmastery.com/feature-selection-for-regression-data/
https://machinelearningmastery.com/rfe-feature-selection-in-python/
Thanks for additional links and replying.
Still confused about whether it makes sense to choose principal components with any types of feature selection methods and using these selected datasets for classification purposes, for example SVM.
There are hundreds of feature selection methods. Also, the question, how can we be sure which method is proper for our task?..
Hi, what is the time complexity of each feature selection technique from filter and wrapper?
Hi Moa…The time complexity of feature selection techniques varies based on whether they are filter methods or wrapper methods. Here’s a detailed look at the time complexities for common techniques within each category:
### Filter Methods
Filter methods are typically faster as they evaluate the relevance of features using statistical measures, independent of any learning algorithm.
1. **Variance Threshold**
– **Time Complexity:** \(O(n \cdot m)\)
– **Explanation:** Each feature’s variance is computed, where \(n\) is the number of samples and \(m\) is the number of features.
2. **Correlation Coefficient**
– **Time Complexity:** \(O(n \cdot m)\)
– **Explanation:** The correlation between each feature and the target variable is computed.
3. **Chi-Square Test**
– **Time Complexity:** \(O(n \cdot m)\)
– **Explanation:** The chi-square statistic is computed for each feature with respect to the target variable.
4. **ANOVA F-test**
– **Time Complexity:** \(O(n \cdot m)\)
– **Explanation:** An F-test is conducted for each feature to assess its relationship with the target variable.
5. **Mutual Information**
– **Time Complexity:** \(O(n \cdot m \cdot k)\)
– **Explanation:** Mutual information between each feature and the target variable is computed, where \(k\) is the number of distinct values in the feature (for categorical features).
### Wrapper Methods
Wrapper methods are typically more computationally expensive as they involve training a model multiple times with different subsets of features.
1. **Forward Selection**
– **Time Complexity:** \(O(m^2 \cdot T)\)
– **Explanation:** Each step involves evaluating \(m – k\) features (where \(k\) is the number of selected features), resulting in a quadratic complexity with respect to the number of features. \(T\) is the time complexity of the model training.
2. **Backward Elimination**
– **Time Complexity:** \(O(m^2 \cdot T)\)
– **Explanation:** Similar to forward selection, but starts with all features and removes one at each step, leading to a similar quadratic complexity with respect to the number of features. \(T\) is the time complexity of the model training.
3. **Recursive Feature Elimination (RFE)**
– **Time Complexity:** \(O(m^2 \cdot T)\)
– **Explanation:** RFE recursively removes the least important feature based on the model’s performance, leading to a quadratic complexity with respect to the number of features. \(T\) is the time complexity of the model training.
4. **Genetic Algorithms**
– **Time Complexity:** \(O(g \cdot p \cdot T)\)
– **Explanation:** Where \(g\) is the number of generations and \(p\) is the population size. Each individual in the population represents a subset of features, and \(T\) is the time complexity of the model training for evaluating each subset.
### Summary
– **Filter Methods:** Generally \(O(n \cdot m)\), linear with respect to the number of samples and features.
– **Wrapper Methods:** Generally \(O(m^2 \cdot T)\), quadratic with respect to the number of features due to multiple model trainings.
These complexities provide a general guide, but actual performance may vary based on implementation details and specific dataset characteristics.
Can I use the Kruskal-Wallis Test instead of Kendall test?