Logistic regression is a classification algorithm traditionally limited to only two-class classification problems.
If you have more than two classes then Linear Discriminant Analysis is the preferred linear classification technique.
In this post you will discover the Linear Discriminant Analysis (LDA) algorithm for classification predictive modeling problems. After reading this post you will know:
- The limitations of logistic regression and the need for linear discriminant analysis.
- The representation of the model that is learned from data and can be saved to file.
- How the model is estimated from your data.
- How to make predictions from a learned LDA model.
- How to prepare your data to get the most from the LDA model.
This post is intended for developers interested in applied machine learning, how the models work and how to use them well. As such no background in statistics or linear algebra is required, although it does help if you know about the mean and variance of a distribution.
LDA is a simple model in both preparation and application. There is some interesting statistics behind how the model is setup and how the prediction equation is derived, but is not covered in this post.
Kick-start your project with my new book Master Machine Learning Algorithms, including step-by-step tutorials and the Excel Spreadsheet files for all examples.
Let’s get started.

Linear Discriminant Analysis for Machine Learning
Photo by Jamie McCaffrey, some rights reserved.
Limitations of Logistic Regression
Logistic regression is a simple and powerful linear classification algorithm. It also has limitations that suggest at the need for alternate linear classification algorithms.
- Two-Class Problems. Logistic regression is intended for two-class or binary classification problems. It can be extended for multi-class classification, but is rarely used for this purpose.
- Unstable With Well Separated Classes. Logistic regression can become unstable when the classes are well separated.
- Unstable With Few Examples. Logistic regression can become unstable when there are few examples from which to estimate the parameters.
Linear Discriminant Analysis does address each of these points and is the go-to linear method for multi-class classification problems. Even with binary-classification problems, it is a good idea to try both logistic regression and linear discriminant analysis.
Representation of LDA Models
The representation of LDA is straight forward.
It consists of statistical properties of your data, calculated for each class. For a single input variable (x) this is the mean and the variance of the variable for each class. For multiple variables, this is the same properties calculated over the multivariate Gaussian, namely the means and the covariance matrix.
These statistical properties are estimated from your data and plug into the LDA equation to make predictions. These are the model values that you would save to file for your model.
Let’s look at how these parameters are estimated.
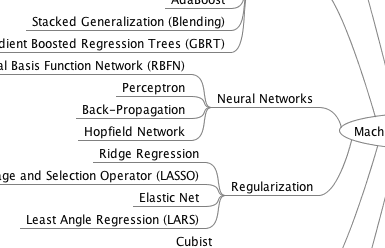
Get your FREE Algorithms Mind Map

Sample of the handy machine learning algorithms mind map.
I've created a handy mind map of 60+ algorithms organized by type.
Download it, print it and use it.
Also get exclusive access to the machine learning algorithms email mini-course.
Learning LDA Models
LDA makes some simplifying assumptions about your data:
- That your data is Gaussian, that each variable is is shaped like a bell curve when plotted.
- That each attribute has the same variance, that values of each variable vary around the mean by the same amount on average.
With these assumptions, the LDA model estimates the mean and variance from your data for each class. It is easy to think about this in the univariate (single input variable) case with two classes.
The mean (mu) value of each input (x) for each class (k) can be estimated in the normal way by dividing the sum of values by the total number of values.
muk = 1/nk * sum(x)
Where muk is the mean value of x for the class k, nk is the number of instances with class k. The variance is calculated across all classes as the average squared difference of each value from the mean.
sigma^2 = 1 / (n-K) * sum((x – mu)^2)
Where sigma^2 is the variance across all inputs (x), n is the number of instances, K is the number of classes and mu is the mean for input x.
Making Predictions with LDA
LDA makes predictions by estimating the probability that a new set of inputs belongs to each class. The class that gets the highest probability is the output class and a prediction is made.
The model uses Bayes Theorem to estimate the probabilities. Briefly Bayes’ Theorem can be used to estimate the probability of the output class (k) given the input (x) using the probability of each class and the probability of the data belonging to each class:
P(Y=x|X=x) = (PIk * fk(x)) / sum(PIl * fl(x))
Where PIk refers to the base probability of each class (k) observed in your training data (e.g. 0.5 for a 50-50 split in a two class problem). In Bayes’ Theorem this is called the prior probability.
PIk = nk/n
The f(x) above is the estimated probability of x belonging to the class. A Gaussian distribution function is used for f(x). Plugging the Gaussian into the above equation and simplifying we end up with the equation below. This is called a discriminate function and the class is calculated as having the largest value will be the output classification (y):
Dk(x) = x * (muk/siga^2) – (muk^2/(2*sigma^2)) + ln(PIk)
Dk(x) is the discriminate function for class k given input x, the muk, sigma^2 and PIk are all estimated from your data.
How to Prepare Data for LDA
This section lists some suggestions you may consider when preparing your data for use with LDA.
- Classification Problems. This might go without saying, but LDA is intended for classification problems where the output variable is categorical. LDA supports both binary and multi-class classification.
- Gaussian Distribution. The standard implementation of the model assumes a Gaussian distribution of the input variables. Consider reviewing the univariate distributions of each attribute and using transforms to make them more Gaussian-looking (e.g. log and root for exponential distributions and Box-Cox for skewed distributions).
- Remove Outliers. Consider removing outliers from your data. These can skew the basic statistics used to separate classes in LDA such the mean and the standard deviation.
- Same Variance. LDA assumes that each input variable has the same variance. It is almost always a good idea to standardize your data before using LDA so that it has a mean of 0 and a standard deviation of 1.
Extensions to LDA
Linear Discriminant Analysis is a simple and effective method for classification. Because it is simple and so well understood, there are many extensions and variations to the method. Some popular extensions include:
- Quadratic Discriminant Analysis (QDA): Each class uses its own estimate of variance (or covariance when there are multiple input variables).
- Flexible Discriminant Analysis (FDA): Where non-linear combinations of inputs is used such as splines.
- Regularized Discriminant Analysis (RDA): Introduces regularization into the estimate of the variance (actually covariance), moderating the influence of different variables on LDA.
The original development was called the Linear Discriminant or Fisher’s Discriminant Analysis. The multi-class version was referred to Multiple Discriminant Analysis. These are all simply referred to as Linear Discriminant Analysis now.
Further Reading
This section provides some additional resources if you are looking to go deeper. I have to credit the book An Introduction to Statistical Learning: with Applications in R, some description and the notation in this post was taken from this text, it’s excellent.
Books
- An Introduction to Statistical Learning: with Applications in R, Chapter 4, Page 138.
- Modern Multivariate Statistical Techniques: Regression, Classification, and Manifold Learning, chapter 8
- Applied Predictive Modeling, Chapter 12, Page 287
Other
- Linear Discriminant Analysis bit by bit (examples with Python)
- Linear Discriminant Analysis Wikipedia Page (I didn’t find it that useful)
- Linear Discriminant Analysis (includes a link to an interactive LDA interface)
Summary
In this post you discovered Linear Discriminant Analysis for classification predictive modeling problems. You learned:
- The model representation for LDA and what is actually distinct about a learned model.
- How the parameters of the LDA model can be estimated from training data.
- How the model can be used to make predictions on new data.
- How to prepare your data to get the most from the method.
Do you have any questions about this post?
Leave a comment and ask, I will do my best to answer.


I’m not able to understand these equations :
P(Y=x|X=x) = (PIk * fk(x)) / sum(PIl * fl(x))
PIk = nk/n ……. I know what Baye’s theorm is but what does fk(x), PII and fl(x) represent ?
Hi Shaksham,
this is probably late but if you use the notation:
P(Y=y|X=x) = P(X=x|Y=y) * P(Y=y) / P(X=x),
you can see that fk(x) stands for P(X=x|Y=y). I think in the denominator we are just summing up the stuff across classes. The original notation seems a bit confusing to me also since in some context I’ve seen the Greek letter ‘pi’ to be used for the posterior probability itself.
Hi Jason,
I’m having hard time understanding the term n-K in the variance equation:
sigma^2 = 1 / (n-K) * sum((x – mu)^2)
Could you clarify?
Thanks!
“n is the number of instances, K is the number of classes”.
Yep, thanks, I noticed that but ‘minus K’ just didn’t seem intuitive to me. 🙂
N-k, we take out k degrees of freedom, because we have k classes (unless I am wrong)
Dear Jason,
I have 2 questions regarding the case of p predictors > 1.
1. How do we estimate mu for each K class when we have more than one predictor?
2. How do we estimate the pxp common covariance matrix for all K groups?
Thank you very much in advance,
I hope my question is clear enough
best,
Madeleine
Great question. I’d recommend a good textbook, perhaps start with: An Introduction to Statistical Learning.
Hi Jason,
Can you please refer me some stuff from where I can learn flexible and regularized discriminant analysis?
Best,
Aniket
Perhaps a good textbook?
https://sebastianraschka.com/Articles/2014_python_lda.html
He is talking about different use of LDA.
Jason do you want to comment ?
Nice link.
Hello sir , I wanted to know why do we call this classification technique as “analysis” ?
It is just an old name for the method.
In fisher linear discriminant, how can we classify a new sample?
See the section titled “Making Predictions with LDA”.
Hi sure, can you tell me the different between the fisher’s discriminant analyse FDA and the linear discriminant analysis ?
Thnaks
Not off hand, sorry.
what is the value of label in linear discriminent analysis (LDA) coding shoul be taken
Sorry, I don’t follow, perhaps you can elaborate or rephrase your question?
Hi,
As written in your articles, Unstable With Well Separated Classes. Logistic regression can become unstable when the classes are well separated.
Can you please tell me what does well separated classed mean?
Linear separation refers to the ability to separate instance instances by class using a line or hyperplane in input feature space.
Thanks for your articles.
I have a little confused about using this algorithm for classification after reading your articles.
1. Based on my understanding, for classification, training data and testing data should be separated. When reducing the dimension by LDA, I should combine training data and testing data together to reduce dimension, or just reduce training data dimension, and use eigenvector W to map testing data to lower dimension?
2. For standardized you mentioned in this article, I should standardize the whole data together, or just standardized the training data, and use the same scale mapping the testing data?
Ideally, any data preparation is calculated using the training data only, then applied/used to prepare train and test data, e.g. calculating mean/stdev/etc.
Thanks for your reply,
So you mean I should just use training data to acquire eigenvector W, and mapping test data by W to reduce dimension?
And for the standardized dataset, I also should separate considering the training and test dataset.
I believe so.
Why Logistic Regression is unstable with well-separated classes?
Good question, this may help as a first step:
https://stats.stackexchange.com/questions/254124/why-does-logistic-regression-become-unstable-when-classes-are-well-separated/254205
i do have a question regarding our discriminant function calculation :-
Dk(x) = x * (muk/siga^2) – (muk^2/(2*sigma^2)) + ln(PIk)
for e.g. if i have a 2 class problem and have 5 rows / instances of data which does comprise of 4 features.
I would need to find Dk(x) with 2 classes for all 5 rows that provides me with 2 values of discriminant function for each row. For a single feature in row i can calculate discriminant but how should i proceed if i have more than 1 feature.
What value of x is passed in case of multi feature data to calculate discriminant function value across 2 classes.
Good question, perhaps reference the description in “An Introduction to Statistical Learning with Applications in R”
https://amzn.to/34Onv5J
Hello Sir, Can we use LDA when our independent variables are categorical ?
Thanks,
Sam
No, LDA assume numerical input variables.
Hi, is that correct that LDA/FDA can only generate 2 output?
No, LDA inherently multi-class.
Thanks for your reply. One more question.
How about in the context of dimensional reduction method?
Suppose I have 100 features, I want to reduce to 5 features. Is LDA/FDA only generate 2 output? (my supervisor said this)
Great question – but no difference.
I have a tutorial written and scheduled on exactly this topic due to be published in a few days. Keep an eye on the blog.
Is this the topic you mean https://machinelearningmastery.com/dimensionality-reduction-for-machine-learning/
Let me know if not correct, and any update.
(I am not good in searching a new layout)
No, I have a tutorial on LDA for dimensionality reduction scheduled for next week.
let me know when is ready, looking forward to read it.
Thanks. found it. https://machinelearningmastery.com/linear-discriminant-analysis-for-dimensionality-reduction-in-python/
Yes.
Can I know that in the context of dimensionality reduction using LDA/FDA. LDA/FDA can start with “n” dimensions and end with k dimensions, where “k” less than “n”. or The output is “c-1” where “c” is the number of classes and the dimensionality of the data is n with “n>c”.
Yes, you can use LDA for dimensionality reduction and the number of resulting dimensions can be chosen as a parameter, less than the number of classes.
Thanks. Is that correct: The output of LDA is “c-1” where “c” is the number of classes and the dimensionality of the data is n with “n > c”.
Let say my original dataset has 2 classes, the output will be 1 dimensionality ( 2 – 1 =1 ), likewise, if my original dataset has 5 classes, the output will be 4 dimensionality.
Not quite, see this:
https://scikit-learn.org/stable/modules/generated/sklearn.discriminant_analysis.LinearDiscriminantAnalysis.html
In here: https://sebastianraschka.com/Articles/2014_python_lda.html
It said: In LDA, the number of linear discriminants is at most c−1 where c is the number of class labels, since the in-between scatter matrix SB is the sum of c matrices with rank 1 or less.
I think is correct: Let say my original dataset has 2 classes, the output will be 1 dimensionality ( 2 – 1 =1 ), likewise, if my original dataset has 5 classes, the output will be 4 dimensionality.
Can we have a discussion on this? I just want to make sure I am not confused.
Hello Jason, I wanted to know what if there are multiple features in my dataset (X1, X2, X3,…) then how am I supposed to calculate the discriminate, as the discrminate function expects a single ‘X’?
You can use an existing implementation to model the multiple variates:
https://scikit-learn.org/stable/modules/generated/sklearn.discriminant_analysis.LinearDiscriminantAnalysis.html
Hi Jason, how to apply the LDA algorithm in online learning? For example, I want to be able to train the model with some initial training data and then update it with new data points
Perhaps custom code and you can incrementally re-estimate the coefficients of the model as new data comes in?
Or just refit the model each time a new block of data with known targets becomes available.
Hello,
If we have two class having same variance but different mean can LDA classify them?
Thanks
Ketan
If two classes have the same mean but different variance can LDA classify?
Hi Ketan…The following discussion of limitations and/or disadvantages that must be considered when utilizing LDA.
https://www.researchgate.net/post/What_are_the_disadvantages_of_LDA_linear_discriminant_analysis
hello dear teacher
i thanks a lot for your great lessons.
I can’t download Algorithms Mind Map, if possible please send me free pdf of ml algorithm mind map.
Hi Shima…Try this location:
https://github.com/dformoso/machine-learning-mindmap