Machine learning algorithms are a very large part of machine learning.
You have to understand how they work to make any progress in the field.
In this post you will discover a 14-part machine learning algorithms mini course that you can follow to finally understand machine learning algorithms.
We are going to cover a lot of ground in this course and you are going to have a great time.
Kick-start your project with my new book Master Machine Learning Algorithms, including step-by-step tutorials and the Excel Spreadsheet files for all examples.
Let’s get started.

Machine Learning Algorithms Mini-Course
Photo by Jared Tarbell, some rights reserved.
Who is This Course For?
Before we get started, let’s make sure you are in the right place.
- This course is for beginners curious about machine learning algorithms.
- This course does not assume you know how to write code.
- This course does not assume a background in mathematics.
- This course does not assume a background in machine learning theory.
This mini-course will take you on a guided tour of machine learning algorithms from foundations and through 10 top techniques.
We will visit each algorithm to give you a sense of how it works, but not go into too much depth to keep things moving.
Mini-Course Overview
Let’s take a look at what we’re going to cover over the next 14 lessons.
You may need to come back to this post again and again, so you may want to bookmark it.
This mini-course is broken down int four parts: Algorithm Foundations, Linear Algorithms, Nonlinear Algorithms and Ensemble Algorithms.
Algorithm Foundations
- Lesson 1: How To Talk About Data in Machine Learning
- Lesson 2: Principle That Underpins All Algorithms
- Lesson 3: Parametric and Nonparametric Algorithms
- Lesson 4: Bias, Variance and the Trade-off
Linear Algorithms
- Lesson 5: Linear Regression
- Lesson 6: Logistic Regression
- Lesson 7: Linear Discriminant Analysis
Nonlinear Algorithms
- Lesson 8: Classification and Regression Trees
- Lesson 9: Naive Bayes
- Lesson 10: k-Nearest Neighbors
- Lesson 11: Learning Vector Quantization
- Lesson 12: Support Vector Machines
Ensemble Algorithms
- Lesson 13: Bagging and Random Forest
- Lesson 14: Boosting and AdaBoost
Get your FREE Algorithms Mind Map
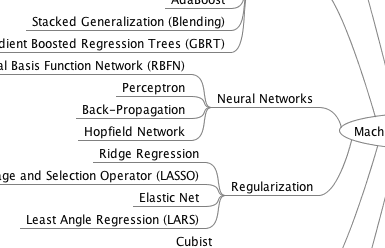
Sample of the handy machine learning algorithms mind map.
I've created a handy mind map of 60+ algorithms organized by type.
Download it, print it and use it.
Also get exclusive access to the machine learning algorithms email mini-course.
Lesson 1: How To Talk About Data in Machine Learning
Data plays a big part in machine learning.
It is important to understand and use the right terminology when talking about data.
How do you think about data? Think of a spreadsheet. You have columns, rows, and cells.
The statistical perspective of machine learning frames data in the context of a hypothetical function (f) that the machine learning algorithm aims to learn. Given some input variables (Input) the function answer the question as to what is the predicted output variable (Output).
Output = f(Input)
The inputs and outputs can be referred to as variables or vectors.
The computer science perspective uses a row of data to describe an entity (like a person) or an observation about an entity. As such, the columns for a row are often referred to as attributes of the observation and the rows themselves are called instances.
Lesson 2: The Principle That Underpins All Algorithms
There is a common principle that underlies all supervised machine learning algorithms for predictive modeling.
Machine learning algorithms are described as learning a target function (f) that best maps input variables (X) to an output variable (Y).
Y = f(X)
This is a general learning task where we would like to make predictions in the future (Y) given new examples of input variables (X). We don’t know what the function (f) looks like or it’s form. If we did, we would use it directly and we would not need to learn it from data using machine learning algorithms.
The most common type of machine learning is to learn the mapping Y = f(X) to make predictions of Y for new X. This is called predictive modeling or predictive analytics and our goal is to make the most accurate predictions possible.
Lesson 3: Parametric and Nonparametric Algorithms
What is a parametric machine learning algorithm and how is it different from a nonparametric machine learning algorithm?
Assumptions can greatly simplify the learning process, but can also limit what can be learned. Algorithms that simplify the function to a known form are called parametric machine learning algorithms.
The algorithms involve two steps:
- Select a form for the function.
- Learn the coefficients for the function from the training data.
Some examples of parametric machine learning algorithms are Linear Regression and Logistic Regression.
Algorithms that do not make strong assumptions about the form of the mapping function are called nonparametric machine learning algorithms. By not making assumptions, they are free to learn any functional form from the training data.
Non-parametric methods are often more flexible, achieve better accuracy but require a lot more data and training time.
Examples of nonparametric algorithms include Support Vector Machines, Neural Networks and Decision Trees.
Lesson 4: Bias, Variance and the Trade-off
Machine learning algorithms can best be understood through the lens of the bias-variance trade-off.
Bias are the simplifying assumptions made by a model to make the target function easier to learn.
Generally parametric algorithms have a high bias making them fast to learn and easier to understand but generally less flexible. In turn they have lower predictive performance on complex problems that fail to meet the simplifying assumptions of the algorithms bias.
Decision trees are an example of a low bias algorithm, whereas linear regression is an example of a high-bias algorithm.
Variance is the amount that the estimate of the target function will change if different training data was used. The target function is estimated from the training data by a machine learning algorithm, so we should expect the algorithm to have some variance, not zero variance.
The k-Nearest Neighbors algorithm is an example of a high-variance algorithm, whereas Linear Discriminant Analysis is an example of a low variance algorithm.
The goal of any predictive modeling machine learning algorithm is to achieve low bias and low variance. In turn the algorithm should achieve good prediction performance. The parameterization of machine learning algorithms is often a battle to balance out bias and variance.
- Increasing the bias will decrease the variance.
- Increasing the variance will decrease the bias.
Lesson 5: Linear Regression Algorithm
Linear regression is perhaps one of the most well known and well understood algorithms in statistics and machine learning.
Isn’t it a technique from statistics?
Predictive modeling is primarily concerned with minimizing the error of a model or making the most accurate predictions possible, at the expense of explainability. We will borrow, reuse and steal algorithms from many different fields, including statistics and use them towards these ends.
The representation of linear regression is a equation that describes a line that best fits the relationship between the input variables (x) and the output variables (y), by finding specific weightings for the input variables called coefficients (B).
For example:
y = B0 + B1 * x
We will predict y given the input x and the goal of the linear regression learning algorithm is to find the values for the coefficients B0 and B1.
Different techniques can be used to learn the linear regression model from data, such as a linear algebra solution for ordinary least squares and gradient descent optimization.
Linear regression has been around for more than 200 years and has been extensively studied. Some good rules of thumb when using this technique are to remove variables that are very similar (correlated) and to remove noise from your data, if possible.
It is a fast and simple technique and good first algorithm to try.
Lesson 6: Logistic Regression Algorithm
Logistic regression is another technique borrowed by machine learning from the field of statistics. It is the go-to method for binary classification problems (problems with two class values).
Logistic regression is like linear regression in that the goal is to find the values for the coefficients that weight each input variable.
Unlike linear regression, the prediction for the output is transformed using a non-linear function called the logistic function.
The logistic function looks like a big S and will transform any value into the range 0 to 1. This is useful because we can apply a rule to the output of the logistic function to snap values to 0 and 1 (e.g. IF less than 0.5 then output 1) and predict a class value.
Because of the way that the model is learned, the predictions made by logistic regression can also be used as the probability of a given data instance belonging to class 0 or class 1. This can be useful on problems where you need to give more rationale for a prediction.
Like linear regression, logistic regression does work better when you remove attributes that are unrelated to the output variable as well as attributes that are very similar (correlated) to each other.
It’s a fast model to learn and effective on binary classification problems.
Lesson 7: Linear Discriminant Analysis Algorithm
Logistic regression is a classification algorithm traditionally limited to only two-class classification problems. If you have more than two classes then the Linear Discriminant Analysis algorithm is the preferred linear classification technique.
The representation of LDA is pretty straight forward. It consists of statistical properties of your data, calculated for each class. For a single input variable this includes:
- The mean value for each class.
- The variance calculated across all classes.
Predictions are made by calculating a discriminate value for each class and making a prediction for the class with the largest value.
The technique assumes that the data has a Gaussian distribution (bell curve), so it is a good idea to remove outliers from your data before hand.
It’s a simple and powerful method for classification predictive modeling problems.
Lesson 8: Classification and Regression Trees
Decision Trees are an important type of algorithm for predictive modeling machine learning.
The representation for the decision tree model is a binary tree. This is your binary tree from algorithms and data structures, nothing too fancy. Each node represents a single input variable (x) and a split point on that variable (assuming the variable is numeric).
The leaf nodes of the tree contain an output variable (y) which is used to make a prediction. Predictions are made by walking the splits of the tree until arriving at a leaf node and output the class value at that leaf node.
Trees are fast to learn and very fast for making predictions. They are also often accurate for a broad range of problems and do not require any special preparation for your data.
Decision trees have a high variance and can yield more accurate predictions when used in an ensemble, a topic we will cover in Lesson 13 and Lesson 14.
Lesson 9: Naive Bayes Algorithm
Naive Bayes is a simple but surprisingly powerful algorithm for predictive modeling.
The model is comprised of two types of probabilities that can be calculated directly from your training data:
- The probability of each class.
- The conditional probability for each class given each x value.
Once calculated, the probability model can be used to make predictions for new data using Bayes Theorem.
When your data is real-valued it is common to assume a Gaussian distribution (bell curve) so that you can easily estimate these probabilities.
Naive Bayes is called naive because it assumes that each input variable is independent. This is a strong assumption and unrealistic for real data, nevertheless, the technique is very effective on a large range of complex problems.
Lesson 10: K-Nearest Neighbors Algorithm
The KNN algorithm is very simple and very effective.
The model representation for KNN is the entire training dataset. Simple right?
Predictions are made for a new data point by searching through the entire training set for the K most similar instances (the neighbors) and summarizing the output variable for those K instances. For regression this might be the mean output variable, in classification this might be the mode (or most common) class value.
The trick is in how to determine similarity between the data instances. The simplest technique if your attributes are all of the same scale (all in inches for example) is to use the Euclidean distance, a number you can calculate directly based on the differences between each input variable.
KNN can require a lot of memory or space to store all of the data, but only performs a calculation (or learn) when a prediction is needed, just in time. You can also update and curate your training instances over time to keep predictions accurate.
The idea of distance or closeness can break down in very high dimensions (lots of input variables) which can negatively effect the performance of the algorithm on your problem. This is called the curse of dimensionality. It suggests you only use those input variables that are most relevant to predicting the output variable.
Lesson 11: Learning Vector Quantization
A downside of K-Nearest Neighbors is that you need to hang on to your entire training dataset.
The Learning Vector Quantization algorithm (or LVQ for short) is an artificial neural network algorithm that allows you to choose how many training instances to hang onto and learns exactly what those instances should look like.
The representation for LVQ is a collection of codebook vectors. These are selected randomly in the beginning and adapted to best summarize the training dataset over a number of iterations of the learning algorithm.
After learned, the codebook vectors can be used to make predictions just like K-Nearest Neighbors. The most similar neighbor (best matching codebook vector) is found by calculating the distance between each codebook vector and the new data instance. The class value or (real value in the case of regression) for the best matching unit is then returned as the prediction.
Best results are achieved if you rescale your data to have the same range, such as between 0 and 1.
If you discover that KNN gives good results on your dataset try using LVQ to reduce the memory requirements of storing the entire training dataset.
Lesson 12: Support Vector Machines
Support Vector Machines are perhaps one of the most popular and talked about machine learning algorithms.
A hyperplane is a line that splits the input variable space. In SVM, a hyperplane is selected to best separate the points in the input variable space by their class, either class 0 or class 1.
In two-dimensions you can visualize this as a line and let’s assume that all of our input points can be completely separated by this line.
The SVM learning algorithm finds the coefficients that results in the best separation of the classes by the hyperplane.
The distance between the hyperplane and the closest data points is referred to as the margin. The best or optimal hyperplane that can separate the two classes is the line that as the largest margin.
Only these points are relevant in defining the hyperplane and in the construction of the classifier.
These points are called the support vectors. They support or define the hyperplane.
In practice, an optimization algorithm is used to find the values for the coefficients that maximizes the margin.
SVM might be one of the most powerful out-of-the-box classifiers and worth trying on your dataset.
Lesson 13: Bagging and Random Forest
Random Forest is one of the most popular and most powerful machine learning algorithms. It is a type of ensemble machine learning algorithm called Bootstrap Aggregation or bagging.
The bootstrap is a powerful statistical method for estimating a quantity from a data sample. Such as a mean. You take lots of samples of your data, calculate the mean, then average all of your mean values to give you a better estimation of the true mean value.
In bagging, the same approach is used, but instead for estimating entire statistical models, most commonly decision trees.
Multiple samples of your training data are taken then models are constructed for each data sample. When you need to make a prediction for new data, each model makes a prediction and the predictions are averaged to give a better estimate of the true output value.
Random forest is a tweak on this approach where decision trees are created so that rather than selecting optimal split points, suboptimal splits are made by introducing randomness.
The models created for each sample of the data are therefore more different than they otherwise would be, but still accurate in their unique and different ways. Combining their predictions results in a better estimate of the true underlying output value.
If you get good good results with an algorithm with high variance (like decision trees), you can often get better results by bagging that algorithm.
Lesson 14: Boosting and AdaBoost
Boosting is an ensemble technique that attempts to create a strong classifier from a number of weak classifiers.
This is done by building a model from the training data, then creating a second model that attempts to correct the errors from the first model. Models are added until the training set is predicted perfectly or a maximum number of models are added.
AdaBoost was the first really successful boosting algorithm developed for binary classification. It is the best starting point for understanding boosting. Modern boosting methods build on AdaBoost, most notably stochastic gradient boosting machines.
AdaBoost is used with short decision trees. After the first tree is created, the performance of the tree on each training instance is used to weight how much attention the next tree that is created should pay attention to each training instance. Training data that is hard to predict is given more more weight, whereas easy to predict instances are given less weight.
Models are created sequentially one after the other, each updating the weights on the training instances that affect the learning performed by the next tree in the sequence.
After all the trees are built, predictions are made for new data, and the performance of each tree is weighted by how accurate it was on the training data.
Because so much attention is put on correcting mistakes by the algorithm it is important that you have clean data with outliers removed.
Mini-Course Review
You made it. Well done! Take a moment and look back at how far you have come:
- You discovered how to talk about data in machine learning and about the underlying principles of all predictive modeling algorithms.
- You discovered the difference between parametric and nonparametric algorithms and the difference between error introduced by bias and variance.
- You discovered three linear machine learning algorithms: Linear Regression, Logistic Regression and Linear Discriminant Analysis.
- You were introduced to 5 nonlinear algorithms: Classification and Regression Trees, Naive Bayes, K-Nearest Neighbors, Learning Vector Quantization and Support Vector Machines.
- Finally, you discovered two of the most popular ensemble algorithms: Bagging with Decision Trees and Boosting with AdaBoost.
Don’t make light of this, you have come a long way in a short amount of time. This is just the beginning of your journey with machine learning algorithms. Keep practicing and developing your skills.
Did you enjoy this mini-course?
Do you have any questions or sticking points?
Leave a comment and let me know.
Discover How Machine Learning Algorithms Work!
See How Algorithms Work in Minutes
...with just arithmetic and simple examples
Discover how in my new Ebook:
Master Machine Learning Algorithms
It covers explanations and examples of 10 top algorithms, like:
Linear Regression, k-Nearest Neighbors, Support Vector Machines and much more...
Finally, Pull Back the Curtain on
Machine Learning Algorithms
Skip the Academics. Just Results.
")


I really like this.
Thanks.
hi, i have performed multi variable linear regression on a data set .. I got RMSE in 2000 range ,without any transformations.. .. but when I performed log transformation, i got RMSE as 0.4…. Is that fine??? can I present my results??
I recommend inverting any transforms on the predictions and expected values before estimating model performance.
Thank you for awesome work you do sir. i really like your website.
You’re very welcome!
I always enjoy reading your blogs. Thanks for your time and efforts
I’m glad you found it useful Krishna.
Thank you for the post Jason.
I am wondering whether you meant variance instead of bias here:
“The k-Nearest Neighbors algorithm is an example of a high-bias algorithm, whereas Linear Discriminant Analysis is an example of a low bias algorithm.”
You are right. I’ve fixed up the description.
Thank you for awesome work, it is very useful for us.
I’m glad you find the material useful itodayer.
Thank you sir
I want some data from you. about feature extraction, feature selection, feature normalisation and different classification algorithms ( compare with SIFT for feature extraction , SVM based feature selection and LASSO for classification) on different gender recognition datasets( FERET,FGNet,LFW and ORL). I will start research on objects ( human gender, animals, roads and vehicle ) classification. Please give me your suggestion this research problem is good and any novality.
This is a common question that I answer here:
https://machinelearningmastery.com/faq/single-faq/what-research-topic-should-i-work-on
What conclusion will we get based on bias and variance and standard deviation? How to think on this case? What should we think on this to get conclusion?
I wish this blog the first thing I read about Machine Learning. Your explanation, simple language, and brief information all what needed for beginners !!! Many many thanks.
Thanks Manal, it’s great to have you here.
This is great! Thanks Jason!
I’m glad you found it useful aarish.
Excellent starting point for algorithms! Thanks for the entry point!
Thanks Jeremy, I’m glad to hear that.
Hello Jason,
Can you please explain the differences between Generative Modelling and descriptive Modeling?
A generative model can generate new instances that have the statistical properties of other instances in the corpus.
A descriptive model can help you learn something about the domain from the data.
A predictive model can help estimate an outcome.
This was a useful introduction for me. I had first tried starting with the information on Weka, but I didn’t really understand why I would choose one of the prepackaged algorithms or why. This was a better place for me to start.
Thanks for having all this information available.
I’m glad it helps Mike.
Really nice mini course really helps out the people with a little knowledge about Machine Learning.
Thanks, I’m glad it was useful.
Thanks Jason! Your blog is one of the first I look up in when I have ML doubts. You are doing a great job! Thanks again.
Thanks.
Hi Jason. Your site is very educative, many thanks.
Please tell me if my understanding or interpretation is correct.
“Section : Principle that underlies all machine learning algorithms”
Because the goal of an algorithm is to learn about the target function (f), prediction is only important because it suggests that we have learnt more. Particularly when our predictions agree with actuals.
Do you agree?
I’m not sure I follow, can you elaborate?
Hi Jason. This is ALI, Your site is highly educative and useful.
Can you please tell me which is the best and efficient machine learning algorithm that to classify APT Malware that targets payment systems in the banking sector. Any sample implementation code in python would be highly appreciated. Looking forward to hearing from you soon.
Regards.
Thanks.
It is unknowable. You must use experimentation to discover what algorithm works best on your specific dataset:
https://machinelearningmastery.com/faq/single-faq/what-algorithm-config-should-i-use
Very nice introduction.Go ahead.
Thanks!
What are the advance machine learning algorithms are available to use method level refactoring ?
No idea, sorry.
real appreciate,
thank you
You’re welcome.
so the model is saved in a header type file after training ?
Models are saved in a binary file.
this is awesome!!! thank you
Thanks!
Thank you Jason for sharing lessons. This is pretty much the same syllabus that I am going through in Class. I have implemented the Naive Bayes classifier using log probability in python. I can share my GitHub link for review and feedback
Well done!
Sorry, I don’t have the capacity to review your code.
Thank you for your work, Jason
Your work is really great
You’re welcome!
Hello sir, I enjoyed this very much.
Thanks!
I’m excited to learn more about ML. Thanks
You’re welcome.
what is the main difference between traditional regression analysis and ML?
Perspective.
See this:
https://machinelearningmastery.com/faq/single-faq/how-are-statistics-and-machine-learning-related
These course motivated to learn more about ML, Ireally like this web.Thanks
Thanks, I’m happy to hear that!
Thank you for this article. It gives a brief intro on all the algorithms.
I have a question on data sets.
Can you please explain when a data set is termed as high dimensional data set?
When there are more rows or more columns?
You’re welcome.
It is subjective, I think 100 or more is a lot of features. Some say 10 or more, some say 1,000,000 or more. It depends on what you’re used to.
Hi Jason,
Thank you for all your ML posts, they are very helpful! Especially the 14 days mini course, I really like it. I start to enjoy learning ML because of your posts and course.
I would like to ask three questions:
1. I am using caret R package to conduct ML. Which categories you would put for Nearest Shrunken Centroids (method = “pam”) according to your classification based on algorithm similarity? Should it be “instance based”?
2. How about XGBoost? which category would you put according to your classification based on algorithm similarity?
3. When I am exploring different ML methods, would you suggest that I should pick 1-2 methods for each category of algorithms according to your classification to explore for my ML project?
Thank you and I look forward to hearing from you.
Good questions.
Yes, the nearest shrunk centroids is an instance-based method.
XGboost is an ensemble of decision trees.
Yes, that sounds like a great approach.
This course is awesome. You are great in explaining the concepts in simple words.
Needs to know of the opportunity to builds skills for hand’s on experience and real life project.
Thanks!
This will help you build experience:
https://machinelearningmastery.com/start-here/#getstarted
Hi Jason,
You mentioned in your post that logistic regression algorithm is suitable for binary classification problem. I wonder what ML methods are good for multiple group classification? Thank you!
LDA is a good linear method to start with for mutli-class classification.
Does this 14 steps mini course include coding or process of building a model on small data set apart from this theory?
Not this mini-course, perhaps start here instead:
https://machinelearningmastery.com/start-here/#python
How we can check whether our multiple regression and logistic regression model is good or not.
This is a common question that I answer here:
https://machinelearningmastery.com/faq/single-faq/how-to-know-if-a-model-has-good-performance
Hi Jason,
Thank you for your mini-course, especially the part “bagging and random forest”, I feel I start to understand random forest:-) Two confusions:
1. You mentioned bootstrap, I wonder what is the exact differences between bootstrap and permutation test? Does it matter with sampling with replacement?
2. You mentioned that bagging is the same approach like bootstrap, but most commonly applied on decision trees. I wonder does it mean that “bagging” is usually the term that we use for random forest, but we usually don’t use “bootstrap”, although they mean the same?
Thank you very much in advance!
You’re welcome.
The main difference is that random forest will sample the features when selecting each split point in the decision tree. Bagging won’t.
Hi Jason,
Thanks for this mini-course. Very helpful in clarifying this very complex subject.
I have looked at the ebooks and was wondering if you offered anything on multi-input multi-output regression models. I have picked a dataset (production flow) for a project and am suitably confused at this stage !
Regards
Danny
Yes, you can start right here:
https://machinelearningmastery.com/start-here/#deep_learning_time_series
Thank you for giving your best to the community. I read the first course as sent to my email, very explanatory and informative.
Thanks!
Information was very informative.
Thanks!
In your experience which is the best linear regression model where you want to fit a straight line through data points which show some linear pattern but have lots of scatter? The simple linear regression model gives high RMSE.
I recommend testing a suite of different linear regression algorithms to see which results in the lowest error on your dataset.
Can we use logistic regression for continuous output type.. or it can be only used with discrete outputs ?
No. Classification only to predict class membership probability (binomial distribution).
Thanks so much and we are looking forward of to see a practical course after the first mini job
Thanks.
Thank you for answering the basics of machine learning.
You’re welcome.
Hi Jason
in your #2 lesson, you stated that : …We don’t know what the function (f) looks like or its form. If we did, we would use it directly and we would not need to learn it from data using machine learning algorithms.
So this is very different with usual statistic, that we have to choose first, which function that we want to work with and then find out the significance later.
and that is why we need to use/try more than one algorithms?
but how to tell which algorithm is the most appropriate one? more accurate?
thanks
Correct. We test many methods and “discover” what works best.
Hi jason
I have run multiple linear regression on 2 variables one is a linear combination of 4 columns with varying coefficients and another is a polynomial function with same inputs. How do I determine which is linear and which is polynomial?
Sorry, I don’t follow your question, perhaps you can rephrase it?
Thanks for sharing the knowledge. Keep the good work going.
You’re welcome.
hello Jason, regarding the Decision Tree, when we use randomForest do we still need to do bootstrapping? and model validation? Also in randomForest, we get only the results not the tree?
Yes. Random forest uses the bootstrap to fit each tree.
Once you choose a model, you can fit it on all available data and use it to start making predictions.
can you please provide an example in R with dummy data set.
You can get started with machine learning in R here:
https://machinelearningmastery.com/start-here/#r
Why haven’t you included SVMs in your algorithm mind map? Don’t they belong in the clustering group?
It would go under instance based methods.
Hi ! Do you have any material about cross entropy ? I am a student of chemical engineering … Unfortunately I am not very clear on this concept.
Thank you so much for your work, it helps a lot of people!
Yes here:
https://machinelearningmastery.com/cross-entropy-for-machine-learning/
Thank you so much ! 🙂
You’re welcome.
in lesson two on predictive analysis. you mentioned this equations, Y = f(X). Is this a general form of machine learning approach? Are there other forms?
Yes, it is the general form for a predictive model.
I do not know my self in this fiel but in my opinion how I see understand I think all of these should be like a Grafik in cross in a cube and a tree with roots where the Grafik is with 1 + above 1-under 0+ lright 0-left the tree also inside but only the half inside and all in a ball what will grow and will learn self reaching a new level of thinking etc something 1 0 1 +
thanks for help me…..
You’re welcome.
Hello Jason sir,
I found your blogging series and books around 1 year back, and from then onwards I have read a lot of your work, it is truly amazing.
Thank you!!
Hello Jason.
Your works are really helpful.
I read many times about difference b/w statistics and ML however i am not so sure. Even lesson1 mentions on statistical perspective of ML
For Statistics we have definite formula’s and in ML we say it learns from data but for both statistics and ML, algorithms are same, like regression ?
I find formula/mathematical concept based and learning from data contradictory. One is fixed while other is dynamic. But it seems in ML we say it is statistics based and also say it learns from data. Please let me know your thoughts on this. Thanks.
Perhaps this will help:
https://machinelearningmastery.com/faq/single-faq/how-are-statistics-and-machine-learning-related
Okay. Thank you very much for the reference.
You’re welcome!
This is good but quite short. It would be loving if more detail about the lessons is given.
The book has more detail:
https://machinelearningmastery.com/master-machine-learning-algorithms/
Hello, Jason.
Thank you for sharing great lessons. I’m thinking of designing a model that predict future behavior based on the historical data. I’d like to train the data everyday with cumulated daily data points. I can’t figure out the way I can design the training data sets. My intention is train the model with past 100 days’ data and the response of 101 days, past 101 days’ data and the response of 102 days and so on. I’d like to make it continuously fit as time goes. How can I approach this?
You’re welcome!
Perhaps your problem is a time series forecasting problem, if so these tutorials will help:
https://machinelearningmastery.com/start-here/#timeseries
Thank you so much, Jason. You always have an answer!
Thanks.
Not always, I am only across a fraction of the field – but a useful fraction.
overfitting can happen and it will increase the computational time
It can result in worse performance on new data.
Thank you for giving such a useful information for beginners like me…Thanks alot
You’re welcome.
Hi Jason,
I am new to machine learning. I wanted to learn Python at the beginning but then attracted by your site.
It is said that 100% accuracy in training is overfitting. If the machine learning has all the required inputs and a consistent process to output the result, assume everything is perfect. When all new inputs meet the requirement, can we get a 100% accurate prediction?
No, see this:
https://machinelearningmastery.com/faq/single-faq/what-does-it-mean-if-i-have-0-error-or-100-accuracy
Hi,
I am Prerak Parekh from Sardar Patel Institute of Technology from Mumbai, India. I was looking for some good resources on image processing which involves classification of images based on objects. Can you provide me with some resources on the same.
Thanks and Regards,
P Parekh.
Perhaps start here:
https://machinelearningmastery.com/start-here/#dlfcv
In the bias variance trade off, which of the two (bias or variance) should be minimum. I mean which one improves algorithm performance, having lower bias or lower variance?
How to fix on how much is tolerable?
What should be the intuition while considering bias-variance trade off.
We seek good model performance generally, bias/variance is a diagnostic or way of thinking about model error. We don’t explicitly minimize bias and variance.
Can’t wait to breeze read this, I use the law off 3, to solve all my algorithms, tip pick which function will also be a consequence then add you equation done.
Thanks Jason … I enjoy how you break the information to its basic elements …
Thank you!
Very important lesson 1, when I began my journey was massive confusion on the the terms being interchanged. Very good point!
Thanks.
It’s very useful!! Thank you so so so much!!!
You’re welcome.
very useful
Thank you!
Jason, in using SVMs I always found it the most difficult to determine a non-arbitrary methodology for separation of of the classifications of 0’s & 1’s when “clumping” was involved and it was necessary break up the closely clumped differentiated groups. By setting the classifier (hyperplane) to widen the margin break up the grouping as easy enough soon the multi-dimensional space could quite soon result into a “trivial” separation of the 0’s & 1’s. So, my question is the following: have you some guidance on a methodology which is not so arbitrary that nicely provides an adequate margin in these mire challenging circumstances?
I believe what bothering you is the concept of “soft margin” in support vector classifiers. Indeed this is taken care of by the training process usually. See this SO question to know more: https://datascience.stackexchange.com/questions/45738/support-vector-machine-errors
In scikit-learn SVC function, the parameter C defaults to 1.
I have recently started and it is amazing! Thankyou!!
Hey Jason,
I am new to this line and after a long career gap i have started Data Scientist course.
My worry is this course fully based on statistics subject and i have never learnt it in my life.
my question is do I need to learn stats first and then I should have done this course?
please guide me , second thing is I am unable to understand several things, we are going to complete ML soon, should I start to participate in hackathon…. yet? I know I am not ready yet but my worry is what if I miss the opportunities….
Please seeking your guidance…..Thank you.
Try to learn by doing. You can always drill down to the theoretical subjects later when you want to learn more. To get the best result and easier to get a sense of what’s going on, try to follow this mini-course, for example. Run some code, get the result as described, then modify the code and see what happened. You can search for stat or math topics when you get a rough idea but want to learn deeper.
Thanks for your nice course. Pls give me on python
Hi Gopal…Please clarify your question regarding Python so that I may better assist you.
Machine learning is made simple the way you are presenting it. Thanks
Great feedback Seyi!!
It’s very nice
Great feedback Seyi!
Thank you for all you do for newbies like me. I appreciate it.
You’re welcomed!
Thank you janson. it’s interesting
You are very welcome Daniel!
Is recommendable to use categorical data (encoded either one hot or ordinal) with on a linear regression?
Hi Daniel…Please elaborate more on what you are wanting to accomplish with your model so that we may better assist you.
I enjoy reading your blogs. Thanks for your time and efforts
Excellent feedback Niloofar!
Hi I fail to understand boosting, if a model has weak learners wouldn’t we want to drop these from the model?
Almost seems like boosting would over for, no?
Hi JR…you may find the following of interest:
https://machinelearningmastery.com/essence-of-boosting-ensembles-for-machine-learning/
Hi Jason
Interesting highlights from different perspectives about how to talk about data in machine learning.
It is exactly like speaking in different languages for similar meaning.
Thank you for your support and feedback Mimi! It is greatly appreciated!
Hi Team, is there a well explained tutorial on multinomial logistic regression? My DV is a 4-class category variable. I have more than 6 IVs.
Hi Chinedu…Please see my email related to this topic.
Great information with Machine Learning put into basic terminology for the reader to easily understand how it works.
Great Work Jason!
Thank you Tim for your feedback and support! We greatly appreciate it.
Just finished the mini-course. I thought it might take me a week (at a pace of 2 lessons per day). I was able to finish it in one evening. This was perfect for me because I can’t program (yet), my math is rusty, but I still want to learn about machine learning. I guess I’m ready for the next step? Thanks!
Hi Bryan…Thank you for the feedback! The following location is a great starting point for your machine learning journey:
https://machinelearningmastery.com/start-here/
I was a bit confused between bias and variance. So I asked ChatGPT. I thought Chat’s response was helpful, and sharing it here in case it is helpful to others, or in case it is wrong so experts can opine.
In short, Chat said that the problem is about fit. Either underfitting or overfitting. Underfit algorithms fail to capture the underlying patterns and relationships in the data. They are high bias. They perform poorly both with training data and when predicting because the algorithm didn’t really “get” the data.
And then overfit algorithms capture the noise and random fluctuations in the data. They have high variance. So unlike underfit algorithms, they perform really well with training data. But because they got sidetracked with noise and random fluctuations they too lose sight of the true underlying pattern and so provide poor predictions when faced with new data.
So there is a U-shape curve for prediction error. As fit improves (becoming less and less underfit), error goes down, up to a certain point; after bottoming out, prediction error climbs back up as fit gets tighter (becoming more and more overfit). So the conceptual aim seems to be to find the error minimum point in the U-shape curve by balancing between underfit (bias) and overfit (variance).
That’s what I got out of ChatGPT. And off I go back to my e-book. I’m studying “Master Machine Learning Algorithms” right now. 🙂
I just loved this post J.!
Thank you for your feedback D!
Dear Jason
In your lesson 2, you state that generally we don’t know what the function looks like, if we did we would use it directly. I have a function which I understand is a truncated normal distribution (based on twenty repetitions on a samples of 2060). I don’t think that this format allows me to send you a copy of the chart or the data.
I don’t know how to use it directly: Three questions:
1) What do you use to assess the function directly?
2) If the above function is a tabular classification problem, which algorithm would you use to get the best result?
3) Would something like AutoGluon do a good job?
Regards
Aylton
Hi Aylton…The concept of a universal approximation may be of interest.
https://towardsdatascience.com/neural-networks-and-the-universal-approximation-theorem-8a389a33d30a
I like this very much But i want to know Machine learning Bainary code Details and How to make Machine learning coding and How can it’s working
Hi Saikat…I understand completely. Let us know if you have a specific problem are trying to implement in machine learning and we can guide you with recommendations.
Lesson 2: The Principle That Underpins All Algorithms
THIS LESSON IS VERY HELPFUL
i am making an ML MODEL for ECG analysis. Shall take your help for the same.
Best
Satya
Hi Satya…Thank you for your feedback! Let us know if you have any questions regarding our content.
Great and effective learning forum
Thank you Faraz for your feedback and support! Let us know if we can help answer questions you may have as you work through our mini-courses!
It is good and easy to understand
Thank you Daniel for your feedback and support!
Great summarization of ML-easy to follow and understand. Thank you for doing this, Jason!
I can’t thank you enough for the effort you’ve put into preparing this wonderful episode on machine learning.
You are very welcome Muhammad! We appreciate your support and feedback!