Cross-entropy is commonly used in machine learning as a loss function.
Cross-entropy is a measure from the field of information theory, building upon entropy and generally calculating the difference between two probability distributions. It is closely related to but is different from KL divergence that calculates the relative entropy between two probability distributions, whereas cross-entropy can be thought to calculate the total entropy between the distributions.
Cross-entropy is also related to and often confused with logistic loss, called log loss. Although the two measures are derived from a different source, when used as loss functions for classification models, both measures calculate the same quantity and can be used interchangeably.
In this tutorial, you will discover cross-entropy for machine learning.
After completing this tutorial, you will know:
How to calculate cross-entropy from scratch and using standard machine learning libraries.
Cross-entropy can be used as a loss function when optimizing classification models like logistic regression and artificial neural networks.
Cross-entropy is different from KL divergence but can be calculated using KL divergence, and is different from log loss but calculates the same quantity when used as a loss function.
Kick-start your project with my new book Probability for Machine Learning, including step-by-step tutorials and the Python source code files for all examples.
Let’s get started.
Update Oct/2019: Gave an example of cross-entropy for identical distributions and updated description for this case (thanks Ron U). Added an example of calculating the entropy of the known class labels.
Update Nov/2019: Improved structure and added more explanation of entropy. Added intuition for predicted class probabilities.
Update Dec/2020: Tweaked the introduction to information and entropy to be clearer.
A Gentle Introduction to Cross-Entropy for Machine Learning Photo by Jerome Bon, some rights reserved.
Tutorial Overview
This tutorial is divided into five parts; they are:
What Is Cross-Entropy?
Cross-Entropy Versus KL Divergence
How to Calculate Cross-Entropy
Two Discrete Probability Distributions
Calculate Cross-Entropy Between Distributions
Calculate Cross-Entropy Between a Distribution and Itself
Calculate Cross-Entropy Using KL Divergence
Cross-Entropy as a Loss Function
Calculate Entropy for Class Labels
Calculate Cross-Entropy Between Class Labels and Probabilities
Calculate Cross-Entropy Using Keras
Intuition for Cross-Entropy on Predicted Probabilities
Cross-Entropy Versus Log Loss
Log Loss is the Negative Log Likelihood
Log Loss and Cross Entropy Calculate the Same Thing
What Is Cross-Entropy?
Cross-entropy is a measure of the difference between two probability distributions for a given random variable or set of events.
You might recall that information quantifies the number of bits required to encode and transmit an event. Lower probability events have more information, higher probability events have less information.
In information theory, we like to describe the “surprise” of an event. An event is more surprising the less likely it is, meaning it contains more information.
Low Probability Event (surprising): More information.
Higher Probability Event (unsurprising): Less information.
Information h(x) can be calculated for an event x, given the probability of the event P(x) as follows:
h(x) = -log(P(x))
Entropy is the number of bits required to transmit a randomly selected event from a probability distribution. A skewed distribution has a low entropy, whereas a distribution where events have equal probability has a larger entropy.
A skewed probability distribution has less “surprise” and in turn a low entropy because likely events dominate. Balanced distribution are more surprising and turn have higher entropy because events are equally likely.
Skewed Probability Distribution (unsurprising): Low entropy.
Balanced Probability Distribution (surprising): High entropy.
Entropy H(x) can be calculated for a random variable with a set of x in X discrete states discrete states and their probability P(x) as follows:
H(X) = – sum x in X P(x) * log(P(x))
If you would like to know more about calculating information for events and entropy for distributions see this tutorial:
Cross-entropy builds upon the idea of entropy from information theory and calculates the number of bits required to represent or transmit an average event from one distribution compared to another distribution.
… the cross entropy is the average number of bits needed to encode data coming from a source with distribution p when we use model q …
The intuition for this definition comes if we consider a target or underlying probability distribution P and an approximation of the target distribution Q, then the cross-entropy of Q from P is the number of additional bits to represent an event using Q instead of P.
The cross-entropy between two probability distributions, such as Q from P, can be stated formally as:
H(P, Q)
Where H() is the cross-entropy function, P may be the target distribution and Q is the approximation of the target distribution.
Cross-entropy can be calculated using the probabilities of the events from P and Q, as follows:
H(P, Q) = – sum x in X P(x) * log(Q(x))
Where P(x) is the probability of the event x in P, Q(x) is the probability of event x in Q and log is the base-2 logarithm, meaning that the results are in bits. If the base-e or natural logarithm is used instead, the result will have the units called nats.
This calculation is for discrete probability distributions, although a similar calculation can be used for continuous probability distributions using the integral across the events instead of the sum.
The result will be a positive number measured in bits and will be equal to the entropy of the distribution if the two probability distributions are identical.
Note: this notation looks a lot like the joint probability, or more specifically, the joint entropy between P and Q. This is misleading as we are scoring the difference between probability distributions with cross-entropy. Whereas, joint entropy is a different concept that uses the same notation and instead calculates the uncertainty across two (or more) random variables.
Want to Learn Probability for Machine Learning
Take my free 7-day email crash course now (with sample code).
Click to sign-up and also get a free PDF Ebook version of the course.
Cross-Entropy Versus KL Divergence
Cross-entropy is not KL Divergence.
Cross-entropy is related to divergence measures, such as the Kullback-Leibler, or KL, Divergence that quantifies how much one distribution differs from another.
Specifically, the KL divergence measures a very similar quantity to cross-entropy. It measures the average number of extra bits required to represent a message with Q instead of P, not the total number of bits.
In other words, the KL divergence is the average number of extra bits needed to encode the data, due to the fact that we used distribution q to encode the data instead of the true distribution p.
As such, the KL divergence is often referred to as the “relative entropy.”
Cross-Entropy: Average number of total bits to represent an event from Q instead of P.
Relative Entropy (KL Divergence): Average number of extra bits to represent an event from Q instead of P.
KL divergence can be calculated as the negative sum of probability of each event in P multiples by the log of the probability of the event in Q over the probability of the event in P. Typically, log base-2 so that the result is measured in bits.
KL(P || Q) = – sum x in X P(x) * log(Q(x) / P(x))
The value within the sum is the divergence for a given event.
As such, we can calculate the cross-entropy by adding the entropy of the distribution plus the additional entropy calculated by the KL divergence. This is intuitive, given the definition of both calculations; for example:
H(P, Q) = H(P) + KL(P || Q)
Where H(P, Q) is the cross-entropy of Q from P, H(P) is the entropy of P and KL(P || Q) is the divergence of Q from P.
Entropy can be calculated for a probability distribution as the negative sum of the probability for each event multiplied by the log of the probability for the event, where log is base-2 to ensure the result is in bits.
H(P) = – sum x on X p(x) * log(p(x))
Like KL divergence, cross-entropy is not symmetrical, meaning that:
H(P, Q) != H(Q, P)
As we will see later, both cross-entropy and KL divergence calculate the same quantity when they are used as loss functions for optimizing a classification predictive model. It is under this context that you might sometimes see that cross-entropy and KL divergence are the same.
For a lot more detail on the KL Divergence, see the tutorial:
In this section we will make the calculation of cross-entropy concrete with a small example.
Two Discrete Probability Distributions
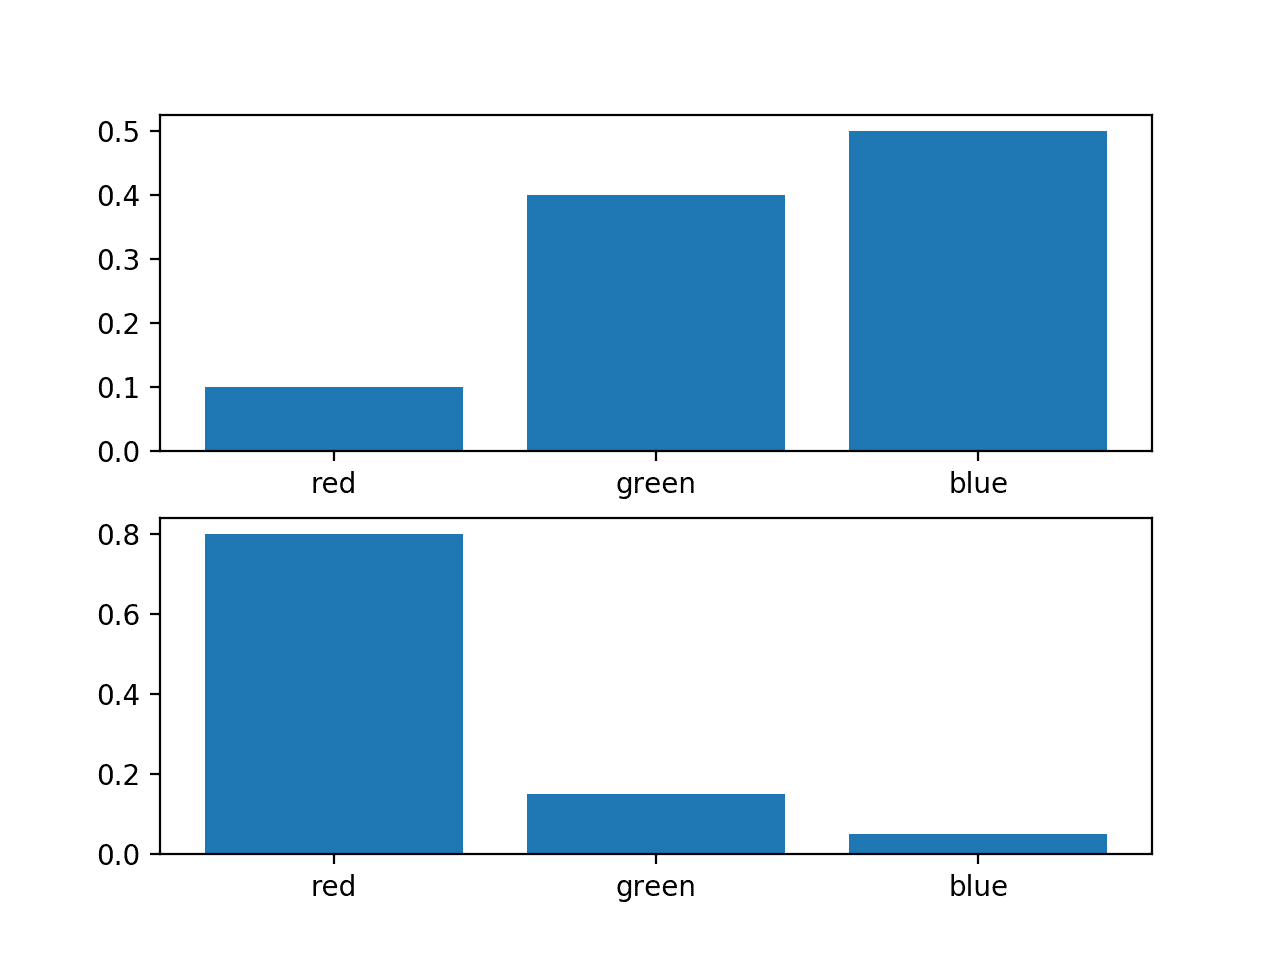
Consider a random variable with three discrete events as different colors: red, green, and blue.
We may have two different probability distributions for this variable; for example:
1
2
3
4
5
...
# define distributions
events=['red','green','blue']
p=[0.10,0.40,0.50]
q=[0.80,0.15,0.05]
We can plot a bar chart of these probabilities to compare them directly as probability histograms.
The complete example is listed below.
1
2
3
4
5
6
7
8
9
10
11
12
13
14
15
# plot of distributions
from matplotlib import pyplot
# define distributions
events=['red','green','blue']
p=[0.10,0.40,0.50]
q=[0.80,0.15,0.05]
print('P=%.3f Q=%.3f'%(sum(p),sum(q)))
# plot first distribution
pyplot.subplot(2,1,1)
pyplot.bar(events,p)
# plot second distribution
pyplot.subplot(2,1,2)
pyplot.bar(events,q)
# show the plot
pyplot.show()
Running the example creates a histogram for each probability distribution, allowing the probabilities for each event to be directly compared.
We can see that indeed the distributions are different.
Histogram of Two Different Probability Distributions for the Same Random Variable
Calculate Cross-Entropy Between Distributions
Next, we can develop a function to calculate the cross-entropy between the two distributions.
We will use log base-2 to ensure the result has units in bits.
1
2
3
# calculate cross entropy
def cross_entropy(p,q):
return-sum([p[i]*log2(q[i])foriinrange(len(p))])
We can then use this function to calculate the cross-entropy of P from Q, as well as the reverse, Q from P.
1
2
3
4
5
6
7
...
# calculate cross entropy H(P, Q)
ce_pq=cross_entropy(p,q)
print('H(P, Q): %.3f bits'%ce_pq)
# calculate cross entropy H(Q, P)
ce_qp=cross_entropy(q,p)
print('H(Q, P): %.3f bits'%ce_qp)
Tying this all together, the complete example is listed below.
1
2
3
4
5
6
7
8
9
10
11
12
13
14
15
16
# example of calculating cross entropy
from math import log2
# calculate cross entropy
def cross_entropy(p,q):
return-sum([p[i]*log2(q[i])foriinrange(len(p))])
# define data
p=[0.10,0.40,0.50]
q=[0.80,0.15,0.05]
# calculate cross entropy H(P, Q)
ce_pq=cross_entropy(p,q)
print('H(P, Q): %.3f bits'%ce_pq)
# calculate cross entropy H(Q, P)
ce_qp=cross_entropy(q,p)
print('H(Q, P): %.3f bits'%ce_qp)
Running the example first calculates the cross-entropy of Q from P as just over 3 bits, then P from Q as just under 3 bits.
1
2
H(P, Q): 3.288 bits
H(Q, P): 2.906 bits
Calculate Cross-Entropy Between a Distribution and Itself
If two probability distributions are the same, then the cross-entropy between them will be the entropy of the distribution.
We can demonstrate this by calculating the cross-entropy of P vs P and Q vs Q.
The complete example is listed below.
1
2
3
4
5
6
7
8
9
10
11
12
13
14
15
16
# example of calculating cross entropy for identical distributions
from math import log2
# calculate cross entropy
def cross_entropy(p,q):
return-sum([p[i]*log2(q[i])foriinrange(len(p))])
# define data
p=[0.10,0.40,0.50]
q=[0.80,0.15,0.05]
# calculate cross entropy H(P, P)
ce_pp=cross_entropy(p,p)
print('H(P, P): %.3f bits'%ce_pp)
# calculate cross entropy H(Q, Q)
ce_qq=cross_entropy(q,q)
print('H(Q, Q): %.3f bits'%ce_qq)
Running the example first calculates the cross-entropy of Q vs Q which is calculated as the entropy for Q, and P vs P which is calculated as the entropy for P.
1
2
H(P, P): 1.361 bits
H(Q, Q): 0.884 bits
Calculate Cross-Entropy Using KL Divergence
We can also calculate the cross-entropy using the KL divergence.
The cross-entropy calculated with KL divergence should be identical, and it may be interesting to calculate the KL divergence between the distributions as well to see the relative entropy or additional bits required instead of the total bits calculated by the cross-entropy.
First, we can define a function to calculate the KL divergence between the distributions using log base-2 to ensure the result is also in bits.
Running the example, we can see that the cross-entropy score of 3.288 bits is comprised of the entropy of P 1.361 and the additional 1.927 bits calculated by the KL divergence.
This is a useful example that clearly illustrates the relationship between all three calculations.
1
2
3
H(P): 1.361 bits
KL(P || Q): 1.927 bits
H(P, Q): 3.288 bits
Cross-Entropy as a Loss Function
Cross-entropy is widely used as a loss function when optimizing classification models.
Two examples that you may encounter include the logistic regression algorithm (a linear classification algorithm), and artificial neural networks that can be used for classification tasks.
… using the cross-entropy error function instead of the sum-of-squares for a classification problem leads to faster training as well as improved generalization.
Classification problems are those that involve one or more input variables and the prediction of a class label.
Classification tasks that have just two labels for the output variable are referred to as binary classification problems, whereas those problems with more than two labels are referred to as categorical or multi-class classification problems.
Binary Classification: Task of predicting one of two class labels for a given example.
Multi-Class Classification: Task of predicting one of more than two class labels for a given example.
We can see that the idea of cross-entropy may be useful for optimizing a classification model.
Each example has a known class label with a probability of 1.0, and a probability of 0.0 for all other labels. A model can estimate the probability of an example belonging to each class label. Cross-entropy can then be used to calculate the difference between the two probability distributions.
As such, we can map the classification of one example onto the idea of a random variable with a probability distribution as follows:
Random Variable: The example for which we require a predicted class label.
Events: Each class label that could be predicted.
In classification tasks, we know the target probability distribution P for an input as the class label 0 or 1 interpreted as probabilities as “impossible” or “certain” respectively. These probabilities have no surprise at all, therefore they have no information content or zero entropy.
Our model seeks to approximate the target probability distribution Q.
In the language of classification, these are the actual and the predicted probabilities, or y and yhat.
Expected Probability (y): The known probability of each class label for an example in the dataset (P).
Predicted Probability (yhat): The probability of each class label an example predicted by the model (Q).
We can, therefore, estimate the cross-entropy for a single prediction using the cross-entropy calculation described above; for example.
H(P, Q) = – sum x in X P(x) * log(Q(x))
Where each x in X is a class label that could be assigned to the example, and P(x) will be 1 for the known label and 0 for all other labels.
The cross-entropy for a single example in a binary classification task can be stated by unrolling the sum operation as follows:
You may see this form of calculating cross-entropy cited in textbooks.
If there are just two class labels, the probability is modeled as the Bernoulli distribution for the positive class label. This means that the probability for class 1 is predicted by the model directly, and the probability for class 0 is given as one minus the predicted probability, for example:
Predicted P(class0) = 1 – yhat
Predicted P(class1) = yhat
When calculating cross-entropy for classification tasks, the base-e or natural logarithm is used. This means that the units are in nats, not bits.
We are often interested in minimizing the cross-entropy for the model across the entire training dataset. This is calculated by calculating the average cross-entropy across all training examples.
Calculate Entropy for Class Labels
Recall that when two distributions are identical, the cross-entropy between them is equal to the entropy for the probability distribution.
Class labels are encoded using the values 0 and 1 when preparing data for classification tasks.
For example, if a classification problem has three classes, and an example has a label for the first class, then the probability distribution will be [1, 0, 0]. If an example has a label for the second class, it will have a probability distribution for the two events as [0, 1, 0]. This is called a one hot encoding.
This probability distribution has no information as the outcome is certain. We know the class. Therefore the entropy for this variable is zero.
This is an important concept and we can demonstrate it with a worked example.
Pretend with have a classification problem with 3 classes, and we have one example that belongs to each class. We can represent each example as a discrete probability distribution with a 1.0 probability for the class to which the example belongs and a 0.0 probability for all other classes.
We can calculate the entropy of the probability distribution for each “variable” across the “events“.
The complete example is listed below.
1
2
3
4
5
6
7
8
9
10
11
12
13
14
15
16
17
# entropy of examples from a classification task with 3 classes
from math import log2
from numpy import asarray
# calculate entropy
def entropy(p):
return-sum([p[i]*log2(p[i])foriinrange(len(p))])
# class 1
p=asarray([1,0,0])+1e-15
print(entropy(p))
# class 2
p=asarray([0,1,0])+1e-15
print(entropy(p))
# class 3
p=asarray([0,0,1])+1e-15
print(entropy(p))
Running the example calculates the entropy for each random variable.
We can see that in each case, the entropy is 0.0 (actually a number very close to zero).
Note that we had to add a very small value to the 0.0 values to avoid the log() from blowing up, as we cannot calculate the log of 0.0.
1
2
3
9.805612959471341e-14
9.805612959471341e-14
9.805612959471341e-14
As such, the entropy of a known class label is always 0.0.
This means that the cross entropy of two distributions (real and predicted) that have the same probability distribution for a class label, will also always be 0.0.
Recall that when evaluating a model using cross-entropy on a training dataset that we average the cross-entropy across all examples in the dataset.
Therefore, a cross-entropy of 0.0 when training a model indicates that the predicted class probabilities are identical to the probabilities in the training dataset, e.g. zero loss.
We could just as easily minimize the KL divergence as a loss function instead of the cross-entropy.
Recall that the KL divergence is the extra bits required to transmit one variable compared to another. It is the cross-entropy without the entropy of the class label, which we know would be zero anyway.
As such, minimizing the KL divergence and the cross entropy for a classification task are identical.
Minimizing this KL divergence corresponds exactly to minimizing the cross-entropy between the distributions.
In practice, a cross-entropy loss of 0.0 often indicates that the model has overfit the training dataset, but that is another story.
Calculate Cross-Entropy Between Class Labels and Probabilities
The use of cross-entropy for classification often gives different specific names based on the number of classes, mirroring the name of the classification task; for example:
Binary Cross-Entropy: Cross-entropy as a loss function for a binary classification task.
Categorical Cross-Entropy: Cross-entropy as a loss function for a multi-class classification task.
We can make the use of cross-entropy as a loss function concrete with a worked example.
Consider a two-class classification task with the following 10 actual class labels (P) and predicted class labels (Q).
1
2
3
4
...
# define classification data
p=[1,1,1,1,1,0,0,0,0,0]
q=[0.8,0.9,0.9,0.6,0.8,0.1,0.4,0.2,0.1,0.3]
We can enumerate these probabilities and calculate the cross-entropy for each using the cross-entropy function developed in the previous section using log() (natural logarithm) instead of log2().
1
2
3
# calculate cross entropy
def cross_entropy(p,q):
return-sum([p[i]*log(q[i])foriinrange(len(p))])
For each actual and predicted probability, we must convert the prediction into a distribution of probabilities across each event, in this case, the classes {0, 1} as 1 minus the probability for class 0 and probability for class 1.
We can then calculate the cross-entropy and repeat the process for all examples.
Running the example prints the actual and predicted probabilities for each example and the cross-entropy in nats.
The final average cross-entropy loss across all examples is reported, in this case, as 0.247 nats.
1
2
3
4
5
6
7
8
9
10
11
>[y=1.0, yhat=0.8] ce: 0.223 nats
>[y=1.0, yhat=0.9] ce: 0.105 nats
>[y=1.0, yhat=0.9] ce: 0.105 nats
>[y=1.0, yhat=0.6] ce: 0.511 nats
>[y=1.0, yhat=0.8] ce: 0.223 nats
>[y=0.0, yhat=0.1] ce: 0.105 nats
>[y=0.0, yhat=0.4] ce: 0.511 nats
>[y=0.0, yhat=0.2] ce: 0.223 nats
>[y=0.0, yhat=0.1] ce: 0.105 nats
>[y=0.0, yhat=0.3] ce: 0.357 nats
Average Cross Entropy: 0.247 nats
This is how cross-entropy loss is calculated when optimizing a logistic regression model or a neural network model under a cross-entropy loss function.
Calculate Cross-Entropy Using Keras
We can confirm the same calculation by using the binary_crossentropy() function from the Keras deep learning API to calculate the cross-entropy loss for our small dataset.
The complete example is listed below.
Note: This example assumes that you have the Keras library installed (e.g. version 2.3 or higher) and configured with a backend library such as TensorFlow (version 2.0 or higher). If not, you can skip running this example.
Running the example, we can see that the same average cross-entropy loss of 0.247 nats is reported.
This confirms the correct manual calculation of cross-entropy.
1
Average Cross Entropy: 0.247 nats
Intuition for Cross-Entropy on Predicted Probabilities
We can further develop the intuition for the cross-entropy for predicted class probabilities.
For example, given that an average cross-entropy loss of 0.0 is a perfect model, what do average cross-entropy values greater than zero mean exactly?
We can explore this question no a binary classification problem where the class labels as 0 and 1. This is a discrete probability distribution with two events and a certain probability for one event and an impossible probability for the other event.
We can then calculate the cross entropy for different “predicted” probability distributions transitioning from a perfect match of the target distribution to the exact opposite probability distribution.
We would expect that as the predicted probability distribution diverges further from the target distribution that the cross-entropy calculated will increase.
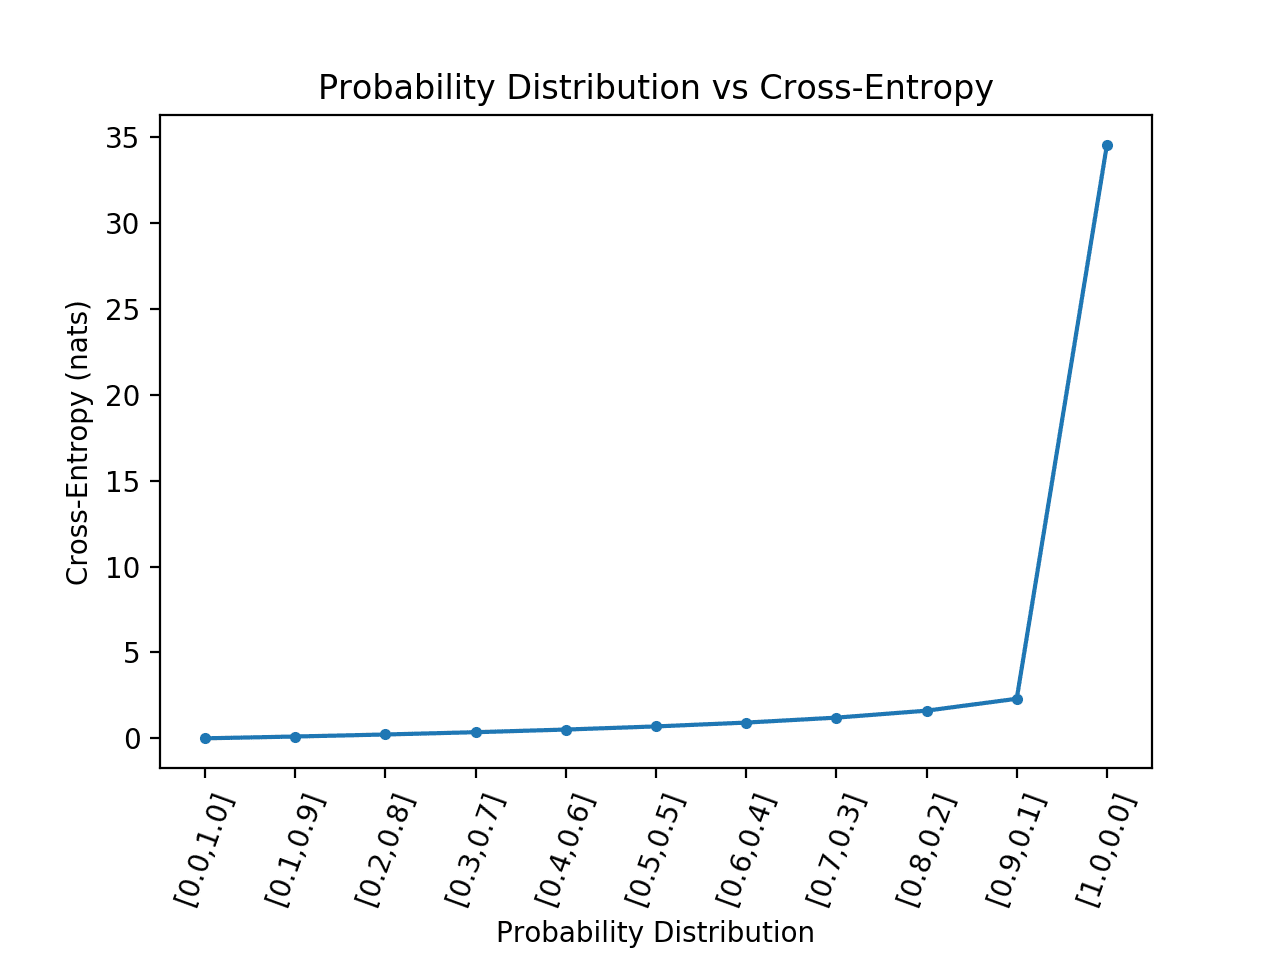
The example below implements this and plots the cross-entropy result for the predicted probability distribution compared to the target of [0, 1] for two events as we would see for the cross-entropy in a binary classification task.
1
2
3
4
5
6
7
8
9
10
11
12
13
14
15
16
17
18
19
20
21
22
23
24
# cross-entropy for predicted probability distribution vs label
Running the example calculates the cross-entropy score for each probability distribution then plots the results as a line plot.
We can see that as expected, cross-entropy starts at 0.0 (far left point) when the predicted probability distribution matches the target distribution, then steadily increases as the predicted probability distribution diverges.
We can also see a dramatic leap in cross-entropy when the predicted probability distribution is the exact opposite of the target distribution, that is, [1, 0] compared to the target of [0, 1].
Line Plot of Probability Distribution vs Cross-Entropy for a Binary Classification Task
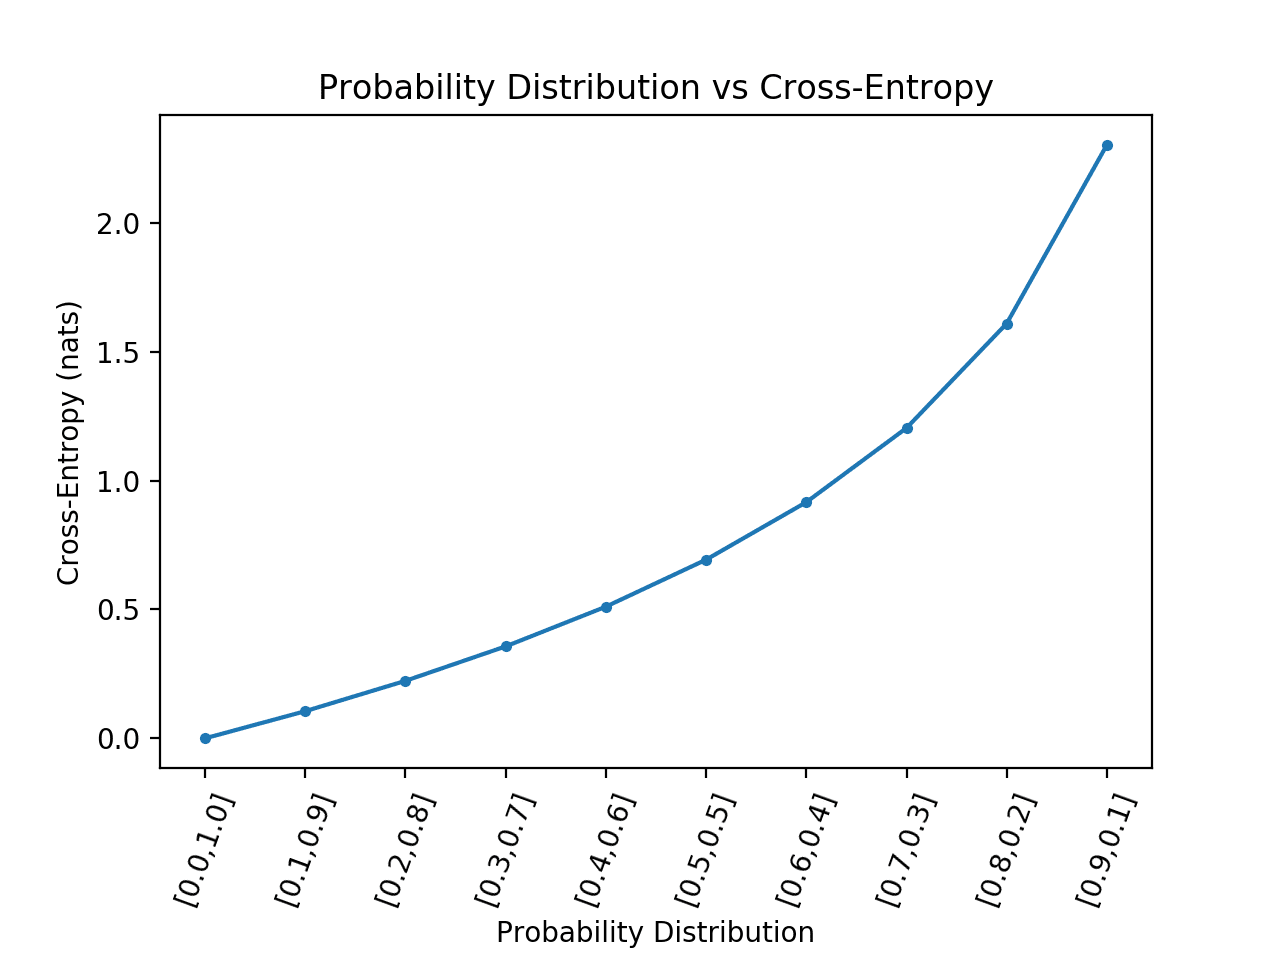
We are not going to have a model that predicts the exact opposite probability distribution for all cases on a binary classification task.
As such, we can remove this case and re-calculate the plot.
The updated version of the code is listed below.
1
2
3
4
5
6
7
8
9
10
11
12
13
14
15
16
17
18
19
20
21
22
23
24
# cross-entropy for predicted probability distribution vs label
Running the example gives a much better idea of the relationship between the divergence in probability distribution and the calculated cross-entropy.
We can see a super-linear relationship where the more the predicted probability distribution diverges from the target, the larger the increase in cross-entropy.
Line Plot of Probability Distribution vs Cross-Entropy for a Binary Classification Task With Extreme Case Removed
A plot like this can be used as a guide for interpreting the average cross-entropy reported for a model for a binary classification dataset.
For example, you can use these cross-entropy values to interpret the mean cross-entropy reported by Keras for a neural network model on a binary classification task, or a binary classification model in scikit-learn evaluated using the logloss metric.
You can use it to answer the general question:
What is a good cross-entropy score?
If you are working in nats (and you usually are) and you are getting mean cross-entropy less than 0.2, you are off to a good start, and less than 0.1 or 0.05 is even better.
On the other hand, if you are getting mean cross-entropy greater than 0.2 or 0.3 you can probably improve, and if you are getting a mean cross-entropy greater than 1.0, then something is going on and you’re making poor probability predictions on many examples in your dataset.
We can summarise these intuitions for the mean cross-entropy as follows:
Cross-Entropy = 0.00: Perfect probabilities.
Cross-Entropy < 0.02: Great probabilities.
Cross-Entropy < 0.05: On the right track.
Cross-Entropy < 0.20: Fine.
Cross-Entropy > 0.30: Not great.
Cross-Entropy > 1.00: Terrible.
Cross-Entropy > 2.00 Something is broken.
This listing will provide a useful guide when interpreting a cross-entropy (log loss) from your logistic regression model, or your artificial neural network model.
You can also calculate separate mean cross-entropy scores per-class and help tease out on which classes you’re model has good probabilities, and which it might be messing up.
Cross-Entropy Versus Log Loss
Cross-Entropy is not Log Loss, but they calculate the same quantity when used as loss functions for classification problems.
Log Loss is the Negative Log Likelihood
Logistic loss refers to the loss function commonly used to optimize a logistic regression model.
It may also be referred to as logarithmic loss (which is confusing) or simply log loss.
Many models are optimized under a probabilistic framework called the maximum likelihood estimation, or MLE, that involves finding a set of parameters that best explain the observed data.
This involves selecting a likelihood function that defines how likely a set of observations (data) are given model parameters. When a log likelihood function is used (which is common), it is often referred to as optimizing the log likelihood for the model. Because it is more common to minimize a function than to maximize it in practice, the log likelihood function is inverted by adding a negative sign to the front. This transforms it into a Negative Log Likelihood function or NLL for short.
In deriving the log likelihood function under a framework of maximum likelihood estimation for Bernoulli probability distribution functions (two classes), the calculation comes out to be:
This quantity can be averaged over all training examples by calculating the average of the log of the likelihood function.
Negative log-likelihood for binary classification problems is often shortened to simply “log loss” as the loss function derived for logistic regression.
log loss = negative log-likelihood, under a Bernoulli probability distribution
We can see that the negative log-likelihood is the same calculation as is used for the cross-entropy for Bernoulli probability distribution functions (two events or classes). In fact, the negative log-likelihood for Multinoulli distributions (multi-class classification) also matches the calculation for cross-entropy.
For more on log loss and the negative log likelihood, see the tutorial:
Log Loss and Cross Entropy Calculate the Same Thing
For classification problems, “log loss“, “cross-entropy” and “negative log-likelihood” are used interchangeably.
More generally, the terms “cross-entropy” and “negative log-likelihood” are used interchangeably in the context of loss functions for classification models.
The negative log-likelihood for logistic regression is given by […] This is also called the cross-entropy error function.
Therefore, calculating log loss will give the same quantity as calculating the cross-entropy for Bernoulli probability distribution. We can confirm this by calculating the log loss using the log_loss() function from the scikit-learn API.
Calculating the average log loss on the same set of actual and predicted probabilities from the previous section should give the same result as calculating the average cross-entropy.
The complete example is listed below.
1
2
3
4
5
6
7
8
9
10
11
12
# calculate log loss for classification problem with scikit-learn
from sklearn.metrics import log_loss
from numpy import asarray
# define classification data
p=[1,1,1,1,1,0,0,0,0,0]
q=[0.8,0.9,0.9,0.6,0.8,0.1,0.4,0.2,0.1,0.3]
# define data as expected, e.g. probability for each event {0, 1}
y_true=asarray([[1-v,v]forvinp])
y_pred=asarray([[1-v,v]forvinq])
# calculate the average log loss
ll=log_loss(y_true,y_pred)
print('Average Log Loss: %.3f'%ll)
Running the example gives the expected result of 0.247 log loss, which matches 0.247 nats when calculated using the average cross-entropy.
1
Average Log Loss: 0.247
This does not mean that log loss calculates cross-entropy or cross-entropy calculates log loss.
Instead, they are different quantities, arrived at from different fields of study, that under the conditions of calculating a loss function for a classification task, result in an equivalent calculation and result. Specifically, a cross-entropy loss function is equivalent to a maximum likelihood function under a Bernoulli or Multinoulli probability distribution.
This demonstrates a connection between the study of maximum likelihood estimation and information theory for discrete probability distributions.
It is not limited to discrete probability distributions, and this fact is surprising to many practitioners that hear it for the first time.
Specifically, a linear regression optimized under the maximum likelihood estimation framework assumes a Gaussian continuous probability distribution for the target variable and involves minimizing the mean squared error function. This is equivalent to the cross-entropy for a random variable with a Gaussian probability distribution.
Any loss consisting of a negative log-likelihood is a cross-entropy between the empirical distribution defined by the training set and the probability distribution defined by model. For example, mean squared error is the cross-entropy between the empirical distribution and a Gaussian model.
This is a little mind blowing, and comes from the field of differential entropy for continuous random variables.
It means that if you calculate the mean squared error between two Gaussian random variables that cover the same events (have the same mean and standard deviation), then you are calculating the cross-entropy between the variables.
It also means that if you are using mean squared error loss to optimize your neural network model for a regression problem, you are in effect using a cross entropy loss.
Further Reading
This section provides more resources on the topic if you are looking to go deeper.
In this tutorial, you discovered cross-entropy for machine learning.
Specifically, you learned:
How to calculate cross-entropy from scratch and using standard machine learning libraries.
Cross-entropy can be used as a loss function when optimizing classification models like logistic regression and artificial neural networks.
Cross-entropy is different from KL divergence but can be calculated using KL divergence, and is different from log loss but calculates the same quantity when used as a loss function.
Do you have any questions?
Ask your questions in the comments below and I will do my best to answer.
It provides self-study tutorials and end-to-end projects on: Bayes Theorem, Bayesian Optimization, Distributions, Maximum Likelihood, Cross-Entropy, Calibrating Models
and much more...
What confuses me a bit is the fact that we interpret the labels 0 and 1 in the example as the probability values for calculating the cross entropy between the target distribution and the predicted distribution!
What if the labels were 4 and 7 instead of 0 and 1?!
Hi Jason,
A small fix suggestion: in the beginning of the article in section “What Is Cross-Entropy?” you’ve mentioned that “The result will be a positive number measured in bits and 0 if the two probability distributions are identical.”.
However, the cross entropy for the same probability-distributions H(P,P) is the entropy for the probability-distribution H(P), opposed to KL divergence of the same probability-distribution which would indeed outcome zero.
Comparing the first output to the ‘made up figures’ does the lower the number of bits mean a better fit? A more predictable model?
Also:
I understand that a bit is a base 2 number. Eg 1 = 1(base 10), 11 = 3 (base 10), 101 = 5 (base 10).
The number of bits in a base 2 system is an integer. What does a fraction of bit mean?
Typically we use cross-entropy to evaluate a model, e.g. true classes vs probability predictions.
In that case would compare the average cross-entropy calculated across all examples and a lower value would represent a better fit. Interpreting the specific figures is often not useful.
Dear Dr Jason,
Thank you for response.
The other question please:
How can you have a fraction of a bit. For example entropy = 3.2285 bits. What is 0.2285 bits.
Thank you,
Anthony of Sydney
could you provide an example of this sentence “The entropy for a distribution of all 0 or all 1 values or mixtures of these values will equal 0.0.”?
Does this mean a distribution with a mixture of these values, eg. the distribution with P(X=1) = 0.4 and P(X=0) = 0.6 has entropy zero? But this should not be the case because 0.4 * log(0.4) + 0.6 * log(0.6) is not zero.
Hi Jason! This is the best article I’ve ever seen on cross entropy and KL-divergence! Finally I can understand them 😉 Thank you so much for the comprehensive article.
I have one small question: in the secion “Intuition for Cross-Entropy on Predicted Probabilities”, in the first code block to plot the visualization, the code is as follows:
# define the target distribution for two events
target = [0.0, 0.1]
# define probabilities for the first event
probs = [0.0, 0.1, 0.2, 0.3, 0.4, 0.5, 0.6, 0.7, 0.8, 0.9, 1.0]
# create probability distributions for the two events
dists = [[p, 1.0 – p] for p in probs]
# calculate cross-entropy for each distribution
ents = [cross_entropy(target, d) for d in dists]
I do not quite understand why the target probability for the two events are [0.0, 0.1]? Could you explain a bit more? Thank you!
Jason, I so appreciate all your various posts on ML topics. If I may add one comment regarding what I’ve found helpful in the past:
One point that I didn’t see really emphasized here that I’ve seen in other treatments (e.g., https://tdhopper.com/blog/cross-entropy-and-kl-divergence/) is that cross-entropy and KL difference “differ by a constant”, i.e. in your expression
H(P, Q) = H(P) + KL(P || Q),
the H(P) is constant with respect to Q. In most ML tasks, P is usually fixed as the “true” distribution” and Q is the distribution we are iteratively trying to refine until it matches P.
You do get to this when you say “As such, minimizing the KL divergence and the cross entropy for a classification task are identical.”
And yet for me at least, knowing that the two “differ by a constant” makes it intuitively obvious why minimizing one is the same as minimizing the other, even if they’re actually intended to measure different things.
…Thus I think this “differ by a constant” is another reason that people get mixed up about cross-entropy vs KL divergence, and why guides like yours are so helpful!
Yes, H(P) is the entropy of the distribution. This becomes 0 when class labels are 0 and 1. I outline this at the end of the post when we talk about class labels.
A constant of 0 in that case means using KL divergence and cross entropy result in the same numbers, e.g. the kl divergence.
thanks for a grate article!
but what confused me that in your article you have mentioned that
”
The result will be a positive number measured in bits and will be equal to the entropy of the distribution if the two probability distributions are identical.”
then again mentioned
“If two probability distributions are the same, then the cross-entropy between them will be the entropy of the distribution.”
then
“This means that the cross entropy of two distributions (real and predicted) that have the same probability distribution for a class label, will also always be 0.0.”
“Therefore, a cross-entropy of 0.0 when training a model indicates that the predicted class probabilities are identical to the probabilities in the training dataset, e.g. zero loss.”
it was not about examples, they were understandable, thanks.
Just I could not imagine and understand them numerically.
Reading them again I understand that when the values of any distribution are only one or zero then entropy, cross-entropy, KL all will be zero.
they will have values just in case they have values between 0 and 1 also
Question on KL Divergence: In its definition we have log2(p[i]/q[i]) which suggests a possibility of zero division error. Is it a probable issue in real applications? Or for some reason it does not occur?
Regards!
Hello Jason, Congratulations on the explanation. How are you? I have a doubt. If I have log(0), I get -Inf on my crossentropy. Should I replace -Inf with some value? If so, what value?
Hello Jason,
Thank you so much for all your great posts.
I have a quesion, if we have conditional entropy H(y|x)=-sum P(x,y) log(P(y|x)
could we say that it is equal to cross-entropy H( x,y) = – sum y log y^?
And if that correct where we could say that? i.e., under what assumptions.
I think you’re asking me if the conditional entropy is the same as the cross entropy. I don’t think it is off the cuff, but perhaps confirm with a good textbook.
Thank you so much for your replay,
I found it in “Privacy-Preserving Adversarial Networks” paper, the authors get a conditional entropy as a cost function, but when they implement the article, they use cross-entropy. But they don’t say why?
This is excellent Introduction to Cross-Entropy. It seems that one of the following sentences may have a typo in the stated notion of “surprise”. My first impression is that the second sentence should have said “are less surprising”. Is that true?
“Low probability events are more surprising therefore have a larger amount of information. Whereas probability distributions where the events are equally likely are more surprising and have larger entropy.”
After additional consideration, it appears that the second sentence might instead be related as follows.
“In probability distributions where the events are equally likely, no events have larger or smaller likelihood (smaller or larger surprise, respectively), and the distribution has larger entropy.”
Sorry for belaboring this. It is a good point but sometimes confusing.
Thank you for this clear explanation. Why is it the case that “using the cross-entropy error function instead of the sum-of-squares for a classification problem leads to faster training as well as improved generalization”?
the correntropy (a special case of cross entropy) is a nonlinear and local similarity metric measuring the similarity between two random variables in a neighbourhood of joint space.
C. Liangjun, P. Honeine, Q. Hua, Z. Jihong, and S. Xia, “Correntropy- based robust multilayer extreme learning machines,” Pattern Recognit., vol. 84, pp. 357–370, Dec. 2018.
Thanks for pointing this out. I thought that was a typo. Looking at equations (13) and (14) of the cited paper, you should see it is a modified version of MSE. The problem is you need to create your own function (I don’t see correntropy is defined in scikit-learn, for example) and not every model allows you to plug-in your own loss function. Probably the linear regression library in scikit-learn can’t do it and you need to resort to scipy to do the regression manually.
Hello Dr. Adrian,
thanks for your valuable to give a deeper understanding. During implementation, I am using label smoothing (loss=tensorflow.keras.losses.CategoricalCrossentropy(label_smoothing=0.2)) to improve performance as a regularizer. I have observed that though performance improves quite a good way, the training and validation loss remains very high (near 0.5), though performance learning curves are converging well. Without label smoothing, losses go very low (near 0.1) but do not converge well or show overfitting.
I would like to know:
1. Is this high loss of near 0.5 with good fit is acceptable?
2. Can I reduce this loss anyway?
3. Do you suggest an alternative to label smoothing ?
Note: I have observed in all blogs label smoothing in an increase of this loss.
hi
i’m working on cross entropy and i want to calculate two c e between two path ;
the code auther wrote on his paper is
CrossEntropy
Input:
Sequence X, Sequence Y
Output:
e: cross entropy of X and Y
begin
for (int n=1; n<5; n++)
begin
for each (ngram in X.ngrams(n)) //reads each ngram with length n within X
begin
(token, history) = split (ngram);//splits ngram so that ngram = history + token
a = X.P(ngram);//probability ofngram in X sequence
b = Y.ConditionalP(token,history);//probability of tokengiven history in Y sequence
logb = (b!=0 ? Log(b) : Log(1/X.ngramCount));
c = a × logb;
e += c;
end
end
end
I’m eager to help, but I just don’t have the capacity to debug code for you.
I am happy to make some suggestions:
Consider aggressively cutting the code back to the minimum required. This will help you isolate the problem and focus on it.
Consider cutting the problem back to just one or a few simple examples.
Consider finding other similar code examples that do work and slowly modify them to meet your needs. This might expose your misstep.
Consider posting your question and code to StackOverflow.
Thank you for the cross-entropy tutorial, really appreciate your work! I found a minor typo though, “discrete states” is repeated twice in this sentence: “Entropy H(x) can be calculated for a random variable with a set of x in X discrete states discrete states and their probability P(x) as follows:”
Please let me know, whehter maximum entropy markov model (MEMM) and multinomial logstic regression are same? How can we implement MEMM in weka or python.
I am trying to implement custom binary cross entropy loss for image segmentation but the results are not coming same as keras backend loss. Will you please help me regarding this?
Thank you in advanced.
Hello James, thanks for writing articles with such great details.
I have one doubt in the section Intuition for Cross-Entropy on Predicted Probabilities. In the code you have written
# define the target distribution for two events

target = [0.0, 1.0]

# define probabilities for the first event

probs = [1.0, 0.9, 0.8, 0.7, 0.6, 0.5, 0.4, 0.3, 0.2, 0.1, 0.0]

# create probability distributions for the two events

dists = [[1.0 - p, p] for p in probs]
Shouldn’t the comment define probabilities for the first event be actually define probabilities for the second event, since based on graph starting from (0.0, 1.0) which is actually matching the target, cross-entropy/loss is minimum?
Sorry for lack of clarification. Let me try to explain in a better way. In the section “Intuition for Cross-Entropy on Predicted Probabilities”, there is code as mentioned in the above comment.
In the code, there is one comment “define probabilities for the first event”. Shouldn’t that comment be “define probabilities for the second event”? I am asking this because, when we are calculating “dists” variable, we are doing it as “[[1.0 – p, p] for p in probs]”, thus it means that “p” given in “probs” were for second event?


Hi
Thanks for this blog post.
What confuses me a bit is the fact that we interpret the labels 0 and 1 in the example as the probability values for calculating the cross entropy between the target distribution and the predicted distribution!
What if the labels were 4 and 7 instead of 0 and 1?!
Thanks.
Good question. For binary classification we map the labels, whatever they are to 0 and 1.
I recommend reading about the Bernoulli distribution:
https://machinelearningmastery.com/discrete-probability-distributions-for-machine-learning/
Hi Jason,
A small fix suggestion: in the beginning of the article in section “What Is Cross-Entropy?” you’ve mentioned that “The result will be a positive number measured in bits and 0 if the two probability distributions are identical.”.
However, the cross entropy for the same probability-distributions H(P,P) is the entropy for the probability-distribution H(P), opposed to KL divergence of the same probability-distribution which would indeed outcome zero.
Thanks,
Ron U
Thanks Ron!
I’ll schedule time to update the post and give an example of exactly what you’re referring to. E.g.:
H(P, P): 1.361 bits
H(Q, Q): 0.884 bits
Update: I have updated the post to correctly discuss this case.
Thanks Again!
Why not use
zip?Thanks for the tip Hugh, that is a much cleaner approach!
Dear Dr Jason,
In the last few lines under the subheading “How to Calculate Cross-Entropy”, you had the simple example with the following outputs:
What is the interpretation of these figures in ‘plain English’ please.
For example if the above example produced the following result:
Or if we had this:
Here is another example of made up figures.
Comparing the first output to the ‘made up figures’ does the lower the number of bits mean a better fit? A more predictable model?
Also:
I understand that a bit is a base 2 number. Eg 1 = 1(base 10), 11 = 3 (base 10), 101 = 5 (base 10).
The number of bits in a base 2 system is an integer. What does a fraction of bit mean?
Anthony of Sydney
Typically we use cross-entropy to evaluate a model, e.g. true classes vs probability predictions.
In that case would compare the average cross-entropy calculated across all examples and a lower value would represent a better fit. Interpreting the specific figures is often not useful.
Dear Dr Jason,
Thank you for response.
The other question please:
How can you have a fraction of a bit. For example entropy = 3.2285 bits. What is 0.2285 bits.
Thank you,
Anthony of Sydney
Recall, it is an average over a distribution with many events.
Think of it more of a measure and less like the crisp bits in a computer.
Great Article, Hope to see more more content on machine learning and AI.
Thanks!
Hi,
could you provide an example of this sentence “The entropy for a distribution of all 0 or all 1 values or mixtures of these values will equal 0.0.”?
Does this mean a distribution with a mixture of these values, eg. the distribution with P(X=1) = 0.4 and P(X=0) = 0.6 has entropy zero? But this should not be the case because 0.4 * log(0.4) + 0.6 * log(0.6) is not zero.
Thank you!
Good question.
Sorry that is confusing.
I mean that the probability distribution for a class label will always be zero.
I have updated the tutorial to be clearer and given a worked example.
Hi Jason! This is the best article I’ve ever seen on cross entropy and KL-divergence! Finally I can understand them 😉 Thank you so much for the comprehensive article.
I have one small question: in the secion “Intuition for Cross-Entropy on Predicted Probabilities”, in the first code block to plot the visualization, the code is as follows:
# define the target distribution for two events
target = [0.0, 0.1]
# define probabilities for the first event
probs = [0.0, 0.1, 0.2, 0.3, 0.4, 0.5, 0.6, 0.7, 0.8, 0.9, 1.0]
# create probability distributions for the two events
dists = [[p, 1.0 – p] for p in probs]
# calculate cross-entropy for each distribution
ents = [cross_entropy(target, d) for d in dists]
I do not quite understand why the target probability for the two events are [0.0, 0.1]? Could you explain a bit more? Thank you!
Thanks! I worked really hard on it and I’m so happy that it’s appreciated 🙂
Yes, looks like a typo. I’ll fix it ASAP. It should be [0,1].
Update: I have updated the code and re-generated the plots. Thanks again!
Jason, I so appreciate all your various posts on ML topics. If I may add one comment regarding what I’ve found helpful in the past:
One point that I didn’t see really emphasized here that I’ve seen in other treatments (e.g., https://tdhopper.com/blog/cross-entropy-and-kl-divergence/) is that cross-entropy and KL difference “differ by a constant”, i.e. in your expression
H(P, Q) = H(P) + KL(P || Q),
the H(P) is constant with respect to Q. In most ML tasks, P is usually fixed as the “true” distribution” and Q is the distribution we are iteratively trying to refine until it matches P.
“In many of these situations, ???? is treated as the ‘true’ distribution, and ???? as the model that we’re trying to optimize…. Because ???? is fixed, ????(????) doesn’t change with the parameters of the model, and can be disregarded in the loss function.” (https://stats.stackexchange.com/questions/265966/why-do-we-use-kullback-leibler-divergence-rather-than-cross-entropy-in-the-t-sne/265989)
You do get to this when you say “As such, minimizing the KL divergence and the cross entropy for a classification task are identical.”
And yet for me at least, knowing that the two “differ by a constant” makes it intuitively obvious why minimizing one is the same as minimizing the other, even if they’re actually intended to measure different things.
…Thus I think this “differ by a constant” is another reason that people get mixed up about cross-entropy vs KL divergence, and why guides like yours are so helpful!
Thanks for your note Scott.
Yes, H(P) is the entropy of the distribution. This becomes 0 when class labels are 0 and 1. I outline this at the end of the post when we talk about class labels.
A constant of 0 in that case means using KL divergence and cross entropy result in the same numbers, e.g. the kl divergence.
thanks for a grate article!
but what confused me that in your article you have mentioned that
”
The result will be a positive number measured in bits and will be equal to the entropy of the distribution if the two probability distributions are identical.”
then again mentioned
“If two probability distributions are the same, then the cross-entropy between them will be the entropy of the distribution.”
then
“This means that the cross entropy of two distributions (real and predicted) that have the same probability distribution for a class label, will also always be 0.0.”
“Therefore, a cross-entropy of 0.0 when training a model indicates that the predicted class probabilities are identical to the probabilities in the training dataset, e.g. zero loss.”
Am I missing something?
The statements are correct.
The cross-entropy will be the entropy between the distributions if the distributions are identical.
In this case, if we are working with class labels like 0 and 1, then the entropy for two identical distributions will be zero.
We demonstrate this with a worked example in the above tutorial.
Does that help?
it was not about examples, they were understandable, thanks.
Just I could not imagine and understand them numerically.
Reading them again I understand that when the values of any distribution are only one or zero then entropy, cross-entropy, KL all will be zero.
they will have values just in case they have values between 0 and 1 also
Exactly!
Good morning Jason!
Thank you for great post!
Question on KL Divergence: In its definition we have log2(p[i]/q[i]) which suggests a possibility of zero division error. Is it a probable issue in real applications? Or for some reason it does not occur?
Regards!
Good question, no problem as probabilities are always greater than zero, so log never blows up.
More on kl divergence here too:
https://machinelearningmastery.com/divergence-between-probability-distributions/
Is it possible to use KL divergence as a classification criterion?
Probably, it would be the same as log loss and cross entropy when using class labels instead of probabilities.
Thanks for your reply. So let say the final calculation result is “Average Log Loss”, what does this value implies meaning?
Average difference between the probability distributions of expected and predicted values in bits.
Hello Jason, Congratulations on the explanation. How are you? I have a doubt. If I have log(0), I get -Inf on my crossentropy. Should I replace -Inf with some value? If so, what value?
Best,
Gledson.
You cannot log a zero. It is a good idea to always add a tiny value to anything to log, e.g. log(value + 1e-8)
Hi Jason,
Thanks for all your great post, I’ve read some of them.
I’m working on traffic classification and I’ve converted my data to string of bits, I want to use cross-entropy on bytes.
Assume below lists:
p = [1, 0, 1, 1, 0, 0, 1, 0]
q = [1, 1, 1, 0, 1, 0, 0, 1]
When I use
-sum([p[i] * log2(q[i]) for i in range(len(p))]), I encounter this error :ValueError: math domain error. SWould you please tell me what I’m doing wrong here and how can I implement cross-entropy on a list of bits?
Bests,
Can’t calculate log of 0.0. Try adding a tiny value to the equation, e.g. 1e-8 or 1e-15
I’ve converted the traffic to string of bits, it’s not just some random numbers that I can add any value.
Why we use log function for cross entropy?
Good question, perhaps start here:
https://machinelearningmastery.com/what-is-information-entropy/
thanks you !!
You’re welcome.
Hello Jason,
Thank you so much for all your great posts.
I have a quesion, if we have conditional entropy H(y|x)=-sum P(x,y) log(P(y|x)
could we say that it is equal to cross-entropy H( x,y) = – sum y log y^?
And if that correct where we could say that? i.e., under what assumptions.
Thank you in advance.
I think you’re asking me if the conditional entropy is the same as the cross entropy. I don’t think it is off the cuff, but perhaps confirm with a good textbook.
Thank you so much for your replay,
I found it in “Privacy-Preserving Adversarial Networks” paper, the authors get a conditional entropy as a cost function, but when they implement the article, they use cross-entropy. But they don’t say why?
Fascinating.
Perhaps email the authors directly.
How can be Number of bits per charecter in text generation is equal to loss ???
Perhaps try re-reading the above tutorial that lays it all out.
This is excellent Introduction to Cross-Entropy. It seems that one of the following sentences may have a typo in the stated notion of “surprise”. My first impression is that the second sentence should have said “are less surprising”. Is that true?
“Low probability events are more surprising therefore have a larger amount of information. Whereas probability distributions where the events are equally likely are more surprising and have larger entropy.”
Thanks.
Yes it could be clearer. Information is about events, entropy is about distributions, cross-entropy is about comparing distributions.
Surprise means something different when talking about information/events as compared to entropy/distributions.
I mixed the discussion of the two at the start of the tutorial. I have updated the text to be clearer.
Also see this:
https://machinelearningmastery.com/what-is-information-entropy/
Does that help?
After additional consideration, it appears that the second sentence might instead be related as follows.
“In probability distributions where the events are equally likely, no events have larger or smaller likelihood (smaller or larger surprise, respectively), and the distribution has larger entropy.”
Sorry for belaboring this. It is a good point but sometimes confusing.
They say that you have understood a concept when you can describe it with very simple words and I feel that is the case here. Wonderful job!
Thanks!
“Relative Entropy (KL Divergence): Average number of extra bits to represent an event from Q instead of P.”
Souldn’t it rather say: Relative Entropy (KL Divergence): Average number of extra bits to represent an event from P using Q instead of P.
Since the expectation is over P(x)*[…]
Dear Jason,
Thank you for this clear explanation. Why is it the case that “using the cross-entropy error function instead of the sum-of-squares for a classification problem leads to faster training as well as improved generalization”?
It is a better match for the objective of the optimization problem.
thank you for your good explanation. i am training a neural network is this result considerable for
dataset accuracy cross entropy loss
train 97% 0.07
val 96.5% 0.48
test 98% 0.13
Perhaps focus on the metric you want to optimize, rather than the loss.
Hi Jason,
can you advise on how to utilise correntropy for regression problem optimization, please ?
I don’t think cross entropy applies to regression. How would you define the probability distribution required for that?
the correntropy (a special case of cross entropy) is a nonlinear and local similarity metric measuring the similarity between two random variables in a neighbourhood of joint space.
C. Liangjun, P. Honeine, Q. Hua, Z. Jihong, and S. Xia, “Correntropy- based robust multilayer extreme learning machines,” Pattern Recognit., vol. 84, pp. 357–370, Dec. 2018.
Thanks for pointing this out. I thought that was a typo. Looking at equations (13) and (14) of the cited paper, you should see it is a modified version of MSE. The problem is you need to create your own function (I don’t see correntropy is defined in scikit-learn, for example) and not every model allows you to plug-in your own loss function. Probably the linear regression library in scikit-learn can’t do it and you need to resort to scipy to do the regression manually.
I see
Thanks Adiran
Hello Dr. Adrian,
thanks for your valuable to give a deeper understanding. During implementation, I am using label smoothing (loss=tensorflow.keras.losses.CategoricalCrossentropy(label_smoothing=0.2)) to improve performance as a regularizer. I have observed that though performance improves quite a good way, the training and validation loss remains very high (near 0.5), though performance learning curves are converging well. Without label smoothing, losses go very low (near 0.1) but do not converge well or show overfitting.
I would like to know:
1. Is this high loss of near 0.5 with good fit is acceptable?
2. Can I reduce this loss anyway?
3. Do you suggest an alternative to label smoothing ?
Note: I have observed in all blogs label smoothing in an increase of this loss.
Kindly guide.
Loss is a continuous measure. So for classification tasks, we should also look at accuracy. Check that out and see if it gives you a better idea.
Thanks for the guidance. I will work on it.
You’re welcomed.
hi
i’m working on cross entropy and i want to calculate two c e between two path ;
the code auther wrote on his paper is
CrossEntropy
Input:
Sequence X, Sequence Y
Output:
e: cross entropy of X and Y
begin
for (int n=1; n<5; n++)
begin
for each (ngram in X.ngrams(n)) //reads each ngram with length n within X
begin
(token, history) = split (ngram);//splits ngram so that ngram = history + token
a = X.P(ngram);//probability ofngram in X sequence
b = Y.ConditionalP(token,history);//probability of tokengiven history in Y sequence
logb = (b!=0 ? Log(b) : Log(1/X.ngramCount));
c = a × logb;
e += c;
end
end
end
can you help me write this in python??
Thanks for asking.
I’m eager to help, but I just don’t have the capacity to debug code for you.
I am happy to make some suggestions:
Consider aggressively cutting the code back to the minimum required. This will help you isolate the problem and focus on it.
Consider cutting the problem back to just one or a few simple examples.
Consider finding other similar code examples that do work and slowly modify them to meet your needs. This might expose your misstep.
Consider posting your question and code to StackOverflow.
Thank you for the cross-entropy tutorial, really appreciate your work! I found a minor typo though, “discrete states” is repeated twice in this sentence: “Entropy H(x) can be calculated for a random variable with a set of x in X discrete states discrete states and their probability P(x) as follows:”
Thank you for the feedback Ayla!
Typo: Entropy H(x) can be calculated for a random variable with a set of x in X discrete states discrete states and their probability P(x) as follows:
“discrete states” shown twice
Please let me know, whehter maximum entropy markov model (MEMM) and multinomial logstic regression are same? How can we implement MEMM in weka or python.
Hi DataScientist…You may find the following resources of interest:
https://www.davidsbatista.net/blog/2017/11/12/Maximum_Entropy_Markov_Model/
https://www.researchgate.net/publication/263037664_Intrusion_Detection_with_Hidden_Markov_Model_and_WEKA_Tool
Dear Jason,
I am trying to implement custom binary cross entropy loss for image segmentation but the results are not coming same as keras backend loss. Will you please help me regarding this?
Thank you in advanced.
Hi Prasun…Please see the email regarding the same subject.
Hello James, thanks for writing articles with such great details.
I have one doubt in the section
Intuition for Cross-Entropy on Predicted Probabilities. In the code you have written# define the target distribution for two events
target = [0.0, 1.0]
# define probabilities for the first event
probs = [1.0, 0.9, 0.8, 0.7, 0.6, 0.5, 0.4, 0.3, 0.2, 0.1, 0.0]
# create probability distributions for the two events
dists = [[1.0 - p, p] for p in probs]
Shouldn’t the comment
define probabilities for the first eventbe actuallydefine probabilities for the second event, since based on graph starting from (0.0, 1.0) which is actually matching the target, cross-entropy/loss is minimum?Hi Shubham…Not sure I understand the doubt that you have but I will review it. Thank you for your input!
Sorry for lack of clarification. Let me try to explain in a better way. In the section “Intuition for Cross-Entropy on Predicted Probabilities”, there is code as mentioned in the above comment.
In the code, there is one comment “define probabilities for the first event”. Shouldn’t that comment be “define probabilities for the second event”? I am asking this because, when we are calculating “dists” variable, we are doing it as “[[1.0 – p, p] for p in probs]”, thus it means that “p” given in “probs” were for second event?
Let me know if my understanding is wrong.