It can be more flexible to predict probabilities of an observation belonging to each class in a classification problem rather than predicting classes directly.
This flexibility comes from the way that probabilities may be interpreted using different thresholds that allow the operator of the model to trade-off concerns in the errors made by the model, such as the number of false positives compared to the number of false negatives. This is required when using models where the cost of one error outweighs the cost of other types of errors.
Two diagnostic tools that help in the interpretation of probabilistic forecast for binary (two-class) classification predictive modeling problems are ROC Curves and Precision-Recall curves.
In this tutorial, you will discover ROC Curves, Precision-Recall Curves, and when to use each to interpret the prediction of probabilities for binary classification problems.
After completing this tutorial, you will know:
- ROC Curves summarize the trade-off between the true positive rate and false positive rate for a predictive model using different probability thresholds.
- Precision-Recall curves summarize the trade-off between the true positive rate and the positive predictive value for a predictive model using different probability thresholds.
- ROC curves are appropriate when the observations are balanced between each class, whereas precision-recall curves are appropriate for imbalanced datasets.
Kick-start your project with my new book Probability for Machine Learning, including step-by-step tutorials and the Python source code files for all examples.
Let’s get started.
- Update Aug/2018: Fixed bug in the representation of the no skill line for the precision-recall plot. Also fixed typo where I referred to ROC as relative rather than receiver (thanks spellcheck).
- Update Nov/2018: Fixed description on interpreting size of values on each axis, thanks Karl Humphries.
- Update Jun/2019: Fixed typo when interpreting imbalanced results.
- Update Oct/2019: Updated ROC Curve and Precision Recall Curve plots to add labels, use a logistic regression model and actually compute the performance of the no skill classifier.
- Update Nov/2019: Improved description of no skill classifier for precision-recall curve.
- Update Oct/2023: Minor update on code to make it more Pythonic

How and When to Use ROC Curves and Precision-Recall Curves for Classification in Python
Photo by Giuseppe Milo, some rights reserved.
Tutorial Overview
This tutorial is divided into 6 parts; they are:
- Predicting Probabilities
- What Are ROC Curves?
- ROC Curves and AUC in Python
- What Are Precision-Recall Curves?
- Precision-Recall Curves and AUC in Python
- When to Use ROC vs. Precision-Recall Curves?
Predicting Probabilities
In a classification problem, we may decide to predict the class values directly.
Alternately, it can be more flexible to predict the probabilities for each class instead. The reason for this is to provide the capability to choose and even calibrate the threshold for how to interpret the predicted probabilities.
For example, a default might be to use a threshold of 0.5, meaning that a probability in [0.0, 0.49] is a negative outcome (0) and a probability in [0.5, 1.0] is a positive outcome (1).
This threshold can be adjusted to tune the behavior of the model for a specific problem. An example would be to reduce more of one or another type of error.
When making a prediction for a binary or two-class classification problem, there are two types of errors that we could make.
- False Positive. Predict an event when there was no event.
- False Negative. Predict no event when in fact there was an event.
By predicting probabilities and calibrating a threshold, a balance of these two concerns can be chosen by the operator of the model.
For example, in a smog prediction system, we may be far more concerned with having low false negatives than low false positives. A false negative would mean not warning about a smog day when in fact it is a high smog day, leading to health issues in the public that are unable to take precautions. A false positive means the public would take precautionary measures when they didn’t need to.
A common way to compare models that predict probabilities for two-class problems is to use a ROC curve.
What Are ROC Curves?
A useful tool when predicting the probability of a binary outcome is the Receiver Operating Characteristic curve, or ROC curve.
It is a plot of the false positive rate (x-axis) versus the true positive rate (y-axis) for a number of different candidate threshold values between 0.0 and 1.0. Put another way, it plots the false alarm rate versus the hit rate.
The true positive rate is calculated as the number of true positives divided by the sum of the number of true positives and the number of false negatives. It describes how good the model is at predicting the positive class when the actual outcome is positive.
|
1 |
True Positive Rate = True Positives / (True Positives + False Negatives) |
The true positive rate is also referred to as sensitivity.
|
1 |
Sensitivity = True Positives / (True Positives + False Negatives) |
The false positive rate is calculated as the number of false positives divided by the sum of the number of false positives and the number of true negatives.
It is also called the false alarm rate as it summarizes how often a positive class is predicted when the actual outcome is negative.
|
1 |
False Positive Rate = False Positives / (False Positives + True Negatives) |
The false positive rate is also referred to as the inverted specificity where specificity is the total number of true negatives divided by the sum of the number of true negatives and false positives.
|
1 |
Specificity = True Negatives / (True Negatives + False Positives) |
Where:
|
1 |
False Positive Rate = 1 - Specificity |
The ROC curve is a useful tool for a few reasons:
- The curves of different models can be compared directly in general or for different thresholds.
- The area under the curve (AUC) can be used as a summary of the model skill.
The shape of the curve contains a lot of information, including what we might care about most for a problem, the expected false positive rate, and the false negative rate.
To make this clear:
- Smaller values on the x-axis of the plot indicate lower false positives and higher true negatives.
- Larger values on the y-axis of the plot indicate higher true positives and lower false negatives.
If you are confused, remember, when we predict a binary outcome, it is either a correct prediction (true positive) or not (false positive). There is a tension between these options, the same with true negative and false negative.
A skilful model will assign a higher probability to a randomly chosen real positive occurrence than a negative occurrence on average. This is what we mean when we say that the model has skill. Generally, skilful models are represented by curves that bow up to the top left of the plot.
A no-skill classifier is one that cannot discriminate between the classes and would predict a random class or a constant class in all cases. A model with no skill is represented at the point (0.5, 0.5). A model with no skill at each threshold is represented by a diagonal line from the bottom left of the plot to the top right and has an AUC of 0.5.
A model with perfect skill is represented at a point (0,1). A model with perfect skill is represented by a line that travels from the bottom left of the plot to the top left and then across the top to the top right.
An operator may plot the ROC curve for the final model and choose a threshold that gives a desirable balance between the false positives and false negatives.
Want to Learn Probability for Machine Learning
Take my free 7-day email crash course now (with sample code).
Click to sign-up and also get a free PDF Ebook version of the course.
ROC Curves and AUC in Python
We can plot a ROC curve for a model in Python using the roc_curve() scikit-learn function.
The function takes both the true outcomes (0,1) from the test set and the predicted probabilities for the 1 class. The function returns the false positive rates for each threshold, true positive rates for each threshold and thresholds.
|
1 2 3 |
... # calculate roc curve fpr, tpr, thresholds = roc_curve(y, probs) |
The AUC for the ROC can be calculated using the roc_auc_score() function.
Like the roc_curve() function, the AUC function takes both the true outcomes (0,1) from the test set and the predicted probabilities for the 1 class. It returns the AUC score between 0.0 and 1.0 for no skill and perfect skill respectively.
|
1 2 3 4 |
... # calculate AUC auc = roc_auc_score(y, probs) print('AUC: %.3f' % auc) |
A complete example of calculating the ROC curve and ROC AUC for a Logistic Regression model on a small test problem is listed below.
|
1 2 3 4 5 6 7 8 9 10 11 12 13 14 15 16 17 18 19 20 21 22 23 24 25 26 27 28 29 30 31 32 33 34 35 36 37 38 39 40 |
import matplotlib.pyplot as plt # roc curve and auc from sklearn.datasets import make_classification from sklearn.linear_model import LogisticRegression from sklearn.model_selection import train_test_split from sklearn.metrics import roc_curve from sklearn.metrics import roc_auc_score # generate 2 class dataset X, y = make_classification(n_samples=1000, n_classes=2, random_state=1) # split into train/test sets trainX, testX, trainy, testy = train_test_split(X, y, test_size=0.5, random_state=2) # generate a no skill prediction (majority class) ns_probs = [0 for _ in range(len(testy))] # fit a model model = LogisticRegression(solver='lbfgs') model.fit(trainX, trainy) # predict probabilities lr_probs = model.predict_proba(testX) # keep probabilities for the positive outcome only lr_probs = lr_probs[:, 1] # calculate scores ns_auc = roc_auc_score(testy, ns_probs) lr_auc = roc_auc_score(testy, lr_probs) # summarize scores print('No Skill: ROC AUC=%.3f' % (ns_auc)) print('Logistic: ROC AUC=%.3f' % (lr_auc)) # calculate roc curves ns_fpr, ns_tpr, _ = roc_curve(testy, ns_probs) lr_fpr, lr_tpr, _ = roc_curve(testy, lr_probs) # plot the roc curve for the model plt.plot(ns_fpr, ns_tpr, linestyle='--', label='No Skill') plt.plot(lr_fpr, lr_tpr, marker='.', label='Logistic') # axis labels plt.xlabel('False Positive Rate') plt.ylabel('True Positive Rate') # show the legend plt.legend() # show the plot plt.show() |
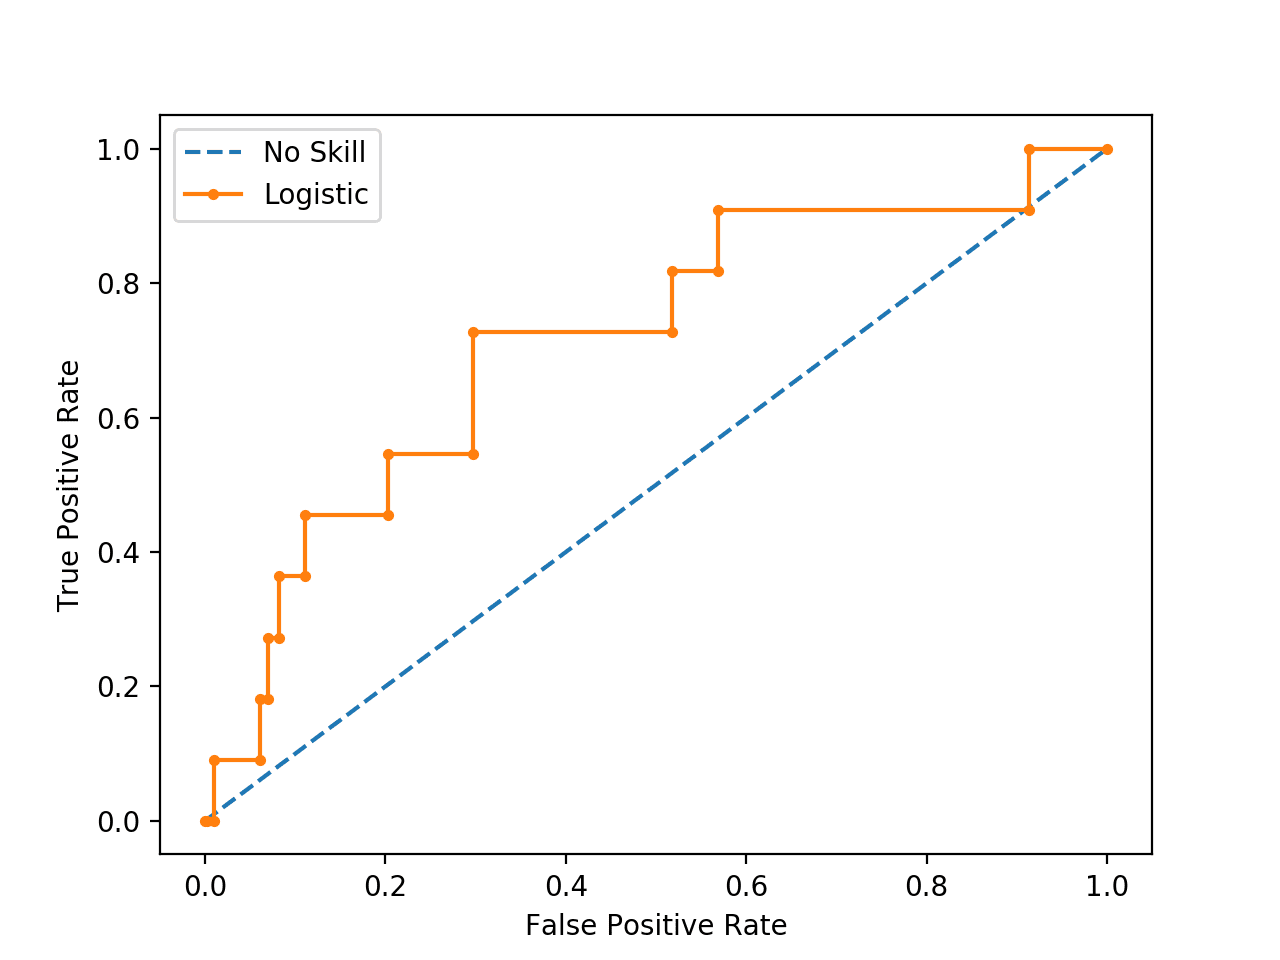
Running the example prints the ROC AUC for the logistic regression model and the no skill classifier that only predicts 0 for all examples.
|
1 2 |
No Skill: ROC AUC=0.500 Logistic: ROC AUC=0.903 |
A plot of the ROC curve for the model is also created showing that the model has skill.
Note: Your results may vary given the stochastic nature of the algorithm or evaluation procedure, or differences in numerical precision. Consider running the example a few times and compare the average outcome.

ROC Curve Plot for a No Skill Classifier and a Logistic Regression Model
What Are Precision-Recall Curves?
There are many ways to evaluate the skill of a prediction model.
An approach in the related field of information retrieval (finding documents based on queries) measures precision and recall.
These measures are also useful in applied machine learning for evaluating binary classification models.
Precision is a ratio of the number of true positives divided by the sum of the true positives and false positives. It describes how good a model is at predicting the positive class. Precision is referred to as the positive predictive value.
|
1 |
Positive Predictive Power = True Positives / (True Positives + False Positives) |
or
|
1 |
Precision = True Positives / (True Positives + False Positives) |
Recall is calculated as the ratio of the number of true positives divided by the sum of the true positives and the false negatives. Recall is the same as sensitivity.
|
1 |
Recall = True Positives / (True Positives + False Negatives) |
or
|
1 |
Sensitivity = True Positives / (True Positives + False Negatives) |
|
1 |
Recall == Sensitivity |
Reviewing both precision and recall is useful in cases where there is an imbalance in the observations between the two classes. Specifically, there are many examples of no event (class 0) and only a few examples of an event (class 1).
The reason for this is that typically the large number of class 0 examples means we are less interested in the skill of the model at predicting class 0 correctly, e.g. high true negatives.
Key to the calculation of precision and recall is that the calculations do not make use of the true negatives. It is only concerned with the correct prediction of the minority class, class 1.
A precision-recall curve is a plot of the precision (y-axis) and the recall (x-axis) for different thresholds, much like the ROC curve.
A no-skill classifier is one that cannot discriminate between the classes and would predict a random class or a constant class in all cases. The no-skill line changes based on the distribution of the positive to negative classes. It is a horizontal line with the value of the ratio of positive cases in the dataset. For a balanced dataset, this is 0.5.
While the baseline is fixed with ROC, the baseline of [precision-recall curve] is determined by the ratio of positives (P) and negatives (N) as y = P / (P + N). For instance, we have y = 0.5 for a balanced class distribution …
A model with perfect skill is depicted as a point at (1,1). A skilful model is represented by a curve that bows towards (1,1) above the flat line of no skill.
There are also composite scores that attempt to summarize the precision and recall; two examples include:
- F-Measure or F1 score: that calculates the harmonic mean of the precision and recall (harmonic mean because the precision and recall are rates).
- Area Under Curve: like the AUC, summarizes the integral or an approximation of the area under the precision-recall curve.
In terms of model selection, F-Measure summarizes model skill for a specific probability threshold (e.g. 0.5), whereas the area under curve summarize the skill of a model across thresholds, like ROC AUC.
This makes precision-recall and a plot of precision vs. recall and summary measures useful tools for binary classification problems that have an imbalance in the observations for each class.
Precision-Recall Curves in Python
Precision and recall can be calculated in scikit-learn.
The precision and recall can be calculated for thresholds using the precision_recall_curve() function that takes the true output values and the probabilities for the positive class as input and returns the precision, recall and threshold values.
|
1 2 3 |
... # calculate precision-recall curve precision, recall, thresholds = precision_recall_curve(testy, probs) |
The F-Measure can be calculated by calling the f1_score() function that takes the true class values and the predicted class values as arguments.
|
1 2 3 |
... # calculate F1 score f1 = f1_score(testy, yhat) |
The area under the precision-recall curve can be approximated by calling the auc() function and passing it the recall (x) and precision (y) values calculated for each threshold.
|
1 2 3 |
... # calculate precision-recall AUC auc = auc(recall, precision) |
When plotting precision and recall for each threshold as a curve, it is important that recall is provided as the x-axis and precision is provided as the y-axis.
The complete example of calculating precision-recall curves for a Logistic Regression model is listed below.
|
1 2 3 4 5 6 7 8 9 10 11 12 13 14 15 16 17 18 19 20 21 22 23 24 25 26 27 28 29 30 31 32 33 34 35 36 37 |
import matplotlib.pyplot as plt # precision-recall curve and f1 from sklearn.datasets import make_classification from sklearn.linear_model import LogisticRegression from sklearn.model_selection import train_test_split from sklearn.metrics import precision_recall_curve from sklearn.metrics import f1_score from sklearn.metrics import auc # generate 2 class dataset X, y = make_classification(n_samples=1000, n_classes=2, random_state=1) # split into train/test sets trainX, testX, trainy, testy = train_test_split(X, y, test_size=0.5, random_state=2) # fit a model model = LogisticRegression(solver='lbfgs') model.fit(trainX, trainy) # predict probabilities lr_probs = model.predict_proba(testX) # keep probabilities for the positive outcome only lr_probs = lr_probs[:, 1] # predict class values yhat = model.predict(testX) lr_precision, lr_recall, _ = precision_recall_curve(testy, lr_probs) lr_f1, lr_auc = f1_score(testy, yhat), auc(lr_recall, lr_precision) # summarize scores print('Logistic: f1=%.3f auc=%.3f' % (lr_f1, lr_auc)) # plot the precision-recall curves no_skill = len(testy[testy==1]) / len(testy) plt.plot([0, 1], [no_skill, no_skill], linestyle='--', label='No Skill') plt.plot(lr_recall, lr_precision, marker='.', label='Logistic') # axis labels plt.xlabel('Recall') plt.ylabel('Precision') # show the legend plt.legend() # show the plot plt.show() |
Running the example first prints the F1, area under curve (AUC) for the logistic regression model.
Note: Your results may vary given the stochastic nature of the algorithm or evaluation procedure, or differences in numerical precision. Consider running the example a few times and compare the average outcome.
|
1 |
Logistic: f1=0.841 auc=0.898 |
The precision-recall curve plot is then created showing the precision/recall for each threshold for a logistic regression model (orange) compared to a no skill model (blue).
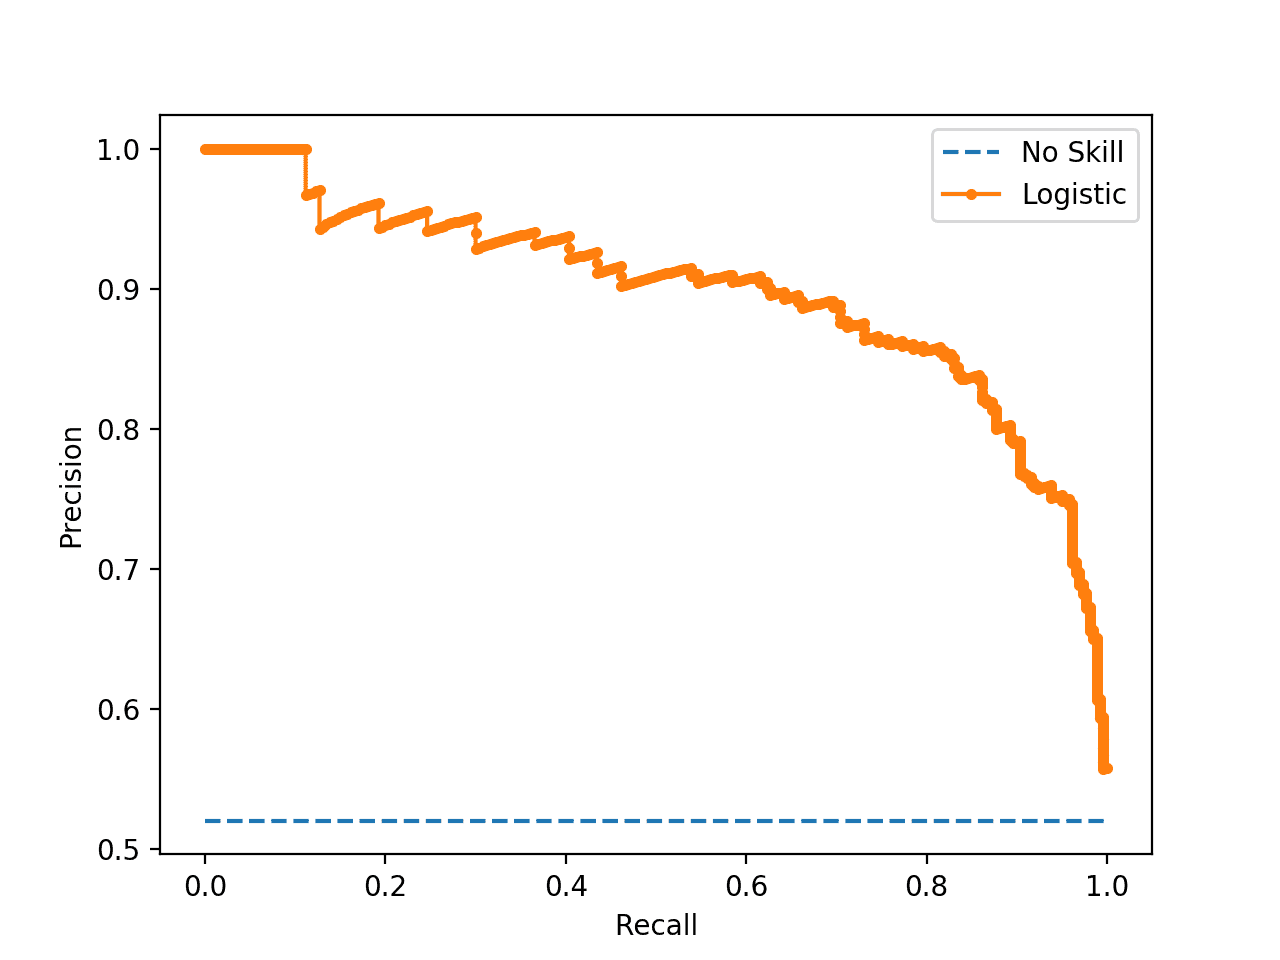
Precision-Recall Plot for a No Skill Classifier and a Logistic Regression Model
When to Use ROC vs. Precision-Recall Curves?
Generally, the use of ROC curves and precision-recall curves are as follows:
- ROC curves should be used when there are roughly equal numbers of observations for each class.
- Precision-Recall curves should be used when there is a moderate to large class imbalance.
The reason for this recommendation is that ROC curves present an optimistic picture of the model on datasets with a class imbalance.
However, ROC curves can present an overly optimistic view of an algorithm’s performance if there is a large skew in the class distribution. […] Precision-Recall (PR) curves, often used in Information Retrieval , have been cited as an alternative to ROC curves for tasks with a large skew in the class distribution.
— The Relationship Between Precision-Recall and ROC Curves, 2006.
Some go further and suggest that using a ROC curve with an imbalanced dataset might be deceptive and lead to incorrect interpretations of the model skill.
[…] the visual interpretability of ROC plots in the context of imbalanced datasets can be deceptive with respect to conclusions about the reliability of classification performance, owing to an intuitive but wrong interpretation of specificity. [Precision-recall curve] plots, on the other hand, can provide the viewer with an accurate prediction of future classification performance due to the fact that they evaluate the fraction of true positives among positive predictions
The main reason for this optimistic picture is because of the use of true negatives in the False Positive Rate in the ROC Curve and the careful avoidance of this rate in the Precision-Recall curve.
If the proportion of positive to negative instances changes in a test set, the ROC curves will not change. Metrics such as accuracy, precision, lift and F scores use values from both columns of the confusion matrix. As a class distribution changes these measures will change as well, even if the fundamental classifier performance does not. ROC graphs are based upon TP rate and FP rate, in which each dimension is a strict columnar ratio, so do not depend on class distributions.
— ROC Graphs: Notes and Practical Considerations for Data Mining Researchers, 2003.
We can make this concrete with a short example.
Below is the same ROC Curve example with a modified problem where there is a ratio of about 100:1 ratio of class=0 to class=1 observations (specifically Class0=985, Class1=15).
|
1 2 3 4 5 6 7 8 9 10 11 12 13 14 15 16 17 18 19 20 21 22 23 24 25 26 27 28 29 30 31 32 33 34 35 36 37 38 39 40 |
import matplotlib.pyplot as plt # roc curve and auc on an imbalanced dataset from sklearn.datasets import make_classification from sklearn.linear_model import LogisticRegression from sklearn.model_selection import train_test_split from sklearn.metrics import roc_curve from sklearn.metrics import roc_auc_score # generate 2 class dataset X, y = make_classification(n_samples=1000, n_classes=2, weights=[0.99,0.01], random_state=1) # split into train/test sets trainX, testX, trainy, testy = train_test_split(X, y, test_size=0.5, random_state=2) # generate a no skill prediction (majority class) ns_probs = [0 for _ in range(len(testy))] # fit a model model = LogisticRegression(solver='lbfgs') model.fit(trainX, trainy) # predict probabilities lr_probs = model.predict_proba(testX) # keep probabilities for the positive outcome only lr_probs = lr_probs[:, 1] # calculate scores ns_auc = roc_auc_score(testy, ns_probs) lr_auc = roc_auc_score(testy, lr_probs) # summarize scores print('No Skill: ROC AUC=%.3f' % (ns_auc)) print('Logistic: ROC AUC=%.3f' % (lr_auc)) # calculate roc curves ns_fpr, ns_tpr, _ = roc_curve(testy, ns_probs) lr_fpr, lr_tpr, _ = roc_curve(testy, lr_probs) # plot the roc curve for the model plt.plot(ns_fpr, ns_tpr, linestyle='--', label='No Skill') plt.plot(lr_fpr, lr_tpr, marker='.', label='Logistic') # axis labels plt.xlabel('False Positive Rate') plt.ylabel('True Positive Rate') # show the legend plt.legend() # show the plot plt.show() |
Running the example suggests that the model has skill.
Note: Your results may vary given the stochastic nature of the algorithm or evaluation procedure, or differences in numerical precision. Consider running the example a few times and compare the average outcome.
|
1 2 |
No Skill: ROC AUC=0.500 Logistic: ROC AUC=0.716 |
Indeed, it has skill, but all of that skill is measured as making correct true negative predictions and there are a lot of negative predictions to make.
If you review the predictions, you will see that the model predicts the majority class (class 0) in all cases on the test set. The score is very misleading.
A plot of the ROC Curve confirms the AUC interpretation of a skilful model for most probability thresholds.
ROC Curve Plot for a No Skill Classifier and a Logistic Regression Model for an Imbalanced Dataset
We can also repeat the test of the same model on the same dataset and calculate a precision-recall curve and statistics instead.
The complete example is listed below.
|
1 2 3 4 5 6 7 8 9 10 11 12 13 14 15 16 17 18 19 20 21 22 23 24 25 26 27 28 29 30 31 32 33 34 35 36 37 38 39 |
import matplotlib.pyplot as plt # precision-recall curve and f1 for an imbalanced dataset from sklearn.datasets import make_classification from sklearn.linear_model import LogisticRegression from sklearn.model_selection import train_test_split from sklearn.metrics import precision_recall_curve from sklearn.metrics import f1_score from sklearn.metrics import auc # generate 2 class dataset X, y = make_classification(n_samples=1000, n_classes=2, weights=[0.99,0.01], random_state=1) # split into train/test sets trainX, testX, trainy, testy = train_test_split(X, y, test_size=0.5, random_state=2) # fit a model model = LogisticRegression(solver='lbfgs') model.fit(trainX, trainy) # predict probabilities lr_probs = model.predict_proba(testX) # keep probabilities for the positive outcome only lr_probs = lr_probs[:, 1] # predict class values yhat = model.predict(testX) # calculate precision and recall for each threshold lr_precision, lr_recall, _ = precision_recall_curve(testy, lr_probs) # calculate scores lr_f1, lr_auc = f1_score(testy, yhat), auc(lr_recall, lr_precision) # summarize scores print('Logistic: f1=%.3f auc=%.3f' % (lr_f1, lr_auc)) # plot the precision-recall curves no_skill = len(testy[testy==1]) / len(testy) plt.plot([0, 1], [no_skill, no_skill], linestyle='--', label='No Skill') plt.plot(lr_recall, lr_precision, marker='.', label='Logistic') # axis labels plt.xlabel('Recall') plt.ylabel('Precision') # show the legend plt.legend() # show the plot plt.show() |
Running the example first prints the F1 and AUC scores.
Note: Your results may vary given the stochastic nature of the algorithm or evaluation procedure, or differences in numerical precision. Consider running the example a few times and compare the average outcome.
We can see that the model is penalized for predicting the majority class in all cases. The scores show that the model that looked good according to the ROC Curve is in fact barely skillful when considered using using precision and recall that focus on the positive class.
|
1 |
Logistic: f1=0.000 auc=0.054 |
The plot of the precision-recall curve highlights that the model is just barely above the no skill line for most thresholds.
This is possible because the model predicts probabilities and is uncertain about some cases. These get exposed through the different thresholds evaluated in the construction of the curve, flipping some class 0 to class 1, offering some precision but very low recall.
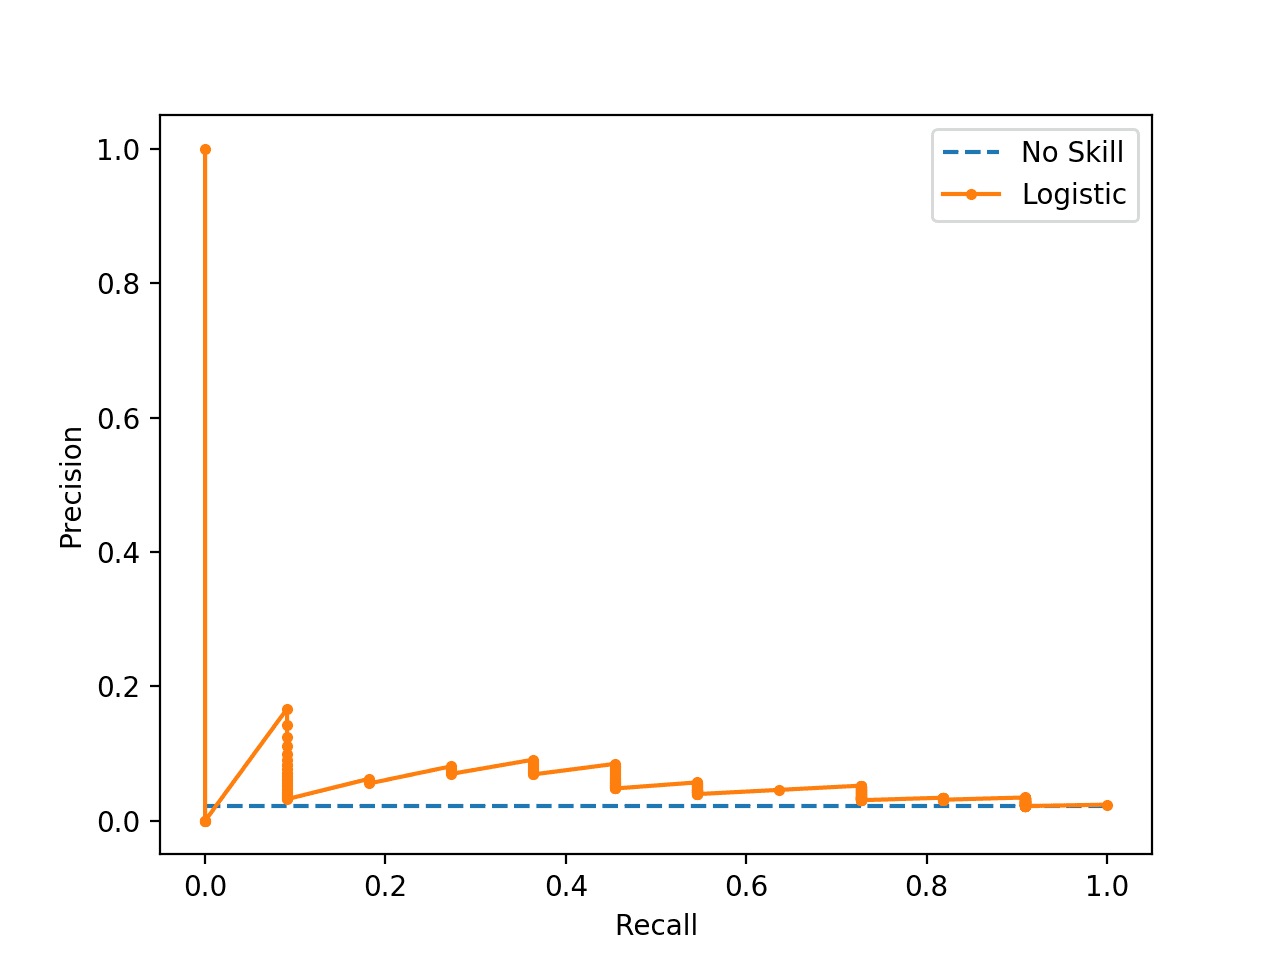
Precision-Recall Plot for a No Skill Classifier and a Logistic Regression Model for am Imbalanced Dataset
Further Reading
This section provides more resources on the topic if you are looking to go deeper.
Papers
- A critical investigation of recall and precision as measures of retrieval system performance, 1989.
- The Relationship Between Precision-Recall and ROC Curves, 2006.
- The Precision-Recall Plot Is More Informative than the ROC Plot When Evaluating Binary Classifiers on Imbalanced Datasets, 2015.
- ROC Graphs: Notes and Practical Considerations for Data Mining Researchers, 2003.
API
- sklearn.metrics.roc_curve API
- sklearn.metrics.roc_auc_score API
- sklearn.metrics.precision_recall_curve API
- sklearn.metrics.auc API
- sklearn.metrics.average_precision_score API
- Precision-Recall, scikit-learn
- Precision, recall and F-measures, scikit-learn
Articles
- Receiver operating characteristic on Wikipedia
- Sensitivity and specificity on Wikipedia
- Precision and recall on Wikipedia
- Information retrieval on Wikipedia
- F1 score on Wikipedia
- ROC and precision-recall with imbalanced datasets, blog.
Summary
In this tutorial, you discovered ROC Curves, Precision-Recall Curves, and when to use each to interpret the prediction of probabilities for binary classification problems.
Specifically, you learned:
- ROC Curves summarize the trade-off between the true positive rate and false positive rate for a predictive model using different probability thresholds.
- Precision-Recall curves summarize the trade-off between the true positive rate and the positive predictive value for a predictive model using different probability thresholds.
- ROC curves are appropriate when the observations are balanced between each class, whereas precision-recall curves are appropriate for imbalanced datasets.
Do you have any questions?
Ask your questions in the comments below and I will do my best to answer.
Get a Handle on Probability for Machine Learning!
Develop Your Understanding of Probability
...with just a few lines of python codeDiscover how in my new Ebook:
Probability for Machine Learning
It provides self-study tutorials and end-to-end projects on:
Bayes Theorem, Bayesian Optimization, Distributions, Maximum Likelihood, Cross-Entropy, Calibrating Models
and much more...


I don’t think a diagonal straight line is the right baseline for P/R curve. The baseline “dumb” classifier should be a straight line with precision=positive%
You’re right, thanks!
Fixed.
Thanks for the intro on the topic:
The following line raises questions:
>>> The scores do not look encouraging, given skilful models are generally above 0.5.
The baseline of a random model is n_positive/(n_positive+n_negative). Or just the fraction of positives, so it makes sense to compare auc of precision-recall curve to that.
Sorry, I don’t follow your question. Can you elaborate?
I’m sorry I was not clear enough above.
Here’s what I meant:
for ROC the auc of the random model is 0.5.
for PR curve the auc of the random model is n_positive/(n_positive+n_negative).
Perhaps it would make sense to highlight that the PR auc should be compared to n_positive/(n_positive+n_negative)?
In the first reading the phrase
>>> The scores do not look encouraging, given skilful models are generally above 0.5.
in the context of PR curve auc looked ambiguous.
Thank you!
Thanks.
I second Alexander on this, .
The random classifier in PR curve gives an AUPR of 0.1
The AUPR is better for imbalanced datasets because it shows that there is still room for improvement, while AUROC seems saturated.
A few comments on the precision-recall plots from your 10/2019 edit:
In your current precision-recall plot, the baseline is a diagonal straight line for no-skill, which does not seem to be right: the no-skill model either predicts only negatives (precision=0 (!), recall=0) or only positives (precision=fraction of positives in the dataset, recall=1).
The function precision_recall_curve() returns the point (precision=1,recall=0), but it shouldn’t in this case, because no positive predictions are made.
Also, the diagonal line is misleading, because precision_recall_curve() actually only returns two points, which are then connected. The points on the line cannot be achieved by the no-skill model.
Moreover, in my opinion the right precision-recall baseline to compare a model to is a random model resulting in a horizontal line with precision = fraction of positives in the dataset.
Thanks Theresa, I will investigate.
Hi, did you get why the precision_recall_curve returns the point (precision=1,recall=0) ? Thanks.
Hi Yakun…The following resource may be of interest to you:
https://developers.google.com/machine-learning/crash-course/classification/roc-and-auc
Great tutorial.
Thanks!
How about the Mathews Correlation Coefficient ?
I’ve not used it, got some refs?
This is a nice simple explanation
https://lettier.github.io/posts/2016-08-05-matthews-correlation-coefficient.html
I have also been advised that in the field of horse racing ratings produced using ML if you already have probabilistic outputs, then it makes much more sense to use a metric directly on the probabilities themselves (eg: McFadden’s pseudo-R^2, Brier score, etc).
Thanks.
Do you not think that a model with no skill (which I assume means a random coin toss) should have an AUC of 0.5 and not 0.0?
A ROC AUC of 0.0 means that the model is perfectly in-correct.
A ROC AUC of 0.5 would be a naive model.
I do not know what you mean by a naive model. Going by what you’ve used to describe a model with no skill, it should have an AUC of 0.5 while a model that perfectly misclassifies every point will have an AUC of 0.
Perfectly misclassifying every point is just as hard as perfectly classifying every point.
A naive model is still right sometimes. The most common naive model always predicts the most common class, and such a model will have a minimum AUC of 0.5.
Excellent point, thanks!
Thanks for explaining the difference in simpler way.
I’m happy it helped.
there’s a typo here, should be “is”:
“A common way to compare models that predict probabilities for two-class problems us to use a
ROC curve.”
nice article 🙂 thanks for sharing!
Thanks, fixed!
Average precision is in fact just area under precision-recall curve. Very misleading that you “compared them”. Differences are due to different implementations in sklearn. Auc interpolates the precision recall curve linearly while the average precision uses a piecewise constant discritization
Thanks Tony.
I don’t believe we are comparing them, they are different measures.
“To make this clear:
Larger values on the x-axis of the plot indicate higher true positives and lower false negatives.
Smaller values on the y-axis of the plot indicate lower false positives and higher true negatives.”
Should swap x & y in this description of ROC curves??
You’re right, fixed. Thanks!
Hi, Thanks for the nice tutorial 🙂
I have one comment though.
you have written that ‘A model with no skill at each threshold is represented by a diagonal line from the bottom left of the plot to the top right and has an AUC of 0.0.’
I think AUC is the area under the curve of ROC. According to your Explantation (diagonal line from the bottom left of the plot to the top right) the area under the the diagonal line that passes through (0.5, 0.5) is 0.5 and not 0. Thus in this case AUC = 0. 5(?)
Maybe I misunderstood sth here.
You’re correct, fixed.
Hi Jason.
I went through your nice tutorial again and a question came to my mind.
Within sklearn, it is possible that we use the average precision score to evaluate the skill of the model (applied on highly imbalanced dataset) and perform cross validation. For some ML algorithms like Lightgbm we can not use such a metric for cross validation, instead there are other metrics such as binary logloss.
The question is that does binary logloss is a good metric as average precision score for such kind of imbalanced problems?
Yes, log loss (cross entropy) can be a good measure for imbalanced classes. It captures the difference in the predicted and actual probability distributions.
Hi Jason,
Thank you for a summary.
Your statement
“Generally, the use of ROC curves and precision-recall curves are as follows:
* ROC curves should be used when there are roughly equal numbers of observations for each class.
* Precision-Recall curves should be used when there is a moderate to large class imbalance.”
…is misleading, if not just wrong. Even articles you cite do not say that.
Usually it is advised to use PRC in addition to ROC for highly inbalanced datatsets, which means for dataset with ratio of positives to negatives less then 1:100 or so. Moreover, high ideas around PRC are aimed at having no negatives for high values of scores, only positives. It just might not be the goal of the study and classifier. Also, as mentioned in one of the articles you cite, AUROC can be misleading even for balanced datasets, as it “weights” equally true positives and true negatives. I would also mention that AUROC is an estimator of the “probability that a classifier will rank a randomly chosen positive instance higher than a randomly chosen negative one” and that it is related to Mann–Whitney U test.
To sum it up, I would always recommend to
1) Use AUROC, AUPRC, accuracy and any other metrics which are relevant to the goals of the study
2) Plot distributions of positives and negatives and analyse it
Let me know what you think
Thanks for the note.
Hi Jason,
in these examples, you always use APIs, so all of them have calculated functions. But I dont understand how to use the equations, for example:
True Positive Rate = True Positives / (True Positives + False Negatives)
this ‘True Positives’ are all single float numbers, then how we have array to plot?
(True Positives + False Negatives): is sum of total final predicted of test data?
I really confuse when calculate by hand
They are counts, e.g. the number of examples that were true positives, etc.
Can you please explain how to plot roc curve for multilabel classification.
Generally, ROC Curves are not used for multi-label classification, as far as I know.
Hi Jason,
I’ve plotted ROC which you can see in the following link but I don’t know why it’s not like a real ROC.
Could you please check oy out and let me what could be my mistake?
https://imgur.com/a/WWq0bl2
hist = model.fit(x_train, y_train, batch_size= 10, epochs= 10, verbose= 2)
y_predic = model.predict(x_test)
y_predic = (y_predic> 0.5)
fpr, tpr, thresholds = metrics.roc_curve(y_test, y_predic)
plt.figure()
plt.plot([0, 1], [0, 1], ‘k–‘)
plt.plot(fpr, tpr)
plt.xlabel(‘False positive rate’, fontsize = 16)
plt.ylabel(‘True positive rate’, fontsize = 16)
plt.title(‘ROC curve’, fontsize = 16)
plt.legend(loc=’best’, fontsize = 14)
plt.show()
I’m happy to answer questions, but I don’t have the capacity to debug your code sorry.
Thanks a lot for your reply.
No, I meant if it’s possible please check the plot and let me know your idea about it.
Hi Jason,
sorry, there’s a little confusing here,
we generate 2 classes dataset, why we use n_neighbors=3?
appreciate your help.
Alex
Yes, 2 classes is unrelated to the number of samples (k=3) used in kNN.
A dataset is comprised of many examples or rows of data, some will belong to class 0 and some to class 1. We will look at 3 sample in kNN to choose the class of a new example.
Hi, Jason, on top of this part of the code, you mentioned that “A complete example of calculating the ROC curve and AUC for a logistic regression model on a small test problem is listed below”. Is the KNN considered a “logistic regression”? I’m a little confused.
Looks like a typo. Fixed. Thanks!
Hi Jason, thank you for your excellent tutorials!
Is it EXACTLY the same to judge a model by PR-AUC vs F1-score? since both metrics rely exclusively on Precision and Recall? or am I missing something here?
thanks!
I don’t think so, off the cuff.
Nice post — what inferences may we make for a particular segment of a PR curve that is monotonically increasing (i.e. as recall increases, precision increases) vs another segment where the PR curve is monotonically decreasing (i.e. as recall increases, precision decreases)?
In the PR curve, it should be decreasing, never increasing – it will always have the same general shape downward.
If not, it might be a case of poorly calibrated predictions/model or highly imbalance data (e.g. like in the tutorial) resulting in an artefact in the precision/recall relationship.
I have been thinking about the same, https://stats.stackexchange.com/questions/183504/are-precision-and-recall-supposed-to-be-monotonic-to-classification-threshold the first answer here has a simple demonstration of why the y-axis (precision) is not monotonically decreasing while x-axis(recall) is monotonically increasing while threshold decreases, because at each threshold step, either the numerator or denominator may grow for precision, but only the numerator may grow for recall.
Thanks for sharing.
I think that’s VERY wrong. 🙁
Hi Jason,
great stuff as usual. Just a small thing but may cause slight confusion, in the code for all precision-recall curves the comment indicates a ROC curve.
# plot the roc curve for the model
pyplot.plot(recall, precision, marker=’.’)
Regards
Gerry
Thanks, fixed!
Hi Jason,
Thanks for the article! You always wrote articles I have trouble finding answers anywhere else. This is an awesome summary! A quick question – when you used ‘smog system’ as an example to describe FP vs. FN cost, did you mean we will be more concerns about HIGH FN than HIGH FP? Correct me if I did not get what you meant.
Regards,
Sunny
Thanks.
Yes, it might be confusing. I was saying we want (are concerned with) low false neg, not false pos.
High false neg is a problem, high false pos is less of a problem.
Hi Jason,
How do we decide on what is a good operating point for precision% and recall %? I know it depends on the use case, but can you give your thoughts on how to approach it?
Thanks!
Yes, establish a baseline score with a naive method, and compare more sophisticated methods to the baseline.
Great post. Thank you Jason.
One query. what is the difference between area under the PR curve and the average precision score? Both have similar definitions I guess.
Also what approach do you recommend for selecting a threshold from the precision-recall curve, like the way we can use Youden’s index for ROC curve?
I’d recommend looking at the curve for your model and choose a point where the trade off makes sense for your domain/stakeholders.
Great question. They are similar.
I can’t give a good answer off the cuff, I’d have to write about about it and go through worked examples.
I am guessing both average precision score and area under precision recall curve are same. The difference arises in the way these metrics are calculated. As per the documentation page for AUC, it says
“Compute Area Under the Curve (AUC) using the trapezoidal rule
This is a general function, given points on a curve. For computing the area under the ROC-curve, see roc_auc_score. For an alternative way to summarize a precision-recall curve, see average_precision_score.”
So i guess, it finds the area under any curve using trapezoidal rule which is not the case with average_precision_score.
Thanks for the nice and clear post 🙂
Shouldn’t it be “false negatives” instead of “false positives” in the following phrase:
“here is a tension between these options, the same with true negative and false positives.”
I think you’re right. Fixed.
Thanks for the nice and clear article.
i used GaussianNB model, i got the thresholds [2.00000e+000, 1.00000e+000, 1.00000e+000, 9.59632e-018 ].
is it noraml that the thresholds have very small value??
thanx in advance
This line makes no sense to me at all : “Indeed, it has skill, but much of that skill is measured as making correct false negative predictions”
What is a “correct false negative”? The “correct” to my current understanding consist TP and TN, not FP or FN. If it’s correct, why is it false? If it’s false, how can it be correct?
Could you explain correct according to what? y_true or something else?
Looks like a typo, I believe I wanted to talk about true negatives, e.g. the abundant class.
Fixed. Thanks.
Great post, I found this very intuitive.
But why keep probabilities for the positive outcome only for the precision_recall_curve?
I tried with the probabilities for the negative class and the plot was weird. Please, I will like you to explain the intuition behind using the probabilities for the positive outcome and not the one for the negative outcome?
Actually scikit learn “predict_proba()” predict probability for each class for a row and it sums upto 1. In binary classification case, it predicts the probability for an example to be negative and positive and 2nd column shows how much probability of an example belongs to positive class.
When we pass only positive probability, ROC evaluate on different thresholds and check if given probability > threshold (say 0.5), it belongs to positive class otherwise it belongs to negative class. Similarly, it evaluates on different thresholds and give roc_auc score.
Thanks for explaining the ROC curve, i would like to aske how i can compare the Roc curves of many algorithms means SVM knn, RandomForest and so on.
Typically they are all plotted together.
You can also compare the Area under the ROC Curve for each algorithm.
can anyone explain whats the significance of average precision score?
Yes, see this:
https://en.wikipedia.org/wiki/Evaluation_measures_(information_retrieval)#Mean_average_precision
Thanks a lot for this tutourial. There are actually not a lot of resources like this.
Thanks, I’m glad it helped!
Hi Jason,
thank you for your tutorial!
I have a question about the F1 score, because i know the best value is 1 (perfect precision and recall) and worst value is 0, but i’m wondering if there is a minimun standard value.
I’m obtaining a F score of 0.44, because i have high false positives, but a few false negatives. But i don’t know if 0.44 is enough to say that i have a good model. Do you know is there is a standard in the literature? for example in ROC about 0.75 is good
Thanks
Yes, the F1 score returned from a naive classification model:
https://machinelearningmastery.com/how-to-develop-and-evaluate-naive-classifier-strategies-using-probability/
Hi Jason,
Thanks for the explaining these concepts in simple words!
I have a little confusion. You mentioned Roc would be a better choice if we have a balanced dataset, and precision-recall for an imbalanced dataset. But if we get an imbalanced dataset, will we not try to balance it out first and then start with the models?
Regards,
Bishal Mandal
We may decide to balance the training set, but not the test set used as the basis for making predictions.
i was thinking about this whole day 🙂 .Thanks
HI.could you tell me whether i can create roc curve in this way or not ?
y_test=my test data ground truth (6500,1)
x_test= my test data (6500,3001)
prediction=model.predict(x_test)
fpr,tpr,thresholds=roc_curve(y_test,prediction)
plt.plot(fpr,tpr)
plt.show()
auc = roc_auc_score(y_test, prediction)
I can’t debug your example sorry.
Perhaps try it?
Thanks,it’s solved.
Happy to hear that.
Sorry i have another question .when i saw the thresholds array elements , i noticed that its first element is about 1.996 . How is it possible ? thresholds should be between 0 and 1 , isn’t it ?
Thanks again
Also i check it in your code , and it is the same , you’re first element of thresholds is 2 !
Could yo tell me how the number of thresholds elements are obtained ? for example in your code you have thresholds have 5 elements but in my problem it has 1842 element
Perhaps double check the value?
I suggest carefully rereading Aleks post and considering rephrasing your statement about the ROC is just for balanced data at the end, which it isn’t. The PlosONE papers title is misleading. It is true ROC in cases of N >> P can give a high AUC, but many false positives, and PR curve is more sensitive to that. But it all depends on your objectives and I refer you to the papers of David Powers to read about the many preferable statistical properties of the ROC to the PROC. https://stats.stackexchange.com/questions/7207/roc-vs-precision-and-recall-curves, he has written an excellent straightforward summary here which could be used to improve this blog post.
Great blog btw.
Thanks Chris, I’ll take another run at the paper.
my precision and recall curve goes up to the end but at the end it crashs. do you know why and is this ok? thanks.
Sorry to hear it crashes, why error does it give?
Many thanks Jason for this tutorial
I would like to ask about the ROC Curves and Precision-Recall Curves for deep multi-label Classification.
I was able to plot the confusion matrices for all the labels with sklearn.matrics (multilabel_confusion_matrix).. My question is, How can I plot the ROC Curves and Precision-Recall Curves for all the labels?
I appreciate any help.
Thanks a lot.
Generally PR Curves and ROC Curves are for 2-class problems only.
Thanks a lot Jason for your reply.
so what are the evaluation matrices for multi-label classification?
Just the ACC and Loss?
It depends on what is important for your problem.
Log loss is a good place to start for multiclass. For multilabel (something else entirely), average precision or F1 is good.
My best advice is to go back to stakeholders or domain experts, figure out what is the most important about the model, then choose a metric that captures that. You can get a good feeling for this by taking a few standard measures and running mock predictions through it to see what scores it gives and whether it tells a good story for you/stakeholders.
Great!
Many thanks Jason.
You’re welcome.
Hello sir , thank you for your excellent tutorials!
i am facing a problem when ever i show the roc curve i get the following error
File “C:\Program Files\Python37\lib\site-packages\sklearn\metrics\base.py”, line 73, in _average_binary_score raise ValueError(“{0} format is not supported”.format(y_type))
ValueError: multiclass format is not supported
sir please help me to solve this issue. Thanks
ROC Curves can only be used for binary (2 class) classification problems.
It was very useful. Thanks for helping beginners like us with an apt explanation
I’m happy to hear that.
Hi Jason,
I am dealing with a medical database for prediction of extreme rare event (0.6% chance of occurrence). I have 10 distinct features, 28,597 samples from class 0 and 186 from class 1.
I have developed several models. Also, I have tried to downsample the training set to make a balanced training set and tested on imbalanced test set.
Unfortunately regardless of my model the PR curve is similar to “Precision-Recall Plot for a No Skill Classifier and a Logistic Regression Model for am Imbalanced Dataset” figure in this post.
Any idea how can I deal with this database? I would appreciate any suggestion!
Yes, some ideas:
– try standard models with a range of data scaling
– try class weighted versions of models like logistic regression, svm, etc.
– try undersampling methods
– try over sampling methods
– try combinations of over and under sampling on the same training set
– try one class classifiers
– try ensemble methods designed for imbalanced data
– try an alternate performance metric
– try k-fold cross validation to estimate pr auc
I hope that helps as a start.
Thanks a lot. I already started to use your suggestions. Wish me luck and patience 😀
Good luck!
I have the same problem in the data I am dealing with (around 0.3% occurrence).
I assume you have some expert knowledge about the biological connections between the features and your event, but try calculating the Pearson (point biserial) correlation of each feature with the target, this should give you a hint whether there is any connection between your features and the event you want to predict.
You could also try unsupervised learning (clustering) to see if the event is only located within certain clusters.
Validating with ROC can be a bit tricky in the case that not enough positive events end up in the validation data set.
Though this is a bit cheaty because you would make assumptions about the validation data beforehand, split the negative and positive cases seperately so that you end up with the same prevalence in training and validation data.
Great tips.
A LOOCV evaluation is a good approach with limited data.
Thanks for the tips. I am considering them.
Hello Jason,
great article.
I stumbled upon the PLoS One paper (Saito and Rehmsmeier 2015) myself and I have one question regarding the evaluation of the PRC.
The authors state:
“Nonetheless, care must be taken when interpolations between points are performed, since the interpolation methods for PRC and ROC curves differ—ROC analysis uses linear and PRC analysis uses non-linear interpolation. Interpolation between two points A and B in PRC space can be represented as a function y = (TPA + x) / {TPA + x + FPA + ((FPB – FPA) * x) / (TPB – TPA)} where x can be any value between TPA and TPB [26].”
In your article, you calculated the AUC (PRC) with the sklearn auc(recall, precision).
Is this in conflict with the quoted statement since I would also calculate the ROC AUC with auc(FPR, TPR)?
I don’t think this matters much when I am comparing models within my own trial, but what about comparing the AUC to other papers?
Hmmm. Yes, you may be right.
Here comes a rant.
As a general rule, repeat an an experiment and compare locally.
Comparing results to those in papers is next to useless as it is almost always the case that it is insufficiently described – which in turn is basically fraud. I’m not impressed with the computational sciences.
how to calculate the probabilities that i need to pass for below funciton
roc_curve(y, probs)
You can call model.predict_proba() to predict probabilities.
Can I ask why you said that in the case of precision -recall we’re less interested in high true negative? Is it because you took class 0 to be the dominant class? But isn’t the choice of class 0 as being the dominant class just an example? So, in the case of class 1 being the dominant class, that would mean that the model will be less interested in true positives. And in this case your point about true negatives not figuring in the precision and recall formulas wouldn’t be relevant.
In binary classification, class 0 is the negative/majority class and class 1 is always the positive/minority class. This is convention.
Hi,
Is there any formula to determine the optimal threshold from an ROC Curve ?
Thanks
Surajit
Yes, I have a post scheduled on the topic.
You can use the j-statistic:
https://en.wikipedia.org/wiki/Youden%27s_J_statistic
Thanks for your reply. How shall i come to know about your post on this topic ?
You can follow the site via email/rss/twitter/facebook/linkedin.
See the links at the bottom of every page.
Also, how to determine the optimal threshold from a PR Curve ? Is it the F-Score or something else ?
Excellent question!
You can test each threshold in the curve using the f-measure.
I cover this in an upcoming post as well.
Why f-measure over other metrics
Good question, see this framework for choosing a metric:
https://machinelearningmastery.com/tour-of-evaluation-metrics-for-imbalanced-classification/
Hey there!
You obtain the thresholds as “_” through the call “lr_precision, lr_recall, _ = precision_recall_curve(testy, lr_probs)” – but you never use them when plotting the curve, am I right? How are you using the thresholds? I mean, you have to be using them in some way for the plot?
Correct, we are not using the thresholds directly, rather a line plot of recall vs precision.
well, does it then mean for roughly balanced dataset I can safely ignore Precision Recall curve score and for moderately (or largely) imbalances dataset, I can safely ignore AUC ROC curve score?
No, you must select the metric that is most appropriate for your task, then use it to evaluate and choose a model.
Metric first.
thank you, I was talking about specifically binary classification task. And I have two datasets. one is imbalanced (1:2.7) and the second one is almost perfectly balanced. which metric should I choose for the two? Thank you once again, cheers!
I recommend choosing a metric that best captures the requirements of the project for you and the stakeholders.
A good starting point is to think about what is important about classification and misclassification errors. Are errors symmetrical? Are both classes important, etc.
Some metrics to consider include roc auc, pr auc, gmean, f-measure and more.
you’re awesome, thank you
You’re welcome.
Hi, Thanks for your excellent post.
My question is if I do resampling to my imbalance dataset, can I use AUC in this case to evaluate the model?
Yes.
Sorry I meant can I use the ROC curves to evaluate the model in this case?
Yes. Any metric you want.
Sampling only impacts the training set, not the test set used for evaluation.
Hi, Jasono, you explain in a way that I always write ‘machinelearningmastery’ in the end of my query at the end. Thanks
My probllem is: I have imbalance dataset of (22:1, positive:negative) and I train the neural network model with the ‘sigmoid’ as a activation function in last (output) layer. After training I call the function ‘model.predict’ as below:
y_prediction = model.predict(X_test)
and when I print y_prediction it shows me float values between 1 and 0 (I am thinking that these are the probabilities of class 1(positive) for every X_test sample).
After that I convert y_prediction to 1s and 0s by threshold of 0.5 as blow:
y_pred = np.zeros_like(y_prediction)
y_idx = [y_prediction >= 0.5]
y_pred[y_idx] = 1
After that I draw Precision-Recall Curve (PR-Curve), which bows towards (1,1).
Now I have following Questions:
Q1: How I have to get the best threshold from my PR-curve, that I apply this threshold to y_prediction(mentioned above) and results me in good recall and precision.
Q2: How I became satisfied that this precision and recall or F1-score are good and model perform well.
Thanks
Thanks!
You can test all thresholds using the F-measure, and use the threshold with the highest F-measure score. I have a tutorial on this scheduled.
Not sure I understand the second question. Use lots of data and repeated evaluation to ensure the score is robust?
How to plot ROC when I have a predicted output as a reconstructed image (e.g. Autoencoder), suppose I calculate some score of reconstructed an consider as a binary classification. I have tried using scikit-learn package and the result is almost the same with my training experiment.
my model structure:
Image sequence as Input -> Encoder -> ConvLSTM -> Decoder -> output a reconstructed image sequence
Not sure that is possible.
Sir how i can draw the ROC Curve by using PROMISE DATASET KC1, Kindly help.
A ROC curve is drawn for predictions, not for a dataset.
First model the dataset, then make predictions on a test set, then use the code above to draw a ROC curve from the predictions.
great
Thanks!
Hi Jason Brownlee,
First, I regret the loooong question, below. Having said that….;o)
…I cannot escape the fact that you represent a significant capacity in the field of data science and that you show an impressive willingness to share your valuable knowledge with others. In light of that, I hope that you could possible assist me providing some advice. I have two questions.
I am currently in the process of defining a KNN based classification of a relatively imbalanced, some might say highly imbalanced dataset, consisting of 2K+ articles of various scientific content. Purpose of algo is to clarify which articles to scrap and, more interestingly, which ones to proceed with. These ones are highly outnumbered by the ones not of interest. I’ve managed to make the algo run, and it does a pretty fine job. I think. This is where I’d like you to tell me, after having pre-processed text, vectorized, how I can evaluate on the KNN model’s performance. Reading your article, I seem to understand that precision-recall curves are better at showing results when working with (highly?) imbalanced datasets.
Therefore, and first:
Do I need to do a confusion matrix before a precision-recall curve, and do both these exist as standard components of the scikit-learn module?
Second, I seem to face an issue when executing on the KNN classification part of the algo. I am importing a csv, adding a unique id to each line/text representation, and then–when testing relationship of a new observation–I am adding a number from the list of unique id’s I added. Then–in presenting result–I concatenate to df’s and get an overview of e.g. 20 nearest neighbors. Could be 10 or whatever. This works fine. It points back to a list where I can see that my preferred articles are highlighted, typically at rate of precision betw 75 and 80 per cent. My issue is really that I’d like to be able to add a piece of text/search word in stead of a number. From the tutorial I ‘inherited’ my own adaptation, it says ‘Barack Obama’s nearest neighbors are this and that, but that is only because the data applied i structured in a ‘name’ and ‘text’ feature. My articles cannot be split like that. While overall covering the same scientific area, they are different, very different. So my question is: Is it possible to add a new feature/column, index by that new one and then use text as search criteria when attempting to add input the ‘get_closest_neighs’ result?
Thanks.
Start with a good idea of what is important to the project, then find a metric that matches that.
This will help a lot, specifically the end:
https://machinelearningmastery.com/tour-of-evaluation-metrics-for-imbalanced-classification/
Not sure I follow your second question sorry. It might be more of an engineering question than a modeling question.
Hi, this is the tutorial I used, re question 2 – http://andrewgaidus.com/Finding_Related_Wikipedia_Articles/
You mentioned “This is possible because the model predicts probabilities and is uncertain about some cases. These get exposed through the different thresholds evaluated in the construction of the curve, flipping some class 0 to class 1, offering some precision but very low recall.”
Shouldn’t this offer some recall but very low precision as depicted by the graph?
Very illuminating!
Thanks!
Dear Sir,
I am using the Ant Miner based on the Ant colony optimization algorithm for my dataset. I don’t know how to take the threshold value and predict_value in that algorithm. It is not like the classifier using here. Can you guide me on how to use that value to plot the ROC curve? If you want the code I can mail you, So, that you can see it.
Sorry, I don’t have the capacity to debug your code.
I am not familiar with the software you are using, perhaps contact the authors directly?
Hey, maybe you or someone can help me with understanding ROC AUC. When would I use it to assess model performance instead of accuracy? I am especially asking in the context where you say that one should not use ROC in the case of imbalanced data. You say that while the ROC curve shows a useful model for most thresholds, your model only predicts the big class. With predictions you mean with threshold 0.5? And with model skill in this: “might be deceptive and lead to incorrect interpretations of the model skill” you mean how good a model does its predictions with all samples weighted equally? But with threshold 0.5 and weighting all samples equally we would be back at simple accuracy measure no? Is ROC AUC not meant to check whether the model was able to separate two classes? That would be independent of the class distributions, no?
This can help you choose what metric to use:
https://machinelearningmastery.com/tour-of-evaluation-metrics-for-imbalanced-classification/
Hi Jason,
Lets say we build a classification model using logistic regression and there is a huge imbalance in the data( to find out credit default) . Now the model has given the confusion matrix with (sensitivity/recall/TP/TN etc..) . Since the model threshold is by default 0.5, the TP rate is less.
Now my understanding.
1) We go to ROC AUC curve just to find the threshold probability
2) come back to the initial model built , to classify as per the new threshold ( by getting the predicted probabilities and classify accordingly with threshold)
If the above understanding is correct, what does AUC signifies ? How can it be an alternate metric to precision/recall? At the end of the day i still have to go back to my initial model built and change the thresholds right and still draw a confusion matrix right?
kindly advise.
Nearly.
We can use the ROC Curve to find a threshold to tune a metric.
We can use ROC AUC metric to evaluate the model directly, not related to threshold or a confusion matrix.
ROC AUC is the area under the curve.
Hi Jason,
Thanks for the post.
One question. You got threshold value but how you gonna use it? I mean you will fit your model again and set threshold value for example in “Earlystopping” function?
I am asking because I couldn’t find anywhere how to use the threshold value. I mean what will you when you want to save adjusted improved model?
Thanks.
You’re welcome.
Good question, see this on selecting a threshold and using it to turn probabilities into crisp labels:
https://machinelearningmastery.com/threshold-moving-for-imbalanced-classification/
Hello,
How would one go about comparing two AUC’s given by y the AUROC & AUPRC curves in python? AKA is there a statistical difference between two AUC’S produced by two different but correlated models?
let me clarify a little…
I have the following “values”
Model 1 (49 items)
Logistic Regression AUROC
Logistic Regression AUPRC
Random forest AUROC
Random forest AUPRC
Gradient Boosting AUROC
Gradient Boosting AUPRC
Model 1 (51 items)
Logistic Regression AUROC
Logistic Regression AUPRC
Random forest AUROC
Random forest AUPRC
Gradient Boosting AUROC
Gradient Boosting AUPRC
I want to compare the corresponding AUROC/AUPRC values between models 1 and 2 in python to see if there is a significant difference between the predictive validity in the models…but unsure how to go about running this test, are you aware of any package in python that would allow me to do so?
If both treatments were applied to the same data, you could use a paired test.
You can calculate a ROC AUC for each method and compare them directly.
Hi Jason,
thanks a lot for your excellent tutorial!
I work in a research lab and I need to start using Python to calculate the EC50 and AUC on ELISA assay data tables (a dose-response curve on serial dilutions of samples), and I would like to ask you if you have experience doing similar things with Python or help me find useful resources. Of course EC50 and AUC can be easily calculated with Prism, but I also need to know how to do it with Python. I know how to plot data tables in Python, but I am at a loss when it comes to proceed with transform, normalization and linear regression, and after that calculate the final AUC of the ELISA assay.
Any help would be greatly appreciated.
Thanks,
Alex
You’re welcome!
The above tutorial will show you how to plot a ROC curve and calculate ROC AUC.
For help normalizing data, see this:
https://machinelearningmastery.com/standardscaler-and-minmaxscaler-transforms-in-python/
For help with linear regression, see this:
https://machinelearningmastery.com/spot-check-regression-machine-learning-algorithms-python-scikit-learn/
I don’t know what EC50 is, sorry.
I hope that helps as a starting point.
Dear Jason,
would you please tell me a short answer for the question below?
Is it possible to get the AUC = 1 for the Sensitivity = 1.0, Specificity = 0.556, PPV= 0.818, NPV = 1.0 ?
Thank you,
I would suggest no.
Wouldn’t a “no skill classifier that only predicts 0 for all examples” result in just a single point on the ROC curve at (0, 0), not an AUC of 0.5? To get an AUC of 0.5, wouldn’t you have to look at all models which predict class 1 with probability p in [0, 1], resulting in a set of points {(p, p)}, which together form the diagonal line?
The example plots this exact case as a diagonal line, you can see for yourself if you are unsure.
Thanks for your response. I do see the diagonal line, but I don’t think the entire line corresponds to predicting 0 for all examples, which is what is written in the text. Predicting 0 for all examples is just one point on the line (the point at (0, 0)). The no skill line is created by a set of classifiers which predict class 1 with probabilities ranging from 0 to 1. For example, the point at (0.25, 0.25) is created by predicting class 1 25% of the time. This holds regardless of class imbalance. Does that make sense?
Agreed.
You can predict random labels to get a more appropriate line.
Hello Jason,
I always face this issue, suppose the model that I am working on demands to have a high recall, and I tune a model such that i achieve a very high recall, inline with my goal but have a very low precision like 0.12 can the model still be considered good? How can I estimate the generalization ability of such a mode?
I achieved recall 1 with gridsearch+ cv.
Thank you,
Choosing just recall or just precision is not a good idea, they need balance. Use fbeta instead:
https://machinelearningmastery.com/fbeta-measure-for-machine-learning/
Thank you, and sorry, I accidentally posted the same question again. Will go through the article you sent.
Thank you,
Karthik
No problem.
Hello, great job on the article!
If I’m trying to create a model where I’m interested in higher recall, how can I tune my model to achieve that? With a KNN Classifier, what parameters can I change to influence recall?
Thank you very much!
Good question, select a metric like “recall” or “f1” and test a suite of models and model configuration to see which achieves the best result with your chosen metric.
This will help you choose a metric:
https://machinelearningmastery.com/tour-of-evaluation-metrics-for-imbalanced-classification/
Hello Jason,
I always face this issue, suppose the model that I am working on demands to have a high recall, and I tune a model such that i achieve a very high recall, inline with my goal but have a very low precision like 0.12 can the model still be considered good? How can I estimate the generalization ability of such a mode?
I achieved recall 1 with gridsearch+ cv.
Thank you,
Good is relative to the goals of your project or requirements of your project stakeholders. There is no objectively “good” model.
I would recommend optimizing an F-beta metric instead of just recall because you want the best recall and precision, not just recall:
https://machinelearningmastery.com/fbeta-measure-for-machine-learning/
Model performance is estimated using repeated k-fold cross validation:
https://machinelearningmastery.com/repeated-k-fold-cross-validation-with-python/
What a great article – thanks so much, Jason! I did have a qq: I do finally understand, thanks to you, how AUC can be misleading in terms of how much better our model is than chance (when the dataset is unbalanced), but does this matter when you are choosing from several models? Wouldn’t AUC still pick the best one?
Thanks again – awesome how you reference papers and actually interpret how they add context to your article!
Thanks!
Good question. Yes, choosing the model with the better AUC will have a relatively good “AUC” score by definition, it just may not be good when considering other metrics.
LOL, I realize I didn’t state that very well! I guess I meant would the rankings of the models be the same as if I used AUPR? Thanks for the quick response – really appreciate your work.
Maybe, but probably not, choosing an appropriate metric is critical, more here:
https://machinelearningmastery.com/tour-of-evaluation-metrics-for-imbalanced-classification/
Thank you for your article.
Dear Jason, is there any way (in python) to investigate the predictive power of each feature in our dataset using ROC AUC?
ROC AUC is a score for binary classification. Not sure how it is related to feature importance exactly.
Perhaps start here:
https://machinelearningmastery.com/calculate-feature-importance-with-python/
Hey Jason, thanks for the awesome tutorials.
I just want to report a possible typo in your text. In the sentence:
“…thresholds using the precision_recall_curve() function that takes the true output values and the probabilities for the positive class as output and returns…”
shouldn’t it be “input” instead of “output”?
Cheers
Dário
You’re welcome.
Thanks, fixed!
Hello, please how these two numbers in brackets stand for :
a probability in [0.0, 0.49] is a negative outcome (0)
and a probability in [0.5, 1.0] is a positive outcome (1).
You can use an if-statement directly.
Hello Jason…
I made a classification using Random Tree in Weka, and I exported the predicted instances of the testing dataset please what is the numbers in the column “Prediction” stand for, since it is Random Tree, not logistic regression to produce probabilities:
inst# actual, predicted ,error , prediction
1 2 2 0.933
2 1 2 + 0.58
3 2 2 0.828
4 2 2 0.667
The predictions are the probability of class=1, I would guess.
thank you very much
Hello again. thanks for the great explanations. I want to ask about creating ROC for the
Decision Tree in weka.
Is there a meaning of choosing a cut-off to choose the best threshold point?
since with Decision Tree, we can’t change the assignment, and there’s no such thing as
threshold in Decision Trees. or only we can calculate the AUC for decision tree without a cut-off?
Sorry, I don’t have an example of choosing the threshold in Weka.
I have an example in Python here:
https://machinelearningmastery.com/threshold-moving-for-imbalanced-classification/
thank you very much ( : , so helpful ..
You’re welcome.
Hello Dear Jason
My dataset contains attack and normal data. How can I use logistic regression to do this? Do I have to bet on attack data?
This process will help you work through your project:
https://machinelearningmastery.com/start-here/#process
I got a multiclass (5-classes) highly imbalanced dataset. Can I use ROC curve as evaluation metrics?
Typically ROC curves are used for 2-class (binary) classification, not multi-class.
Hi Jason, Thanks for the great tutorial as always.
I have an imbalanced dataset where the test set has positive class as the dominant class. The PR curve should be used when the negative class is dominant right? So, what should I use in this case?
Class=1 should be the minority class, if not you may have to specify which is positive and which is negative to the metric.
Pls how can roc be plotted for a multiclass classification problem?
It cannot.
Hi, Thanks for your excellent post.
I am just wondering how to choose a threshold in Precision-Recall curve, although it’s plotted over all the possible thresholds and how can I define the exact threshold value for a specific point in the curve.
Thanks in advance.
You’re welcome.
Good question, see this tutorial:
https://machinelearningmastery.com/threshold-moving-for-imbalanced-classification/
Is there a python code where precision-recall curves are obtained from multi-classification ANNs (more than 2 classes)? Thank you.
Not that I’m aware.
with predict prob you only plot the 2nd columns with positive class probability. But if column2 values are less than column1 values for certain examples then that means that those examples belonged to class 0 and not 1. But we still end up plotting column 2 where they never belonged to class 1. So these will not be a part of the TPR?
Hi Jason,
Thanks so much for your excellent posts and blogs. Really informative indeed. I am still struggling on the no skill model for the PR curve, and why is that a straight line. Please see below:
1- a random model, coin toss, would simply predict a precision equal to the ratio of positive class in the data set, and recall =0.5 (middle of the dotted flat line/no skill classifier)
2- a model, which predicts 1, for all the data points, would simply predict precision equal to the ratio of positive class in the data set, and recall = 1 (end of the dotted flat line)
3- a model, which predicts 0 (negative class), for all the data posits, would predict an undefined precision (denominator =0) and recall of 0. (this is not on the dotted flat line…?)
Also, I really don’t get, how an unskilled model can predict a recall of lets say 0.75 and precision equal to the TP ratio. It seems like to me that not all the points in the no-skill model can be ached, and no skill model should be limited number of points , rather than a whole flat line…?
3-
On a ROC curve, the no sill is not really a line, it is a point or two points, we construct a line as reference.
Hi Jason, Kamyar is referred to the PR curve and not to the ROC curve. I am also very much struggling understanding this. What are these two points could you specify and explain the rational? Thank you very much in advance.
Hi Mr Jason,
Please, I have two questions:
1- why ROC AUC results are reduced with normalization?
2- could you explain this situation: even the model accuracy in SVM or GNB is good -about 90%- but the AUC value is small about 50% even without normalization?
regards
sorry, question two just with SVM
Normalization of input data can help with models that weight inputs or use distance measures.
I recommend not comparing different types of metrics, instead, select one metric and optimize it.
yes, that’s right but GNB has no parameters to be tuned only normalization could affect the result. Moreover, if ACC is high that’s mean all other metrics are high, so how AUC is reduced while it depends on recall and FPR. I can’t imagine the idea.
Hi Jason,
For the roc_curve function, is it correct to pass scores as probability density or probability?
Yes, as long as the value is a measure of decisions.
Hi
I am trying to plot a ROC curve to evaluate the accuracy of a prediction model I developed in Python using AdaBoostclassifier packages.
probs = model.predict_proba(X_test)
preds = probs[:,1]
fpr, tpr, threshold = metrics.roc_curve(y_test, preds)
roc_auc = metrics.auc(fpr, tpr)
# method I: plt
import matplotlib.pyplot as plt
plt.title(‘Receiver Operating Characteristic’)
plt.plot(fpr, tpr, ‘b’, label = ‘AUC = %0.2f’ % roc_auc)
plt.legend(loc = ‘lower right’)
plt.plot([0, 1], [0, 1],’r–‘)
plt.xlim([0, 1])
plt.ylim([0, 1])
plt.ylabel(‘True Positive Rate’)
plt.xlabel(‘False Positive Rate’)
plt.show()
I run this code bute i have this “ValueError: multiclass format is not supported”
The error says it all. ROC curve is for prediction accuracy, i.e., binary classification. The formula cannot apply to non-binary case.
Hi,
I am having trouble to find out PRC curve and its AUC for a multiclass (no of classes=4) classification problem:
from sklearn.multiclass import OneVsRestClassifier
from xgboost import XGBClassifier
from sklearn.metrics import precision_recall_curve
from sklearn.metrics import average_precision_score
clf = OneVsRestClassifier(XGBClassifier(n_estimators=50, max_depth=3, random_state=0))
clf.fit(X_train, Y_train)
Y_score = clf.predict_proba(X_test)
# precision recall curve
n_classes=4
precision = dict()
recall = dict()
for i in range(n_classes):
precision[i], recall[i], _ = precision_recall_curve(Y_test[:, i], Y_score[:, i])
plt.plot(recall[i], precision[i], lw=2, label=’class {}’.format(i))
plt.xlabel(“recall”)
plt.ylabel(“precision”)
plt.legend(loc=”best”)
plt.title(“precision vs. recall curve”)
plt.show()
It gives me an error saying
IndexError: too many indices for array: array is 1-dimensional, but 2 were indexed
Could you please share a working code for multiclass so that I can understand my mistake.
Hi Jason,
thanks for your tutorial! Very explanatory!
In the last sentence:
“These get exposed through the different thresholds evaluated in the construction of the curve, flipping some class 0 to class 1, offering some precision but very low recall.”
Shouldn’t it be the other way around: “offering some recall but very low precision.” ?
Thanks,
Abel
Precision and recall are both about positive predictions. Which class is considered positive is the question of how you write this sentence.
Hi, I have two version of a imbalanced dataset. They are the same dataset, but one of them was constructed by eliminating some rows from the other one. So imbalance in dataset has been changed. One is have a 0.11 baseline, other one have 0.13 baseline. Can I compare their aupr scores? Is there a way to realize this kind of comparsion? Thanks
I don’t get what is that:
from sklearn.datasets import make_classification
What is that?
Hello.
What if we have used weights or a cost matrix to compensate the imbalance?
Will it be still be preferred to use the AUC PR metric?
Or using weights or cost matrix it’s enough and then we can use the AUC ROC curve or even the Accuracy as a metric to optimize our model?
And vice versa, if you use the AUC PR as our metric… do we need to also use weights or cost matrices?
“0.0 and 1.0 for no skill and perfect skill respectively.”
This probably needs a bit of clarification. No skill as you say would be 0.5, rather than 0. Less than 0.5 would be not just no skill, but almost purposefully bad model 🙂
Hi Mohamad…The following resource may be of interest to you:
https://machinelearningmastery.com/evaluate-skill-deep-learning-models/
hello, great source. What is the corresponding no skill in sklearn? Is there a corresponding dummy model? I cannot find this. If not, how can I fit a no skill model and get the predictions so that I calculate recall precision manually for every probability? Just trying to understand this better, it is not clear to me.Thanks
Hi Vicky…The following resource may be of interest to you:
https://scikit-learn.org/stable/modules/generated/sklearn.dummy.DummyClassifier.html
hello again James, what about the average precision recall score for the no skill model? how do you calculate this?
hello James, what is the rational between the no skill in precision-recall curve?
Hi, Thanks for this amazing contents.
I use this contents (picture and code) for personal study related to machine learning.
Again, Thanks for this amazing contents.
You are very welcome, Lee Jun! We appreciate your support!