A learning curve is a plot of model learning performance over experience or time.
Learning curves are a widely used diagnostic tool in machine learning for algorithms that learn from a training dataset incrementally. The model can be evaluated on the training dataset and on a hold out validation dataset after each update during training and plots of the measured performance can created to show learning curves.
Reviewing learning curves of models during training can be used to diagnose problems with learning, such as an underfit or overfit model, as well as whether the training and validation datasets are suitably representative.
In this post, you will discover learning curves and how they can be used to diagnose the learning and generalization behavior of machine learning models, with example plots showing common learning problems.
After reading this post, you will know:
- Learning curves are plots that show changes in learning performance over time in terms of experience.
- Learning curves of model performance on the train and validation datasets can be used to diagnose an underfit, overfit, or well-fit model.
- Learning curves of model performance can be used to diagnose whether the train or validation datasets are not relatively representative of the problem domain.
Kick-start your project with my new book Better Deep Learning, including step-by-step tutorials and the Python source code files for all examples.
Let’s get started.

A Gentle Introduction to Learning Curves for Diagnosing Deep Learning Model Performance
Photo by Mike Sutherland, some rights reserved.
Overview
This tutorial is divided into three parts; they are:
- Learning Curves
- Diagnosing Model Behavior
- Diagnosing Unrepresentative Datasets
Learning Curves in Machine Learning
Generally, a learning curve is a plot that shows time or experience on the x-axis and learning or improvement on the y-axis.
Learning curves (LCs) are deemed effective tools for monitoring the performance of workers exposed to a new task. LCs provide a mathematical representation of the learning process that takes place as task repetition occurs.
— Learning curve models and applications: Literature review and research directions, 2011.
For example, if you were learning a musical instrument, your skill on the instrument could be evaluated and assigned a numerical score each week for one year. A plot of the scores over the 52 weeks is a learning curve and would show how your learning of the instrument has changed over time.
- Learning Curve: Line plot of learning (y-axis) over experience (x-axis).
Learning curves are widely used in machine learning for algorithms that learn (optimize their internal parameters) incrementally over time, such as deep learning neural networks.
The metric used to evaluate learning could be maximizing, meaning that better scores (larger numbers) indicate more learning. An example would be classification accuracy.
It is more common to use a score that is minimizing, such as loss or error whereby better scores (smaller numbers) indicate more learning and a value of 0.0 indicates that the training dataset was learned perfectly and no mistakes were made.
During the training of a machine learning model, the current state of the model at each step of the training algorithm can be evaluated. It can be evaluated on the training dataset to give an idea of how well the model is “learning.” It can also be evaluated on a hold-out validation dataset that is not part of the training dataset. Evaluation on the validation dataset gives an idea of how well the model is “generalizing.”
- Train Learning Curve: Learning curve calculated from the training dataset that gives an idea of how well the model is learning.
- Validation Learning Curve: Learning curve calculated from a hold-out validation dataset that gives an idea of how well the model is generalizing.
It is common to create dual learning curves for a machine learning model during training on both the training and validation datasets.
In some cases, it is also common to create learning curves for multiple metrics, such as in the case of classification predictive modeling problems, where the model may be optimized according to cross-entropy loss and model performance is evaluated using classification accuracy. In this case, two plots are created, one for the learning curves of each metric, and each plot can show two learning curves, one for each of the train and validation datasets.
- Optimization Learning Curves: Learning curves calculated on the metric by which the parameters of the model are being optimized, e.g. loss.
- Performance Learning Curves: Learning curves calculated on the metric by which the model will be evaluated and selected, e.g. accuracy.
Now that we are familiar with the use of learning curves in machine learning, let’s look at some common shapes observed in learning curve plots.
Want Better Results with Deep Learning?
Take my free 7-day email crash course now (with sample code).
Click to sign-up and also get a free PDF Ebook version of the course.
Diagnosing Model Behavior
The shape and dynamics of a learning curve can be used to diagnose the behavior of a machine learning model and in turn perhaps suggest at the type of configuration changes that may be made to improve learning and/or performance.
There are three common dynamics that you are likely to observe in learning curves; they are:
- Underfit.
- Overfit.
- Good Fit.
We will take a closer look at each with examples. The examples will assume that we are looking at a minimizing metric, meaning that smaller relative scores on the y-axis indicate more or better learning.
Underfit Learning Curves
Underfitting refers to a model that cannot learn the training dataset.
Underfitting occurs when the model is not able to obtain a sufficiently low error value on the training set.
— Page 111, Deep Learning, 2016.
An underfit model can be identified from the learning curve of the training loss only.
It may show a flat line or noisy values of relatively high loss, indicating that the model was unable to learn the training dataset at all.
An example of this is provided below and is common when the model does not have a suitable capacity for the complexity of the dataset.
Example of Training Learning Curve Showing An Underfit Model That Does Not Have Sufficient Capacity
An underfit model may also be identified by a training loss that is decreasing and continues to decrease at the end of the plot.
This indicates that the model is capable of further learning and possible further improvements and that the training process was halted prematurely.

Example of Training Learning Curve Showing an Underfit Model That Requires Further Training
A plot of learning curves shows underfitting if:
- The training loss remains flat regardless of training.
- The training loss continues to decrease until the end of training.
Overfit Learning Curves
Overfitting refers to a model that has learned the training dataset too well, including the statistical noise or random fluctuations in the training dataset.
… fitting a more flexible model requires estimating a greater number of parameters. These more complex models can lead to a phenomenon known as overfitting the data, which essentially means they follow the errors, or noise, too closely.
— Page 22, An Introduction to Statistical Learning: with Applications in R, 2013.
The problem with overfitting, is that the more specialized the model becomes to training data, the less well it is able to generalize to new data, resulting in an increase in generalization error. This increase in generalization error can be measured by the performance of the model on the validation dataset.
This is an example of overfitting the data, […]. It is an undesirable situation because the fit obtained will not yield accurate estimates of the response on new observations that were not part of the original training data set.
— Page 24, An Introduction to Statistical Learning: with Applications in R, 2013.
This often occurs if the model has more capacity than is required for the problem, and, in turn, too much flexibility. It can also occur if the model is trained for too long.
A plot of learning curves shows overfitting if:
- The plot of training loss continues to decrease with experience.
- The plot of validation loss decreases to a point and begins increasing again.
The inflection point in validation loss may be the point at which training could be halted as experience after that point shows the dynamics of overfitting.
The example plot below demonstrates a case of overfitting.
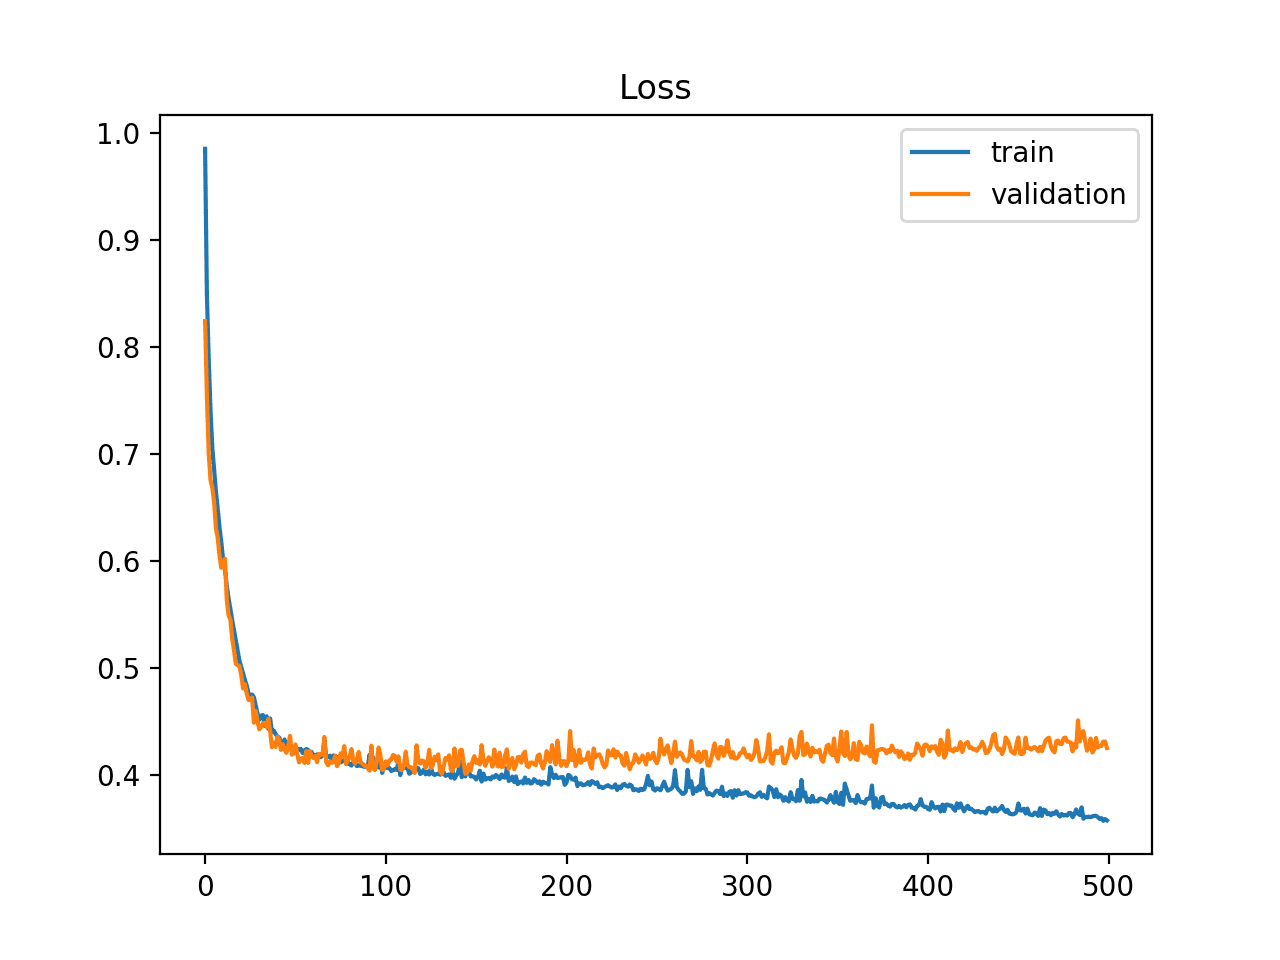
Example of Train and Validation Learning Curves Showing an Overfit Model
Good Fit Learning Curves
A good fit is the goal of the learning algorithm and exists between an overfit and underfit model.
A good fit is identified by a training and validation loss that decreases to a point of stability with a minimal gap between the two final loss values.
The loss of the model will almost always be lower on the training dataset than the validation dataset. This means that we should expect some gap between the train and validation loss learning curves. This gap is referred to as the “generalization gap.”
A plot of learning curves shows a good fit if:
- The plot of training loss decreases to a point of stability.
- The plot of validation loss decreases to a point of stability and has a small gap with the training loss.
Continued training of a good fit will likely lead to an overfit.
The example plot below demonstrates a case of a good fit.
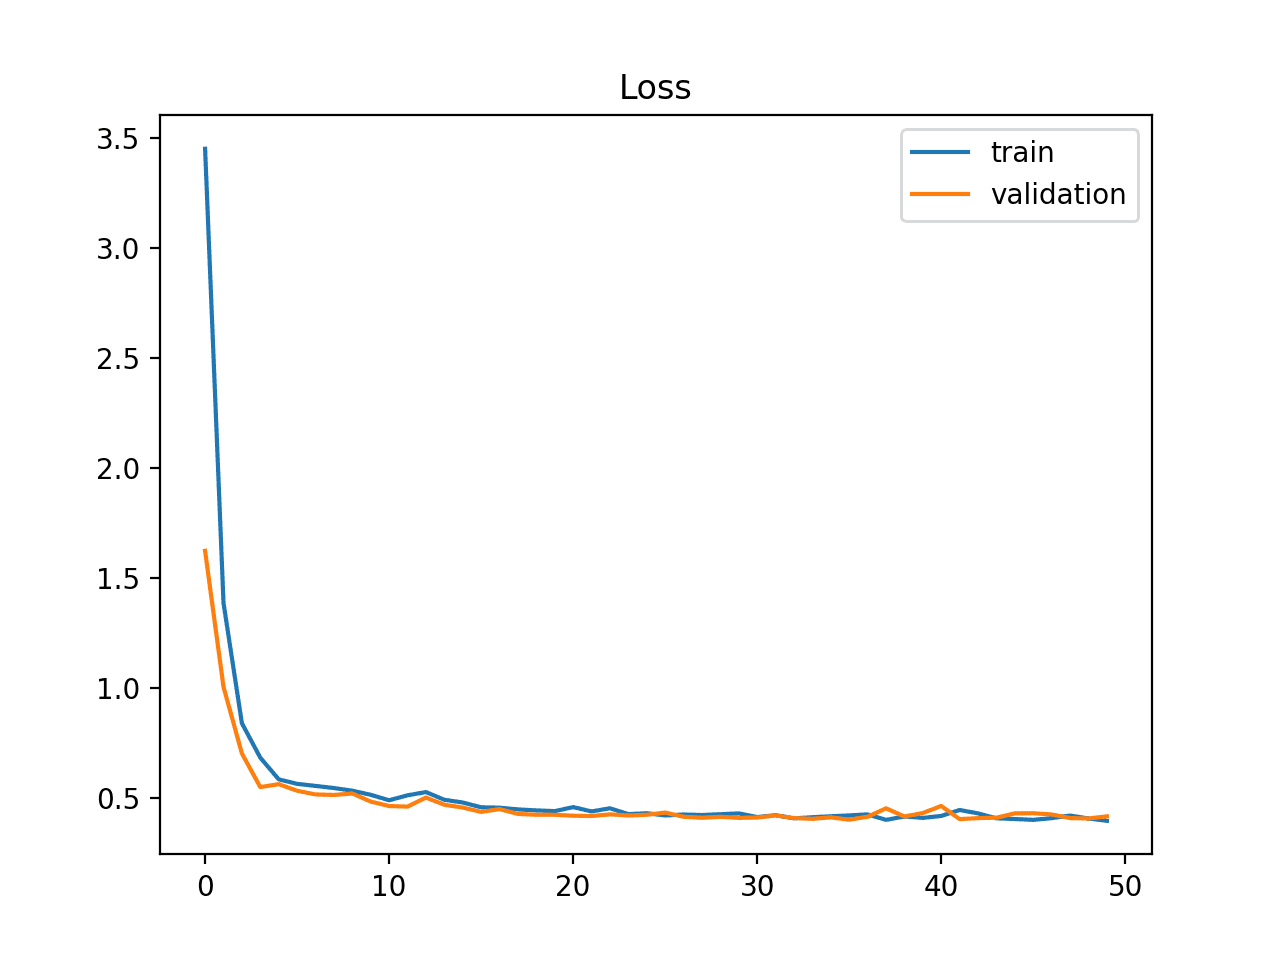
Example of Train and Validation Learning Curves Showing a Good Fit
Diagnosing Unrepresentative Datasets
Learning curves can also be used to diagnose properties of a dataset and whether it is relatively representative.
An unrepresentative dataset means a dataset that may not capture the statistical characteristics relative to another dataset drawn from the same domain, such as between a train and a validation dataset. This can commonly occur if the number of samples in a dataset is too small, relative to another dataset.
There are two common cases that could be observed; they are:
- Training dataset is relatively unrepresentative.
- Validation dataset is relatively unrepresentative.
Unrepresentative Train Dataset
An unrepresentative training dataset means that the training dataset does not provide sufficient information to learn the problem, relative to the validation dataset used to evaluate it.
This may occur if the training dataset has too few examples as compared to the validation dataset.
This situation can be identified by a learning curve for training loss that shows improvement and similarly a learning curve for validation loss that shows improvement, but a large gap remains between both curves.
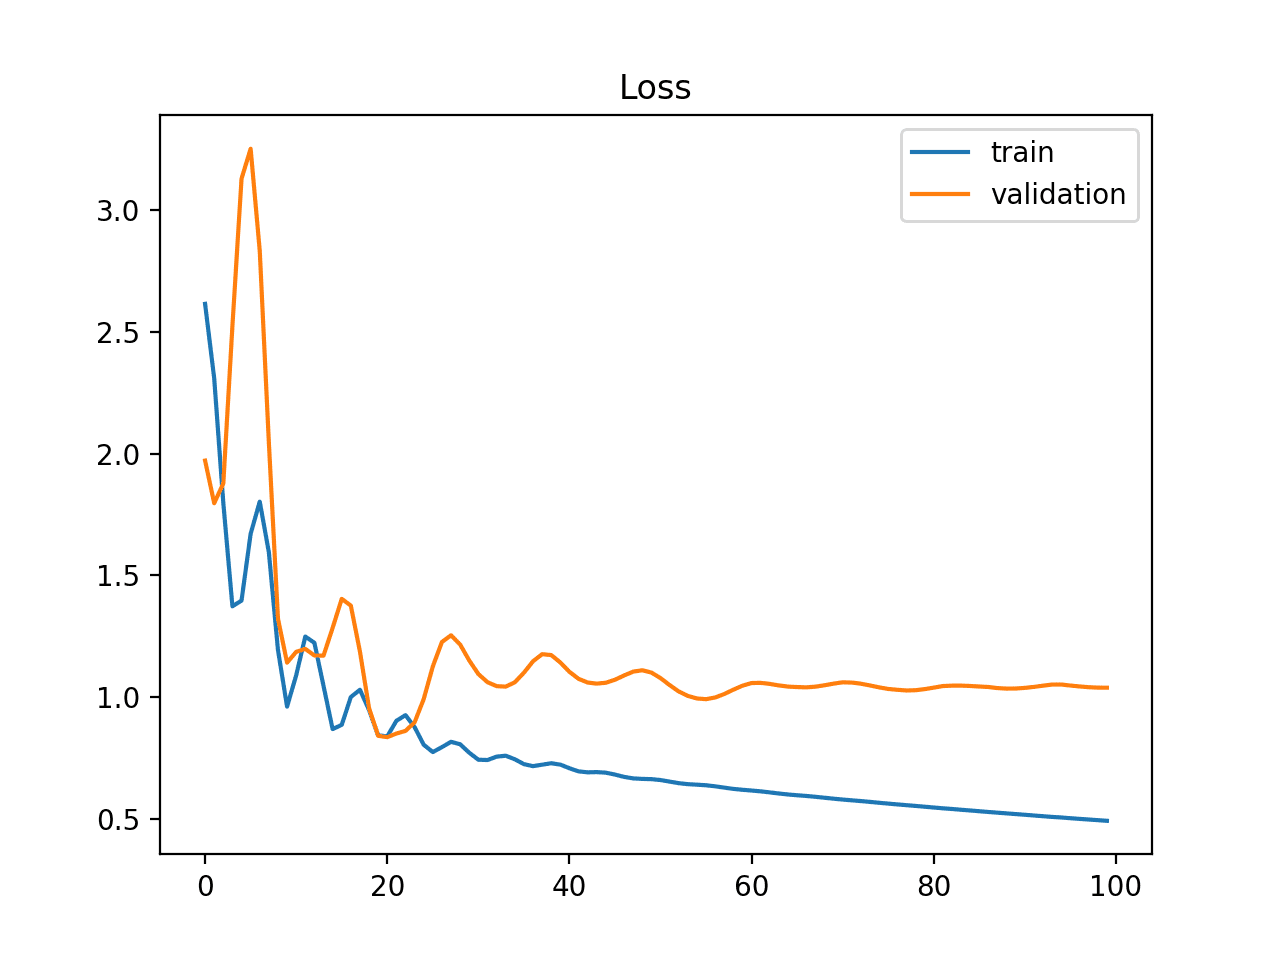
Example of Train and Validation Learning Curves Showing a Training Dataset That May Be too Small Relative to the Validation Dataset
Unrepresentative Validation Dataset
An unrepresentative validation dataset means that the validation dataset does not provide sufficient information to evaluate the ability of the model to generalize.
This may occur if the validation dataset has too few examples as compared to the training dataset.
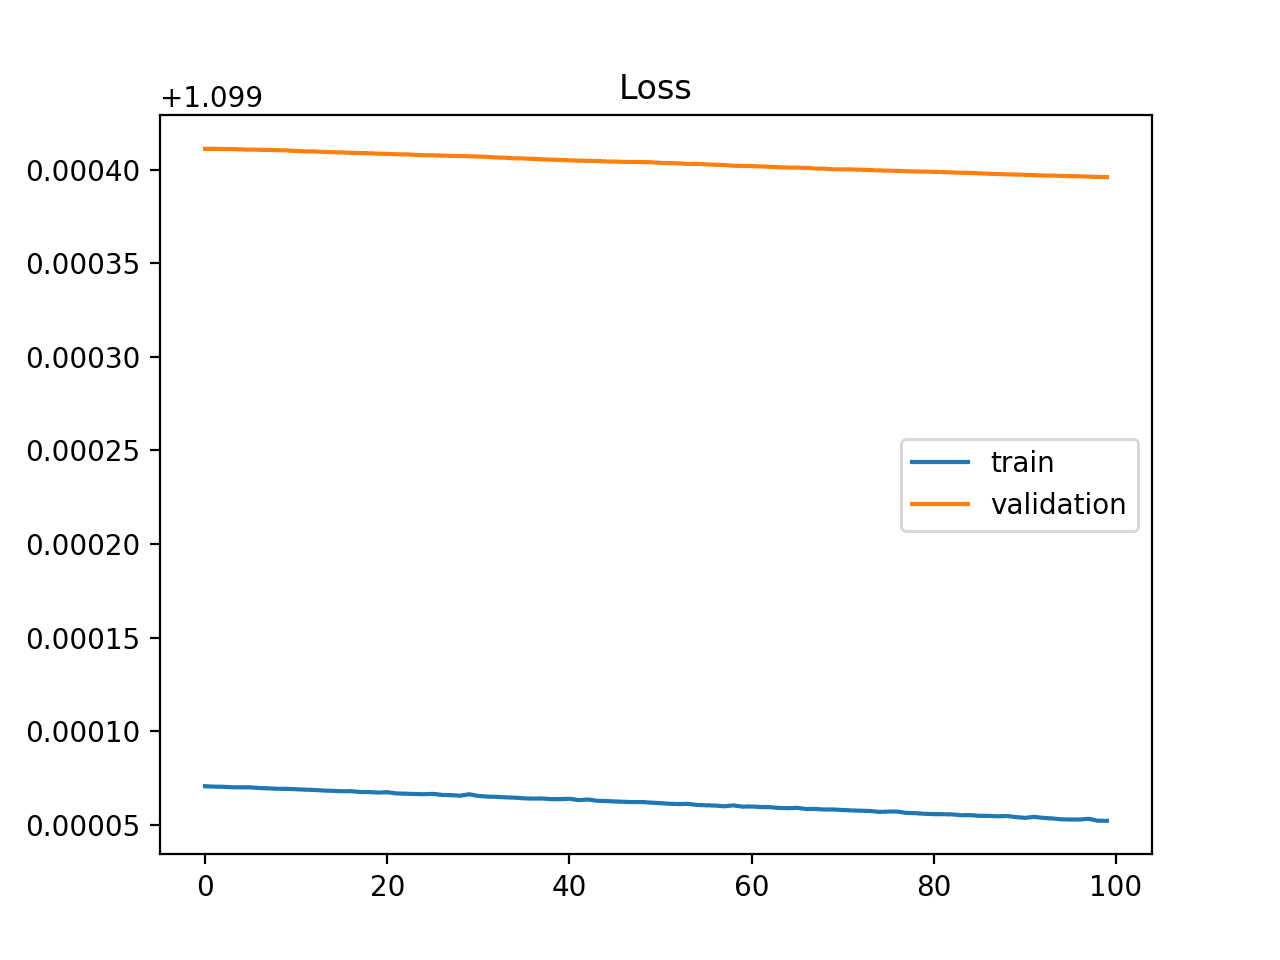
This case can be identified by a learning curve for training loss that looks like a good fit (or other fits) and a learning curve for validation loss that shows noisy movements around the training loss.
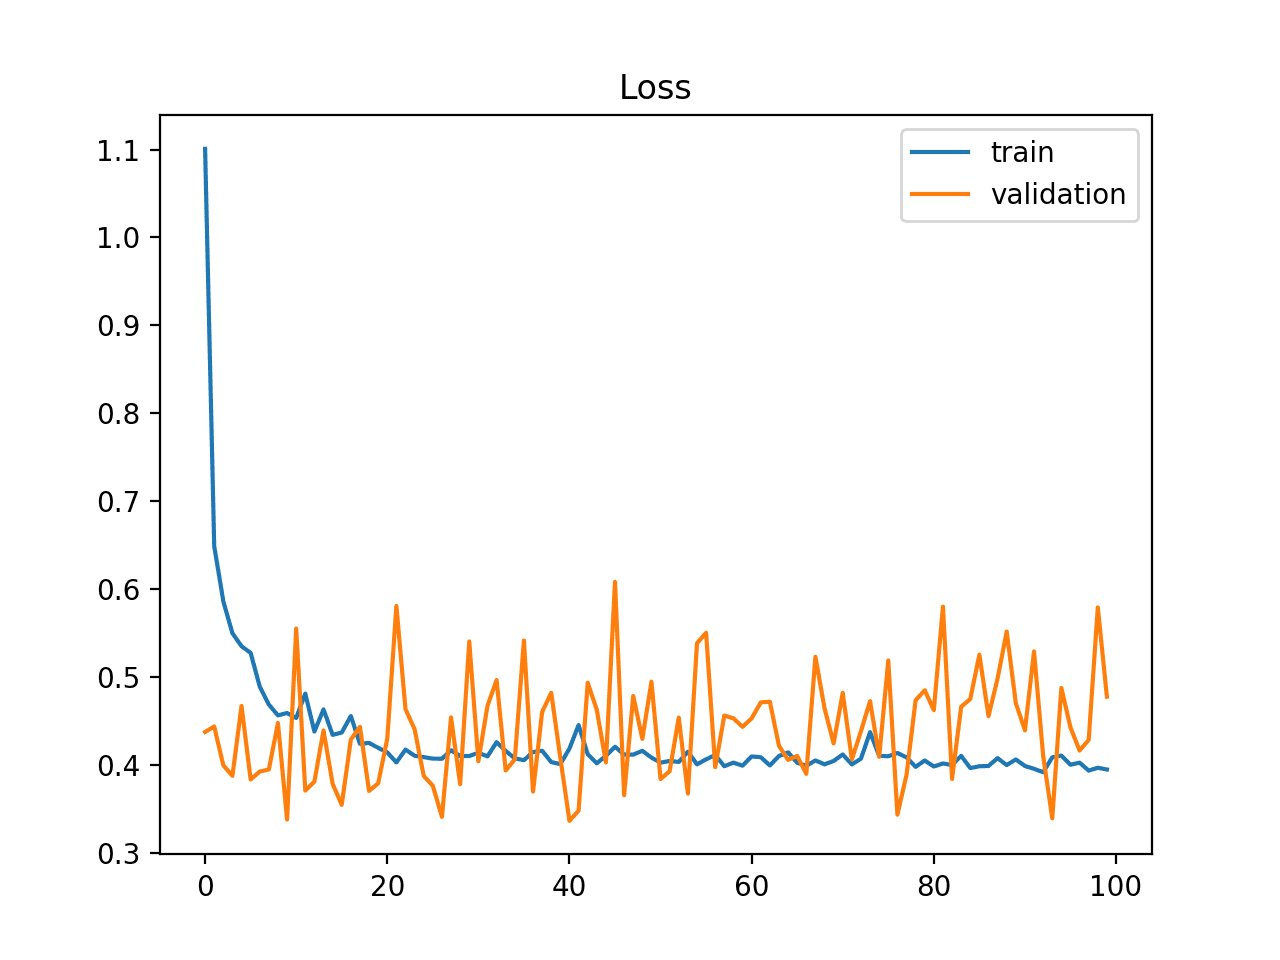
Example of Train and Validation Learning Curves Showing a Validation Dataset That May Be too Small Relative to the Training Dataset
It may also be identified by a validation loss that is lower than the training loss. In this case, it indicates that the validation dataset may be easier for the model to predict than the training dataset.
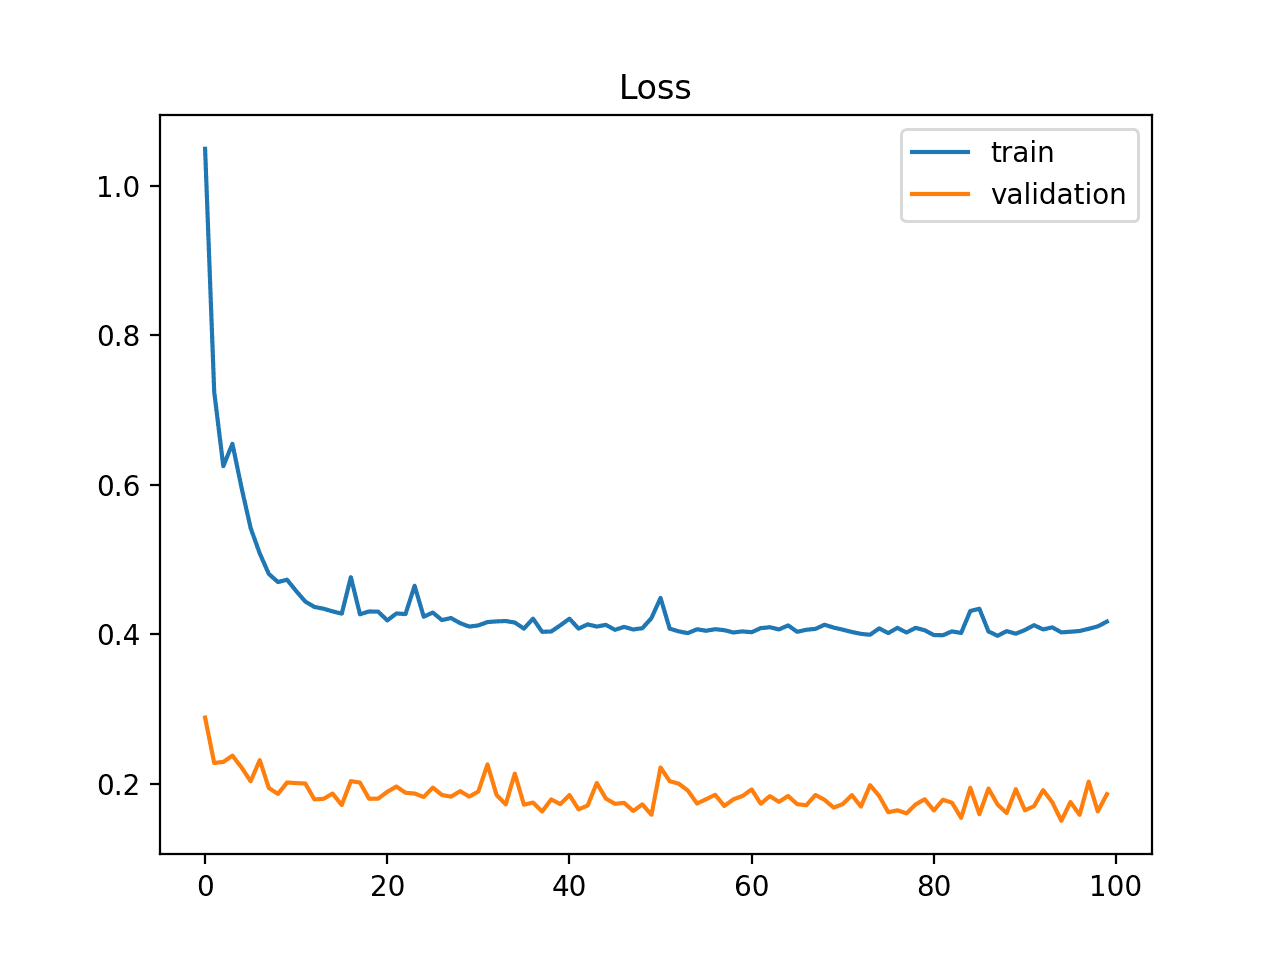
Example of Train and Validation Learning Curves Showing a Validation Dataset That Is Easier to Predict Than the Training Dataset
Further Reading
This section provides more resources on the topic if you are looking to go deeper.
Books
Papers
Posts
- How to Diagnose Overfitting and Underfitting of LSTM Models
- Overfitting and Underfitting With Machine Learning Algorithms
Articles
Summary
In this post, you discovered learning curves and how they can be used to diagnose the learning and generalization behavior of machine learning models.
Specifically, you learned:
- Learning curves are plots that show changes in learning performance over time in terms of experience.
- Learning curves of model performance on the train and validation datasets can be used to diagnose an underfit, overfit, or well-fit model.
- Learning curves of model performance can be used to diagnose whether the train or validation datasets are not relatively representative of the problem domain.
Do you have any questions?
Ask your questions in the comments below and I will do my best to answer.
Develop Better Deep Learning Models Today!
Train Faster, Reduce Overftting, and Ensembles
...with just a few lines of python code
Discover how in my new Ebook:
Better Deep Learning
It provides self-study tutorials on topics like:
weight decay, batch normalization, dropout, model stacking and much more...
Bring better deep learning to your projects!
Skip the Academics. Just Results.


Thanks for article on this core ML technique. First learning curve shown seems a poor example of underfutting since loss on y axis is already so low. Also, maybe condition shown on 2nd plot should be called “under trained” to avoid confusion with “having trouble learning more” condition of under fitting. Also the summary paragraph for underfitting has typo and data “overfitting”.
Thanks Roland.
My own typo :). 2nd to last word above should be “says”
Very informative!
Thanks.
Theres still a typo here:
A plot of learning curves shows overfitting if:
The training loss remains flat regardless of training.
The training loss continues to decrease until the end of training.
=> this is underfitting.
Correct, fixed. Thank you!
The methods like genaralization are used for these conditions only or not?
Sorry, I don’t understand, can you please elaborate or rephrase the question?
I would have said that the error from the training set should increase to converge to the error from the validation set to indicate good fit. What do you think about that? (https://www.dataquest.io/blog/learning-curves-machine-learning )
Does not happen in practice in my experience because often the test/val are smaller and less representative than the train and have different error profile.
Hi Jason and thanks for the post.
I have one question not related with this post though and I wanted your opinion.
Lets’s say I have I am training some data and during the preprocessing I am cleaning that data. I remove some weird/wrong values from it.
Now, when I am going to use the predict to the unseen new data, do I need to apply the same cleaning to that data before making the prediction?
Are there any caveats for doing or not doing this?
I guess I should the same cleaning but it confuses me that we have unseen data and it can be anything..
(I am not talking about scaling or that kind of preprocessing which I already apply to the train and unseen data)
Thank you very much!
George
Great question.
Yes, if you can use generic but domain-specific knowledge to prepare/filter data, then it is a good idea to use this process consistently when fitting and evaluating a model, as well as when making predictions in the future.
The risk is data leakage, e.g. using knowledge about “unseen”/test data to help better fit the model. This might help (and be a bit too strict):
https://machinelearningmastery.com/data-leakage-machine-learning/
Great post Jason. Tahnks.
– My summary, that I appreciate if you can evaluate if am I right about all this stuff is:
overfitting appears when we learn so much details that are irrelevant to the main stream ideas to be learned (general concepts). This can be the situation when you have, on one side a very big complex model (with many layers and many weight to be adjusted.i.e. with a very “hight entropic information capacity”) and on the other side a few amount of data to be trained …so the solution could be the simplify the model or increase de train dataset.
On the other side underfitting appears when we need more experience (more epochs) to train the model, so learning curves trend are continually down..until you get the right stabilization with the appropriate set of epochs …
– My second question it is , how do you interpret the case when validation data get better performance (high level) than training data…is it a good indication of good generalization ?.
thank you Jason to allow us to share your knowledge !!
Yes, but you can underfit if the model does not have sufficient capacity to learn from the data. This can be from epochs or from model complexity/size.
It is a sign that the validation dataset is too small and not representative of the problem – very common.
Great post!
Thank you very much.
You’re welcome, I’m happy it helped.
Hi Jason,
Sorry I asked this question over LinkedIn too. Posting here again so that everybody can have a food for thought.
I ran a VGG16 model with a very less amount of data- got the validation accuracy of around 83%.
However, when I predicted for the test dataset I got around only 53% accuracy. I had my data divided into train, valid, and test..
What could go wrong here? Any explanation would be so helpful. And, thank you for the learning curves blog. Was indeed helpful …
Also, can you make predictions using validation data? What could go wrong/right here?
Perhaps the test dataset is too small or not reprensetative of the broader dataset.
Perhaps try a 50/50 split? or get more data?
Thanks!
Sir, though is something of the track question, still felt like asking. How can I “mathematically” explain the benefit of centered and scaled data for machine learning models instead of raw data. Accuracy and convergence no doubt improves for the normalized data, but can I show it mathematically?
Sorry, don’t have a good answer.
It is correct to create a learning curve graph using three sets of data (training, validation, and testing). Using the “training” set to train the model and use the “validation” and “test” sets to generate the learning curves?
Typically just train and validation sets.
Thank you for your post!! It helps a lot!! Could you please help me to check the learning curve I got (http://zhuchen.org.cn/wp-content/uploads/2019/07/lc.png), is it underfitted? It’s a multi-classification problem using random forest.
Looks underfit.
A very great and useful tutorial, thank you
Thanks.
Can I ask about the meaning of “flat line” in case of under-fitting?
It suggests the model does not have sufficient capacity for the problem.
If the loss increases then decreases then increases then decreases and so on..
What does this means?
Does it means that the data is unrepresentative in that model? or
Does it means that an overfitting happens?
Great question!
It could mean that the data is noisy/unrepresentative or that the model is unstable (e.g. the batch size or scaling of input data).
Hey Jason, I had this problem exactly. What do you mean by the model being unstable – the batch size and scaling? Can you elaborate more? Also, does this explanation apply to both – training and validation dataset? Or just one? Which dataset are you referring to by saying the fluctuation in loss – training or validation?
Thanks, and great post
More on batch size:
https://machinelearningmastery.com/how-to-control-the-speed-and-stability-of-training-neural-networks-with-gradient-descent-batch-size/
More on scaling:
https://machinelearningmastery.com/how-to-improve-neural-network-stability-and-modeling-performance-with-data-scaling/
Thanks Jason!
Also –
I am trying to train, and develop a model which classifies images from camera traps.
From your experience – what would be the best model to solve a camera trap image classification to classify wild animals. The animals as seen in the images are boar, deer, fox, and monkey.
Also, if our main objective is to detect boar and not boar – can I make dataset like – 1000 images with boar, and rest 1000 with all the other animals combined with monkey, deer, and fox – rather than getting 1000 images for each animal
Any suggestion would be so nice, and thanks always
I would recommend transfer learning:
https://machinelearningmastery.com/how-to-use-transfer-learning-when-developing-convolutional-neural-network-models/
Yes exactly. A “boar ‘class and an “other” class.
I use Pearson correlation coefficient as the accuracy metric for a regression problem.
Can I use the correlation coefficient as the Optimization learning curve?
Consider using r^2 as your metric instead?
sorry, but what do mean by r^2?
r-squared or R^2:
https://en.wikipedia.org/wiki/Coefficient_of_determination
Hi Jason.
I post two pictures of my training model here
https://stackoverflow.com/questions/57224353/is-my-training-data-set-too-complex-for-my-neural-network
would you be able to tell me if my model is over fitting or under fitting. I believe it is under fitting.
how can i fix this problems?
Thanks once again Jaso, You dont know how much you have helped me
The post above will help you determine whether you are overfitting or underfitting.
I teach how to diagnose performance and then improve performance right here:
https://machinelearningmastery.com/start-here/#better
can I ask you about the need for the performance learning curve?
I understand from this tutorial that the optimization learning curves are used for checking the model fitness?
But what is the importance of the performance learning curves?
What do you mean by performance learning curve?
performance learning curve that represent the accuracy over epochs
I see, good question.
The performance curve can give you an idea of whether changes in loss connect with real tangible gains in skill on the problem.
should I stop training the model when the it reaches the minimum loss?
Yes, on the validation set.
If I reaches the minimum validation loss value,
However, the validation accuracy value is not high.
In this case, Have I stop learning?
Minimum loss is 0, if you hit zero loss it suggests the problem is trivial (ML is not needed) or the model has overfit.
Sorry, I want to say, if I reach a minimum validation loss value (not 0) but at this epoch the validation accuracy is not the highest value(after this epoch, the validation accuracy is higher).
At this situation, should I stop training?
Perhaps try it and see.
Can I measure the model fitness from the accuracy learning curves instead of the loss learning curves?
Sure. It just may not be as helpful in diagnosing learning dynamics.
what do you mean by learning dynamics ?
How the model learns over time, reflected in the learning curve.
Is there is a problem , if the loss curve is a straight line that decreases over the epochs?
Loss should decrease.
If you please, Can you suggest for me a good reference to read more about learning curves?
Yes, see the references at the end of the post.
Does the validation loss value must be lower than the training loss value?
For a well fit model, validation and training loss should be very similar.
which is preferred using:
– the early stopping or
– analyzing the output to find the minimum validation loss
It depends on the model and on the dataset.
Perhaps experiment and see what is reliable for your specific scenario.
Which is preferred using early stop with low patencie value or high value
It depends on your choice of model and the dataset. Perhaps experiment?
If I reaches the minimum validation loss value, while at this epoch there is a gap between the training accuracy and the validation accuracy.
Should i stop learning or not?
Maybe. Perhaps test this strategy.
Why should I stop when I reaches a minimum validation loss and not when I reaches the minimum gap between the validation and training loss?
Try a range of approaches and see what results in a robust and skillful model for your dataset.
In general, you want to stop training when the train and validation loss is lowest and before validation loss starts to rise.
Great tutorial!
On the second graph showing an undertrained model, it seems like the validation data loss should track higher than the training data loss, which is different then what the graph shows. Perhaps an editing error?
Again, great work here. Thanks for sharing.
No error, the val set in that case was perhaps under-representative. The important point was the shape of the train/val curves showing that more meaningful training is very possible.
Hi Jason, this is a very informative post. However, one question regarding the section Unrepresentative Validation Dataset:-
An unrepresentative validation dataset means that the validation dataset does not provide sufficient information to evaluate the ability of the model to generalize.
This may occur if the validation dataset has too few examples as compared to the training dataset.
My question is, if you have more validation examples, say 30% of the entire dataset, then will the curve smooth-out ?
Or, the fault is in the distribution of the validation set itself ? (the val_data might not contain the same distribution as the train_data contained ).
If the above sentence is not a case of Unrepresented validation dataset, then how would the curves look like when the validation data distribution is completey different from the training_dataset. And what are the remedies to counter-act this issue ?
It depends on the specifics of the data and the size of the dataset you’re sampling.
A good solution is to get more data and use a 50/50 split.
Very Nice! Would appreciate if you let me know which of these models is better when applied to the same training/validation sets: the one that produces lower validation loss and also lower training loss but its generalization gap is higher than the one with higher validation and training set. I give you an example:
Model1: tr_loss =0.5 val_loss =1.5 gap =1
Model2: tr_loss = 0.8 val_loss = 1.6 gap =0.8
Thank you!
Generally, model selection is specific to a project, my advice won’t help.
It is a good idea to choose a model that meets the requirements of project stakeholders, typically this is good skill on a hold out dataset and low complexity.
I hear you!
Thanks!
How bad is this noise ?
https://imgur.com/sSL3DRJ
Not so bad!
Hi Jason,
Can the training curve be used to assess a model that predicts Time Series?
As i know, we cannot use Cross-Validation for time series, (Walk-forward validation)
so how meaningful is it to use the learning curve?
Is experience, training size? or epochs?
Yes, each time the model is fit, the learning curve can be a invaluable diagnostic into learning behavior.
So the experience is training size?
How can i have a more training size in time series? (By going backward (for example add 1 day each time and appending the last train and test loss??
Not sure I follow, sorry.
You can have more data to train a time series model by adding more history, or more input variables measured at each time step.
Not sure how that is related to learning curves?
as i understood, the x-axis in the learning curve is not the epoch numbers,
it is the size of our training set, right?
No.
The x-axis of a learning curve plot is epochs.
Hi Jason,
I have been following your tutorials for awhile and has been very helpful! Thank you very much!
My question is directed to the unrepresentative validation dataset (the second graph), what remedial measure would you recommend in this case, apart from getting more data etc?
Can one also apply the dropout technique or it is restricted only for overfitting?
Thanks!
Alex..
You can use a larger validation dataset, such as half the training dataset.
More on how to reduce overfitting here:
https://machinelearningmastery.com/introduction-to-regularization-to-reduce-overfitting-and-improve-generalization-error/
Thanks for your reply!
One more question please but not related to this section, I observed that when I use a particular random seed generator as low as maybe 7-10 to obtain reproducible results in Keras and I change the seed again from a value let say above 30, I get different results including the graph shape.
Is this normal? Or do I have to always stick to the original seed given?
Thanks again!
Alex
Yes, see this:
https://machinelearningmastery.com/faq/single-faq/why-do-i-get-different-results-each-time-i-run-the-code
This is normal. Deep learners (and some classical ML algorithms) are highly stochastic. This is why you should always do multiple experiments and get statistics of your results. For example average training-/validation loss and std on the losses over multiple experiments with the same hyperparameters (experiments differing only by RNG seed). Here’re some other articles on this blog about randomness in results: https://machinelearningmastery.com/reproducible-results-neural-networks-keras/, https://machinelearningmastery.com/evaluate-skill-deep-learning-models/ and https://machinelearningmastery.com/randomness-in-machine-learning/.
Also: Some pseudo random number generators don’t work well with small seeds. So if you get certain results with multiple different small seeds and different results with significantly larger seeds, that may be an indication that the RNG used by your libraries doesn’t work well with small seeds. Use larger seeds in stead.
Spot on!
Except the stuff on seeds. I think all libs use good random number generators these days, the results with different seeds are very likely “lucky” and not representative.
Ok, that has answered my question!
Thank you very much!
Alex
Happy to hear that.
There is something very strange going on with these plots. The training loss seems to be always much higher than the validation’s. But how is that possible? Except for the case of unrepresentative data, when you train a model you expect to see a much lower loss on the training set (where the model parameter are optimized for the set) versus the validation set where the training model needs to generalize (the parameters are not optimized for this set).
Check out Andrew Ng’s notes here: http://www.holehouse.org/mlclass/10_Advice_for_applying_machine_learning.html
The training loss is always (except corner cases) lower than the validation set.
Typically people will use 30% or smaller of the training set as a val set, which makes the loss on that set noisy/unreliable.
It’s super common, sadly.
A 50% split might be more appropriate if there is sufficient data.
I think the loss function needs to be normalized by the size of the dataset. That is, have 1/m_{training size} when calculating the training loss function and 1/m_{cv size} for the other set.
Not sure I agree.
Hi Jason,
Thanks for the detailed explanation. It helped a lot. I am wondering if I could translate it into Chinese, and repost it on my blog, with the address to your post annotated?
Thanks!
Please do not translate the posts:
https://machinelearningmastery.com/faq/single-faq/can-i-translate-your-posts-books-into-another-language
I was wondering if you can clarify on loss values and boundaries. In other words, what does loss value of greater than 1 mean?
(with accuracy over epoch, all of the values are between 0 and 1 – or 0% and 100%)
I have one another question. Based on this post loss-over-epoch is informative in terms of fit. How about accuracy-over-epoch (accuracy of train and validation sets)?
Typically not as useful. Too coarse grained.
Loss is relative to a model/dataset.
I recommend interpreting broad dynamics only, not specific values.
Thanks a lot for your explanation and clarification.
You’re welcome.
I have some cases that the loss plot has increasing behavior over epoch. I did not see this example in your post. I was wondering which category it belongs to.
If training loss is increasing, it is probably a sign of overfitting.
There are examples of this in the above tutorial.
Hello Jason, I have impemented a RNN and my validation loss starts increasing after 2 epochs indicating that the model probably is overfitting. However, I compared the evaluation results of Precision and Recall and a run on 2 epochs and on 10 epochs just gives me almost similar results.
How can I interpret that? Does it mean that the model converges in 2 epochs and does not need more training? And can I argue that it would be the best point to stop after 2 epochs even though the validation loss increases after 2 epochs and indicates overfitting?
Thanks!
Yes, your reasoning seems good. Perhaps try smaller learning rates to slow down the learning?
How much of a gap between validation and training loss is acceptable?
Good question.
As small as possible. At some point it becomes a judgement call.
Thanx Jason.
How do you generate these graphs? Also, for each case, what parameter do we need to tune?
You can generate line graphs in python using matplotlib and calling the plot() function.
See this on reducing overfitting:
https://machinelearningmastery.com/introduction-to-regularization-to-reduce-overfitting-and-improve-generalization-error/
Good morning, I build a neural network in order to predict a physical quantity (regression task), I plotted the chart “training loss/validation loss vs epochs”, I can see that, at first, both are decresing and than they become constant but the validation loss is always just below the training loss (this difference is very small). Is it overfitting? If both (train and val loss) became constant (after decresing) is it importan if one stay over the other or vice versa?
I would like to send you some plot but I don’t now how can I do.
A small difference between the loss values might mean a good fit.
Thanks for the answer, I upload in a google drive folder 5 loss function chart where the val loss is under the train loss. Can you check if it is a case of overfitting? Because I’m a bit confused. Thank you!!
This is the link: https://drive.google.com/open?id=1sv1Qn9RhLRL7UXBgLOzFNWga5JHzJHCF
Sorry, I cannot.
Hi Jason,
Thank you for the post. In case of an unbalanced classification problem in which the training dataset was resampled, we are very likely to have a chart like the one you explained in “Unrepresentative Validation Dataset” as the validation dataset is still unbalanced representing the real world. In this scenario, do we have to analyze the performance of the model in a different way?
Thanks.
Perhaps. You could try plotting a metric you’re using for evaluation rather than the loss.
Thanks, the article is very helpful.
But I still have question about how you define a good fit. You say there could be a small generalization gap. But how I should define the “small”?
I got a curve and the validation loss decreases to a point of stability around 0.06, while the training loss is stable around 0.03. How should I evaluate it?
Good question. It is relative, e.g. is the gap relatively small, shrinking, stable.
Hey Jason, great job as always.
Regarding Roland Fernandez reply, the first reply to this article. I have built some models and compiled them with ‘mse’ loss and I’m getting at the first epoch a value of 0.0090,and at second a value of 0.0077,and it keeps learning but just a little bit per epoch, drawing at the end an almost flat line like the one on the First Learning Curve “Example of Training Learning Curve Showing An Underfit Model That Does Not Have Sufficient Capacity”. So I want your opinion on this.
Does these model as Roland say aren’t representative of underfitting due to the low values, or are in fact underfitting as you established in the article?
I most add that the obtained predictions with these models are in the expected range.
If loss stays flat during learning, that is odd. It might be the case that the problem is either trivial or unlearnable – perhaps the former in this case where any set of small weights produces good predictions. Just a guess, perhaps more research is required.
What do you suggest that I should do then to determine the reliability of this models, or if they are an applicable solution to the problem.
Start by selecting a metric that best captures the objectives of the project for you and stakeholders.
Then design a test harness that evaluates models using available data. E.g. for modest amounts of data for regression/classification, use repeated stratified k-fold cross-validation.
Compare results using the mean of each sample of scores. Support decisions using statistical hypothesis testing that differences are real.
Use variance to comment on stability of the model. Use ensembles to reduce the variance in final predictions.
Each of these topics is covered on the blog, use the search feature or contact me.
Learning curves can provide a useful diagnostic for a single run of a single model to aid in tuning model hyperparameters.
Thanks very much
You’re welcome.
Hey again, the results of the loss I explain before are at fit all the samples in each epoch for almost 100 epoch.
The data dimensions are as follows:
inputs 5395,23,1.
outputs 5395,23.
And each sample as I explained in other occasions correspond to this format:
Inputs:________Outputs:
1,2,3___________4, 5,6
2,3,4___________5, 6,7
3,4,5___________6, 7,8
Could this be causing that the learning curve is almost flat? Should I be training at batch_size?
Perhaps, it is hard to know.
Maybe explore other model architectures? other learning rates? other optimizers? etc.
Hi Jason,
I tried to finetune CNNs for 14 class image classification. Dataset has 2000 image. Each models produced similiar loss values range 0.1 to 0.4. For example:
Best epoch:20/50
train_acc: 0.9268600344657898 train_loss: 0.27140530943870544
val_acc: 0.9145728349685669 val_loss: 0.358508825302124
Do you think models are good for publication, or a good model has to loss value under 0.1?
I cannot know if the results are good objectively.
Good results are relative to a naive model and to other models on the same dataset.
1-) Can it be said that my models are not sufficient just by looking at the loss values and should I decrease my loss values below 0.1 and increase the accuracies above 0.95?
2-) Or are val_acc (0.89 ~ 0.94) and val_loss (0.1 ~ 0.4) values sufficient for 14 classes with high similarity?
Not really, you can interpret the cross entropy objectively see this:
https://machinelearningmastery.com/cross-entropy-for-machine-learning/
It is much better to select a metric and compare models that way:
https://machinelearningmastery.com/faq/single-faq/how-to-know-if-a-model-has-good-performance
Hello Jason,
Is there any range which is considerd good for the Loss values (y-axis), say, the highest loss value must be above some specific value?
Or that each problem has it’s own range of values, where only the shape of the curves matter?
Thank you
Yes, you can interpet cross-entropy:
https://machinelearningmastery.com/cross-entropy-for-machine-learning/
Generally, it is better to compare the results to a naive model.
Hello, Jason. I met Your Website two weeks ago. You inspired me. I’d want to meet you and shake your hand and thank you. Please don’t stop writing.
İstanbul..
Thanks!
Hello Sir
what if i obtain a high validation accuracy, but the curve is not smooth?
what is the reasons of that?
thanks
Perhaps the dataset is small or the model has high variance.
So is it bad or not? If yes, how can I fix this issue?
For my case : i use alexnet model with 1 GB of .dicom file (1000 .dicom) dataset , divided into 2 classes.
Thanks sir.
It is only good or bad relative to other results that you can achieve on your dataset, e.g. relative to a naive model.
what is generalization error? is it a gap between training and validation loss?
Generalization error is the error the model makes on data not used to train the model. Error on new data.
Hi, I m not clear about whether learning curve can be used as accuracy metric for LSTM ? Can we use learning curve on any predictive model irrespective of the prediction algorithm used? What accuracy metric is best for deep learning algorithms?
Yes, see this:
https://machinelearningmastery.com/diagnose-overfitting-underfitting-lstm-models/
This can help with choosing a metric for classification:
https://machinelearningmastery.com/tour-of-evaluation-metrics-for-imbalanced-classification/
This article is very helpful along with chart. It will be nice if this has python code for detail understanding so that code & chart can go side-by-side.
Is it possible you provide example with code ???
How would the code help in interpreting the plots?
Hi Jason,
I have a question for you. This is not related to this post.
Im doing a small research project based on Deep Learning. i’m trying to predict the ratings that a user will give to an unseen movie, based on the ratings he gave to other movies. I’m using the movielens dataset.The Main folder, which is ml-100k contains informations about 100 000 movies.To create the recommendation systems, the model ‘Stacked Autoencoder’ is being used. I’m using Pytorch for coding implementation.
I split the dataset into training(80%) set and testing set(20%). My loss function is MSE. When I plot Training Loss curve and Validation curve, the loss curves, look fine. Its shows minimal gap between them.
But when I changed my loss function to RMSE and plotted the loss curves. There is a huge gap between training loss curve and validation loss curve.(epoch: 200 training loss: 0.0757. Test loss: 0.1079)
In my code, I only changed the loss function part(MSE to RMSE). I applied the Regularization techniques such as Batch Normalization and Dropout but still there is a big gap between the curves.
I’m new to deep learning, but do you know whats the reason why there is huge gap between the curves when applying RMSE?
Is it something to do with the Evalaution metric or something wrong in the coding part?
Thanks.
I recommend using mse loss, but perhaps calculate metrics for rmse, e.g. don’t use rmse to train the model but only to evaluate the predictions.
Hi Jason.
Thanks for your feedback.
So I only use ‘RMSE’ (Loss Function) for testing the Model?
And for training the model, I leave out the loss function part or use ‘MSE’ as loss function for training the model?
https://towardsdatascience.com/stacked-auto-encoder-as-a-recommendation-system-for-movie-rating-prediction-33842386338
My project is based on this.(Click the link).
Sorry, I get sent 100s of links/code/data each week.
I don’t have the capacity to review third party stuff for you:
https://machinelearningmastery.com/faq/single-faq/can-you-explain-this-research-paper-to-me
Use RMSE as a metric. Do not use RMSE as a loss function (e.g. do not minimize rmse when fitting the model), use MSE.
Thanks Jason.
I will try that.
By the way,I have a list of questions for you.
I’m still new to Deep Learning and I’m confused with the terminologies of Validation Loss and Test Loss. Are they the same or completely different?
And also you can’t train the model on the test data?
Is it only reserved for testing(evaluate the predictions)?
I know you can’t review my data, but when I added the validation loss to my code, I reused the training loop and removed the backward and optimizer.step() calls. My metric for that is MSE. I assumed that validation loss is the same as Test loss. But I may be wrong.
I like to hear your feedback on this.
Yes, we can calculate loss on different datasets during training, such as a test set and validation set, see them defined here:
https://machinelearningmastery.com/difference-test-validation-datasets/
After we choose a model and config, we can fit the final model on all available data. We cannot fit the model on test data in order to evaluate it as the model must be evaluated on data not used to train it to give a fair estimate of performance.
Thanks Jason.
Now I understand the concept of Validation and Training sets.
In my mini project, i’m predicting the ratings that a user will give to an unseen movie, based on the ratings he gave to other movies. The model, i’m using is Stacked Autoencoder.
For my another task, I want to compare with other Deep Learning models. For instance I want to use MLP (Multilayer perceptron) or Logistic Regression(Machine Learning Model). Is it possible to employ those models for movie rating prediction from 0 to 5?
Thanks.
Yes.
I’m building a LSTM model for prediction. The validation error curve is flat, validation mse is less than training mse in the end. val_loss=0.00002, training_loss = 0.013533.
I read your article carefully but I’m not sure whether my validation set is unrepresentative. Should I expand my validation set?
Here is the chart and problem:
https://stackoverflow.com/questions/62877425/validation-loss-curve-is-flat-and-training-loss-curve-is-higher-than-validation
Thanks.
It may be the case that your validation set is not representative of training or too small.
Hi Jason.
Thank to your post I know what is Under, Over and Good fit.
I am also currently a small ANN model (95 input, 3 classes output, 2 hidden layers with 200 nodes and 30 nodes respectively).
My dataset is small dataset (105 samples with 95 features as each samples) with shape (105, 95). I split my data into Train data (80 samples), Validation data (10 samples) and Test data (15 samples).
My question is I tried to train, validate and predict my model for 10 times. for about 7 or 8 times I observed a Good fit (Train-Validation Accuracy and Loss Graph) and other 3 or 2 times I got Overfitting. Is this phenomenon is alright? and although its Overfilling the prediction on Test data quite good (over 85%).
Thank you very much for your help.
Perhaps you can change the configuration so the model is more stable on average.
Hi Jason. Thank you for your reply.
The configuration here you mean is the hyperparameters (like number os layer, nodes or train test split, etc,.. ) right ?
Correct.
DO we have real world example on learning curves ????
That will be much better to understand & how to plot it.
Yes many – search the blog, perhaps this will help:
https://machinelearningmastery.com/how-to-develop-a-cnn-from-scratch-for-cifar-10-photo-classification/
Hi Jason,
thanks for your great support.
I would like to ask possible reasons for the zigzag/crowdy validation curve over training epochs and also, how can I minimise/mitigate it. Generally, training curve changes smoothly but validation curve not. Guidance please.
It might be the case that the validation set is too small and/or not representative.
Hi Jason,
Is there any way to attribute these behaviors to model architecture/hyperparameter settings rather than the training/validation data distributions? The reason I ask is that I have run a hyperparameter search with the exact same training/validation data and achieved models that have training/validation curves that look like 3 of the above examples that you give (if I could embed images here I would).
Model 1: Curves appear like the example you give for “Unrepresentative Train Dataset”, Model 2: appears like the example you give for “Unrepresentative Valid Dataset” ,and Model 3: appears like the “validation dataset may be easier for the model to predict than the training dataset” example that you give.
Have you got any intuition about this? It would be appreciated.
Thanks for your blog, I’ve referenced it numerous times!
The learning curves are impacted by the structure of the model and configuration of the learning algorithm, the data has much less effect – if prepared correctly.
Here “unrepresentative” means your sample is too small.
Hello !
This post is very interesting, thank you for that. However, I have a question concerning a training I did. I’m new in deep-learning, and I used a code that was already written. I didn’t succeed in ploting the curve for validation (I think you mean what I would call “test”). I only have the loss curve of training + validation, but not the one for test. I trained my neural network on 50 epochs, and I only know :
-the intermediate accuracy values for validation (not test) (after saving weights after each 5 epochs)
-the value of accuracy after training + validation at the end of all the epochs
-the accuracy for the test set.
I have an accuracy of 94 % after training+validation and 89,5 % after test. Concerning loss function for training+validation, it stagnes at a value below 0.1 after 35 training epochs. There is a total of 50 training epochs.
Is the only little difference between accuracy of training+validation and test sufficient to say that my network does’nt overfitt ?
I wanted to say “it stagnates at a value …”
Thanks!
No problem, use val instead of test.
If the hold out dataset is too small the results will be unstable.
Thank you for your answer. I don’t understand why you say “Use val instead of test.” In fact, the only think I can do with my code is :
-draw accuracy curve for validation (the accuracy is known every 5 epochs)
-knowing the value of accuracy after 50 epochs for validation
-knowing the value of accuracy for test
Hi Jason,
thanks again for the article.
During the whole deep network training, both of validation data loss and training data loss reduces along with the increase of the epochs. But the reduction of validation data loss is much smaller than the reduction of training data loss, is it normal and representative?
when epoch is small from 0, the curve of training data loss starts high and reduces along the epochs, but the validation data loss curve starts already small and then reduces along the epochs slightly.
Thank you.
Maybe your validation dataset is too small?
Thank you, Jason, I have tried to get more samples from training data to validation data to increase the validation data sample size, still the learning curve shows that although both validation data loss and training data loss reduces along with epochs, but the reduction of validation data loss is much smaller than training data, finally, the loss (mse, standardised data with mean 0 and std 1) of training data is 0.25 while the loss of validation data is 0.41, is it still overfitting?
Different literature always says good fit is that the validation loss is slighter higher than training loss, but how high is slightly higher, could you please give some hint?
Thank you as always.
Nice work.
Perhaps try slowing down the learning with an alternate learning rate or adding regularization.
If the behavior remains stubbornly the same, perhaps you are reaching the limits of your chosen model on your dataset.
Thank you for your answer of the 12th of August. But I’m still not sure to understand. In this article (of this page), what is for you “training” and “validation” ? Has it the same meaning like in this article ? : https://machinelearningmastery.com/difference-test-validation-datasets/
I have results (F1 score, precision, recall, …) after the last validation for my neural network. I have also results after using test set to evaluate performances of neural networks on new images. The results on the validation set and the test set are slightly different (4,5% difference on accuracy), the accuracy on the test set are a little worser (of 4,5%). Is this what we call “generalization gap ” ? Why the results on test set are little worser (of 4,5%) ?
Thank you for your help
Yes, you can expect small differences in performance from different samples of data, perhaps this will help:
https://machinelearningmastery.com/different-results-each-time-in-machine-learning/
Thank you very much for your answer. This other article is very interesting. In my case, I use a neural network for semantic segmentation (SegNet). After the last validation (=results on the validation dataset for final model), I got 91,1 % accuracy. Using this final model on the test dataset, I got 85,9 %. From your article “Different results each time…”, I suppose I can explain this difference by a high variance of my model (the validation dataset and the test dataset have different images, 3 images of 5000*5000 pixels for each). Is it right ? In your article you seem to speak about variance only for training data, so I’m not sure of my assumption.
Thank you for your help
Nice work!
Yes, variance in the final model is common, which can be overcome by using an ensemble of final models:
https://machinelearningmastery.com/ensemble-methods-for-deep-learning-neural-networks/
Hi, Jason, thanks for this post and your blog! I’ve recently started my ML/DL journey and I found your blog extremely helpful.
I have a question about train/val loss. What if a model learns only during first n iterations and then the loss and accuracy reach a plateau during the very first epoch, and the val loss after that first epoch is huge? I’m using Adam with default parameters.
Stop training when the model stops learning. Perhaps try alternate configurations of the model or learning algorithm.
For the 3rd figure, it is clearly an overfitting phenomenon. But is it harmful to continue training? Cause the continuing training didn’t increase the validation loss anyway, at least for now. The reason I asked is I have seen one specific behavior that the model is ovetfitted like the 3rd figure, but both the Accuracy and IoU for validation set still increase if the training process continues. What do you think?
The third figure titled “Example of Train and Validation Learning Curves Showing an Overfit Model” shows overfitting.
Continued training in this case will result in better performance on the training set and worse generalization error on the hold out set and any other new data.
The behaviour of loss typically corresponds to other metrics. But good point, perhaps plot the metric you intend to use to choose your model.
What could be possibly done as improvements in the case of an unrepresentative train dataset? (if I do not have the option to increase the dataset)
Your model will only be as effective as your training dataset.
Perhaps try oversampling, such as smote.
Perhaps try data cleaning to make the decision boundary more clear.
Perhaps try transforms to find a more appropriate representation.
Hi, Nice article. I have a question though.
What is the difference between:
– a ML Learning curve (as described here) and
– a learning curve theory as a graphical representation of the relationship between how proficient someone is at a task and the amount of experience they have) https://en.wikipedia.org/wiki/Learning_curve
Thanks for your time
Thanks!
No relationship.
Hi Jason,
What is your suggestion on the model learning curves having – loss 0 and accuracy 1 on the first epoch itself?
Also, what are the probable reasons for this?
Any link where this question is addressed?
Thanks always.
It suggests a trivial problem that probably does not need machine learning:
https://machinelearningmastery.com/faq/single-faq/why-cant-i-get-100-accuracy-or-zero-error-with-my-model
Hello Jason,
I have a question regarding my learning curves. I wanted to post my question on stat.stackexchange, but I have a feeling that I can trust you more….
1.) I have a dataset with 23.000 entries and i have a binary classification task. The target variable is distributed like 87% vs 13%. XGB Classifer performs best on my data and results in an allover accuracy with 97.88%.
My curve looks like this:
https://ibb.co/NsnY1qH
As you can see I am using Logloss for evaluation. My interpretation is that it doesn’t over- or underfit the data and that I am good to go.
2.) I have a regression task for the last 13% of the data (positive samples) and I have to predict the different contract values.
My learning curve looks like this:
https://ibb.co/MnZbB15
My interpretation here is that I need more data to make a good prediction. The contract values range from 0 to 200.000 $ and distribution is super skewed…
Thanks as always for all your support!
Marlon
I try to avoid interpreting results for readers, sorry.
Perhaps explore additional models, configs, data preps to see if you can achieve better results, otherwise perhaps yu have hit the limit for your dataset.
Sorry I didn‘t know that and thank you
Excellent post, very informative. Just have a couple of questions if you don’t mind please:
1. When you refer to validation set, you actually mean validation set from a 3 split dataset (Train/validation/test)? it is just to make sure since in some places they call the test set, the validation test.
2. Is there any code available that we can use to replicate the charts that you showed? (it would be much appreciated)
3. Please correct if me I am wrong, if I was to do a nested cross validation, I think that I wouldn’t need to do learning curves since I am already arriving to the best possible model performance and generalization, theoretically (given a sufficient amount of data, the right number of iterations and features, and the right hyperparameter values). So, in my mind by using nested cross validation, there isn’t anything else that I could have done to reduce overfitting, hence making learning curves unnecessary, right?
Thanks!
Correct, validation set as a subset of the training set:
https://machinelearningmastery.com/difference-test-validation-datasets/
Yes, I have tons of examples on the blog, use the search box. Perhaps start here:
https://machinelearningmastery.com/display-deep-learning-model-training-history-in-keras/
Correct, learning curve is a diagnostic for poor model performance, not helpful for model selection / general test harness like nested cv.
Hi Jason,
If the data set has 3 or more features X1, X2,… and I want to plot a graph of output variation vs all the features X1,X2,…, how should I do that? What would be its significance in ML?
Thank you
Perhaps pair-wise scatter plots, one for each pair of variables.
Thank you so much for help.
I looked through this article https://machinelearningmastery.com/visualize-machine-learning-data-python-pandas/
Hi, Jason
I have model learning curves with loss curves – both, train and test – okay, however, both training and the testing accuracy is at 100% from the first epoch.
What should I do?
Any suggestions?
Always thank you!
This is a common question that I answer here:
https://machinelearningmastery.com/faq/single-faq/what-does-it-mean-if-i-have-0-error-or-100-accuracy
Hello,
I would be grateful if you can diagnose my learning curves here: https://imgur.com/a/z5ge9QI
The accuracy that I got is 97%, but I don’t know whether the model is overfitting or underfitting based on the learning curves that I got.
Thank you.
Sorry, I avoid trying to interpet results for readers.
Instead, I provide general advice so you can interpet results yourself.
HI, thanks for the informative post! What if after each run of my python app the learning curves generated by it looks too different from each other. sometimes the validation curve is too noisy and sometimes it converges with the training curve. Does it say something about the dataset, or it’s just that my code for generating the curves is wrong? Thank you!
You’re welcome.
Good question, this may help:
https://machinelearningmastery.com/faq/single-faq/why-do-i-get-different-results-each-time-i-run-the-code
Hello Jason,
Thanks for the tutorial, nothing like refreshing the basics.
You know, I have had many times behaviours similar to the graph labeled as “Example of Train and Validation Learning Curves Showing a Validation Dataset That Is Easier to Predict Than the Training Dataset”. We should increase the size of the validation set and reduce the one of training, right?
Putting some figures on that example: if I obtained that figure with a split of 80% train and 20% validation, a good approach for a better fit would be trying 70%-30% then? I’d love some “based-on-experience” reply here, because you know, “trial and error” sometimes might take hours…
I have always tackled that issue by using callbacks, but maybe I’m limiting the learning capability of my model, so this could be the right momnt to realize something I (probably) have been doing wrong the whole time…
Thank you and best regards.
Thanks.
I go for 50-50 quite often… then repeat the experiment a few times to average the resutls.
Hello sir ,
mu problem is regression , i have 2 models
when i plot with firt model : give a good fit but the value of RMSE it is not good
but when i plot second model i have test loss plot below of train loss plot with difference between them nearly similair of “Unrepresentative Validation Dataset” (train loss decrease and stable) but with the RMSE value better then of first model
i have 191981 sample for train / 47996 sample for test
please the second model is correct ?
Perhaps test a suite of different models and use the one that gives the best performance for your specific chosen metric.
Thanks for the informative article Jason.
May i please know any possible solutions to Unrepresentative Validation Dataset problem?
I am applying it to ECG problem where different patients have different cardiac cycle patterns. So even though there are about 4000 normal training patterns to learn from but they all look different because of the inherent nature of the problem itself (i.e. some difference in ecg pattern for each patient).
Thanks.
You could try using a large dataset for validation, e.g. a 50/50 split of training.
Not sure how validation sets work for time series, might not be a valid concept.
okay, Thank you.
Hello Jason
I always get loss: 0.0000e+00 – val_loss: 0.0000e+00 starting from Epoch 1 itself of model training and hence a straight line at 0 learning curve.
Do you advice any possible reasons regarding this model behaviour, which possible to tune? Thanks.
It may suggest that your problem is easily solved / trivial, e.g.:
https://machinelearningmastery.com/faq/single-faq/what-does-it-mean-if-i-have-0-error-or-100-accuracy
Hello,
Is this overfit?
https://ibb.co/Z6nrXM4
Thank you very much
Sorry, I try to avoid interpreting results for readers.
Okay, thank you very much for the reference.
You’re welcome.
https://docs.google.com/document/d/1Va__vfW7JaXSLOsRuC5mXX4T1333AUPI/edit?usp=sharing&ouid=107190645093315861813&rtpof=true&sd=true
i wanted to ask jason what are best practices to find inflextion point,
in above learning curve, we can see loss continues to decrease but val_loss has a bump.
val_loss@ 0,01 ( epoch 0 – 20) point A inflection point gives closer prediction.
Does people use % decrease in loss and % increase in val_loss during same time to identify inflextion.
I earlier used inflextion point B b/w epoch 40-60 when val_loss was around 0.02 but that gives large prediction error.
Then I observed that b/w epoch 15-50 ( these are approx), there was 8% decrease in loss vs 100% increase in val_loss.
will that be sufficient crieria to stop training and choose point A as inflextion point?
thx
It is normal to see the loss keep decreasing when you train but validation loss may go up after a while. That’s overfitting starts. You can see the post on early stopping to learn more: https://machinelearningmastery.com/how-to-stop-training-deep-neural-networks-at-the-right-time-using-early-stopping/
Unless i didnt understand earlystopping and bestmodel correctly, i think below algorithm will give the best epoch and i dont think it is given by neither.
for an epoch to best epoch, loss shud be minimum across all epochs AND for that epoch val_loss shud be also minimum. for example if the best epoch has loss of .01 and val_loss of .001, there is no other epoch where loss<=.01 and val_loss<.001.
bestmodel only takes into account val_loss in isolation. it shud be in coordination with loss.
so we need to implement above algorithm to get best epoch because not all learning curves are smooth and have bumps.
not sure earlystopping also helps here to get to exactly that best epoch.
thoughts?
From Keras documentation on the earlystopping module, “Stop training when a monitored metric has stopped improving.” And you can decide what metric you want to monitor. The default is val_loss, however. Hope this helps.
Hello,
I am trying to built 3D CNN Regression Network. My input data is (64,64,64) voxel. Output is numerical values between 0-5. I tried some models in literature for feature selection part. Also I used min-max , log normalization and standardization for my output data. Although I used dropout and small networks and nodes in fully connected part, I couldn’t obtained a good validation loss as my training loss was decreasing.
The validation loss slightly increase such as from 0.016 to 0.018. But the validation loss starts with very small number even in first epoch. What should I do ?
Thanks for reply
Validation loss value depends on the scale of the data. The value 0.016 may be OK (e.g., predicting one day’s stock market return) or may be too small (e.g. predict the total trading volume of the stock market). To check, you can see how is your validation loss defined and how is the scale of your input and think if that makes sense.
Sir these are the results from my model. https://snipboard.io/7kWsuz.jpg Presumably this is because I have an unrepresentative dataset, maybe if you could clarify that would be great. Thanks
Looks like the validation set is small/noisy. Also perhaps the number of epochs is too few.
hello dr. Jason ;
my dataset training is 30.000 images and for testing 5000. I got the plot like
https://ibb.co/Wpmzmh3
how can I solve this problem, please ? epochs stopped at epoch 26
The loss difference between training and validation is not very big. Is that a problem? I see your model converged quickly.
Hi, Dr Jason, your posts are very useful. I trained four regression models and the learning curves shown within the link. How do you say for the models? Can I use them to make the predictions?
https://docs.google.com/document/d/1_OjzPLk9QBPVR1aNFNQGDOZIJSUfTUcF5mFvEGZa0A0/edit?usp=sharing
Hi Bruce…While I cannot speak directly to your project, I would recommend establishing a baseline of performance by utilizing a naive model and then comparing the performance of each against this baseline in terms of root mean square error.
hi all
I a trying to understand this learning curve of a classification problem. But I am not sure what to infer. I believe that I have overfitting but I cannot sure.
1.Very low training loss that’s very slightly increasing upon adding training examples.
2.”Gradually decreasing validation loss (without flattening) upon adding training examples”.
However, I do not see any gap at the end of the lines something that is usually can be found in an overfitting model
On the other hand, I might have underfitting as:
1. The learning curve of an underfit model has a low training loss at the beginning which gradually increases upon adding training examples and stay flat, indicating the addition of more training examples can’t improve the model performance on unseen data
2.Training loss and validation loss are close to each other at the end
However, the train error is not to big something that usually is found on underfitting models
I am confused Can you please provide me with some advice?
https://i.stack.imgur.com/xGKAj.png
https://i.stack.imgur.com/gkRMn.png
Hello Aggelos…The following may be of interest to you:
https://machinelearningmastery.com/improve-deep-learning-performance/
How does the second example curve of underfitting work? Why is the validation loss lower than the train loss? Is this a mistake in labeling, or is there something I’m missing? Thanks.
Hi Jurrian…The following will hopefully clarify:
https://machinelearningmastery.com/diagnose-overfitting-underfitting-lstm-models/
What are the types of learning curves in health and the difference between the past and now
Hi Belal…Please elaborate and/or rephrase your question so that I may better assist you.
What are the types of learning curves in health and the difference between the past and the present
“The loss of the model will almost always be lower on the training dataset than the validation dataset” and directly after you continue to show a plot where valid loss is lower than train loss. Can you please explain this?
Hi Dion…the following may be of interest:
https://pyimagesearch.com/2019/10/14/why-is-my-validation-loss-lower-than-my-training-loss/
Hi James,
I actually met a situation confusing me that the training loss is keeping decrease while the val loss is turn to stable (at about 60/100 epoch). The “generalisation gap” is going to larger (val loss is higher than train loss after 10/100 epoch).
Would you think this is a kind of underfitting?
Many thanks!
Hi Wyatt…You may find the following of interest:
https://machinelearningmastery.com/overfitting-and-underfitting-with-machine-learning-algorithms/
Thank you! really learned a lot in this article, though I still have a question to ask. I think I have the unrepresentative training data problem (my data are images) but I have equal distribution of classes in both train and validation set. Do you have any suggestions on what I should do to solve this problem? I can’t also afford to change the ratio of the split (my split is 8:1:1 train:val:test) since I have a very limited data, I’ve done data augmentation to no avail, the gap still remains. What might be the problem on this one?
Hi RJ…You are very welcome! Can you elaborate more on the issue or issues you are noting with the performance of your models so that we may better assist you?
I was working on a classification problem where i faced a strange behavior in learning curves. I plotted loss curve and accuracy curve. Accuracy of my model on train set was 84% and on test set it was 72% but when i observed the loss graph the training loss was decreasing but not the Val loss
Hi Talal…You may find the following of interest:
https://machinelearningmastery.com/overfitting-machine-learning-models/
Hi James, could u possibly give me a hint about why the train loss of my mlp model looks like a goodfit one, but the validation loss of it is almost a straight line like the one in the first underfit learning curve in this article?
Hi Jane…The following resources may be of interest:
https://machinelearningmastery.com/overfitting-machine-learning-models/
https://machinelearningmastery.com/introduction-to-regularization-to-reduce-overfitting-and-improve-generalization-error/