You can learn a lot about neural networks and deep learning models by observing their performance over time during training.
Keras is a powerful library in Python that provides a clean interface for creating deep learning models and wraps the more technical TensorFlow and Theano backends.
In this post, you will discover how you can review and visualize the performance of deep learning models over time during training in Python with Keras.
Kick-start your project with my new book Deep Learning With Python, including step-by-step tutorials and the Python source code files for all examples.
Let’s get started.
- Update Mar/2017: Updated for Keras 2.0.2, TensorFlow 1.0.1 and Theano 0.9.0
- Update Mar/2018: Added alternate link to download the dataset
- Update Sep/2019: Updated for Keras 2.2.5 API
- Update Oct/2019: Updated for Keras 2.3.0 API
- Update Jul/2022: Updated for TensorFlow 2.x API

Display deep learning model training history in Keras
Photo by Gordon Robertson, some rights reserved.
Access Model Training History in Keras
Keras provides the capability to register callbacks when training a deep learning model.
One of the default callbacks registered when training all deep learning models is the History callback. It records training metrics for each epoch. This includes the loss and the accuracy (for classification problems) and the loss and accuracy for the validation dataset if one is set.
The history object is returned from calls to the fit() function used to train the model. Metrics are stored in a dictionary in the history member of the object returned.
For example, you can list the metrics collected in a history object using the following snippet of code after a model is trained:
|
1 2 3 |
... # list all data in history print(history.history.keys()) |
For example, for a model trained on a classification problem with a validation dataset, this might produce the following listing:
|
1 |
['accuracy', 'loss', 'val_accuracy', 'val_loss'] |
You can use the data collected in the history object to create plots.
The plots can provide an indication of useful things about the training of the model, such as:
- Its speed of convergence over epochs (slope)
- Whether the model may have already converged (plateau of the line)
- Whether the mode may be over-learning the training data (inflection for validation line)
- And more
Need help with Deep Learning in Python?
Take my free 2-week email course and discover MLPs, CNNs and LSTMs (with code).
Click to sign-up now and also get a free PDF Ebook version of the course.
Visualize Model Training History in Keras
You can create plots from the collected history data.
In the example below, a small network to model the Pima Indians onset of diabetes binary classification problem is created. This is a small dataset available from the UCI Machine Learning Repository. You can download the dataset and save it as pima-indians-diabetes.csv in your current working directory (update: download from here).
The example collects the history returned from training the model and creates two charts:
- A plot of accuracy on the training and validation datasets over training epochs
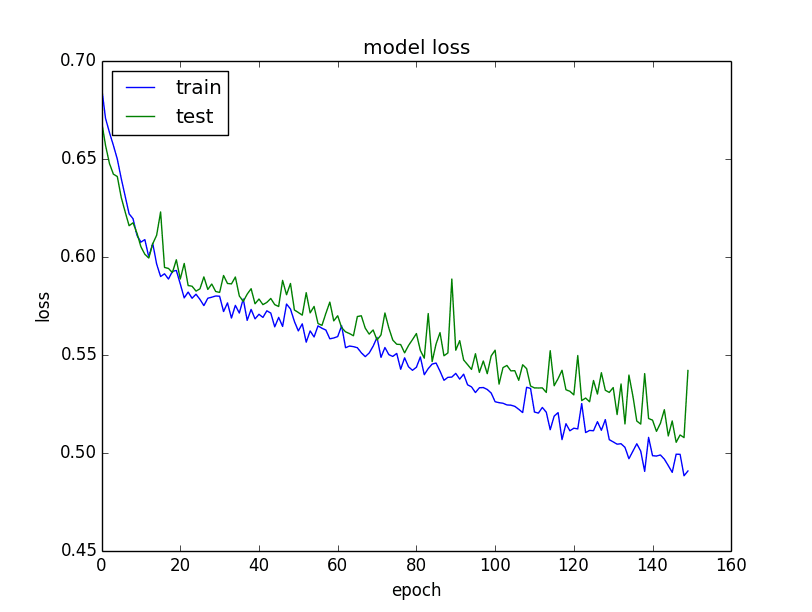
- A plot of loss on the training and validation datasets over training epochs
|
1 2 3 4 5 6 7 8 9 10 11 12 13 14 15 16 17 18 19 20 21 22 23 24 25 26 27 28 29 30 31 32 33 34 35 36 37 |
# Visualize training history from tensorflow.keras.models import Sequential from tensorflow.keras.layers import Dense import matplotlib.pyplot as plt import numpy as np # load pima indians dataset dataset = np.loadtxt("pima-indians-diabetes.csv", delimiter=",") # split into input (X) and output (Y) variables X = dataset[:,0:8] Y = dataset[:,8] # create model model = Sequential() model.add(Dense(12, input_dim=8, activation='relu')) model.add(Dense(8, activation='relu')) model.add(Dense(1, activation='sigmoid')) # Compile model model.compile(loss='binary_crossentropy', optimizer='adam', metrics=['accuracy']) # Fit the model history = model.fit(X, Y, validation_split=0.33, epochs=150, batch_size=10, verbose=0) # list all data in history print(history.history.keys()) # summarize history for accuracy plt.plot(history.history['accuracy']) plt.plot(history.history['val_accuracy']) plt.title('model accuracy') plt.ylabel('accuracy') plt.xlabel('epoch') plt.legend(['train', 'test'], loc='upper left') plt.show() # summarize history for loss plt.plot(history.history['loss']) plt.plot(history.history['val_loss']) plt.title('model loss') plt.ylabel('loss') plt.xlabel('epoch') plt.legend(['train', 'test'], loc='upper left') plt.show() |
The plots are provided below. The history for the validation dataset is labeled test by convention as it is indeed a test dataset for the model.
From the plot of the accuracy, you can see that the model could probably be trained a little more as the trend for accuracy on both datasets is still rising for the last few epochs. You can also see that the model has not yet over-learned the training dataset, showing comparable skill on both datasets.
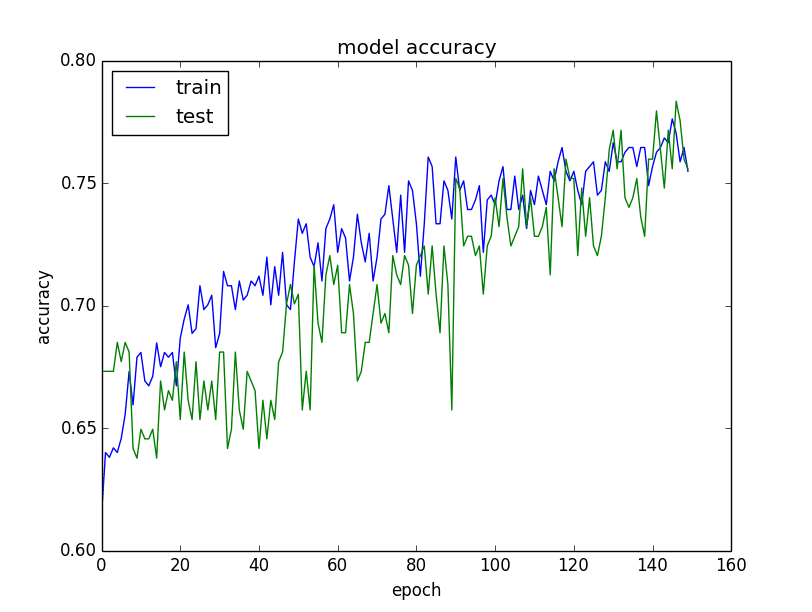
Plot of model accuracy on train and validation datasets
From the plot of the loss, you can see that the model has comparable performance on both train and validation datasets (labeled test). If these parallel plots start to depart consistently, it might be a sign to stop training at an earlier epoch.
Summary
In this post, you discovered the importance of collecting and reviewing metrics while training your deep learning models.
You learned about the History callback in Keras and how it is always returned from calls to the fit() function to train your models. You learned how to create plots from the history data collected during training.
Do you have any questions about model training history or this post? Ask your question in the comments, and I will do my best to answer.


Thanks Jason!
You’re welcome Marcel.
Hi, do you know how to use Callback to plot a picture in keras?
Hi great. Is there also a possiblity to plot accuracy and loss for every sample in each epoch.
For instance: 1 epoch, 60,000MNIST images => plot 60,000 accuracy/losses in that epoch?
The plots can do this in aggregate, you can calculate the loss and accuracy on each individual sample if you wish, but that would be a lot of data. I hope I have answered your question.
Hi Jason,
I’d love some guidance on how exactly to get that more granular loss and accuracy on each individual sample. My dataset is not that large so it wouldn’t be an insurmountable amount of data.
Thanks!
Zorana
Hi Zorana…Please elaborate on what is meant by “granular”. The following may be of interest in regard to improving accuracy:
https://machinelearningmastery.com/improve-model-accuracy-with-data-pre-processing/
Hi, I was looking for something similar. Did you find a way out ??
Thanks in advance.
history = model.fit(X,y, validation_split=0.33, epochs=150, batch_size=60000)
d=history.history
HI Randy,,
Hope the below code helps, please let me know
plt.plot(range(epochs), d.get(“loss”))
plt.ylabel(‘RMSE Loss’)
plt.xlabel(‘epoch’);
loss=d.get(“loss”)
for i in range(len(loss)):
if i%25 == 1:
print(f’epoch: {i:3} loss: {loss[i]:10.8f}’)
Hi Jason,
Thanks for your great post!
For the accuracy graph, what’s the indicator when it starts to get over-learned? What would the graph looks like when it happens?
Thanks in advance
Hi Alvin, great question.
If the model is overfitting the graph will show great performance on the training data and poor performance on the test data.
Hi! I am currently training my CNN for my research. The dataset is sparse. I’m using Conv->Conv->Pool->conv->dropout->gap->dense layers.
For many different combinations of the architecture, the model seems to overfit no matter what I do. Is there a methodical way to go about solving this?
Yes, try adding more regularization.
I have a list of techniques to try here:
https://machinelearningmastery.com/introduction-to-regularization-to-reduce-overfitting-and-improve-generalization-error/
Jason,
Great tutorial and very articulate around how each of the network in keras works.
I had a quick question:
does keras support this kind of dataset for implementing an autoencoder rather than a FFN ?
Thanks..
regards
Sunny
Hi Suny,
Keras does support autoencoders, but I don’t use them generally as they are been surpassed by big MLPs and specialized methods like LSTMs and CNNs that can learn features while training.
Hello Jason (and all).
When dropout is applied, I wonder how the loss and acc values are computed. After each epoch, does the program still drop the neurons/weights to compute the loss and accuracy, or use the whole network?
Great question,
Dropout is only applied during training (backward pass), not on making predictions (forward pass).
Hi Jason,
Thanks for all of the great tutorials!
I’d like to be able to plot the history of a stateful LSTM. I’ve tried something like the below, but in this case it’s failing b/c I’m asking python dicts to do something they don’t like (I’m new to python). I’ve tried some other approaches which have all failed for python-related reasons.
Reprinting your .fit() code from your stateful tutorial (and adding a failed attempt at capturing history):
my_history = {}
for i in range(100):
history = model.fit(trainX, trainY, nb_epoch=1, batch_size=batch_size, verbose=2, shuffle=False)
my_history.update(history)
model.reset_states()
What am I doing wrong here? Thanks!
Very interesting idea Bo.
Consider using a list and appending the history object to the list. Also consider just creating an all new model each iteration to try and keep it all apples to apples comparison.
Let me know how you go and what you discover!
How can one display the neural net used in keras ?. Is there a simple way to plot the network
This might help nagendra:
https://keras.io/visualization/
Hi Jason,
I would like to visualize loss and accuracy graphs per each epoch during training.
I was thinking of doing so by writing a callback but wasn’t sure exactly how and if this can be done.
What do you suggest?
Thanks
Hi Aviel, Keras is not designed to do this natively.
Maybe use a callback to post to a file/db and use a separate process to plot?
I would suggest getting something ghetto like that going and see how it looks.
Hi,
First, thanks so much for the tutorial!
I have a quick question. I want to plot the graphs but my computing resources are **not** local. Is there a way to have a callback or something that stored each error value in a CSV file and later plot it? Or is there a way idk to save history object, maybe pickle it and then send to my local computer with some standard tool, like rsync or dropbox?
What do you recommend for these remote plotting experiments? I just need to get the data somewhere I can plot the error/loss vs epochs.
(also, can I plot vs iterations instead of epochs? just curious)
Hi Charlie,
You can store the history in an array and then create and save the plot as a file, without a display.
Hello,
I have a very simple question and I hope you don’t mind me asking, I want to save loss function figure with plt.savefig(“figure”), but I get module is not callable error, and if I comment out plt.savefig(“figure”) everything works just fine. Do you happen to have any idea why?
Thanks a lot!
Ensure you have matplotlib installed and configured correctly.
Hello,
I solved the error, thanks! I have an another issue however, I’m doing a grid search on parameters (epoch and batch size) and for each combination I plot the loss function. However, for each combination it just keeps displaying each results on top each other in the same figure! Any idea why that might happen?
Sorry, I don’t have experience capturing history within a grid search.
I would recommend writing your own for-loops/grid search so you have more flexibility.
Hi,
Great work.
Quick question. I am using tensorflow without Keras at the moment, and am plotting the loss and accuracy of a CNN. I am using cross entropy with adam optimizer, and using the cross entropy value as the loss. Is this right?
Also, if the loss is in the 200-300 range, should I be plotting the log value of this? as all the graphs I see the loss is between 0-1.
Thanks
Dave
Hello, thank you for all the great information. Can you provide any suggestions on how to access the training history if the Keras model is part of a pipeline?
Thank you,
Caleb
Sorry, I have not done this myself. You may need to extend the sklearn wrapper and capture this information manually.
Hi Jason,
I am running this example from your book, but I am using cross_validation in particular StratifiedKFold. So when I fit the model I do not pass a
validation_splitorvalidation_datahence my model history has only keys [‘acc’, ‘loss’]. I am using model.evaluate(). How can I visualize the test ?You could hold back a validation test or you could collect history of each model evaluated on each cross validation fold.
Hi Jason!
i have two problems:
1) when setting verbose to 2, i expect printing during each epoc including progressing bar, but i see only the train and validation loss (without seeing the accuracy or progressing bar)
2) when the run reaches the part of trying to plot, i receive an error:
plt.plot(history.history[‘acc’])
KeyError: ‘acc’
Exception ignored in: <bound method BaseSession.__del__ of >
Traceback (most recent call last):
File “C:\ProgramData\Anaconda3\lib\site-packages\tensorflow\python\client\session.py”, line 582, in __del__
UnboundLocalError: local variable ‘status’ referenced before assignment
thanks !
That is correct, if you want a progress bar set verbose=1.
You must add the accuracy metric to the fit function. The error suggests this was not done. Learn more about metrics here:
https://keras.io/metrics/
Hi Jason, thanks a lot, I still have a few more questions:
a. How can I plot the ROC curve using history object?
b. How can I save best model after each epoch? (overwrite my model with a new one only if the accuracy over the validation set has improved)
Thanks,
Nir
I do not have an example of plotting the ROC curve with Keras results.
This post will help you save models during training:
https://machinelearningmastery.com/check-point-deep-learning-models-keras/
I found solution to generate ROC/AUC here:
Forgot to say many thanks to you Jason, you never cease to amaze, always on the cutting edge but remaining pragmatic.
I’m glad to hear it.
i was facing the same issue of keyerror ‘acc’. i have added the accuracy metric in model evaluation still im facing the same error. please help
Change ‘acc’ to ‘accuracy’, I believe this is a change in the new version of Keras.
Can you please tell how can I keep the history of classifier.fit_generator() function.
Hi jason!
i want to access model training history in tflearn to plot graphs.
How can we do this in tflearn?
Sorry, I don’t have an example.
Hi Jeson, I am using more than 100 gb dataset for building a model. where i am using HDF5 data base for data loading.so for this type of configuration I am manually iterate the training process. So as I am using manual itteration, History file is not appending the model information, instade of history file is creating after every epoc. How to update history file as it append in normal process.
can I manually append the model information after every epoch.as history file information is needed for model optimization.
I would recommend saving performance as you go to a file. Just append with each epochs scores.
Hi Jason, I wrote a LSTM model to train my brain MRI slices. For my dataset, each patient has 50 slices, and n patients are divided into training and validation sets . My LSTM model is designed as below:
model = Sequential()
model.add(LSTM(128, input_shape = (max_timesteps, num_clusters), activation=’tanh’, recurrent_activation=’elu’, return_sequences = False, stateful = False, name=’lstm_layer’))
model.add(Dropout(0.5, name = ‘dropout_layer’))
model.add(Dense(out_category, activation = ‘softmax’, name=’dense_layer’))
optimizer = optimizers.RMSprop(lr=lrate)
model.compile(loss = ‘categorical_crossentropy’, optimizer = optimizer, metrics=[‘accuracy’])
model.fit(X_train, y_train, validation_data=(X_vald, y_vald), epochs = epoch_num, batch_size = batch_size, shuffle = True)
First, I use the GlobalAveragePooling layer of fine-tuned GoogLeNet to extract the feature of each slice.
Second, the n1*50*2048 features from training set and n2*50*2048 features from validation set are used to train my LSTM model.
However, the training process is very wired. The accuracy of training and validation decreases suddenly at Epoch 46. Could you give some advise about this results? The process of Epoch 40 to 50 is attached:
Epoch 40/70
407/407 [==============================] – 25s – loss: 8.6558e-05 – acc: 1.0000 – val_loss: 1.3870 – val_acc: 0.8512
Epoch 41/70
407/407 [==============================] – 25s – loss: 1.7462e-06 – acc: 1.0000 – val_loss: 1.2368 – val_acc: 0.8595
Epoch 42/70
407/407 [==============================] – 25s – loss: 4.5732e-06 – acc: 1.0000 – val_loss: 1.1689 – val_acc: 0.8760
Epoch 43/70
407/407 [==============================] – 25s – loss: 6.2214e-07 – acc: 1.0000 – val_loss: 1.2545 – val_acc: 0.8760
Epoch 44/70
407/407 [==============================] – 25s – loss: 2.5658e-07 – acc: 1.0000 – val_loss: 1.2440 – val_acc: 0.8595
Epoch 45/70
407/407 [==============================] – 25s – loss: 6.2594e-07 – acc: 1.0000 – val_loss: 1.2281 – val_acc: 0.8678
Epoch 46/70
407/407 [==============================] – 25s – loss: 3.3054e-07 – acc: 0.5676 – val_loss: 1.1921e-07 – val_acc: 0.5372
Epoch 47/70
407/407 [==============================] – 25s – loss: 1.1921e-07 – acc: 0.5061 – val_loss: 1.1921e-07 – val_acc: 0.5372
Epoch 48/70
407/407 [==============================] – 25s – loss: 1.1921e-07 – acc: 0.5061 – val_loss: 1.1921e-07 – val_acc: 0.5372
Epoch 49/70
407/407 [==============================] – 25s – loss: 1.1921e-07 – acc: 0.5061 – val_loss: 1.1921e-07 – val_acc: 0.5372
Epoch 50/70
407/407 [==============================] – 25s – loss: 1.1921e-07 – acc: 0.5061 – val_loss: 1.1921e-07 – val_acc: 0.5372
This post might give you some ideas:
https://machinelearningmastery.com/improve-deep-learning-performance/
Hi Professor,
What’s your experience with Tensorboard callbacks to plot accuracy?
I’m attempting to use it right now however for some reason it is decreasing my accuracy when I implement it. When I comment the callback out, the accuracy increases by 30%. What’s going on here? Should I just stick to your method instead of using the Tensorboard?
Sorry, I have not used TensorBoard Jared.
How can we see the inside of how loss, accuracy, val loss and val accuracy is calculated?
Not sure what you mean sorry. You can calculate these things manually if you like based on the predictions made by the model.
Hi,
Thank you,
How can I have this plots during training? so I can see the network progress online.
Perhaps you could create a custom callback that dynamically updates a graph.
Thanks for your nice tutorial. I have two questions needed you to make it clear:
1. How can avoid from history object returned by compile function printed.
2. How can I change tensorflow instead of using theano.
Thank you so much.
Sorry, I don’t understand your first question, can you restate it please?
You can change your backend by editing the Keras configuration file in ~/.keras/keras.json
Hello Dr. Jason , that helped me a lot to visualize my model , but can u tell me how can I choose the validation split value ?? and batch size ??
Use trial and error on your specific dataset.
Excuse me , what do u mean by the trial and error ?? I am a newbie I the ML and DL S:
Sorry, I mean use experiments to see what works best on your problem. A primitive type of search process.
What does Val_acc is higher higher than the actual acc of training ??? Does it mean overfiting or what ?
Off the cuff, it is unusual and it may be a sign of underfitting (e.g. an unstable model).
Why you have written “Test” in the graph although you use this as a validation?
Nice catch.
hi its perfect thnx
but if i want to save it to *.png file how can i do that?
i used plt.savefig(‘iman.png’)
but it doesnt work
can u help me jason?
Yes, that is what I would have recommended.
Why doesn’t it work?
how to do the same for tflearn, I’ve looked up everywhere, can’t find something similar to this. My model.fit in tflearn doesn’t return anything so I get this error:
my_history.update(history)
TypeError: ‘NoneType’ object is not iterable
It’s be a great help if you can suggest a solution. Thanks!
Sorry, I do not use tflearn at this stage. I cannot give you good advice.
Hi Jason, Great article!
I have a question. I am training a CNN over 5 epochs, and getting test accuracy of 0.9995 and plotting the training and validation accuracy graph as you’ve shown. The training accuracy seem to increase from 0 to 0.9995 over the 5 epochs, but the validation accuracy seems almost a constant line at 1.0 (>0.9996). Is this normal? I couldn’t figure out what is happening here.
(I’m using 100,000 images, of which 20% is used for testing. Of the 80% for training, 20% of that is split for validation and the rest used for training)
Thanks in advance!
Interesting, perhaps the sample for validation is too small? Perhaps your model is very effective?
Perhaps repeat the experiment a few times to see if the outcome holds?
Yes the outcome holds. It could be that validation sample is quite small. I’m doing training on 64000 images and validating on 16000. So, it could be that or my model is very effective?
Also, I noticed that training accuracy goes above the validation accuracy plot when I removed one dropout implementation (out of 2) from my model.
Perhaps it would be good to explore other configurations of the model and the test harness?
Hi Jason and thanks for your nice posts.
I want to ask you a question on how to interpret these results.
https://ibb.co/hYyYvG
https://ibb.co/dR3DUb
I am using a network with keras.
I have 2 layers, each of them with 128 units and the final layer with 2 units.
I am using an L2 regularization.I use adam optimizer.
For fitting, I am using 100 epochs, batch_size 32 and validation split 0.3.
My data consists of 15000 rows with 5 features plus the output.
I am not sure if I am overfitting or not.
And I can’t find out why I have so many fluctuations with my validation data.I tried a lot of different approaches but the fluctuation never goes away.
Generally, I know that we must not have big gaps/differences between train and validation data.I am not sure for the accuracy though.Should we always obtain a little better accuracy for the validation data?Else, is a sign of overfitting?
Could you please elaborate on that?
Thanks!
Perhaps this post will help diagnose your plots:
https://machinelearningmastery.com/diagnose-overfitting-underfitting-lstm-models/
hi jason,
thank u,
what about loss and accuracy of object detection problems such as running ssd_keras for object detection, is it possible to follow same steps ?
Sorry, I don’t follow, can you rephrase or perhaps provide more context?
Jason,
I wish to have the average of the errors generated during my training as well so that once I start running the model on my validation set I can compare the error generated at each step with this average that I have. How is it possible to get this average RMSE value for the entire training data
Not sure I follow, sorry. Perhaps you can give more context?
Hi.
Thanks. I would like to know : why is the training loss not as good as validation loss at the beginning ? Is it because of the dropout used ?
It could be.
if it is a Plot of Model Loss on Training and Validation Datasets
If plot involves ^; why are you adding train and test as the legends to the plot. isn’t the misleading?
Here I refer to “test” as a generic out of sample dataset.
Does that help?
hello, im sorry, i could not show the test in the plot, i dont know why.. can you please help me?
Hi manel…Are you receiving an error or errors that we may assist you with?
Hi, Jason!
How can I plot accuracy versus batch size during the Model Training in Keras History ?
Using calback
I would not recommend using a callback to create the plot.
Collect an array of mean accuracy scores and an array of batch sizes and use matplotlib to create a plot.
As your example as that there is only training and validation loss and accuracy. May I ask that how to plot the loss and accuracy of training, validation and testing?
*shows
You can plot the loss over train and test sets for each training epoch (e.g. over time).
Hi Jason,
How would that history be studied in a regression model? How could the loss in the training and in the validation set be visualized? In my case, when I do:
print(history.history.keys())
All I get is two values:
dict_keys([‘mean_absolute_error’, ‘loss’])
So I am not able to plot the validation set loss. I’ve fitted and evaluated the model with:
history = model.fit(X_train, Y_train, epochs=50, batch_size=30)
loss_and_metrics = model.evaluate(X_test, Y_test, batch_size=12)
Looks good.
In regression, we can add metrics to the compile step, to get the validation loss, right?
model.compile(….,, loss=”mean_absolute_error”, metrics=[“”mean_squared_error”])
then:
history.history.keys()
will give:
val_loss, loss, mean_sqaured_error, val_mean_sqaured_error
(loss is the MAE)
then we can plot them.
Hi Jason,
It is a nice article to introduce history in Keras. I have a question if this history will also work for multiple step time series prediction. For example, use last two hours data to predict next two hours f(x(n-1), x(n))= x(n+1), x(n+2)
y has two values, but history[‘loss_val’] only one value. If this history[‘loss_val’] is the sum of the loss of the two hours prediction?
I have check keras website, but I did not find answer for it. Thanks in advance.
Good question.
It might be the average or sum loss over the vector output? Just a guess.
can we plot same for testing. that is model.evaluate()
No, there is only history during training.
Hi Jason
Your tutorials are just awesome. Thanks for your effort.
I’m trying to plot model loss and accuracy for my model. In history variable ‘loss’ and ‘val_loss’ are exists. But when I try to access ‘acc’ or ‘val_acc’ it raises a key error. I printed all keys. Please check output below
val_loss
val_dense_3_loss_1
val_dense_3_loss_2
……
val_dense_3_loss_14
val_dense_3_loss_15
val_dense_3_acc_1
val_dense_3_acc_2
…..
val_dense_3_acc_14
val_dense_3_acc_15
loss
dense_3_loss_1
dense_3_loss_2
……
dense_3_loss_14
dense_3_loss_15
dense_3_acc_1
dense_3_acc_2
……
dense_3_acc_14
dense_3_acc_15
What i missed ?
You must add metrics=[‘accuracy’] when you compile() your model.
Thanks for your reply.
Yes, I have added this. Please check my implementation below
model.compile(loss=’categorical_crossentropy’, optimizer=opt, metrics=[‘accuracy’])
history = model.fit(inputs, outputs, validation_split=0.2, epochs=epochs, batch_size=batch_size)
One thing, I’m getting dense_3_acc_n from history.history.keys(). If I take the average of dense_3_acc_1 to dense_3_acc_n, I will get average accuracy. will it calculate actual accuracy?
I recommend focusing on ‘acc’ and ‘val_acc’ keys.
Hi, Jason can you please tell how to plot these graphs by loading the saved model ( hdf5 format using model.save(‘filename’) command). Because when I tried to plot with saved model it gives me error ‘history is not defined’
You can only get the graphs by calling fit() with data to train the model.
Hi, Thanks for reply. can you please tell how can I plot test accuracy and loss with training and validation
Yes, the above tutorial shows you how.
Hi, but this is for training and validation not for real test data? I want to plot all three validation,training and testing in one graph
You can run the training loop manually, evaluate on each dataset, store the results and plot them all at the end.
Thanks.
You’re welcome.
thank you. I have a doubt. My model type is ‘keras.callbacks.history’ .How to check whether the model is under-fitting or over-fitting.
I have some suggestions here:
https://machinelearningmastery.com/diagnose-overfitting-underfitting-lstm-models/
Thank you Jason!
I could not understand keras, but thanks to you, I came to understand it.
I’m happy to hear that.
Hi Jason,
Great tutorial. I was wondering how long it takes for the plot to show after the training epochs finish? I tried it out but it’s taking a long time for the plots to show and I only did 2 epochs to speed up the process although I am using it with my own neural network rather than the example shown above.
Thanks so much!
Marco
The plot should be shown immediately.
Ensure you are running the code from the command line, here’s how:
https://machinelearningmastery.com/faq/single-faq/how-do-i-run-a-script-from-the-command-line
Hi Jason,
Thanks I was able to get around it it turns out (for me at least) matplotlib graphs don’t open when running the script in the terminal. I ran the code in a console/shell and it worked fine. Thanks again.
I’m happy to hear about your progress.
The terminal/console/shells is all the same thing (to me).
What do you mean when you say “terminal” exactly?
Thank you for the write-up!
I created a python package that plots the accuracy and loss with 1 line of code:
https://pypi.org/project/keras-hist-graph/
Install with
pip install keras-hist-graphThen use:
from keras_hist_graph import plot_history
history = model.fit(x, y, …)
plot_history(history)
Great, thanks for sharing!
Dear Jason,
Thanks a lot for all the excellent tutorials you have provided! They have helped a great deal introducing me to the ML world.
I have the following question:
Is there a way to plot the train and validation loss vs the dataset size instead of epoch in Keras?
Lets say I have dataset with N train examples. I would like to know the train and validation loss using 20% of the dataset then 40%,…,then 100% and put the results from all these point on a plot.
I could write a loop process spitting the dataset size accordingly and fitting the model in each split, but then, which should be the final number for the train and validation loss in each split point? Is it correct to use the mean of the train loss with respect to the number of epochs or the loss reported at the last epoch?
I’ve seen that Scikit learn has an example script for creating a Learning Curve (http://scikit-learn.org/stable/auto_examples/model_selection/plot_learning_curve.html) but don’t really understand how a Keras Sequential Model can be used with this.
Many thanks in advance!
You can run an experiment and summarize the relationship between training set size and error. Fit a model on each sized dataset, store scores, then plot scores.
Yes, you must write a for loop.
Hi Jason.
thanks for your toturial.
can I draw history in a problem which is not a classification problem?
or in other words a network where I’m not using *_crossentropy?
thanks
Yes. Any metrics tracked during training can be plotted.
Hi Jason,
I’m really learning a lot from your blog. It’s really great.
I have a question regarding the history object when fitting a model in Keras.
In the example above, you use a simple neural network with a number of hidden Dense layers. Since the fit method is called once, the history object is instanciated once and all is good and well.
I’m not sure however how to use the history object in a LSTM layer of the model. When stateful=True, we’r running the epochs in a loop, such that fit is called at every loop. How do you use the history object in that case.
Do you have to explicitly keep track of it everytime it’s been instantiated… via a dictionary for example?
Good question.
If you run the epochs manually, you can also evaluate the model on the train/test sets manually and store the results in your own list/lists history object.
Would this be combinable with gridsearchCV (how to code that? if so)
No, they would be at odds I think. E.g. evaluating model performance (cross-validation) and reviewing learning dynamics (learning curves).
thanks for this starting point article.
i got tired of adding a new stanza for each metric I wanted to get a feel for. I generified this to plot the whole set of keys present in model.compile(metrics=[m,…]).
Thanks for sharing.
Thanks for the great article!
Normally either accuracy or loss should be sufficient to evaluate the model (determine whether it is overfitting, underfitting, etc). However, are there cases where both have to be used to come to a conclusion about the performance of the model? If not, what is the point of having 2 metrics that essentially tell us the same thing?
Also, why is it that (at least from my own experience) the plot of loss against epochs generally seems to be smoother than that of accuracy against epochs?
Loss may show overfitting but accuracy may show no effect. In that case, I would want to see both.
Accuracy is more discrete than loss, it will be less smooth.
In the suggested case where loss shows overfitting but accuracy shows no effect, how would you decide what to do next?
Hmm, I’d rather use a model that does not show overfitting (e.g. to have a more stable model). I’d probably add regularization to reduce the overfit loss. Probably weight regularization and perhaps early stopping.
This might be very late. You may use other performance metrics such as Recall, Precision, and F1 Score which are also generated by including the keras.metrics suite. You may do something like metrics=[‘accuracy’,tf.keras.metrics.Precision(), tf.keras.metrics.Recall(),tf.keras.metrics.TruePositives(),tf.keras.metrics.TrueNegatives(),tf.keras.metrics.FalsePositives(),tf.keras.metrics.FalseNegatives()]),
]. Additionally, you may expand your evaluation criteria by getting the confusion matrix and calculte other metrics such as G-Score, False Positive Rate, and Matthew Correlation Coefficient.
Thanks for sharing.
I notice that you use validation and test exchangly here. Is that valid ? Isn’t validation different than test.
Thanks in advance
This is a common question that I answer here:
https://machinelearningmastery.com/faq/single-faq/why-do-you-use-the-test-dataset-as-the-validation-dataset
Hi Jason,
I did a test, with different batch sizes: 32,64,128,256,512,1024 and 2048. I trained 5 models for each batch size giving me 35 models in total. I used Keras history to save ‘loss’ and ‘val_loss’ for each model and selected the loss and validation loss for minimum in the validation loss, to avoid overfitting. When I plot the loss, I get roughly a minimum for the 5 models with batch size 1024, but when I plot the validation loss there is no minimum. I find this strange, or is this due to how Keras calculate the loss and val_loss?
What do you mean by “no minimum”?
Ok, it was a bug in my code ) Now both the training error and validation error decreases with batch size to a minimum around 1024. But now I discovered another thing, which may be obvious to you and others. I calculate and plot the training and validation error using two methods. First I use Keras history to save the loss and val_loss, and second, I save each model with the best weights and then calculate the MSE for each model. The val_loss and the MSE for the validation set are identical for all models, but the loss and the MSE for the training set are not, even though they are close. So Keras must calculate the loss and val_loss differently, do you know how and why?
Nice work.
The val loss is averaged across each batch during training I believe.
Hello ason,
how can I spiting dataset into train, validate and test using scikilt_learn or k_fold?
You can use the train_test_split() function, learn more here:
https://machinelearningmastery.com/evaluate-performance-machine-learning-algorithms-python-using-resampling/
Hi Jason! I would like to know how I will be able to get the RMSE of my model through history.history?
Keras does not support RMSE, you can add it here:
https://machinelearningmastery.com/custom-metrics-deep-learning-keras-python/
Hi,
I want to know how can I get gradient info after each epoch while training?
I am using TensorFlow.
Thanks
I don’t have an example of this, sorry.
hi jason ,
i run this code but i have this problem ” ValueError: could not convert string to float: ‘”6′”
Sorry to hear that, I have some suggestions here that may help:
https://machinelearningmastery.com/faq/single-faq/why-does-the-code-in-the-tutorial-not-work-for-me
How do I see History of my Model after I restart my computer?
You must save the history to file in order to review it in the future.
Hi Jason thanks for your perfect description.????♀️
I have a question
I fit my model that my y_train is a list when I plot history like “loss” it doesn’t show me anything.
I don’t know why.????
Perhaps you can start with the example in the blog post and adapt it to your specific problem?
thank you very much, i am a regular follower of your articles!!! They are amazing.
Thanks!
my plot has only 6 epochs and looks like a straight line from the second epoch is this normal? model accuracy is 99%.
It suggests the problem you are working on is very simple/easy.
In such case how can i zoom into the graph so it shows the difference in epochs? If we want to use this graph in a paper nobody can see difference from graph.
Perhaps just plot the interval of interest rather than all of the data?
Thanks for your great article, i have a quick question:
I want to know the best epoch for my model (image classification):
1) suppose that i have epoch=4, should i run the model 3 times and consider the last accuracy on validation test (in this case i will 3 values for 3 times), then i pich the highest one ?
2) when i change the epoch should i reapead implement the model or directly fitting it with the new epoch ?
Thanks in advance.
Monitor the validation loss to choose the best epoch.
You can use a checkpoint to save the model for the best validation epoch:
https://machinelearningmastery.com/check-point-deep-learning-models-keras/
You can choose to use the epoch number as a fixed number of training epochs for a new fit, perhaps average the chosen number of epochs over multiple runs.
I have a dataset with over 1 million records. From the label column there are only 200 anomoly classes and the rest are normal. Is it optimal to split this dataset using sklearn.model_selection.train_test_split? Is it not better to have 100 anomaly records in both train and test sets?
No, see this post:
https://machinelearningmastery.com/tactics-to-combat-imbalanced-classes-in-your-machine-learning-dataset/
Hi Jason, thanks for these great tutorials. I run the code above with the data and everything worked well. Now, I’m running the code with a different data and my question is:
I’m training a dataset using model.fit (only training data, with no validation_split) and plotting the loss values. Then I run model.evaluate on the same training data (no “test_data” as validation) and the loss (a scalar number) I get is different (and usually lower) than the loss value of the last epoch from model.fit. Is this OK? From my understanding of these tutorials, I would have expected both of them to be the same, since the data used in both commands (fit() and evaluate()) is always the same. Is there something about those two commands I’m not getting right?
It is possible that the loss seen during training is averaged over batches within the epoch.
Perhaps check the code or ask on the Keras user group?
Hi Mr. Brownlee, I’m a computer science student working on my final project and I’ve run into some issues. I have ~4k images over 16 classes, training with a basic network structure; conv starts with 32 filters and doubles at each next conv layer with a kernel size of 3×3 for each conv layer, the dropout layers start at 0.1 and increase by .02-.05 each time. Each class has roughly 250-350 images.
I use keras image augmentation along with fit_generator to do 500 images per epoch, with 200 total epochs for a total of 100k training samples, to make sure that my network is generalizing well I also use augmentation on my validation set. The training loss approaches .2 while the accuracy reaches 91-92% after 100k samples, however the validation accuracy only reaches 30% and manually testing new images leads to terrible results as well.
The classes are essentially north american animals, such as deer, elk, moose, bears, coyote, etc as well as a few other random things, so the features that are being extracted are always going to be somewhat similar however 30% seems incredibly low. What would you suggest doing?
Here is the basic structure:
input(128,128,3)->sequential->conv->LR->dropout->conv->zeropadding->LR->dropout->BN->conv->LR->dropout->BN->conv->LR->dropout->conv->LR->dropout->flatten->dense(16)
It sounds like the might may be overfitting.
This will help you diagnose the issue:
https://machinelearningmastery.com/learning-curves-for-diagnosing-machine-learning-model-performance/
The tutorials here will then help you correct it:
https://machinelearningmastery.com/start-here/#better
Let me know how you go.
I appreciate the input, I decided to change to the Resnet architecture and I’m experiencing a similar issue where my val_acc is almost always about half that of my regular acc. After reading over your ‘7 day mini course’ as well as the first link you provided I have come to the conclusion that I don’t have enough data to generalize well.
This leads me to a point in which I am not quite sure what to do, I’ve hand selected the 4k images out of about 100k scraped from google/bing/yahoo and I don’t see myself being able to find a meaningful amount of more data. That being said I saw your mention of using noise at the input layer and was wondering what you propose the hard limit is for the value of a Gaussian noise, in your example you have a value of 0.1, is this the most you would recommend?
Relating to above would the introduction of classes that I do not care about allow for better generalization? An example might be if I had 10 classes pertaining to animals and training led to the issues discussed would adding another 10 classes pertaining to random day to day objects allow my model to fit the data better, or perhaps even a single class that is populated by random images of things that are not in the previous 10 classes?
Finally, relating to the last paragraph, is it possible to overfit a specific class? Currently my distribution is nearly even, like I said each class has about 250-350 images to train, and 10% of that to test, would having a class with 2k images in it cause problems with overfitting?
Thanks for all your time, unfortunately my capstone adviser isn’t knowledgeable in this area so I’m learning as I go and your website has been very helpful.
You can ignore my final question, I actually found the answer on your site here: https://machinelearningmastery.com/tactics-to-combat-imbalanced-classes-in-your-machine-learning-dataset/.
I would still appreciate some input on the 2nd, and 3rd paragraphs still.
Those methods may not be the best for multi-class computer vision problems.
If you do not have enough data, there are two main thread to follow.
Try data augmentation to expand the dataset:
https://machinelearningmastery.com/how-to-configure-image-data-augmentation-when-training-deep-learning-neural-networks/
Best practices:
https://machinelearningmastery.com/best-practices-for-preparing-and-augmenting-image-data-for-convolutional-neural-networks/
And try regularization methods to reduce overfitting:
https://machinelearningmastery.com/introduction-to-regularization-to-reduce-overfitting-and-improve-generalization-error/
Use a confusion matrix to see how the model is doing across the different classes:
https://machinelearningmastery.com/confusion-matrix-machine-learning/
Topic: Evaluate a Model and Plot Training History
Is it mandatory that plots of accuracy on the train and test datasets must converge (e..g a plateau of the line) over training epochs?
The plots are tool for you to try to understand what is going on.
They are not required.
we input an image of size 28*28*1: How can I see the pixel value after each operation i.e after applying the first kernel -> max pool -> 2nd kernal -> max pool-> flatten -> fc1-> fc2. I want to save and print pixel value at each stage.
You can use each layer as an output layer as well to see the output at each point.
I give an example of this here:
https://machinelearningmastery.com/how-to-visualize-filters-and-feature-maps-in-convolutional-neural-networks/
I have not false positive and false negative in my predictions so the accuracy should be 100% but it is showing 99.997 is this normal?
The history is an average of the performance across the batches in each epoch.
Instead, you can use model.evaluate() to estimate the performance of your model on a hold out dataset.
Hello Jason,
Is there a way to record the time it takes for the model to fit the data ?
Vishnu
Yes, record the time before making a prediction and then again after and calculate the difference.
Hi jason Pretty Nice Tutorial .
I wanna ask is there a way you can get weights and biases for each iterations?
Thanks.
Yes, you can step over the epochs manually and call model.get_weights() each loop.
Or setup a checkpoint callback to save weights to file at the end of each epoch.
Hi Jason,
I am trying to get an accuracy graph but it is not what I expected and I am not able to figure it out that where am I going wrong.
Below is my coding.
# Visualize training history
from keras.models import Sequential
from keras.layers import Dense
import matplotlib.pyplot as plt
import numpy
# load pima indians dataset
dataset = numpy.loadtxt(“pima-indians-diabetess1.csv”, delimiter=”,”)
# split into input (X) and output (Y) variables
X = dataset[:,0:7]
Y = dataset[:,7]
# create model
model = Sequential()
model.add(Dense(50, input_dim=7, activation=’relu’))
model.add(Dense(48, activation=’relu’))
model.add(Dense(30, kernel_initializer=’uniform’, activation=’relu’))
model.add(Dense(28, kernel_initializer=’uniform’, activation=’relu’))
model.add(Dense(26, kernel_initializer=’uniform’, activation=’relu’))
model.add(Dense(20, kernel_initializer=’uniform’, activation=’relu’))
model.add(Dense(18, kernel_initializer=’uniform’, activation=’relu’))
model.add(Dense(16, kernel_initializer=’uniform’, activation=’relu’))
model.add(Dense(10, kernel_initializer=’uniform’, activation=’relu’))
model.add(Dense(8, kernel_initializer=’uniform’, activation=’relu’))
model.add(Dense(1, activation=’sigmoid’))
# Compile model
model.compile(loss=’binary_crossentropy’, optimizer=’adam’, metrics=[‘acc’])
# Fit the model
history = model.fit(X, Y, validation_split=0.25, epochs=150, batch_size=32, verbose=0)
# list all data in history
plt.plot(history.history[‘acc’])
plt.plot(history.history[‘val_acc’])
plt.title(‘model accuracy’)
plt.ylabel(‘accuracy’)
plt.xlabel(‘epoch’)
plt.legend([‘train’, ‘val’], loc=’upper left’)
plt.show()
below is the link of a snap of my accuracy graph:
https://drive.google.com/file/d/1GJJy4frCOpgc5-Z2LIoniUYDNR40MQ5j/view?usp=sharing
I believe since Keras 2.3. that you must use ‘accuracy’ instead of ‘acc’.
Also, your flat graph suggests the model is not learning much – looks like way too many layers!
A beginner ML student here, would love to know if i could use the “validation_split” attribute even if i use a dataset built from images, and not csv files – i use fit_generator instead of fit, to train.
Also thanks alot for the explenations and hits in this article!
Yes, you can.
i test it for UNSWNB data set gives me error massage
‘DataFrame’ object has no attribute ‘values’
Perhaps post your code and error to stackoverflow?
Hi Jason!
I’m working on a code that predicts energy consumption
I tried to use print(history.history.keys()) but it doesn’t work for me! I got a KeyError: ‘val_mean_absolute_percentage_error’
Can you help me?
Here is my code:
from __future__ import print_function
from sklearn.metrics import mean_absolute_error
import math
import numpy as np
import matplotlib.pyplot as plt
from pandas import read_csv
from keras.models import Sequential
from keras.layers import Dense, LSTM
from sklearn.preprocessing import MinMaxScaler
from sklearn.metrics import mean_squared_error
# convert an array of values into a dataset matrix
def create_dataset(dataset, look_back=1):
dataX, dataY = [], []
for i in range(len(dataset)-look_back-1):
a = dataset[i:(i+look_back), 0]
dataX.append(a)
dataY.append(dataset[i + look_back, 0])
return np.array(dataX), np.array(dataY)
# fix random seed for reproducibility
np.random.seed(7)
# load the dataset
dataframe = read_csv(‘OND_Q4.csv’, usecols=[7], engine=’python’, header=3) #wind-SPEED
dataset = dataframe.values
print(dataframe.head)
dataset = dataset.astype(‘float32′)
# normalize the dataset
scaler = MinMaxScaler(feature_range=(0, 1))
dataset = scaler.fit_transform(dataset)
# split into train and test sets
train_size = int(len(dataset) * 0.7) # Use 70% of data to train
test_size = len(dataset) – train_size
train, test = dataset[0:train_size,:], dataset[train_size:len(dataset),:]
# reshape into X=t and Y=t+1
look_back = 1
trainX, trainY = create_dataset(train, look_back)
testX, testY = create_dataset(test, look_back)
# reshape input to be [samples, time steps, features]
trainX = np.reshape(trainX, (trainX.shape[0], 1, trainX.shape[1]))
testX = np.reshape(testX, (testX.shape[0], 1, testX.shape[1]))
# create and fit the LSTM network
model = Sequential()
model.add(LSTM(4, input_shape=(1, look_back)))
model.add(Dense(1))
##########################################################################################################################################
#compile model
model.compile(loss=’mean_squared_error’, optimizer=’adam’,metrics=[‘mape’])
history=model.fit(trainX, trainY, epochs=5, batch_size=1, verbose=2)
# list all data in history
print(history.history.keys())
train_MAPE = history.history[‘mape’]
valid_MAPE = history.history[‘val_mean_absolute_percentage_error’]
train_MSE = history.history[‘loss’]
valid_MSE = history.history[‘val_loss’]
Thank you
This is a common question that I answer here:
https://machinelearningmastery.com/faq/single-faq/can-you-read-review-or-debug-my-code
Train on 582 samples, validate on 146 samples
Epoch 1/200
—————————————————————————
KeyError Traceback (most recent call last)
in
—-> 1 model.fit(X_train, y_train, epochs=200, validation_data=(X_test, y_test), callbacks=[mcp_save], batch_size=128)
~\AppData\Roaming\Python\Python36\site-packages\keras\models.py in fit(self, x, y, batch_size, epochs, verbose, callbacks, validation_split, validation_data, shuffle, class_weight, sample_weight, initial_epoch, **kwargs)
865 class_weight=class_weight,
866 sample_weight=sample_weight,
–> 867 initial_epoch=initial_epoch)
868
869 def evaluate(self, x, y, batch_size=32, verbose=1,
~\AppData\Roaming\Python\Python36\site-packages\keras\engine\training.py in fit(self, x, y, batch_size, epochs, verbose, callbacks, validation_split, validation_data, shuffle, class_weight, sample_weight, initial_epoch, steps_per_epoch, validation_steps, **kwargs)
1596 initial_epoch=initial_epoch,
1597 steps_per_epoch=steps_per_epoch,
-> 1598 validation_steps=validation_steps)
1599
1600 def evaluate(self, x, y,
~\AppData\Roaming\Python\Python36\site-packages\keras\engine\training.py in _fit_loop(self, f, ins, out_labels, batch_size, epochs, verbose, callbacks, val_f, val_ins, shuffle, callback_metrics, initial_epoch, steps_per_epoch, validation_steps)
1170 if isinstance(ins[-1], float):
1171 # Do not slice the training phase flag.
-> 1172 ins_batch = _slice_arrays(ins[:-1], batch_ids) + [ins[-1]]
1173 else:
1174 ins_batch = _slice_arrays(ins, batch_ids)
~\AppData\Roaming\Python\Python36\site-packages\keras\engine\training.py in _slice_arrays(arrays, start, stop)
404 if hasattr(start, ‘shape’):
405 start = start.tolist()
–> 406 return [None if x is None else x[start] for x in arrays]
407 else:
408 return [None if x is None else x[start:stop] for x in arrays]
~\AppData\Roaming\Python\Python36\site-packages\keras\engine\training.py in (.0)
404 if hasattr(start, ‘shape’):
405 start = start.tolist()
–> 406 return [None if x is None else x[start] for x in arrays]
407 else:
408 return [None if x is None else x[start:stop] for x in arrays]
~\Anaconda3\envs\tensorflow1\lib\site-packages\pandas\core\frame.py in __getitem__(self, key)
2999 if is_iterator(key):
3000 key = list(key)
-> 3001 indexer = self.loc._convert_to_indexer(key, axis=1, raise_missing=False)
3002
3003 # take() does not accept boolean indexers
~\Anaconda3\envs\tensorflow1\lib\site-packages\pandas\core\indexing.py in _convert_to_indexer(self, obj, axis, is_setter, raise_missing)
1283 # When setting, missing keys are not allowed, even with .loc:
1284 kwargs = {“raise_missing”: True if is_setter else raise_missing}
-> 1285 return self._get_listlike_indexer(obj, axis, **kwargs)[1]
1286 else:
1287 try:
~\Anaconda3\envs\tensorflow1\lib\site-packages\pandas\core\indexing.py in _get_listlike_indexer(self, key, axis, raise_missing)
1090
1091 self._validate_read_indexer(
-> 1092 keyarr, indexer, o._get_axis_number(axis), raise_missing=raise_missing
1093 )
1094 return keyarr, indexer
~\Anaconda3\envs\tensorflow1\lib\site-packages\pandas\core\indexing.py in _validate_read_indexer(self, key, indexer, axis, raise_missing)
1175 raise KeyError(
1176 “None of [{key}] are in the [{axis}]”.format(
-> 1177 key=key, axis=self.obj._get_axis_name(axis)
1178 )
1179 )
KeyError: “None of [Int64Index([148, 425, 97, 486, 306, 454, 483, 485, 79, 246,\n …\n 101, 469, 172, 401, 176, 470, 374, 66, 200, 308],\n dtype=’int64′, length=128)] are in the [columns]”
Hi jason,
can u help me from get out of this eror. I searched so many sites but anything can’t give hand for me. I hope u can help me.
This is a common question that I answer here:
https://machinelearningmastery.com/faq/single-faq/can-you-read-review-or-debug-my-code
history.history.keys() is now returning [‘acc’, ‘loss’, ‘val_acc’, ‘val_loss’]…
‘accuracy’ to shortened to ‘acc’
No, you need to update your version of Keras to 2.3.1.
Hi everybody,
I am a beginner to ML. When doing my project, I face a problems that I am not clear.
My problem is that the loss value shown in the last epoch after the model.fit() function finishes is different from the loss value that I get from the model.evaluate() function. However, the val_loss value between the two provider show absolute agreement.
Please help my by taking a look at the result below:
——
“model.compile(loss=’mse’, optimizer=adadel, metrics=[‘mse’,’mae’])
history = model.fit(x, y, nb_epoch=10, batch_size=32, validation_data=(x_test, y_test))”
Epoch 10/10
8/8 [==============================] – 0s 1ms/step – loss: 0.2280 – mse: 0.2280 – mae: 0.3640 – val_loss: 0.1704 – val_mse: 0.1704 – val_mae: 0.317
——
evaluation = model.evaluate(x, y)
8/8 [==============================] – 0s 250us/step
Evaluation: [0.1698070764541626, 0.1698070764541626, 0.3129541277885437]
————————————-
the loss value from “loss” at the last epoch is 0.2280 while the value from evaluate(x,y) is only 0.1698…
Yes, it is an estimate or an average from across the batches.
I would recommend paying attention to the results from the evaluate() function
Thanks too much for your assist, Jason Brownlee!
Could you please help me on a consequent problem as:
I would like to make evaluation on the training proficiency of my model by plotting “loss value” and “val_loss value” through epoch, but evaluate() function is what we should focus on.
So could you please recommend how I should work on my evaluation.
The history is returned by a call to fit(), you cannot get this information from a call to evaluate().
Thanks to much for your reply.
As I saw examples on some forums, they plot the “loss value” and “val_loss value” (obtained from fit() function) through epochs and use the figure to assess the performance of the model.
Is this an adequate standard to evaluate the model?
It is a diagnostic only. Models are evaluated by selecting a metric based on the requires of the project and designing a test harness to evaluate the model in a way it will be used in operation in making predictions for new data. Often repeated k-fold cross validation.
Ya I see the problem.
Thank you too much for your assist!
You’re welcome.
Hi Jason,
I am running this example, but I am using cross_validation (StratifiedKFold) and I am using k-fold = 10. How can could collect history of each model evaluated on each cross validation fold?How do I do that?
My model history has only keys [‘acc’, ‘loss’], but I don’t know which fold or model these keys belong to??
You could, if you ran the folds manually with a for-loop.
Thank you soo much Jason,
But is it possible to obtain the training process for all k-folds cross validation on the same plot?
Yes, I have examples on the blog I believe. I think for image classification You can use the blog search.
Hi Jason,
Your blog helped me to learn machine learning easily. Thank you for that. I have tried to get accuracy of some other dataset… I am attaching my code and graphs in the below link. Please have a look and comment whether it is fine or not…Also i have added many layers just to get good accuracy (because of which i am getting flat line). Any suggestions from your side would be helpful.
Regards
https://drive.google.com/folderview?id=12WRXmBU2QDjIc8p6LEHm5t8CPoOmPcRk
Thanks, I’m happy to hear that.
Sorry, I don’t have the capacity to review/debug your code:
https://machinelearningmastery.com/faq/single-faq/can-you-read-review-or-debug-my-code
thanks, my question, After training my model, i saved it to desk model.save(‘…’)
then later i run load_model(‘…’) to plot some fuction
but i get this error ‘object has no attribute history ‘if i run print(model.history)
my fit look so :
history=model.fit(X_train, Y_train, nb_epoch=5, batch_size=16, callbacks=[history])
should i save the history in list if i want to use it later ?
The model does not have an attribute called history, and history is not saved.
You must fit the model and the function fit() will return a dictionary called history.
Hi Jason.
I have been following your deep learning with python book (great book by the way), and I just finished the chapter dedicated to reading history from a keras training (which this page seems to be based on)
To my dismay, the following chapter uses the sklearn KerasClassifier with cross_val_score and StatifiedKFold, making it impossible for me to directly use this history code with the sonar dataset in that sample
I proceeded to write my own keras callback class to manually construct the history in the context of the kfold’ed cross_val_score (which essentially means a bunch of history lines on the same graph … one for each of the KFold splits)
I succeeded in that goal reasonably well, but the graph gave me some very interesting results that I want to ask you about
The accuracy graph increases just like your example on this page, but then it actually hits 1!, and plateaus (since it hit a ceiling, accuracy can’t be greater than 1)
This is where my confusion starts. If there are entire epochs that get trained to the score of 1 … why is the baseline score returned by cross_val_score around 0.8 ?
My first instinct is that there are separate validation scores I didn’t calculate (training set gives score of 1, but validation gives lower score) .. but I tried the on_test function on the keras callback, and they are not executed at all, so I ruled that out.
I also ruled out an error in my code (no rounding errors, etc …) since I confirmed that logs[‘accuracy’] in the on_train_batch_end callback was returning 1 for all batches on entire epochs
If you need more details, or want to go over the code with me, feel free to send me an email. Right now, I just want to know why the overall score isn’t just 1.0 since entire epochs are trained to 1
Thanks, well done on your progress!
Yes, to use history, will need to use the Keras API directly.
Yes, accuracy cannot go higher than 1, which is 100%.
I don’t follow the problem, sorry. What do you mean by “baseline score”?
Ok, so the general flow is this:
– estimators = []
– estimators.append((‘mlp’, KerasClassifier(…)))
– pipeline = Pipeline(estimators)
– kfold = StratifiedKFold(…)
– results = cross_val_score(pipeline,… , fit_params={…myCallbackhere…})
– print(“Baseline: %.2f%% (%.2f%%)” % (results.mean() * 100, results.std() * 100))
This is the baseline score returned by cross_val_score function (typically returns around 80-85% with a standard deviation)
See chapter 15.2 in deep learning with python, which starts off with creating a baseline before dividing into dropout regularization.
Ok, so I think you’re asking why do we get good performance on the train set and poor performance on the test set or on the summary across the test sets.
The reason is because the model is overfitting the training set at the expense of worse generalization performance – worst performance on the test set:
https://machinelearningmastery.com/introduction-to-regularization-to-reduce-overfitting-and-improve-generalization-error/
Does that help?
That’s the thing, as far as i can tell, no testing was done at all, only training (the callback calls for on_train are firing, but on_test don’t execute at all for this code)
Perhaps a really simple example would better illustrate what I am seeing:
– take the code in my previous comment, and I added the following to it:
– print(results)
– print(history.getScores()) # history is the keras callback class I created.
I also set the training to the following:
– epochs = 2
– n_splits = 3
– batch_size=1000
This will allow us to see a simple 2×3 grid of all the raw scores returned by on_train > log[‘accuracy’] in the keras callback
The output is this:
– output of print(results)
— [0.55714285 0.52173913 0.60869563]
– output of print(history…)
— 0 1 2
— 0 0.411932 0.370432 0.589976
— 1 0.461256 0.380024 0.625300
Each column in this pandas dataframe corresponds to one of those 3 n_splits, and there are 2 rows because there are 2 epochs
the results also appears to correspond to the n_splits …
– so intuitively, i would expect the first value in results to be the mean of the first column in the history dataframe … but this is not so
I’m wondering why I can’t reproduce the score returned by cross_val_score using the keras callback .. I should be able to right?
The scores from history are averaged across batches, not a true score for a dataset – as far as I remember.
Hi Jason
Your latest comment doesn’t have a reply button, so replying here
Those scores are not automatically averaged (each batch fires a separate call for on_train)
This is why I set batch_size to 1000, on a dataset with only around 200 records, this results in one batch per epoch. the average of a single number is itself, so i don’t think that is the problem
Fair enough.
Wonderful…. I always refer your articles when I get stuck… plz advise on how to load the “history” on reuse the model for plot with later prediction…
I am dumping the history using pickle, as mentioned below:
pickle.dump(H.history, open(filename, ‘wb’))
and want to load, something like this mentioned below:
Hist_later = pickle.load(filename)
Please help…
OK, I think I got it… worked done as….
when I am storing “H.history” into Hist_later
then I should plot
“plt.plot(np.arange(0, N), Hist_later [“loss”], label=”train_loss”)”
instead of
“plt.plot(np.arange(0, N), Hist_later.history[“loss”], label=”train_loss”)”
I’m happy to hear that you solved your problem.
Sorry, I don’t have an example of saving the history.
I believe you can use pickle as you suggest to save and load the history object.
Hi sir! Sorry to bother you, but your blog is amazing and the content, per si, is really helpful and the comment section is like a bonus. So I hope I am not being done too many questions because I don’t want to abuse your kindness.
My doubt is: How can I evaluated correctly the model and detect overfit or underfit? I read your other article about “diagnose overfitting” but back to this more simple example of training, I have some doubts.
I always split my dataset on the beginning on train/test (for not bias the data with any kind of pre-processing). If I do some kind of model evaluation I split the train set on a train and evaluate set.
On the final, after I “discover” the best model I fit all the train data (without the validation split) and use the test set from the beginning to evaluate the performance. Is this correct?
What should I do to evaluate the overall performance? I call model.evaluate with train data and after with test data. However, I am getting 100% accuracy on train data and 67% on test data. I assume that my model is overfitting. However, I always get 100% on train data, no matter the changes I do. Is this normal?
Thanks.
This will help to detect over/under fit:
https://machinelearningmastery.com/learning-curves-for-diagnosing-machine-learning-model-performance/
Hi Jason,
Thanks for this tutorial.
I want to compare two models by plotting the training accuracy of both of them in one graph. How to make it?
Perhaps store the vector of training accuracy for each model to file, then write a second program to load each file and plot as a line graph.
Hi Jason
Thanks for tutorials.
During training I forgot to store model history like this:
history = model.fit( trainX, trainY, …).
Now I need the model accuracy and loss to plot. How can I get those accuracy and loss. Or I have to train model again.?
You will have to train your model again.
Thanks a lot for this
You’re welcome!
Do you know how to generate these graphs if using a pipeline? I run into the error: AttributeError: ‘Pipeline’ object has no attribute ‘history’
You must use the Keras api directly.
Jason,
Thanks for sharing your knowledge, your post are always a great help. I am building a regression Model. Is it normal that the loss function fluctuates during training? I am a little concerned about this, because I expect the loss values to converge. Is there a recommended way to go around this?
Thanks!
Yes. It should trend down.
Hello and thanks for the fast response. Unfortunately I am not quite sure I understand your response. It should trend down meaning the fluctuation is normal as long as it reduces? Or convergence is a condition that should be ensured?
If loss trends down it might be a sign that the model is converging.
Hy Jason. I wonder, how to plotting history with different epochs? For example, i trained LSTM model for 10 epochs, and again i retrained with epochs 5, is it possible that for different epochs have same line loss plot? If it possible, how can i do that? Please your sugest, thank you!
You can create a line plot for each run, or simply save the history and create any plots you like in the future.
Perhaps I don’t understand the specific problem you’re having?
Because i tried to change optimizer during training, and i want that combine optimizer during training is possible to plotting.
Hy jason. I wonder, how to plotting loss function with different epochs? For example, i trained LSTM model for 10 epochs with Adam optimizer, then after 10 epochs, i tried to change to SGD with 5 epochs. So , how to plotting for 15 epochs (10 with adam and 5 with SGD) in the same loss function line plot? Please your explanation, thanks.
Gather or store the plots from each run, concatenate the arrays and plot the lines.
You can plot anything you wish.
Nice tutorial .
I train a CNN model with epochs=200 .
I want to get the weights of the model in the specific epoch that i have the maximum validation accuracy.
I know that the code model.fit(verbose=1) show the values for each epoch .
How can i do it ?
You can use early stopping or a check point.
Perhaps start here:
https://machinelearningmastery.com/how-to-stop-training-deep-neural-networks-at-the-right-time-using-early-stopping/
Anyone can help me to find the validation accuracy in graph ?
The above tutorials shows you how to create a line graph from training history.
Hello Jason,
Firstly congratulations about your work here, it helps a lot but i have a question.
In the my plot of accuracy (and in the one of loss) the of the 2 datasets are going in the opposite direction. I have tried to change the number of layers, the number of neurons in the layers, the bach_size and the number of epochs but this doesn’t change.
Do you have any idea about the problem?
Thanks a lot!!
Yes, loss will go down, accuracy will go up, this is normal.
Hi Jason, You referred me this article when we talked here: https://machinelearningmastery.com/difference-test-validation-datasets/#comment-594088
I am now following the approach mentioned in this article. As you mention here https://machinelearningmastery.com/faq/single-faq/why-do-you-use-the-test-dataset-as-the-validation-dataset/ that in general, it is not recommended to use test set as validation. But since I am manually changing the hyperparameters one by one and running the entire model on each combination, I don’t have to use validation set for tuning them or detecting early stopping. So can I use validation accuracy as test accuracy since the validation set is a hold out dataset not used to train the model?
Thanks in advance!
I would not recommend that approach as you may eventually overfit your model to your dataset.
Ideally, you would hold back some data that is not touched during model selection/hyperparameter tuning for a final model evaluation.
Reusing all data on all algorithms and tuning can cause you to find a model and config that works well only on your specific examples.
Oh, now I understood.
Thanks a lot!
You’re welcome.
One of the best websites, I got a good guide in virtual mode.
Thanks a lot for such a nice way to share the knowledge.
Thank you for your kind words!
How can I plot graphs on the same plot for 3 different models? Eg I want to plot accuracy v/s no of epochs graph of DenseNet, EfficientNet and ResNet on the same plot.
How can I do it?
Save the data to file, load each trace and add to a single plot.
I love your blog it is so helpful! Thank you so much
You’re very welcome!
Thank for this! Found it really helpful!!
You’re welcome!
How to calculate the execution time of a model in python? And we calculate the time of model execution with respect to what?
You can use timeit:
https://docs.python.org/3/library/timeit.html
i have fixed epoch,batch size and everything.While i am training the model everytime i am getting different accuracy,loss,val_accuracy and val_loss.but all the parameter i have used is same. can you clear my doubt
Yes, see this:
https://machinelearningmastery.com/faq/single-faq/why-do-i-get-different-results-each-time-i-run-the-code
While i am work with transfer learning it takes more time than the model taking time developed from the scratch. Why this scenario coming. Existing model is already trained right.?
That does not sound right to me.
Perhaps double-check your code.
Can we have more varriables other than loss, acc, val loss, val acc innthe history? Can we add more metrics? And how is this loss calculated?
Yes, you can specify as many built-in or custom functions you want.
Dr. Brownlee,
Quick question for you, sir. In the tutorial, you ran .fit() on X and y prior to calling ‘history’ and had Python output graphs for training and validation using that data. Is there a way to do this for cross-validation (in this case, cross_val_score) so the output is either graphed per fold or an aggregate of all folds?
You can see that history has the key ‘val_loss’ which gives you validation metrics. If you want to add more metrics, or do some tailor-made metrics, you can see this from the documentation: https://www.tensorflow.org/guide/keras/train_and_evaluate#custom_metrics
Thanks, Adrian! If I may ask one other question: say I’m running 10-fold cross-validation and want to output a graph of accuracy and/or loss versus epochs for each individual fold. Is that possible? Where I’m stuck is figuring out where to put the plotting commands since it seems to me that I’d have to call the plotting functions inside cross_val_score and I’m not sure how to make that happen.
Not reading your code but I can outline what you may do: You do 10-fold CV in a loop, one fold each iteration. Then you need to remember which iteration you’re at, and remember the metric into a separate array. After you finish all the CV, plot these 10 arrays as 10 curves.
Hello there. I am looking for a way to access data in a model trained in python. For example, can I access the data I trained from the inference graph obtained at the end of a model trained with faster rcnn?
thank you, but when i try this example I got an errorr :
plt.plot(history.history[‘val_accuracy’])
KeyError: ‘val_accuracy’
That means you didn’t do validation, or you didn’t keep the accuracy score in validation.
Is there a line of code that is missing from the example, because I feel like I’m doing the example to the letter and I’m getting the same error at plt.plot(history.history[‘val_accuracy])
KeyError: ‘val_accuracy’
Hi ML_New_Learner…did you leave out ‘ from the end of ‘val_accuracy’?
Hi Adrian. Do you know about my question? Thanks.
Are you talking about retrieving the data you used to train your model? I don’t think that’s possible because the model would not remember it.
Thank you for your return.
Hi Jason,
Thanks for all the hard work to make these wonderful tutorials. I have a question, in my model, the model performs much better on the testing set i.e 0.94, while it performs poorly on the training set, which is only 0.78 (After fine-tuning hyper-parameters, shuffling cross validation [StratifiedKFold, and StratifiedShuffleSplit] and accounting for class imbalances).
My dataset is severely imbalanced and it is a kind of high dimensional data that SMOTE and its varieties should not be used (Although I tested SMOTE and ADASYN to check their validity).
To account for the imbalances I tested 1) Class_weight = “balanced” parameter tuning 2) manual class weight tuning and 3) Sample weights. The only solution that worked to enhance performance over the testing set was when I set up Sample weight tuning. Here, the performance is much better for this classification problem but I am worried about the difference between the poor performance on the training set and enhanced performance on the testing set.
Could you kindly suggest a solution, please ?
Thanks in advance,
Hi Dash…The following discussion may be of interest:
https://www.researchgate.net/post/When_can_Validation_Accuracy_be_greater_than_Training_Accuracy_for_Deep_Learning_Models
Thanks
Hello James your posts are very usefull for me!
How could i plot rna weigth in order to see in order to see which configuration is the best
Hi Paublo…You are very welcome! Please clarify what is meant by “plot rna weight” so that we may better assist you.
Hello, when I create history from fit ex history = model.fit(… Does it really fit the model or just create history?
Best regards
Hi Kong….The following resource may add clarity:
https://towardsdatascience.com/fit-vs-predict-vs-fit-predict-in-python-scikit-learn-f15a34a8d39f
You can check to see which series your history.history dictionary contains.
print(history.history.keys())
In my case, the key was “val_acc”. My guess is that it was renamed in a newer version.
Thank you so much!!!!! You have no idea how much I’ve searched for a solution like this.
Hi,
Thanks for the great article.
In your code you plot the Training accuracy and val_accuracy.
plt.plot(history.history[‘accuracy’])
plt.plot(history.history[‘val_accuracy’])
However, the plot legend states Train and Test.
Shouldn’t the legend state Train and Validation, not test?
Peter
Thank you for your feedback Peter!