A classifier is only as good as the metric used to evaluate it.
If you choose the wrong metric to evaluate your models, you are likely to choose a poor model, or in the worst case, be misled about the expected performance of your model.
Choosing an appropriate metric is challenging generally in applied machine learning, but is particularly difficult for imbalanced classification problems. Firstly, because most of the standard metrics that are widely used assume a balanced class distribution, and because typically not all classes, and therefore, not all prediction errors, are equal for imbalanced classification.
In this tutorial, you will discover metrics that you can use for imbalanced classification.
After completing this tutorial, you will know:
- About the challenge of choosing metrics for classification, and how it is particularly difficult when there is a skewed class distribution.
- How there are three main types of metrics for evaluating classifier models, referred to as rank, threshold, and probability.
- How to choose a metric for imbalanced classification if you don’t know where to start.
Kick-start your project with my new book Imbalanced Classification with Python, including step-by-step tutorials and the Python source code files for all examples.
Let’s get started.

Tour of Evaluation Metrics for Imbalanced Classification
Photo by Travis Wise, some rights reserved.
Tutorial Overview
This tutorial is divided into three parts; they are:
- Challenge of Evaluation Metrics
- Taxonomy of Classifier Evaluation Metrics
- How to Choose an Evaluation Metric
Challenge of Evaluation Metrics
An evaluation metric quantifies the performance of a predictive model.
This typically involves training a model on a dataset, using the model to make predictions on a holdout dataset not used during training, then comparing the predictions to the expected values in the holdout dataset.
For classification problems, metrics involve comparing the expected class label to the predicted class label or interpreting the predicted probabilities for the class labels for the problem.
Selecting a model, and even the data preparation methods together are a search problem that is guided by the evaluation metric. Experiments are performed with different models and the outcome of each experiment is quantified with a metric.
Evaluation measures play a crucial role in both assessing the classification performance and guiding the classifier modeling.
— Classification Of Imbalanced Data: A Review, 2009.
There are standard metrics that are widely used for evaluating classification predictive models, such as classification accuracy or classification error.
Standard metrics work well on most problems, which is why they are widely adopted. But all metrics make assumptions about the problem or about what is important in the problem. Therefore an evaluation metric must be chosen that best captures what you or your project stakeholders believe is important about the model or predictions, which makes choosing model evaluation metrics challenging.
This challenge is made even more difficult when there is a skew in the class distribution. The reason for this is that many of the standard metrics become unreliable or even misleading when classes are imbalanced, or severely imbalanced, such as 1:100 or 1:1000 ratio between a minority and majority class.
In the case of class imbalances, the problem is even more acute because the default, relatively robust procedures used for unskewed data can break down miserably when the data is skewed.
— Page 187, Imbalanced Learning: Foundations, Algorithms, and Applications, 2013.
For example, reporting classification accuracy for a severely imbalanced classification problem could be dangerously misleading. This is the case if project stakeholders use the results to draw conclusions or plan new projects.
In fact, the use of common metrics in imbalanced domains can lead to sub-optimal classification models and might produce misleading conclusions since these measures are insensitive to skewed domains.
— A Survey of Predictive Modelling under Imbalanced Distributions, 2015.
Importantly, different evaluation metrics are often required when working with imbalanced classification.
Unlike standard evaluation metrics that treat all classes as equally important, imbalanced classification problems typically rate classification errors with the minority class as more important than those with the majority class. As such performance metrics may be needed that focus on the minority class, which is made challenging because it is the minority class where we lack observations required to train an effective model.
The main problem of imbalanced data sets lies on the fact that they are often associated with a user preference bias towards the performance on cases that are poorly represented in the available data sample.
— A Survey of Predictive Modelling under Imbalanced Distributions, 2015.
Now that we are familiar with the challenge of choosing a model evaluation metric, let’s look at some examples of different metrics from which we might choose.
Want to Get Started With Imbalance Classification?
Take my free 7-day email crash course now (with sample code).
Click to sign-up and also get a free PDF Ebook version of the course.
Taxonomy of Classifier Evaluation Metrics
There are tens of metrics to choose from when evaluating classifier models, and perhaps hundreds, if you consider all of the pet versions of metrics proposed by academics.
In order to get a handle on the metrics that you could choose from, we will use a taxonomy proposed by Cesar Ferri, et al. in their 2008 paper titled “An Experimental Comparison Of Performance Measures For Classification.” It was also adopted in the 2013 book titled “Imbalanced Learning” and I think proves useful.
We can divide evaluation metrics into three useful groups; they are:
- Threshold Metrics
- Ranking Metrics
- Probability Metrics.
This division is useful because the top metrics used by practitioners for classifiers generally, and specifically imbalanced classification, fit into the taxonomy neatly.
Several machine learning researchers have identified three families of evaluation metrics used in the context of classification. These are the threshold metrics (e.g., accuracy and F-measure), the ranking methods and metrics (e.g., receiver operating characteristics (ROC) analysis and AUC), and the probabilistic metrics (e.g., root-mean-squared error).
— Page 189, Imbalanced Learning: Foundations, Algorithms, and Applications, 2013.
Let’s take a closer look at each group in turn.
Threshold Metrics for Imbalanced Classification
Threshold metrics are those that quantify the classification prediction errors.
That is, they are designed to summarize the fraction, ratio, or rate of when a predicted class does not match the expected class in a holdout dataset.
Metrics based on a threshold and a qualitative understanding of error […] These measures are used when we want a model to minimise the number of errors.
— An Experimental Comparison Of Performance Measures For Classification, 2008.
Perhaps the most widely used threshold metric is classification accuracy.
- Accuracy = Correct Predictions / Total Predictions
And the complement of classification accuracy called classification error.
- Error = Incorrect Predictions / Total Predictions
Although widely used, classification accuracy is almost universally inappropriate for imbalanced classification. The reason is, a high accuracy (or low error) is achievable by a no skill model that only predicts the majority class.
For more on the failure of classification accuracy, see the tutorial:
For imbalanced classification problems, the majority class is typically referred to as the negative outcome (e.g. such as “no change” or “negative test result“), and the minority class is typically referred to as the positive outcome (e.g. “change” or “positive test result“).
- Majority Class: Negative outcome, class 0.
- Minority Class: Positive outcome, class 1.
Most threshold metrics can be best understood by the terms used in a confusion matrix for a binary (two-class) classification problem. This does not mean that the metrics are limited for use on binary classification; it is just an easy way to quickly understand what is being measured.
The confusion matrix provides more insight into not only the performance of a predictive model but also which classes are being predicted correctly, which incorrectly, and what type of errors are being made. In this type of confusion matrix, each cell in the table has a specific and well-understood name, summarized as follows:
|
1 2 3 |
| Positive Prediction | Negative Prediction Positive Class | True Positive (TP) | False Negative (FN) Negative Class | False Positive (FP) | True Negative (TN) |
There are two groups of metrics that may be useful for imbalanced classification because they focus on one class; they are sensitivity-specificity and precision-recall.
Sensitivity-Specificity Metrics
Sensitivity refers to the true positive rate and summarizes how well the positive class was predicted.
- Sensitivity = TruePositive / (TruePositive + FalseNegative)
Specificity is the complement to sensitivity, or the true negative rate, and summarises how well the negative class was predicted.
- Specificity = TrueNegative / (FalsePositive + TrueNegative)
For imbalanced classification, the sensitivity might be more interesting than the specificity.
Sensitivity and Specificity can be combined into a single score that balances both concerns, called the geometric mean or G-Mean.
- G-Mean = sqrt(Sensitivity * Specificity)
Precision-Recall Metrics
Precision summarizes the fraction of examples assigned the positive class that belong to the positive class.
- Precision = TruePositive / (TruePositive + FalsePositive)
Recall summarizes how well the positive class was predicted and is the same calculation as sensitivity.
- Recall = TruePositive / (TruePositive + FalseNegative)
Precision and recall can be combined into a single score that seeks to balance both concerns, called the F-score or the F-measure.
- F-Measure = (2 * Precision * Recall) / (Precision + Recall)
The F-Measure is a popular metric for imbalanced classification.
The Fbeta-measure measure is an abstraction of the F-measure where the balance of precision and recall in the calculation of the harmonic mean is controlled by a coefficient called beta.
- Fbeta-Measure = ((1 + beta^2) * Precision * Recall) / (beta^2 * Precision + Recall)
For more on precision, recall and F-measure for imbalanced classification, see the tutorial:
Additional Threshold Metrics
These are probably the most popular metrics to consider, although many others do exist. To give you a taste, these include Kappa, Macro-Average Accuracy, Mean-Class-Weighted Accuracy, Optimized Precision, Adjusted Geometric Mean, Balanced Accuracy, and more.
Threshold metrics are easy to calculate and easy to understand.
One limitation of these metrics is that they assume that the class distribution observed in the training dataset will match the distribution in the test set and in real data when the model is used to make predictions. This is often the case, but when it is not the case, the performance can be quite misleading.
An important disadvantage of all the threshold metrics discussed in the previous section is that they assume full knowledge of the conditions under which the classifier will be deployed. In particular, they assume that the class imbalance present in the training set is the one that will be encountered throughout the operating life of the classifier
— Page 196, Imbalanced Learning: Foundations, Algorithms, and Applications, 2013.
Ranking metrics don’t make any assumptions about class distributions.
Ranking Metrics for Imbalanced Classification
Rank metrics are more concerned with evaluating classifiers based on how effective they are at separating classes.
Metrics based on how well the model ranks the examples […] These are important for many applications […] where classifiers are used to select the best n instances of a set of data or when good class separation is crucial.
— An Experimental Comparison Of Performance Measures For Classification, 2008.
These metrics require that a classifier predicts a score or a probability of class membership.
From this score, different thresholds can be applied to test the effectiveness of classifiers. Those models that maintain a good score across a range of thresholds will have good class separation and will be ranked higher.
… consider a classifier that gives a numeric score for an instance to be classified in the positive class. Therefore, instead of a simple positive or negative prediction, the score introduces a level of granularity
– Page 53, Learning from Imbalanced Data Sets, 2018.
The most commonly used ranking metric is the ROC Curve or ROC Analysis.
ROC is an acronym that means Receiver Operating Characteristic and summarizes a field of study for analyzing binary classifiers based on their ability to discriminate classes.
A ROC curve is a diagnostic plot for summarizing the behavior of a model by calculating the false positive rate and true positive rate for a set of predictions by the model under different thresholds.
The true positive rate is the recall or sensitivity.
- TruePositiveRate = TruePositive / (TruePositive + FalseNegative)
The false positive rate is calculated as:
- FalsePositiveRate = FalsePositive / (FalsePositive + TrueNegative)
Each threshold is a point on the plot and the points are connected to form a curve. A classifier that has no skill (e.g. predicts the majority class under all thresholds) will be represented by a diagonal line from the bottom left to the top right.
Any points below this line have worse than no skill. A perfect model will be a point in the top left of the plot.
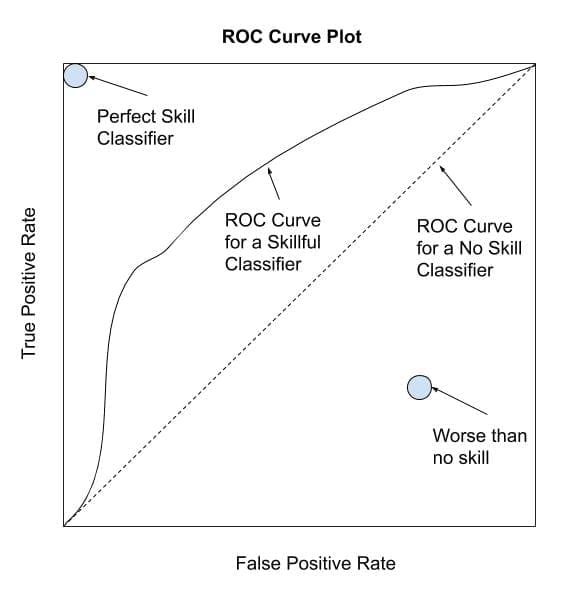
Depiction of a ROC Curve
The ROC Curve is a helpful diagnostic for one model.
The area under the ROC curve can be calculated and provides a single score to summarize the plot that can be used to compare models.
A no skill classifier will have a score of 0.5, whereas a perfect classifier will have a score of 1.0.
- ROC AUC = ROC Area Under Curve
Although generally effective, the ROC Curve and ROC AUC can be optimistic under a severe class imbalance, especially when the number of examples in the minority class is small.
An alternative to the ROC Curve is the precision-recall curve that can be used in a similar way, although focuses on the performance of the classifier on the minority class.
Again, different thresholds are used on a set of predictions by a model, and in this case, the precision and recall are calculated. The points form a curve and classifiers that perform better under a range of different thresholds will be ranked higher.
A no-skill classifier will be a horizontal line on the plot with a precision that is proportional to the number of positive examples in the dataset. For a balanced dataset this will be 0.5. A perfect classifier is represented by a point in the top right.
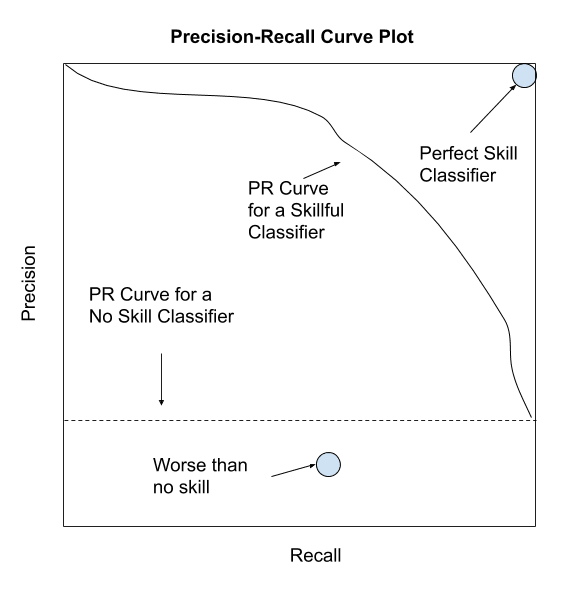
Depiction of a Precision-Recall Curve
Like the ROC Curve, the Precision-Recall Curve is a helpful diagnostic tool for evaluating a single classifier but challenging for comparing classifiers.
And like the ROC AUC, we can calculate the area under the curve as a score and use that score to compare classifiers. In this case, the focus on the minority class makes the Precision-Recall AUC more useful for imbalanced classification problems.
- PR AUC = Precision-Recall Area Under Curve
There are other ranking metrics that are less widely used, such as modification to the ROC Curve for imbalanced classification and cost curves.
For more on ROC curves and precision-recall curves for imbalanced classification, see the tutorial:
Probabilistic Metrics for Imbalanced Classification
Probabilistic metrics are designed specifically to quantify the uncertainty in a classifier’s predictions.
These are useful for problems where we are less interested in incorrect vs. correct class predictions and more interested in the uncertainty the model has in predictions and penalizing those predictions that are wrong but highly confident.
Metrics based on a probabilistic understanding of error, i.e. measuring the deviation from the true probability […] These measures are especially useful when we want an assessment of the reliability of the classifiers, not only measuring when they fail but whether they have selected the wrong class with a high or low probability.
— An Experimental Comparison Of Performance Measures For Classification, 2008.
Evaluating a model based on the predicted probabilities requires that the probabilities are calibrated.
Some classifiers are trained using a probabilistic framework, such as maximum likelihood estimation, meaning that their probabilities are already calibrated. An example would be logistic regression.
Many nonlinear classifiers are not trained under a probabilistic framework and therefore require their probabilities to be calibrated against a dataset prior to being evaluated via a probabilistic metric. Examples might include support vector machines and k-nearest neighbors.
Perhaps the most common metric for evaluating predicted probabilities is log loss for binary classification (or the negative log likelihood), or known more generally as cross-entropy.
For a binary classification dataset where the expected values are y and the predicted values are yhat, this can be calculated as follows:
- LogLoss = -((1 – y) * log(1 – yhat) + y * log(yhat))
The score can be generalized to multiple classes by simply adding the terms; for example:
- LogLoss = -( sum c in C y_c * log(yhat_c))
The score summarizes the average difference between two probability distributions. A perfect classifier has a log loss of 0.0, with worse values being positive up to infinity.
Another popular score for predicted probabilities is the Brier score.
The benefit of the Brier score is that it is focused on the positive class, which for imbalanced classification is the minority class. This makes it more preferable than log loss, which is focused on the entire probability distribution.
The Brier score is calculated as the mean squared error between the expected probabilities for the positive class (e.g. 1.0) and the predicted probabilities. Recall that the mean squared error is the average of the squared differences between the values.
- BrierScore = 1/N * Sum i to N (yhat_i – y_i)^2
A perfect classifier has a Brier score of 0.0. Although typically described in terms of binary classification tasks, the Brier score can also be calculated for multiclass classification problems.
The differences in Brier score for different classifiers can be very small. In order to address this problem, the score can be scaled against a reference score, such as the score from a no skill classifier (e.g. predicting the probability distribution of the positive class in the training dataset).
Using the reference score, a Brier Skill Score, or BSS, can be calculated where 0.0 represents no skill, worse than no skill results are negative, and the perfect skill is represented by a value of 1.0.
- BrierSkillScore = 1 – (BrierScore / BrierScore_ref)
Although popular for balanced classification problems, probability scoring methods are less widely used for classification problems with a skewed class distribution.
For more on probabilistic metrics for imbalanced classification, see the tutorial:
How to Choose an Evaluation Metric
There is an enormous number of model evaluation metrics to choose from.
Given that choosing an evaluation metric is so important and there are tens or perhaps hundreds of metrics to choose from, what are you supposed to do?
The correct evaluation of learned models is one of the most important issues in pattern recognition.
— An Experimental Comparison Of Performance Measures For Classification, 2008.
Perhaps the best approach is to talk to project stakeholders and figure out what is important about a model or set of predictions. Then select a few metrics that seem to capture what is important, then test the metric with different scenarios.
A scenario might be a mock set of predictions for a test dataset with a skewed class distribution that matches your problem domain. You can test what happens to the metric if a model predicts all the majority class, all the minority class, does well, does poorly, and so on. A few small tests can rapidly help you get a feeling for how the metric might perform.
Another approach might be to perform a literature review and discover what metrics are most commonly used by other practitioners or academics working on the same general type of problem. This can often be insightful, but be warned that some fields of study may fall into groupthink and adopt a metric that might be excellent for comparing large numbers of models at scale, but terrible for model selection in practice.
Still have no idea?
Here are some first-order suggestions:
- Are you predicting probabilities?
- Do you need class labels?
- Is the positive class more important?
- Use Precision-Recall AUC
- Are both classes important?
- Use ROC AUC
- Is the positive class more important?
- Do you need probabilities?
- Use Brier Score and Brier Skill Score
- Do you need class labels?
- Are you predicting class labels?
- Is the positive class more important?
- Are False Negatives and False Positives Equally Important?
- Use F1-Measure
- Are False Negatives More Important?
- Use F2-Measure
- Are False Positives More Important?
- Use F0.5-Measure
- Are False Negatives and False Positives Equally Important?
- Are both classes important?
- Do you have < 80%-90% Examples for the Majority Class?
- Use Accuracy
- Do you have > 80%-90% Examples for the Majority Class?
- Use G-Mean
- Do you have < 80%-90% Examples for the Majority Class?
- Is the positive class more important?
These suggestions take the important case into account where we might use models that predict probabilities, but require crisp class labels. This is an important class of problems that allow the operator or implementor to choose the threshold to trade-off misclassification errors. In this scenario, error metrics are required that consider all reasonable thresholds, hence the use of the area under curve metrics.
We can transform these suggestions into a helpful template.
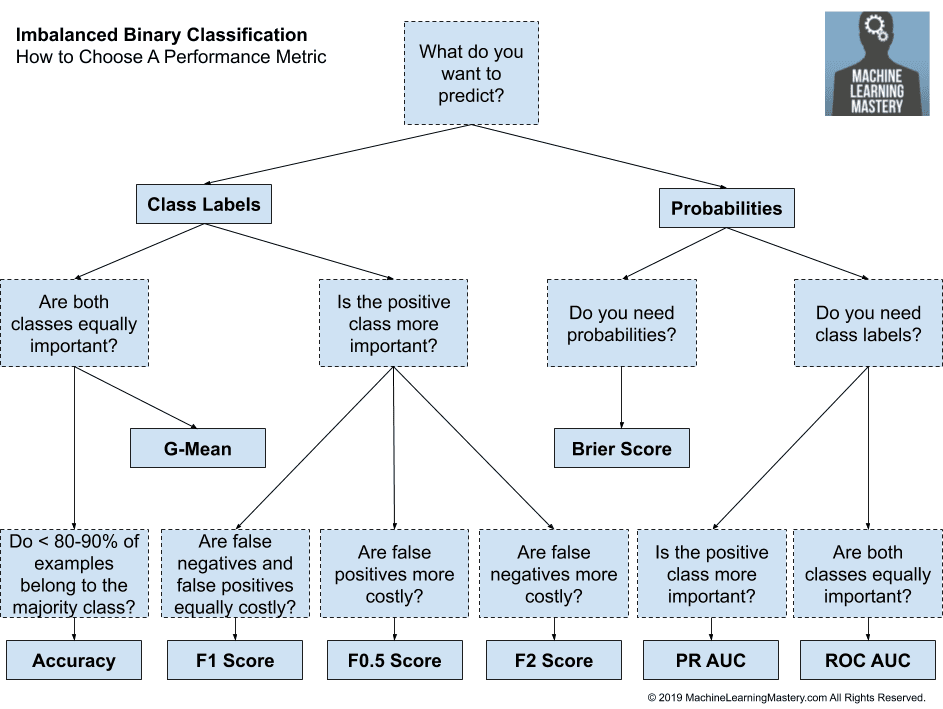
How to Choose a Metric for Imbalanced Classification
Further Reading
This section provides more resources on the topic if you are looking to go deeper.
Papers
- An Experimental Comparison Of Performance Measures For Classification, 2008.
- Classification Of Imbalanced Data: A Review, 2009.
- A Survey of Predictive Modelling under Imbalanced Distributions, 2015.
Books
- Chapter 8 Assessment Metrics For Imbalanced Learning, Imbalanced Learning: Foundations, Algorithms, and Applications, 2013.
- Chapter 3 Performance Measures, Learning from Imbalanced Data Sets, 2018.
Articles
- Precision and recall, Wikipedia.
- Sensitivity and specificity, Wikipedia.
- Receiver operating characteristic, Wikipedia.
- Cross entropy, Wikipedia.
- Brier score, Wikipedia.
Summary
In this tutorial, you discovered metrics that you can use for imbalanced classification.
Specifically, you learned:
- About the challenge of choosing metrics for classification, and how it is particularly difficult when there is a skewed class distribution.
- How there are three main types of metrics for evaluating classifier models, referred to as rank, threshold, and probability.
- How to choose a metric for imbalanced classification if you don’t know where to start.
Do you have any questions?
Ask your questions in the comments below and I will do my best to answer.
Get a Handle on Imbalanced Classification!

Develop Imbalanced Learning Models in Minutes
...with just a few lines of python code
Discover how in my new Ebook:
Imbalanced Classification with Python
It provides self-study tutorials and end-to-end projects on:
Performance Metrics, Undersampling Methods, SMOTE, Threshold Moving, Probability Calibration, Cost-Sensitive Algorithms
and much more...


Clear depiction of metrics.It is very helpful.
Thanks!
I’m proud of the metric selection tree, took some work to put it together.
Amazing as always!!!
I have a question regarding the effect of noisy labels percentage (for example we know that we have around 15% wrong ground truth labels in the dataset) on the maximum achievable precision and recall in binary classification problems?
Thanks!
Even with noisy labels, repeated cross-validation will give a robust estimate of model performance.
Unless I misunderstand the question?
Hey Jason,
First, thank you very much for this interesting post!
I follow you and really like your posts.
I appericiate a lot all your efforts to write it.
Do you also have a post on metric selection for non-binary classification problems?
Thanks!
No, the exact same process can be used, where classes are divided into positive and negative classes.
Do you mean performing the metrics in a 1vs1 approach for all possibilities? One relatively simple metric I found for non-binary classifications is Kappa.
Hi…You are correct in your understanding! Keep up the great work!
Hi Jason
Any thoughts on the H-metric?
Here is an extract from the R package implementing it
The hmeasure package is intended as a complete solution for classification performance. Its main advantage over existing implementations is the inclusion of the H-measure for classification perfor- mance (Hand, 2009,2010), which is gradually becoming accepted in the classification literature as a coherent alternative to the AUC.
Thanks
Sorry Sean, I’m not familiar with it.
I mostly stick to the basics when it comes to metrics. Lots of AUC and F-measure.
What about Matthews correlation coefficient (MCC) and Youden’s J statistic/index? When do I use those?
Great suggestions, thanks.
I am just asking because I can’t figure out where would these performance metrics fit in the graph above. Maybe you have some suggestions?
Good question. Not off hand, some analysis would be required. Thanks for the suggestion.
LogLoss = -( sum c in C y_c * log(yhat_c))..
this doesn’t seem clear to me….can you re-phrase?
Yes, see this:
https://machinelearningmastery.com/cross-entropy-for-machine-learning/
Hi
“The benefit of the Brier score is that it is focused on the positive class, which for imbalanced classification is the minority class.”
Could you please elaborate this a bit?
Naively I would say LogLoss is the one which is focused on the positive class and not Brier score, as because when y=1, then the term:
LogLoss = -((1 – y) * log(1 – yhat) + y * log(yhat))
Becomes:
LogLoss = -log(yhat)
Thanks.
The fact that the probability is a Binomial distribution means that the error calculated in the Brier score favors the positive class (e.g. larger difference is more error).
Jason – I’m still struggling a bit with Brier score. In my mind, this metric is like MSE for probabilities. If I predict a probability of being in the positive class of 0.1 and the instance is in the negative (majority) class (label = 0), I’d take a 0.1^2 hit. If I predict a probability of being in the positive class of 0.9 and the instance is in that class, I take that same 0.1^2 hit. Of course, this is a assuming my model does an equally good job of predicting 0s and 1s. It’s very likely my model does a great job of predicting 0s and and a pretty bad job of predicting 1s so that much of what the value in the score is attributable to poor positive class prediction. But I could still make incremental improvements (lowering my score) by getting better with my negative class predictions while making little or worsening gains on the positive side. I’m I understanding this correctly?
Sounds like a good intuition to me, off the cuff.
So does this mean Brier score is no better than log loss for evaluation performance on imbalanced data (based on Bryan’s response)?
Hi Joe…You may find the following resources of interest:
https://www.dratings.com/log-loss-vs-brier-score/
https://machinelearningmastery.com/probability-metrics-for-imbalanced-classification/
Hi Jason, Thanks for the detailed explanation. It helps me a lot. 🙂
You’re welcome!
Hi Jason, I’ve the probability scores of positive class for two models. The frequency distribution of those probability scores(thresholds) are like this https://imgur.com/a/8olSHUh. Can we say the Model #2 is doing well in separating classes?
Distribution looks healthy. Not sure I can make more claims than that.
Can you please let me know what inference can we draw from those histograms?
What are you plotting exactly?
I assumed it was the distribution of predicted probabilities, but on a second look, that does not seem to be the case.
Hi Jason,
These are the frequency distribution of predicted probabilities of **positive class**(Code : test_thresholds_TFIDF=clf.predict_proba(X_test_TFIDF_set)[:,1]) obtained from two different models.
The stats in confusion matrix for two model are almost same.
But when I plotted the frequency distribution predicted probabilities of **positive class** the above patterns are observed for model#1, Model #2.
Note: The Y axis for the first plot is in 1000’s and the Y axis for the second plot is in 100’s. Hope this is where you have misled.
If they are plots of probabilities for a test dataset, then the first model shows good separation and the second does not.
Thanks for the confirmation.
You’re welcome.
Thanks
You’re welcome.
very useful article.
please ,can I use ranking metrices like recall@25 in logistic regression model?
Sure.
Before applying all the metric do we have to balance the dataset using techniques like upsampling, smot etc ?
Perhaps, it depends on the dataset.
See this framework:
https://machinelearningmastery.com/framework-for-imbalanced-classification-projects/
When it comes to primary tumor classification, which metric do I have to use to optimize the model?
It’s a multi-class classification task and the dataset is imbalanced. I have balanced the dataset using resampling.
Can I use micro-f1 for this purpose? or do I have to optimize for sensitivity or specificity ?
My goal is to get the best model that could correctly classify new data points.
Thanks
San
You must choose a metric that best captures what is important to you and project stakeholders.
Start with what is important in the predictions from a model, then select a metric that captures that.
This makes perfect sense to me.
What if every class is equally important? (There are 2 maj.(50%, 40%) and 1 min. in my case). G-mean or F1-score or accuracy is something I am considering and I also saw the framework above for binary classification. Just wanted to makes sure if i can choose the above metrics as there are > 90% in majority classes combined?
For “two classes equally important” consider accuracy or ROC AUC.
Sorry, what means (in the tree) “more costly”?
Thank you very much, amazing article.
What do you mean, can you please elaborate?
Hi Mr. Jason,
I have been reading your articles and working on my research. It has been quite useful and awesome theories from your articles! Please do publish more articles!
Thanks!
I have a three class, imbalanced dataset.
I’d like to make a three class classifier.
Now, I’m using random forest with class weight,
and evaluate the model performance by macro average of F1-score.
I have two questions.
1. Are there any better evaluation methods other than macro average of F1-score?
2. The values of miss predictions are not same.
For example,
True A : Predicted B→Big mistake
True A: Predicted C→Minor mistake
True B: Predicted C→Big mistake
Is there any good evaluation methods of such Big mistake?
There is no objectively better metric, you must choose a metric that is most appropriate given the goals of your project.
Also, you may want to look into using a cost matrix to help interpret the confusion matrix predicted by the model on a test set.
Hi @Jason,
I am interested in metrics to evaluate the modeĺ’s performance on a per-class level. For example, I know scikit-learn provides the classification_report function that computes the precision/recall/f1 for each class. Are there other metrics that evaluate to per class bases?
I recommend selecting a single metric to optimize on a project.
Attempting to optimize more than one metric will lead to confusion.
Thanks a lot Jason, this is a fantastic summary! Super helpful!
You’re welcome!
This is very helpful for me, thank you very much!
You’re welcome.
Thanks for this post, was very helpful!
One question… You first mentioned (both in this post and your previous posts) that accuracy and error aren’t good metics when it comes to imbalance dataset. However, in your selection tree we see that if we want to predict label and both class are equally important and we have < 80%-90% Examples for the Majority Class the we can use accuracy score… Is it fair to interpret that if we have < 80%-90% Examples for the Majority Class, then our dataset is ROUGHLY balanced and therefore we can use the accuracy score?
One more q, the dataset we're talking about is the test dataset, right?
Thank you
You’re welcome.
Yes, accuracy can be good if classes are roughly balanced. It’s just a guide. You have to make up your own mind for your project.
No, the balance of the dataset is all data available.
OK, so I split my dataset to train and test and use upsampling in a way that my train dataset is balanced and the train the data on it. Then I use this model on test dataset (which is imbalanced)… Do I have an imbalanced dataset or a balanced one? I believe it is still imbalanced since the model is running on test dataset which is imbalanced…Does that make sense?
Yes, fit on a balanced dataset, evaluate on imbalanced dataset (data as it appears in the domain).
The problem you are solving is imbalanced classificaiton.
Would you please give more details about when a dataset is ROUGHLY balanced, and in this case why accuracy metric can be considered good?
Thanks
Hi Jason
I don’t get one point, suppose that we are dealing with highly imbalanced data, then we apply the oversampling approach for dealing with this issue, and our training set gets balanced because we should use all method for dealing with imbalanced data only on the training set.(write?)
so my question is that after applying oversampling or under-sampling again we should use metrics like F1 score, Precision-Recall, AUC, or no we can use accuracy? My second question is that can we consider dealing with imbalanced data as a part of data preprocessing in a machine learning pipeline or not?
thanks
Yes, only the training dataset is balanced.
Accuracy is a bad idea in most imbalanced cases. Generally, you must choose a metric that best captures what is important about predictions.
Handling imbalance can be a data prep, it can be a model (cost sensitive), it can me a metric (weighed), all of the above, etc.
Can we treat imbalanced dataset as balanced (by applying techniques such as SMOTE) and then apply evaluation metrics?
Applying SMOTE to the test set would be invalid.
Hi,
Is there any relationship between F1-score,AUC & recall , i mean if one increases other will also increase/decrease (relative change) ?
Yes, see this:
https://machinelearningmastery.com/roc-curves-and-precision-recall-curves-for-classification-in-python/
And this:
https://machinelearningmastery.com/roc-curves-and-precision-recall-curves-for-imbalanced-classification/
Hi Jason
From all the sources that I know, I prefer your posts when it is about practical
applied data science. The pace and practical benefits of your posts are amazing.
Comment: For many practical binary classification problems in business, e.g. credit scoring, scoring of customers for direct marketing response, gains resp. lift charts and Gini coefficient are more common than ROC, AUC. Difference well described here:
https://community.tibco.com/wiki/gains-vs-roc-curves-do-you-understand-difference#:~:text=The%20Gains%20chart%20is%20the,found%20in%20the%20targeted%20sample.
Would be nice to see a post with Python code about this topic by you 😉
Thanks!
Also:
https://machinelearningmastery.com/roc-curves-and-precision-recall-curves-for-classification-in-python/
And here:
https://machinelearningmastery.com/roc-curves-and-precision-recall-curves-for-imbalanced-classification/
Hi Jason,
I just want to know which references make you conclude this statement “If we want to predict label and both classes are equally important and we have < 80%-90% for the Majority Class, then we can use accuracy score"
I hope you answer my question, thank you
It my recommendation. I suspect such advice will never appear in a textbook or paper – too simple/practical.
hello, is there any documentation for understanding micro and macro recall and precision?
Yes, here:
https://scikit-learn.org/stable/modules/generated/sklearn.metrics.precision_score.html
And I think I have some:
https://machinelearningmastery.com/precision-recall-and-f-measure-for-imbalanced-classification/
Great as always.
This is the result of my test set:
TN: 66728
FP: 19929
FN: 211
TP: 1624
As you can see I have 1835 data points from class1 and 86657 from class2. Can you please share your opinion about this model? I would appreciate it.
Sorry, I don’t interpret results.
Ok another question. I am getting very low precision from model above. I realized that’s because my test set is also imbalanced. When I apply the formula of precision tp/(tp+fp), it is naturally so low because amount of fp is so high considering tp because of high amount of majority class. I thought precision is not a metric I should consider. Am I right?
This will help you choose an appropriate metric:
https://machinelearningmastery.com/tour-of-evaluation-metrics-for-imbalanced-classification/
Hi Jason, thanks a lot for the post, always helpful and straight to the point. i’m working on a project and need some advice if you may. Our main goal is to predict the probability class if someone will get promoted in his job or not (0 for and 1 for yes) based on a list of features. Our dataset is imbalanced (1 to 10 ratio), so i need advice on the below:
1- We should do the cleaning, pre-processing, and feature engineering on the training dataset first before we proceed to adopt any sampling technique, correct?
2- I want to use the SMOTE technique combined with undersampling as per your tutorial. Can i implement the pipeline created in a grid search to fine-tune the parameters of the classifier?
3- What sample strategy you recommend we adopt for a 1/10 dataset?
4- Finally, how can i improve my AUC_ROC score using the grid search tuning, what should i pay attention to ?
Thanks a lot
You’re welcome.
Yes, data prep is calculated on the training set and then applied to train and test. Within cv, you use a pipeline to do this automatically.
Sure, smote can be used as part of a grid search.
I recommend testing a suite of methods and discover what works best for your data:
https://machinelearningmastery.com/framework-for-imbalanced-classification-projects/
Hi Jason, thanks a lot for your fast response.
Just regarding the first point, So, I don’t need to do any sampling during the data prep stage, right? I should get my data ready first and then test different sampling methods and see what works best, right?
Also, could you please clarify your point regarding the CV and pipeline, as i didn’t get it 100%.
Thanks
Not quite, instead, construct a pipeline of data prep steps that ends in a sampling method.
You can see examples here:
https://machinelearningmastery.com/smote-oversampling-for-imbalanced-classification/
Any points below this line have worse than no skill. A perfect model will be a point in the top right of the plot.
… It should say in the top left of the plot
Thanks, fixed!
Hi Jason. Really great post. I’ve been working on imbalanced data for a while and this post has helped me several times. I have a model for imbalanced data and tested it on large variants of datasets with different class distributions (distributions from [0.5,0.5] to [0.95,0.05]). To evaluate it, I reported Accuracy, macro F1, binary F1, and ROC AUC (with macro averaging). Now I have faced a new question that why I have used accuracy and not average accuracy. Actually, this didn’t come up to my mind during the evaluation, because I thought that due to the diversity in the class imbalance, it would be nice to have a metric that is an average over samples, and also two other metrics which are obtained by averaging over class. But it seems this is not so convincing to other people. Could you please guide me on if I am wrong? Or give me any reference or maybe some reasoning that didn’t come to my mind? Thanks a lot.
Thanks!
I recommend choosing one metric to optimize, otherwise, it gets too confusing.
Also, perhaps talk to the people that are interested in the model and ask what metric would be helpful to them to understand model performance.
Thanks a lot
You’re welcome.
Hello Jason,
First things first, thank you very much for your nice classification metrics summary.
Secondly, I’m currently dealing with some classification problem, in which a label must be predicted, and I will be paying close attention to positive class. For me, it’s very important to generate as little “False Negatives” as possible. Following your tree, I must decide between 1 of the following options:
1) Are False Negatives More Important?: Use F2-Measure
2) Are False Positives More Important?: Use F0.5-Measure
However, I don’t get your meaning of “Important”… If my understanding is correct, for my problem “False Negatives are Important”, therefore F2-Measure should be picked? Is my understanding correct?
Thank you once more, and best regards.
You’re welcome.
Here, important means “paramount” (more important than anything else; supreme), e.g. most important thing about the performance of the model to you and stakeholders.
Incredibly helpful, just what I was looking for. Made me think whether it was probabilities I wanted or classes for our prediction problem. Since we want to rank, I concluded probabilities and thus we should look at the Brier score. I wonder if I can make xgboost use this as a custom loss function?
You’re welcome.
Perhaps use log loss and stick to brier score as a metric only. In the same way we don’t train models on “classification accuracy” as a loss function.
Why don’t we train models on “classification accuracy” as a loss function?
Hi Joe…In order to be used in backpropgation, a loss function needs to be “differentiable”. More can be found here:
https://machinelearningmastery.com/loss-functions-in-tensorflow/
https://machinelearningmastery.com/difference-between-backpropagation-and-stochastic-gradient-descent/
Hi,
I am assuming that this article and metrics are not only used for binary classification.
Can we use the same suggestion template to select a metric for imbalanced multi-class classification problem?
Thank you!
Yes, most of the metrics can be used for multi-class classification, assuming you specify which classes are the majority and which are the minority (e.g. in the case of precision, recall, f1, and friends).
I know that I can specify the minority classes using the ‘label’ argument in sk-learn function, could you please correct me if I am wrong and tell me how to specify the majority classes?
Thank you!
Yes, I believe that is sufficient.
For a model that predicts real numbers (e.g. 0 to 100) in a certain range (; I think of it as a regression model), how do I create a dataset if the prediction is biased towards a certain range?
Is there such a thing as stratified extraction like in classification models?
For example, do I need to use a stratified extraction method for each range?
Or are such issues not a concern in the case of regression models?
Great blog! Thanks!
I have a question. I hope you can help me. Imagine in the highly imbalanced dataset the interest is in the minority group and false negatives are more important, then we can use f2 metrics as evaluation metrics.
But how should we take this into account when training the model and doing cross-validation?
So, can I use the f2 score in cross-validation to tune the hyperparameters? However, in the xgboost we are optimizing weighted logloss.
How to match the objective and metric functions?
Thanks in advance!
I have a query regarding the usage of a pipeline with SMOTE,
Below is the code snippet:
steps = [(‘scale’, StandardScaler()),(‘over’, SMOTE(sampling_strategy = ‘all’, random_state = 0)), (‘model’, DecisionTreeClassifier())]
pipeline = Pipeline(steps=steps)
cv = KFold(n_splits=3, shuffle=True, random_state=None)
scores = model_selection.cross_val_score(pipeline, X, y, scoring=’accuracy’, cv=cv, n_jobs=-1)
print(“Score”, scores.mean())
I keep getting nan value as score..
If I do it without a pipeline, I am getting a numeric value.. What could be the reason?? I have referred StackOverflow and multiple resources but didn’t get relevant reply…Kindly help me with this
Excellent post,
May I know when to use,
Gini Index, KS Statistic and p-value.
Thank you very much
The way these ads are loading and shifting the text as they load create an unpleasant and jarring user experience.
Hi Jason, amazing tutorial, thank you 🙂
I have a question;
If the positive class is the most important, and there is higher percentage of positive class than the negative class, then PR-AUC seems to be very biased. Actually, the higher the percentage of positive class the higher the PR-AUC.
If even in this case, the positive class is more important, which would be the right metric to use?
Would it make sense to say, PR-AUC is good for imbalanced datasets when the positive class is a small percentage comparing to the negative class? But what happens when the percentage of positive class is much much higher? Thank would be extremely helpful to know. Thank you 🙂
Hi Vasia…Your observations about PR-AUC (Precision-Recall Area Under the Curve) are valid and highlight an important aspect of choosing metrics: they need to align with the data distribution and problem requirements. Here’s a detailed explanation addressing your question:
—
### **PR-AUC and Its Bias Toward the Positive Class**
– **Precision-Recall AUC** measures how well a model balances precision (quality of positive predictions) and recall (coverage of actual positives). It’s a good metric when the positive class is **rare** compared to the negative class.
– **Issue with High Positive-Class Proportion**:
– When the percentage of the positive class is much higher, PR-AUC becomes less meaningful because:
1. Precision naturally increases since the model can correctly classify more positives by chance.
2. PR-AUC tends to inflate due to the higher prevalence of positives, reducing its discriminative power.
– It becomes biased toward the positive class, making it harder to assess the model’s true performance.
—
### **When the Positive Class Is More Prevalent**
If the positive class is dominant but still the focus of importance, other metrics may provide better insight:
#### 1. **ROC-AUC (Receiver Operating Characteristic Area Under the Curve)**
– **Why it works**:
– ROC-AUC evaluates the balance between True Positive Rate (TPR) and False Positive Rate (FPR) across thresholds.
– It’s less sensitive to class imbalance compared to PR-AUC.
– **Caution**:
– When the positive class dominates, ROC-AUC may appear overly optimistic since most negatives are correctly classified by chance.
#### 2. **Balanced Accuracy**
– Balanced accuracy averages the recall of the positive and negative classes:
\[
\text{Balanced Accuracy} = \frac{\text{Sensitivity} + \text{Specificity}}{2}
\]
– **Why it works**:
– It accounts for class imbalance by giving equal importance to both classes.
#### 3. **F1-Score**
– F1-Score balances Precision and Recall into a single metric:
\[
\text{F1} = 2 \cdot \frac{\text{Precision} \cdot \text{Recall}}{\text{Precision} + \text{Recall}}
\]
– **Why it works**:
– F1-Score focuses on the performance of the positive class while penalizing models that fail to balance precision and recall.
– **Caution**:
– It still emphasizes the positive class, so it might not fully capture negative-class performance if that’s also important.
#### 4. **Confusion Matrix-Derived Metrics**
– Metrics like **Cohen’s Kappa** or **Matthews Correlation Coefficient (MCC)** consider all elements of the confusion matrix (True Positives, True Negatives, False Positives, False Negatives) and provide a more holistic view:
\[
\text{MCC} = \frac{(TP \cdot TN) – (FP \cdot FN)}{\sqrt{(TP+FP)(TP+FN)(TN+FP)(TN+FN)}}
\]
– **Why it works**:
– MCC works well for imbalanced datasets and captures the balance between all classes.
—
### **Should PR-AUC Be Used When the Positive Class Is Dominant?**
– **PR-AUC is typically better suited for scenarios where the positive class is **rare** compared to the negative class.**
– This is because PR-AUC explicitly evaluates the trade-offs of precision and recall in the context of detecting rare positives.
– **When the positive class dominates**:
– PR-AUC can still be used, but it will lose its sensitivity as a performance metric since its value may increase simply due to the prevalence of positives.
– Other metrics like F1-Score, Balanced Accuracy, or MCC may provide better insights in such cases.
—
### **Summary**
– **PR-AUC** is a strong choice for imbalanced datasets where the positive class is rare.
– **For datasets where the positive class is dominant** but still important:
– Consider using **Balanced Accuracy**, **F1-Score**, **MCC**, or **ROC-AUC** depending on your priorities:
– **F1-Score**: If precision and recall for the positive class are the focus.
– **Balanced Accuracy/MCC**: If both classes are important but the positive class is the primary target.
– **ROC-AUC**: If you need a general assessment of separability.
By carefully aligning the metric to the problem’s goals and class distribution, you can more effectively evaluate and optimize your model’s performance.
Hi James, this is an incredible summary, I highly appreciate this. Just a small clarification: “…but the positive class is the primary target.” Here you mean if I care more of the positive class?
I have one more follow up question on this :). If the 1s class out weights 0s, and I care of of 1s, and I want to evaluate the performance at all probability thresholds, do you still suggest balanced accuracy/MCC? I have never seen this calculated for all probability thresholds (there is not even an sklearn function as far as I know). Thank you very much for your incredible answers.