Classification predictive modeling problems involve predicting a class label for a given set of inputs.
It is a challenging problem in general, especially if little is known about the dataset, as there are tens, if not hundreds, of machine learning algorithms to choose from. The problem is made significantly more difficult if the distribution of examples across the classes is imbalanced. This requires the use of specialized methods to either change the dataset or change the learning algorithm to handle the skewed class distribution.
A common way to deal with the overwhelm on a new classification project is to use a favorite machine learning algorithm like Random Forest or SMOTE. Another common approach is to scour the research literature for descriptions of vaguely similar problems and attempt to re-implement the algorithms and configurations that are described.
These approaches can be effective, although they are hit-or-miss and time-consuming respectively. Instead, the shortest path to a good result on a new classification task is to systematically evaluate a suite of machine learning algorithms in order to discover what works well, then double down. This approach can also be used for imbalanced classification problems, tailored for the range of data sampling, cost-sensitive, and one-class classification algorithms that one may choose from.
In this tutorial, you will discover a systematic framework for working through an imbalanced classification dataset.
After completing this tutorial, you will know:
- The challenge of choosing an algorithm for imbalanced classification.
- A high-level framework for systematically working through an imbalanced classification project.
- Specific algorithm suggestions to try at each step of an imbalanced classification project.
Kick-start your project with my new book Imbalanced Classification with Python, including step-by-step tutorials and the Python source code files for all examples.
Let’s get started.

Step-By-Step Framework for Imbalanced Classification Projects
Photo by ~jar{}, some rights reserved.
Tutorial Overview
This tutorial is divided into three parts; they are:
- What Algorithm To Use?
- Use a Systematic Framework
- Detailed Framework for Imbalanced Classification
- Select a Metric
- Spot Check Algorithms
- Spot Check Imbalanced Algorithms
- Hyperparameter Tuning
1. What Algorithm To Use?
You’re handed or acquire an imbalanced classification dataset. Now what?
There are so many machine learning algorithms to choose from, let alone techniques specifically designed for imbalanced classification.
Which algorithms do you use? How do you choose?
This is the challenge faced at the beginning of each new imbalanced classification project. It is this challenge that makes applied machine learning both thrilling and terrifying.
There are perhaps two common ways to solve this problem:
- Use a favorite algorithm.
- Use what has worked previously.
One approach might be to select a favorite algorithm and start tuning the hyperparameters. This is a fast approach to a solution but is only effective if your favorite algorithm just happens to be the best solution for your specific dataset.
Another approach might be to review the literature and see what techniques have been used on datasets like yours. This can be effective if many people have studied and reported results on similar datasets.
In practice, this is rarely the case, and research publications are biased towards showing promise for a pet algorithm rather than presenting an honest comparison of methods. At best, literature can be used for ideas for techniques to try.
Instead, if little is known about the problem, then the shortest path to a “good” result is to systematically test a suite of different algorithms on your dataset.
Want to Get Started With Imbalance Classification?
Take my free 7-day email crash course now (with sample code).
Click to sign-up and also get a free PDF Ebook version of the course.
2. Use a Systematic Framework
Consider a balanced classification task.
You’re faced with the same challenge of selecting which algorithms to use to address your dataset.
There are many solutions to this problem, but perhaps the most robust is to systematically test a suite of algorithms and use empirical results to choose.
Biases like “my favorite algorithm” or “what has worked in the past” can feed ideas into the study, but can lead you astray if relied upon. Instead, you need to let the results from systematic empirical experiments to tell you what algorithm is good or best for your imbalanced classification dataset.
Once you have a dataset, the process involves the three steps of (1) selecting a metric by which to evaluate candidate models, (2) testing a suite of algorithms, and (3) tuning the best performing models. This may not the only approach; it is just the simplest reliable process to get you from “I have a new dataset” to “I have good results” very quickly.
This process can be summarized as follows:
- Select a Metric
- Spot Check Algorithms
- Hyperparameter Tuning
Spot-checking algorithms is a little more involved as many algorithms require specialized data preparation such as scaling, removal of outliers, and more. Also, evaluating candidate algorithms requires the careful design of a test harness, often involving the use of k-fold cross-validation to estimate the performance of a given model on unseen data.
We can use this simple process for imbalanced classification.
It is still important to spot check standard machine learning algorithms on imbalanced classification. Standard algorithms often do not perform well when the class distribution is imbalanced. Nevertheless, testing them first provides a baseline in performance by which more specialized models can be compared and must out-perform.
It is also still important to tune the hyperparameters of well-performing algorithms. This includes the hyperparameters of models specifically designed for imbalanced classification.
Therefore, we can use the same three-step procedure and insert an additional step to evaluate imbalanced classification algorithms.
We can summarize this process as follows:
- Select a Metric
- Spot Check Algorithms
- Spot Check Imbalanced Algorithms
- Hyperparameter Tuning
This provides a high-level systematic framework to work through an imbalanced classification problem.
Nevertheless, there are many imbalanced algorithms to choose from, let alone many different standard machine learning algorithms to choose from.
We require a similar low-level systematic framework for each step.
3. Detailed Framework for Imbalanced Classification
We can develop a similar low-level framework to systematically work through each step of an imbalanced classification project.
From selecting a metric to hyperparameter tuning.
3.1. Select a Metric
Selecting a metric might be the most important step in the project.
The metric is the measuring stick by which all models are evaluated and compared. The choice of the wrong metric can mean choosing the wrong algorithm. That is, a model that solves a different problem from the problem you actually want solved.
The metric must capture those details about a model or its predictions that are most important to the project or project stakeholders.
This is hard, as there are many metrics to choose from and often project stakeholders are not sure what they want. There may also be multiple ways to frame the problem, and it may be beneficial to explore a few different framings and, in turn, different metrics to see what makes sense to stakeholders.
First, you must decide whether you want to predict probabilities or crisp class labels. Recall that for binary imbalanced classification tasks, the majority class is normal, called the “negative class“, and the minority class is the exception, called the “positive class“.
Probabilities capture the uncertainty of the prediction, whereas crisp class labels can be used immediately.
- Probabilities: Predict the probability of class membership for each example.
- Class Labels: Predict a crisp class label for each example.
3.1.1. Predict Probabilities
If probabilities are intended to be used directly, then a good metric might be the Brier Score and the Brier Skill score.
Alternately, you may want to predict probabilities and allow the user to map them to crisp class labels themselves via a user-selected threshold. In this case, a measure can be chosen that summarizes the performance of the model across the range of possible thresholds.
If the positive class is the most important, then the precision-recall curve and area under curve (PR AUC) can be used. This will optimize both precision and recall across all thresholds.
Alternately, if both classes are equally important, the ROC Curve and area under curve (ROC AUC) can be used. This will maximize the true positive rate and minimize the false positive rate.
3.1.2. Predict Class Labels
If class labels are required and both classes are equally important, a good default metric is classification accuracy. This only makes sense if the majority class is less than about 80 percent off the data. A majority class that has a greater than 80 percent or 90 percent skew will swamp the accuracy metric and it will lose its meaning for comparing algorithms.
If the class distribution is severely skewed, then the G-mean metric can be used that will optimize the sensitivity and specificity metrics.
If the positive class is more important, then variations of the F-Measure can be used that optimize the precision and recall. If both false positive and false negatives are equally important, then F1 can be used. If false negatives are more costly, then the F2-Measure can be used, otherwise, if false positives are more costly, then the F0.5-Measure can be used.
3.1.3. Framework for Choosing a Metric
These are just heuristics but provide a useful starting point if you feel lost choosing a metric for your imbalanced classification task.
We can summarize these heuristics into a framework as follows:
- Are you predicting probabilities?
- Do you need class labels?
- Is the positive class more important?
- Use Precision-Recall AUC
- Are both classes important?
- Use ROC AUC
- Is the positive class more important?
- Do you need probabilities?
- Use Brier Score and Brier Skill Score
- Do you need class labels?
- Are you predicting class labels?
- Is the positive class more important?
- Are False Negatives and False Positives Equally Costly?
- Use F1-Measure
- Are False Negatives More Costly?
- Use F2-Measure
- Are False Positives More Costly?
- Use F0.5-Measure
- Are False Negatives and False Positives Equally Costly?
- Are both classes important?
- Do you have < 80%-90% Examples for the Majority Class?
- Use Accuracy
- Do you have > 80%-90% Examples for the Majority Class?
- Use G-Mean
- Do you have < 80%-90% Examples for the Majority Class?
- Is the positive class more important?
We can also transform these decisions into a decision tree, as follows.
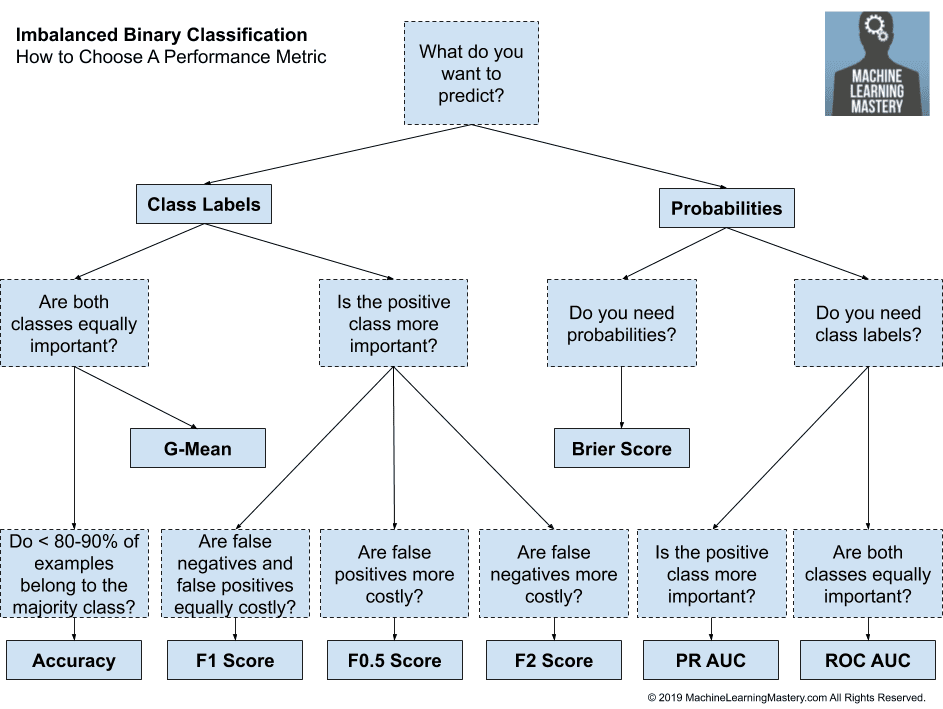
How to Choose a Metric for Imbalanced Classification
Once a metric has been chosen, you can start evaluating machine learning algorithms.
3.2. Spot Check Algorithms
Spot checking machine learning algorithms means evaluating a suite of different types of algorithms with minimal hyperparameter tuning.
Specifically, it means giving each algorithm a good chance to learn about the problem, including performing any required data preparation expected by the algorithm and using best-practice configuration options or defaults.
The objective is to quickly test a range of standard machine learning algorithms and provide a baseline in performance to which techniques specialized for imbalanced classification must be compared and outperform in order to be considered skillful. The idea here is that there is little point in using fancy imbalanced algorithms if they cannot out-perform so-called unbalanced algorithms.
A robust test harness must be defined. This often involves k-fold cross-validation, often with k-10 as a sensible default. Stratified cross-validation is often required to ensure that each fold has the same class distribution as the original dataset. And the cross-validation procedure is often repeated multiple times, such as 3, 10, or 30 in order to effectively capture a sample of model performance on the dataset, summarized with a mean and standard deviation of the scores.
There are perhaps four levels of algorithms to spot check; they are:
- Naive Algorithms
- Linear Algorithms
- Nonlinear Algorithms
- Ensemble Algorithms
3.2.1. Naive Algorithms
Firstly, a naive classification must be evaluated.
This provides a rock-bottom baseline in performance that any algorithm must overcome in order to have skill on the dataset.
Naive means that the algorithm has no logic other than an if-statement or predicting a constant value. The choice of naive algorithm is based on the choice of performance metric.
For example, a suitable naive algorithm for classification accuracy is to predict the majority class in all cases. A suitable naive algorithm for the Brier Score when evaluating probabilities is to predict the prior probability of each class in the training dataset.
A suggested mapping of performance metrics to naive algorithms is as follows:
- Accuracy: Predict the majority class (class 0).
- G-Mean: Predict a uniformly random class.
- F-Measure: Predict the minority class (class 1).
- ROC AUC: Predict a stratified random class.
- PR ROC: Predict a stratified random class.
- Brier Score: Predict majority class prior.
If you are unsure of the “best” naive algorithm for your metric, perhaps test a few and discover which results in the better performance that you can use as your rock-bottom baseline.
Some options include:
- Predict the majority class in all cases.
- Predict the minority class in all cases.
- Predict a uniform randomly selected class.
- Predict a randomly selected class selected with the prior probabilities of each class.
- Predict the class prior probabilities.
3.2.2. Linear Algorithms
Linear algorithms are those that are often drawn from the field of statistics and make strong assumptions about the functional form of the problem.
We can refer to them as linear because the output is a linear combination of the inputs, or weighted inputs, although this definition is stretched. You might also refer to these algorithms as probabilistic algorithms as they are often fit under a probabilistic framework.
They are often fast to train and often perform very well. Examples of linear algorithms you should consider trying include:
- Logistic Regression
- Linear Discriminant Analysis
- Naive Bayes
3.2.3. Nonlinear Algorithms
Nonlinear algorithms are drawn from the field of machine learning and make few assumptions about the functional form of the problem.
We can refer to them as nonlinear because the output is often a nonlinear mapping of inputs to outputs.
They often require more data than linear algorithms and are slower to train. Examples of nonlinear algorithms you should consider trying include:
- Decision Tree
- k-Nearest Neighbors
- Artificial Neural Networks
- Support Vector Machine
3.2.4. Ensemble Algorithms
Ensemble algorithms are also drawn from the field of machine learning and combine the predictions from two or more models.
There are many ensemble algorithms to choose from, but when spot-checking algorithms, it is a good idea to focus on ensembles of decision tree algorithms, given that they are known to perform so well in practice on a wide range of problems.
Examples of ensembles of decision tree algorithms you should consider trying include:
- Bagged Decision Trees
- Random Forest
- Extra Trees
- Stochastic Gradient Boosting
3.2.5. Framework for Spot-Checking Machine Learning Algorithms
We can summarize these suggestions into a framework for testing machine learning algorithms on a dataset.
- Naive Algorithms
- Majority Class
- Minority Class
- Class Priors
- Linear Algorithms
- Logistic Regression
- Linear Discriminant Analysis
- Naive Bayes
- Nonlinear Algorithms
- Decision Tree
- k-Nearest Neighbors
- Artificial Neural Networks
- Support Vector Machine
- Ensemble Algorithms
- Bagged Decision Trees
- Random Forest
- Extra Trees
- Stochastic Gradient Boosting
The order of the steps is probably not flexible. Think of the order of algorithms as increasing in complexity, and in turn, capability.
The order of algorithms within each step is flexible and the list of algorithms is not complete, and probably never could be given the vast number of algorithms available. Limiting the algorithms tested to a subset of the most common or most widely used is a good start. Using data-preparation recommendations and hyperparameter defaults is also a good start.
The figure below summarizes this step of the framework.
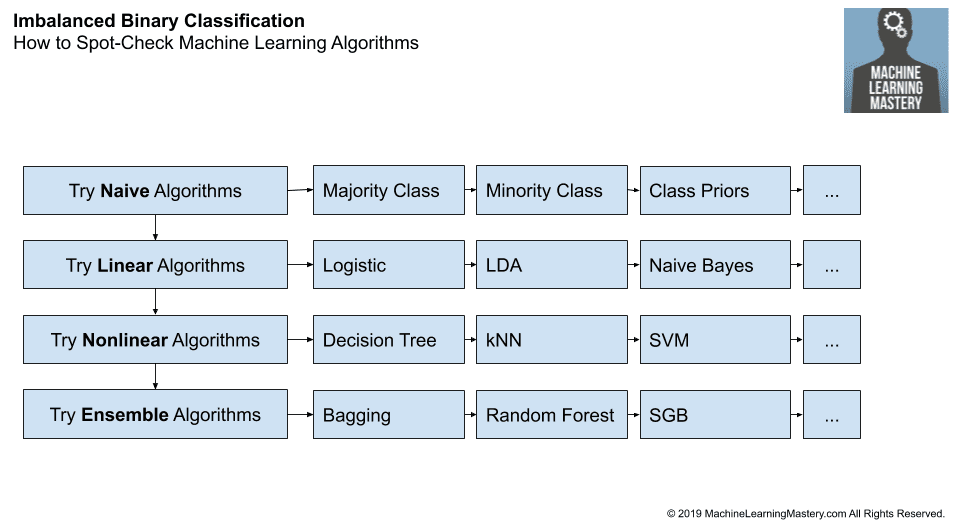
How to Spot-Check Machine Learning Algorithms
3.3. Spot Check Imbalanced Algorithms
Spot-checking imbalanced algorithms is much like spot-checking machine learning algorithms.
The objective is to quickly test a large number of techniques in order to discover what shows promise so that you can focus more attention on it later during hyperparameter tuning.
The spot-checking performed in the previous section provides both naive and modestly skillful models by which all imbalanced techniques can be compared. This allows you to focus on these methods that truly show promise on the problem, rather than getting excited about results that only appear effective compared only to other imbalanced classification techniques (which is an easy trap to fall into).
There are perhaps four types of imbalanced classification techniques to spot check:
- Data Sampling Algorithms
- Cost-Sensitive Algorithms
- One-Class Algorithms
- Probability Tuning Algorithms
3.3.1. Data Sampling Algorithms
Data sampling algorithms change the composition of the training dataset to improve the performance of a standard machine learning algorithm on an imbalanced classification problem.
There are perhaps three main types of data sampling techniques; they are:
- Data Oversamplinug.
- Data Undersampling.
- Combined Oversampling and Undersampling.
Data oversampling involves duplicating examples of the minority class or synthesizing new examples from the minority class from existing examples. Perhaps the most popular methods is SMOTE and variations such as Borderline SMOTE. Perhaps the most important hyperparameter to tune is the amount of oversampling to perform.
Examples of data oversampling methods include:
- Random Oversampling
- SMOTE
- Borderline SMOTE
- SVM SMote
- k-Means SMOTE
- ADASYN
Undersampling involves deleting examples from the majority class, such as randomly or using an algorithm to carefully choose which examples to delete. Popular editing algorithms include the edited nearest neighbors and Tomek links.
Examples of data undersampling methods include:
- Random Undersampling
- Condensed Nearest Neighbor
- Tomek Links
- Edited Nearest Neighbors
- Neighborhood Cleaning Rule
- One-Sided Selection
Almost any oversampling method can be combined with almost any undersampling technique. Therefore, it may be beneficial to test a suite of different combinations of oversampling and undersampling techniques.
Examples of popular combinations of over and undersampling include:
- SMOTE and Random Undersampling
- SMOTE and Tomek Links
- SMOTE and Edited Nearest Neighbors
Data sampling algorithms may perform differently depending on the choice of machine learning algorithm.
As such, it may be beneficial to test a suite of standard machine learning algorithms, such as all or a subset of those algorithms used when spot checking in the previous section.
Additionally, most data sampling algorithms make use of the k-nearest neighbor algorithm internally. This algorithm is very sensitive to the data types and scale of input variables. As such, it may be important to at least normalize input variables that have differing scales prior to testing the methods, and perhaps using specialized methods if some input variables are categorical instead of numerical.
3.3.2. Cost-Sensitive Algorithms
Cost-sensitive algorithms are modified versions of machine learning algorithms designed to take the differing costs of misclassification into account when fitting the model on the training dataset.
These algorithms can be effective when used on imbalanced classification, where the cost of misclassification is configured to be inversely proportional to the distribution of examples in the training dataset.
There are many cost-sensitive algorithms to choose from, although it might be practical to test a range of cost-sensitive versions of linear, nonlinear, and ensemble algorithms.
Some examples of machine learning algorithms that can be configured using cost-sensitive training include:
- Logistic Regression
- Decision Trees
- Support Vector Machines
- Artificial Neural Networks
- Bagged Decision Trees
- Random Forest
- Stochastic Gradient Boosting
3.3.3. One-Class Algorithms
Algorithms used for outlier detection and anomaly detection can be used for classification tasks.
Although unusual, when used in this way, they are often referred to as one-class classification algorithms.
In some cases, one-class classification algorithms can be very effective, such as when there is a severe class imbalance with very few examples of the positive class.
Examples of one-class classification algorithms to try include:
- One-Class Support Vector Machines
- Isolation Forests
- Minimum Covariance Determinant
- Local Outlier Factor
3.3.4. Probability Tuning Algorithms
Predicted probabilities can be improved in two ways; they are:
- Calibrating Probabilities.
- Tuning the Classification Threshold.
Calibrating Probabilities
Some algorithms are fit using a probabilistic framework and, in turn, have calibrated probabilities.
This means that when 100 examples are predicted to have the positive class label with a probability of 80 percent, then the algorithm will predict the correct class label 80 percent of the time.
Calibrated probabilities are required from a model to be considered skillful on a binary classification task when probabilities are either required as the output or used to evaluate the model (e.g. ROC AUC or PR AUC).
Some examples of machine learning algorithms that predict calibrated probabilities are as follows:
- Logistic Regression
- Linear Discriminant Analysis
- Naive Bayes
- Artificial Neural Networks
Most nonlinear algorithms do not predict calibrated probabilities, therefore algorithms can be used to post-process the predicted probabilities in order to calibrate them.
Therefore, when probabilities are required directly or are used to evaluate a model, and nonlinear algorithms are being used, it is important to calibrate the predicted probabilities.
Some examples of probability calibration algorithms to try include:
- Platt Scaling
- Isotonic Regression
Tuning the Classification Threshold
Some algorithms are designed to naively predict probabilities that later must be mapped to crisp class labels.
This is the case if class labels are required as output for the problem, or the model is evaluated using class labels.
Examples of probabilistic machine learning algorithms that predict a probability by default include:
- Logistic Regression
- Linear Discriminant Analysis
- Naive Bayes
- Artificial Neural Networks
Probabilities are mapped to class labels using a threshold probability value. All probabilities below the threshold are mapped to class 0, and all probabilities equal-to or above the threshold are mapped to class 1.
The default threshold is 0.5, although different thresholds can be used that will dramatically impact the class labels and, in turn, the performance of a machine learning model that natively predicts probabilities.
As such, if probabilistic algorithms are used that natively predict a probability and class labels are required as output or used to evaluate models, it is a good idea to try tuning the classification threshold.
3.3.5. Framework for Spot-Checking Imbalanced Algorithms
We can summarize these suggestions into a framework for testing imbalanced machine learning algorithms on a dataset.
- Data Sampling Algorithms
- Data Oversampling
- Random Oversampling
- SMOTE
- Borderline SMOTE
- SVM SMote
- k-Means SMOTE
- ADASYN
- Data Undersampling
- Random Undersampling
- Condensed Nearest Neighbor
- Tomek Links
- Edited Nearest Neighbors
- Neighborhood Cleaning Rule
- One Sided Selection
- Combined Oversampling and Undersampling
- SMOTE and Random Undersampling
- SMOTE and Tomek Links
- SMOTE and Edited Nearest Neighbors
- Data Oversampling
- Cost-Sensitive Algorithms
- Logistic Regression
- Decision Trees
- Support Vector Machines
- Artificial Neural Networks
- Bagged Decision Trees
- Random Forest
- Stochastic Gradient Boosting
- One-Class Algorithms
- One-Class Support Vector Machines
- Isolation Forests
- Minimum Covariance Determinant
- Local Outlier Factor
- Probability Tuning Algorithms
- Calibrating Probabilities
- Platt Scaling
- Isotonic Regression
- Tuning the Classification Threshold
- Calibrating Probabilities
The order of the steps is flexible, and the order of algorithms within each step is also flexible, and the list of algorithms is not complete.
The structure is designed to get you thinking systematically about what algorithm to evaluate.
The figure below summarizes the framework.
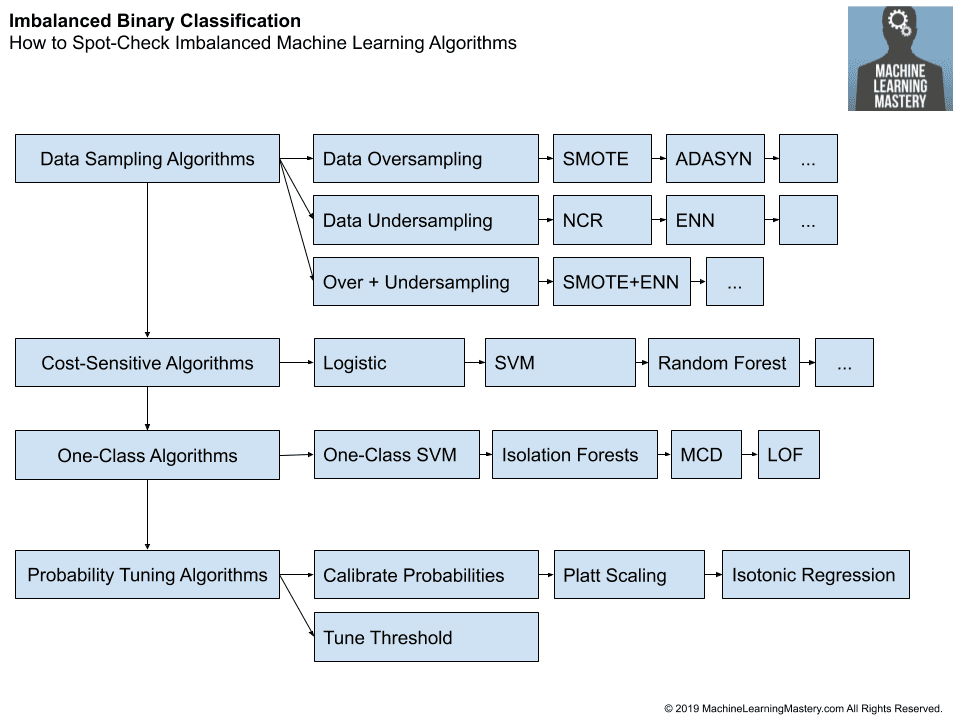
How to Spot-Check Imbalanced Machine Learning Algorithms
3.4. Hyperparameter Tuning
After spot-checking machine learning algorithms and imbalanced algorithms, you will have some idea of what works and what does not on your specific dataset.
The simplest approach to hyperparameter tuning is to select the top five or 10 algorithms or algorithm combinations that performed well and tune the hyperparameters for each.
There are three popular hyperparameter tuning algorithms that you may choose from:
- Random Search
- Grid Search
- Bayesian Optimization
A good default is grid search if you know what hyperparameter values to try, otherwise, random search should be used. Bayesian optimization should be used if possible but can be more challenging to set up and run.
Tuning the best performing methods is a good start, but not the only approach.
There may be some standard machine learning algorithms that perform well, but do not perform as well when used with data sampling or probability calibration. These algorithms could be tuned in concert with their imbalanced-classification augmentations to see if better performance can be achieved.
Additionally, there may be imbalanced-classification algorithms, such as a data sampling method that results in a dramatic lift in performance for one or more algorithms. These algorithms themselves may provide an interesting basis for further tuning to see if additional lifts in performance can be achieved.
Further Reading
This section provides more resources on the topic if you are looking to go deeper.
Tutorials
- Applied Machine Learning Process
- How to Use a Machine Learning Checklist to Get Accurate Predictions, Reliably
Books
- Learning from Imbalanced Data Sets, 2018.
- Imbalanced Learning: Foundations, Algorithms, and Applications, 2013.
Summary
In this tutorial, you discovered a systematic framework for working through an imbalanced classification dataset.
Specifically, you learned:
- The challenge of choosing an algorithm for imbalanced classification.
- A high-level framework for systematically working through an imbalanced classification project.
- Specific algorithm suggestions to try at each step of an imbalanced classification project.
Do you have any questions?
Ask your questions in the comments below and I will do my best to answer.
Get a Handle on Imbalanced Classification!
Develop Imbalanced Learning Models in Minutes
...with just a few lines of python code
Discover how in my new Ebook:
Imbalanced Classification with Python
It provides self-study tutorials and end-to-end projects on:
Performance Metrics, Undersampling Methods, SMOTE, Threshold Moving, Probability Calibration, Cost-Sensitive Algorithms
and much more...


OMG. It was really amazing. Thanks Jason
Thanks, I’m happy it helps.
Jason you are doing tremendous Job. Really Appreciate your Efforts
Thanks.
Hi Jason.
Nice work! I finally found a good post about how to choose proper method for imbalanced data set. My question is about regularization and detect/avoiding overfitting in terms of your today’s post.
What are good practices to apply regularization for imbalanced data sets? I ask in terms of images classification. I just guess it would rather be a data set augmentation to generate more similar images. To make the dataset more “balanced” rather than focusing on tuning regularization parameters like L2 or dropout reatio. Is it a good approach?
Pawel
I don’t follow your question, sorry. You use regularization on a model, not on a dataset.
“This only makes sense if the majority class is less than about 80 percent off the data”
haha that is all I was looking for.
Great!
Hi Jason,
I am dealing with a multi-class( 5 classes) imbalanced dataset with metrics as F1 score averaged, and applying xgboost model with random search, but I am not getting a good score, best I’ve achieved is 52.5. I even tried Deep Neural Network with dropouts and Smote but still no success. I tried other models Text classification like Random Forest, Gradient Boosting, Logistic Regression One vs rest, Catboost but still I am not able to achieve higher
score. Can you please suggest what else I can try.
The above framework is my best advice as a first step.
After that, more general suggestions here:
https://machinelearningmastery.com/machine-learning-performance-improvement-cheat-sheet/
great work! very very helpful. thank you .
Thanks, I’m happy it helps.
Hi Jason. I have a multi-class classification problem where the number of classes is around 75. I am using neural network for the classification, but the maximum probability I’m getting after the softmax activation function at the last layer is less than 0.5. Is it fine to predict a class having the maximum probability, even if it’s probability is lower than 0.5?
I would recommend choosing a performance metric to evaluate the model and use that to judge whether the probabilities are appropriate for prediction.
This might help:
https://machinelearningmastery.com/tour-of-evaluation-metrics-for-imbalanced-classification/
If you’re using a neural network and you want to reason about the outputs as probabilities for which you may apply a threshold, then don’t use softmax. Instead output a sigmoid for each class. Then thresholding can be straightforward.
Dear Jason,
thank you very much for your awesome work. If I could give a bit of advice then it would be not to repeat yourself in the article. The shorter the article the better.
Thanks for the advice.
I don’t think repeating oneself is bad. It is friendly for readers and it is a unique feature of your nice tutorials.
There are two kinds of repeating.
First, from the perspective of a suite of tutorials, repeating the dataset setting (ie. your frequent example of binary-class dataset generation) or repeating some necessary basic knowledge can give us a better reading experience without bothering ourselves to hop around different tutorials. This adds independence between different tutorials. That is great!
Second, from the perspective of a single tutorial, repeating the code snippets gives readers a better experience about which function they perform respectively and how to combine them together. That is also very fit for most people’s cognitive process. Nice!
So I think you can really stick to this kind of writing style. Great job!
I agree, thanks!
I like each tutorial to be complete and standalone, repetition is required to achieve this goal.
Thanks jason
It would you kind if give us tutorial about Brier Score
Here is a tutorial on brier score:
https://machinelearningmastery.com/probability-metrics-for-imbalanced-classification/
“Three may also be multiple ways to frame the problem”
Caught a typo~
Thanks, fixed.
Hi! Great article! It’s interesting and insightful. We’ve learned a lot. Thank you for your work and for spreading knowledge about Machine Learning. Just wanted to let you know, that we included this piece in our Weekly Roundup on the Neptune.ai blog. Cheers!
Thanks.
This is the best resource I have seen ever. Very insightful and structured. Your perspectives are inspiring.
Thanks!
Thanks Jason for the framework, it’s of great value.
I am not sure to clearly understand majority/positive concepts.
I have a case where I have to predict default products based on a dozen of measures.
Two classes : Passed / Failed. Failed are 1/100 of Passed (very unbalanced).
=> Majority class is the Passed, minority Class is Failed. Correct?
=> positive class is Failed (the event I want to predict). Correct?
Also what do you mean by “the positive class is more important” ?
Positive class is the minority class.
Thanks.
You’re welcome.
Pip command not working in command prompt
Nameerror: pip is not defined
sir please provide soln
Perhaps you need to install pip.
This tutorial will help you setup your development environment:
https://machinelearningmastery.com/setup-python-environment-machine-learning-deep-learning-anaconda/
Hi,
What does it mean, that both classes are equally important but false positive or false negative are more costly ?? Also, why do you recommend using accuracy for data sets with such big imbalance (80-90%). Please explain.
Matt
Good question, see this tutorial:
https://machinelearningmastery.com/tour-of-evaluation-metrics-for-imbalanced-classification/
Hi Jason
Thanks for your Great work! It’s very helpful
You said ‘Additionally, most data sampling algorithms make use of the k-nearest neighbor algorithm internally. This algorithm is very sensitive to the data types and scale of input variables. As such, it may be important to at least normalize input variables that have different scales prior to testing the methods, and perhaps using specialized methods if some input variables are categorical instead of numerical.’
What do you mean by the specialized methods if input variables are categorical?? and why?
Thanks in advance
You’re welcome.
Good question. For example, SMOTE assumes numerical inputs only. You would have to use the modified version of smote that supports categorical or mixed inputs.
I was looking for some discussion about Macro-F1 VS Micro-F1 regarding the suitability of imbalanced datasets.
Thanks for the suggestion.
That is great Jason
Thanks!
Thank you Jason. Do you consult with organisations to help build ML models ?
You’re welcome!
Thanks for asking, this is a common question that I answer here:
https://machinelearningmastery.com/faq/single-faq/can-you-do-some-consulting
Hi Jason, great post.
I have one question: In section 3.1, you have mentioned that first we must decide whether we want to predict probabilities or crisp class labels. I get the scenarios where we would want to predict probabilities like credit card fraud detection. etc.
1. Can you share a case (example or scenario) when we would want to predict crisp class labels?
2. When would we like to predict crisp class labels especially keeping in mind that we have predict_proba method available with sklearn models which allows us to better control what label is assigned to test data point? I am looking forward to the response.
Predicting probabilities vs crisp labels is a requirement of the project/problem, that is how we must or intend to use the output of the model. Or a matter of taste.
Hey Jason, Great article!
Can you please give some insights to when we use resampling methods, our algorithms see and train on the non-real distribution of the data.
Now, when the real data comes which consists of the imbalance, wont the model perform poorly on that data?
How do we tackle this problem?
No, we use k-fold cross-validation to estimate the performance of the model on new data.
Perhaps see this:
https://machinelearningmastery.com/data-preparation-without-data-leakage/
Just wanted to say thank you! Great work.
Thank you for your support! You’re very welcome.
I have an imbalanced data set with about 2% positive and 98% negative cases. When I use a standard Logistic Regression (log = LogisticRegression()) and then take the mean of all log.predict_proba() I will end up with around 2%, which seems reasonable. Unfortunately the f1 scores are extremely low, so I tried a few methods to correct for my imbalanced data set.
However, if I use SMOTE or a balanced Logistic Regression (log = LogisticRegression(solver=’newton-cg’, class_weight=’balanced) then the f1 scores are much better. However,the mean of log.predict_proba() will be around 45%, which is way too high (as I know the mean probability of a positive case should be around 2%).
How does one get realistic estimates of the probability of a positive case from log.predict_proba() when one corrects from an imbalanced data set?
Thanks.
Perhaps calibrate the model:
https://machinelearningmastery.com/probability-calibration-for-imbalanced-classification/
Hey Jason, excellent post!! Could you please help me understand the concept of “a stratified random class” in 3.2.1 for the PR AUC metric.
I don’t know how to do it in practice.
Thank u very much!!
Thanks.
Yes, see this:
https://machinelearningmastery.com/naive-classifiers-imbalanced-classification-metrics/
Hi Jason,
Thanks for this interesting tutorial. It was extremly helpful!!
II tried different models on my imbalanced data and every time I get an AUCROC score of about 0,5 and i’d like to know how could i improve the score to reach a score of 0,8.
Thanks.
Perhaps some of these suggestions will help:
https://machinelearningmastery.com/machine-learning-performance-improvement-cheat-sheet/
Hello Jason,
Thanks for this excellent post.
I just want to ask that, in the “How to choose performance metrics” table, what is the meaning of ” False positives are more costly” or “False negatives are more costly” ?
You’re welcome.
Good question, this tutorial will elaborate:
https://machinelearningmastery.com/tour-of-evaluation-metrics-for-imbalanced-classification/
Hi Dr. Brownlee,
I am following your tutorials for a while and have learned a lot.
As I understand, we only apply resampling method to the training data and leave the validation data as is.
So, how can we involve resampling method into hyperparameter optimization? Because none of gridsearch, random or bayesian has parameter for resampling methods.
I tried to ask my question in the most clear way I can, sorry for any confusion.
Thank you.
Thanks!
You can take the validation set from the training dataset regardless of whether you’re using train/test split or k-fold cv.
This may also help:
https://machinelearningmastery.com/difference-test-validation-datasets/
This is a useful topic regarding imbalanced data sets.
Thanks for your answer. I have the same issue like Ali said. As far as I figured out, we split the training set (balanced by a sampling technique) into two parts for training and validation. Then, we employ a validation subset for tuning hyperparameters into the Grid Search (or Random Search, etc.). Next, we use the training set to train the model with tuned hyperparameters.
Is this alright?
Thanks for your reply in advance.
That can be one approach, if you have enough data.
Hi Jason,
I have an imbalanced dataset (ratio 1/10). I tried many combinations of sampling techniques, however, I’m still getting an AUC score of 77 or 78. Originally the AUC score was in the fifties.
So could you please advise what i might be doing wrong? My data is a mix of numerical and categorical variables, so i performed standard scaling for numerical and one-hot encoding for categorical.
Thanks
Perhaps some of these tips will help:
https://machinelearningmastery.com/machine-learning-performance-improvement-cheat-sheet/
Such invaluable information..
Thanks!
I found it useful for my current project. I am a beginner at machine learning. I need your expert assistance; if possible, I want to speak to you. Let me brief you on my case; I have highly imbalanced data (with a 7.5% prevalence of event of interest for a binary classification problem), for which I applied under-sampling, oversampling, and SMOTE imbalance handling techniques. The best (performance was assessed by sensitivity) handling was then used to train the specified machine learning algorithms. I used logistic regression, DT, KNN, SVM, and RF. Finally, I found that SMOTE and logistic regression were the best imbalance handling and machine learning algorithms, respectively. I need to have strong ground for selecting those classification algorithms. Even I used them based on some reference on their appropriateness for an imbalanced data set. Based on your note, I want to justify my preference concerning cost-sensitive algorithms. What is your advice regarding my imbalance handling and classification algorithm choices?
Hi Getahun…The following resource provides a step-by-step framework that may help with algorithm selection and implementation:
https://machinelearningmastery.com/framework-for-imbalanced-classification-projects/