
In this tutorial you are going to learn about the k-Nearest Neighbors algorithm including how it works and how to implement it from scratch in Python (without libraries).
A simple but powerful approach for making predictions is to use the most similar historical examples to the new data. This is the principle behind the k-Nearest Neighbors algorithm.
After completing this tutorial you will know:
- How to code the k-Nearest Neighbors algorithm step-by-step.
- How to evaluate k-Nearest Neighbors on a real dataset.
- How to use k-Nearest Neighbors to make a prediction for new data.
Kick-start your project with my new book Machine Learning Algorithms From Scratch, including step-by-step tutorials and the Python source code files for all examples.
Let’s get started.
- Updated Sep/2014: Original version of the tutorial.
- Updated Oct/2019: Complete rewritten from the ground up.
Develop k-Nearest Neighbors in Python From Scratch
Image taken from Wikipedia, some rights reserved.
Tutorial Overview
This section will provide a brief background on the k-Nearest Neighbors algorithm that we will implement in this tutorial and the Abalone dataset to which we will apply it.
k-Nearest Neighbors
The k-Nearest Neighbors algorithm or KNN for short is a very simple technique.
The entire training dataset is stored. When a prediction is required, the k-most similar records to a new record from the training dataset are then located. From these neighbors, a summarized prediction is made.
Similarity between records can be measured many different ways. A problem or data-specific method can be used. Generally, with tabular data, a good starting point is the Euclidean distance.
Once the neighbors are discovered, the summary prediction can be made by returning the most common outcome or taking the average. As such, KNN can be used for classification or regression problems.
There is no model to speak of other than holding the entire training dataset. Because no work is done until a prediction is required, KNN is often referred to as a lazy learning method.
Iris Flower Species Dataset
In this tutorial we will use the Iris Flower Species Dataset.
The Iris Flower Dataset involves predicting the flower species given measurements of iris flowers.
It is a multiclass classification problem. The number of observations for each class is balanced. There are 150 observations with 4 input variables and 1 output variable. The variable names are as follows:
- Sepal length in cm.
- Sepal width in cm.
- Petal length in cm.
- Petal width in cm.
- Class
A sample of the first 5 rows is listed below.
|
1 2 3 4 5 6 |
5.1,3.5,1.4,0.2,Iris-setosa 4.9,3.0,1.4,0.2,Iris-setosa 4.7,3.2,1.3,0.2,Iris-setosa 4.6,3.1,1.5,0.2,Iris-setosa 5.0,3.6,1.4,0.2,Iris-setosa ... |
The baseline performance on the problem is approximately 33%.
Download the dataset and save it into your current working directory with the filename “iris.csv“.
k-Nearest Neighbors (in 3 easy steps)
First we will develop each piece of the algorithm in this section, then we will tie all of the elements together into a working implementation applied to a real dataset in the next section.
This k-Nearest Neighbors tutorial is broken down into 3 parts:
- Step 1: Calculate Euclidean Distance.
- Step 2: Get Nearest Neighbors.
- Step 3: Make Predictions.
These steps will teach you the fundamentals of implementing and applying the k-Nearest Neighbors algorithm for classification and regression predictive modeling problems.
Note: This tutorial assumes that you are using Python 3. If you need help installing Python, see this tutorial:
I believe the code in this tutorial will also work with Python 2.7 without any changes.
Step 1: Calculate Euclidean Distance
The first step is to calculate the distance between two rows in a dataset.
Rows of data are mostly made up of numbers and an easy way to calculate the distance between two rows or vectors of numbers is to draw a straight line. This makes sense in 2D or 3D and scales nicely to higher dimensions.
We can calculate the straight line distance between two vectors using the Euclidean distance measure. It is calculated as the square root of the sum of the squared differences between the two vectors.
- Euclidean Distance = sqrt(sum i to N (x1_i – x2_i)^2)
Where x1 is the first row of data, x2 is the second row of data and i is the index to a specific column as we sum across all columns.
With Euclidean distance, the smaller the value, the more similar two records will be. A value of 0 means that there is no difference between two records.
Below is a function named euclidean_distance() that implements this in Python.
|
1 2 3 4 5 6 |
# calculate the Euclidean distance between two vectors def euclidean_distance(row1, row2): distance = 0.0 for i in range(len(row1)-1): distance += (row1[i] - row2[i])**2 return sqrt(distance) |
You can see that the function assumes that the last column in each row is an output value which is ignored from the distance calculation.
We can test this distance function with a small contrived classification dataset. We will use this dataset a few times as we construct the elements needed for the KNN algorithm.
|
1 2 3 4 5 6 7 8 9 10 11 |
X1 X2 Y 2.7810836 2.550537003 0 1.465489372 2.362125076 0 3.396561688 4.400293529 0 1.38807019 1.850220317 0 3.06407232 3.005305973 0 7.627531214 2.759262235 1 5.332441248 2.088626775 1 6.922596716 1.77106367 1 8.675418651 -0.242068655 1 7.673756466 3.508563011 1 |
Below is a plot of the dataset using different colors to show the different classes for each point.
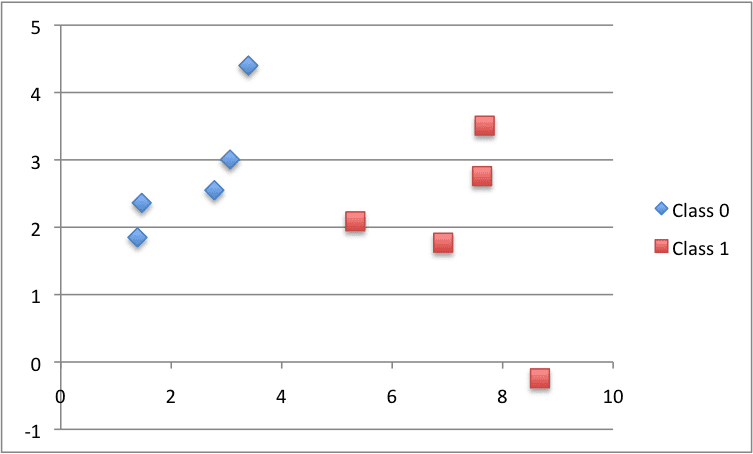
Scatter Plot of the Small Contrived Dataset for Testing the KNN Algorithm
Putting this all together, we can write a small example to test our distance function by printing the distance between the first row and all other rows. We would expect the distance between the first row and itself to be 0, a good thing to look out for.
The full example is listed below.
|
1 2 3 4 5 6 7 8 9 10 11 12 13 14 15 16 17 18 19 20 21 22 23 24 25 |
# Example of calculating Euclidean distance from math import sqrt # calculate the Euclidean distance between two vectors def euclidean_distance(row1, row2): distance = 0.0 for i in range(len(row1)-1): distance += (row1[i] - row2[i])**2 return sqrt(distance) # Test distance function dataset = [[2.7810836,2.550537003,0], [1.465489372,2.362125076,0], [3.396561688,4.400293529,0], [1.38807019,1.850220317,0], [3.06407232,3.005305973,0], [7.627531214,2.759262235,1], [5.332441248,2.088626775,1], [6.922596716,1.77106367,1], [8.675418651,-0.242068655,1], [7.673756466,3.508563011,1]] row0 = dataset[0] for row in dataset: distance = euclidean_distance(row0, row) print(distance) |
Running this example prints the distances between the first row and every row in the dataset, including itself.
|
1 2 3 4 5 6 7 8 9 10 |
0.0 1.3290173915275787 1.9494646655653247 1.5591439385540549 0.5356280721938492 4.850940186986411 2.592833759950511 4.214227042632867 6.522409988228337 4.985585382449795 |
Now it is time to use the distance calculation to locate neighbors within a dataset.
Step 2: Get Nearest Neighbors
Neighbors for a new piece of data in the dataset are the k closest instances, as defined by our distance measure.
To locate the neighbors for a new piece of data within a dataset we must first calculate the distance between each record in the dataset to the new piece of data. We can do this using our distance function prepared above.
Once distances are calculated, we must sort all of the records in the training dataset by their distance to the new data. We can then select the top k to return as the most similar neighbors.
We can do this by keeping track of the distance for each record in the dataset as a tuple, sort the list of tuples by the distance (in descending order) and then retrieve the neighbors.
Below is a function named get_neighbors() that implements this.
|
1 2 3 4 5 6 7 8 9 10 11 |
# Locate the most similar neighbors def get_neighbors(train, test_row, num_neighbors): distances = list() for train_row in train: dist = euclidean_distance(test_row, train_row) distances.append((train_row, dist)) distances.sort(key=lambda tup: tup[1]) neighbors = list() for i in range(num_neighbors): neighbors.append(distances[i][0]) return neighbors |
You can see that the euclidean_distance() function developed in the previous step is used to calculate the distance between each train_row and the new test_row.
The list of train_row and distance tuples is sorted where a custom key is used ensuring that the second item in the tuple (tup[1]) is used in the sorting operation.
Finally, a list of the num_neighbors most similar neighbors to test_row is returned.
We can test this function with the small contrived dataset prepared in the previous section.
The complete example is listed below.
|
1 2 3 4 5 6 7 8 9 10 11 12 13 14 15 16 17 18 19 20 21 22 23 24 25 26 27 28 29 30 31 32 33 34 35 36 |
# Example of getting neighbors for an instance from math import sqrt # calculate the Euclidean distance between two vectors def euclidean_distance(row1, row2): distance = 0.0 for i in range(len(row1)-1): distance += (row1[i] - row2[i])**2 return sqrt(distance) # Locate the most similar neighbors def get_neighbors(train, test_row, num_neighbors): distances = list() for train_row in train: dist = euclidean_distance(test_row, train_row) distances.append((train_row, dist)) distances.sort(key=lambda tup: tup[1]) neighbors = list() for i in range(num_neighbors): neighbors.append(distances[i][0]) return neighbors # Test distance function dataset = [[2.7810836,2.550537003,0], [1.465489372,2.362125076,0], [3.396561688,4.400293529,0], [1.38807019,1.850220317,0], [3.06407232,3.005305973,0], [7.627531214,2.759262235,1], [5.332441248,2.088626775,1], [6.922596716,1.77106367,1], [8.675418651,-0.242068655,1], [7.673756466,3.508563011,1]] neighbors = get_neighbors(dataset, dataset[0], 3) for neighbor in neighbors: print(neighbor) |
Running this example prints the 3 most similar records in the dataset to the first record, in order of similarity.
As expected, the first record is the most similar to itself and is at the top of the list.
|
1 2 3 |
[2.7810836, 2.550537003, 0] [3.06407232, 3.005305973, 0] [1.465489372, 2.362125076, 0] |
Now that we know how to get neighbors from the dataset, we can use them to make predictions.
Step 3: Make Predictions
The most similar neighbors collected from the training dataset can be used to make predictions.
In the case of classification, we can return the most represented class among the neighbors.
We can achieve this by performing the max() function on the list of output values from the neighbors. Given a list of class values observed in the neighbors, the max() function takes a set of unique class values and calls the count on the list of class values for each class value in the set.
Below is the function named predict_classification() that implements this.
|
1 2 3 4 5 6 |
# Make a classification prediction with neighbors def predict_classification(train, test_row, num_neighbors): neighbors = get_neighbors(train, test_row, num_neighbors) output_values = [row[-1] for row in neighbors] prediction = max(set(output_values), key=output_values.count) return prediction |
We can test this function on the above contrived dataset.
Below is a complete example.
|
1 2 3 4 5 6 7 8 9 10 11 12 13 14 15 16 17 18 19 20 21 22 23 24 25 26 27 28 29 30 31 32 33 34 35 36 37 38 39 40 41 42 |
# Example of making predictions from math import sqrt # calculate the Euclidean distance between two vectors def euclidean_distance(row1, row2): distance = 0.0 for i in range(len(row1)-1): distance += (row1[i] - row2[i])**2 return sqrt(distance) # Locate the most similar neighbors def get_neighbors(train, test_row, num_neighbors): distances = list() for train_row in train: dist = euclidean_distance(test_row, train_row) distances.append((train_row, dist)) distances.sort(key=lambda tup: tup[1]) neighbors = list() for i in range(num_neighbors): neighbors.append(distances[i][0]) return neighbors # Make a classification prediction with neighbors def predict_classification(train, test_row, num_neighbors): neighbors = get_neighbors(train, test_row, num_neighbors) output_values = [row[-1] for row in neighbors] prediction = max(set(output_values), key=output_values.count) return prediction # Test distance function dataset = [[2.7810836,2.550537003,0], [1.465489372,2.362125076,0], [3.396561688,4.400293529,0], [1.38807019,1.850220317,0], [3.06407232,3.005305973,0], [7.627531214,2.759262235,1], [5.332441248,2.088626775,1], [6.922596716,1.77106367,1], [8.675418651,-0.242068655,1], [7.673756466,3.508563011,1]] prediction = predict_classification(dataset, dataset[0], 3) print('Expected %d, Got %d.' % (dataset[0][-1], prediction)) |
Running this example prints the expected classification of 0 and the actual classification predicted from the 3 most similar neighbors in the dataset.
|
1 |
Expected 0, Got 0. |
We can imagine how the predict_classification() function can be changed to calculate the mean value of the outcome values.
We now have all of the pieces to make predictions with KNN. Let’s apply it to a real dataset.
Iris Flower Species Case Study
This section applies the KNN algorithm to the Iris flowers dataset.
The first step is to load the dataset and convert the loaded data to numbers that we can use with the mean and standard deviation calculations. For this we will use the helper function load_csv() to load the file, str_column_to_float() to convert string numbers to floats and str_column_to_int() to convert the class column to integer values.
We will evaluate the algorithm using k-fold cross-validation with 5 folds. This means that 150/5=30 records will be in each fold. We will use the helper functions evaluate_algorithm() to evaluate the algorithm with cross-validation and accuracy_metric() to calculate the accuracy of predictions.
A new function named k_nearest_neighbors() was developed to manage the application of the KNN algorithm, first learning the statistics from a training dataset and using them to make predictions for a test dataset.
If you would like more help with the data loading functions used below, see the tutorial:
If you would like more help with the way the model is evaluated using cross validation, see the tutorial:
The complete example is listed below.
|
1 2 3 4 5 6 7 8 9 10 11 12 13 14 15 16 17 18 19 20 21 22 23 24 25 26 27 28 29 30 31 32 33 34 35 36 37 38 39 40 41 42 43 44 45 46 47 48 49 50 51 52 53 54 55 56 57 58 59 60 61 62 63 64 65 66 67 68 69 70 71 72 73 74 75 76 77 78 79 80 81 82 83 84 85 86 87 88 89 90 91 92 93 94 95 96 97 98 99 100 101 102 103 104 105 106 107 108 109 110 111 112 113 114 115 116 117 118 119 120 121 122 123 124 125 126 127 128 129 130 131 132 133 134 135 136 137 |
# k-nearest neighbors on the Iris Flowers Dataset from random import seed from random import randrange from csv import reader from math import sqrt # Load a CSV file def load_csv(filename): dataset = list() with open(filename, 'r') as file: csv_reader = reader(file) for row in csv_reader: if not row: continue dataset.append(row) return dataset # Convert string column to float def str_column_to_float(dataset, column): for row in dataset: row[column] = float(row[column].strip()) # Convert string column to integer def str_column_to_int(dataset, column): class_values = [row[column] for row in dataset] unique = set(class_values) lookup = dict() for i, value in enumerate(unique): lookup[value] = i for row in dataset: row[column] = lookup[row[column]] return lookup # Find the min and max values for each column def dataset_minmax(dataset): minmax = list() for i in range(len(dataset[0])): col_values = [row[i] for row in dataset] value_min = min(col_values) value_max = max(col_values) minmax.append([value_min, value_max]) return minmax # Rescale dataset columns to the range 0-1 def normalize_dataset(dataset, minmax): for row in dataset: for i in range(len(row)): row[i] = (row[i] - minmax[i][0]) / (minmax[i][1] - minmax[i][0]) # Split a dataset into k folds def cross_validation_split(dataset, n_folds): dataset_split = list() dataset_copy = list(dataset) fold_size = int(len(dataset) / n_folds) for _ in range(n_folds): fold = list() while len(fold) < fold_size: index = randrange(len(dataset_copy)) fold.append(dataset_copy.pop(index)) dataset_split.append(fold) return dataset_split # Calculate accuracy percentage def accuracy_metric(actual, predicted): correct = 0 for i in range(len(actual)): if actual[i] == predicted[i]: correct += 1 return correct / float(len(actual)) * 100.0 # Evaluate an algorithm using a cross validation split def evaluate_algorithm(dataset, algorithm, n_folds, *args): folds = cross_validation_split(dataset, n_folds) scores = list() for fold in folds: train_set = list(folds) train_set.remove(fold) train_set = sum(train_set, []) test_set = list() for row in fold: row_copy = list(row) test_set.append(row_copy) row_copy[-1] = None predicted = algorithm(train_set, test_set, *args) actual = [row[-1] for row in fold] accuracy = accuracy_metric(actual, predicted) scores.append(accuracy) return scores # Calculate the Euclidean distance between two vectors def euclidean_distance(row1, row2): distance = 0.0 for i in range(len(row1)-1): distance += (row1[i] - row2[i])**2 return sqrt(distance) # Locate the most similar neighbors def get_neighbors(train, test_row, num_neighbors): distances = list() for train_row in train: dist = euclidean_distance(test_row, train_row) distances.append((train_row, dist)) distances.sort(key=lambda tup: tup[1]) neighbors = list() for i in range(num_neighbors): neighbors.append(distances[i][0]) return neighbors # Make a prediction with neighbors def predict_classification(train, test_row, num_neighbors): neighbors = get_neighbors(train, test_row, num_neighbors) output_values = [row[-1] for row in neighbors] prediction = max(set(output_values), key=output_values.count) return prediction # kNN Algorithm def k_nearest_neighbors(train, test, num_neighbors): predictions = list() for row in test: output = predict_classification(train, row, num_neighbors) predictions.append(output) return(predictions) # Test the kNN on the Iris Flowers dataset seed(1) filename = 'iris.csv' dataset = load_csv(filename) for i in range(len(dataset[0])-1): str_column_to_float(dataset, i) # convert class column to integers str_column_to_int(dataset, len(dataset[0])-1) # evaluate algorithm n_folds = 5 num_neighbors = 5 scores = evaluate_algorithm(dataset, k_nearest_neighbors, n_folds, num_neighbors) print('Scores: %s' % scores) print('Mean Accuracy: %.3f%%' % (sum(scores)/float(len(scores)))) |
Running the example prints the mean classification accuracy scores on each cross-validation fold as well as the mean accuracy score.
We can see that the mean accuracy of about 96.6% is dramatically better than the baseline accuracy of 33%.
|
1 2 |
Scores: [96.66666666666667, 96.66666666666667, 100.0, 90.0, 100.0] Mean Accuracy: 96.667% |
We can use the training dataset to make predictions for new observations (rows of data).
This involves making a call to the predict_classification() function with a row representing our new observation to predict the class label.
|
1 2 3 |
... # predict the label label = predict_classification(dataset, row, num_neighbors) |
We also might like to know the class label (string) for a prediction.
We can update the str_column_to_int() function to print the mapping of string class names to integers so we can interpret the prediction made by the model.
|
1 2 3 4 5 6 7 8 9 10 11 |
# Convert string column to integer def str_column_to_int(dataset, column): class_values = [row[column] for row in dataset] unique = set(class_values) lookup = dict() for i, value in enumerate(unique): lookup[value] = i print('[%s] => %d' % (value, i)) for row in dataset: row[column] = lookup[row[column]] return lookup |
Tying this together, a complete example of using KNN with the entire dataset and making a single prediction for a new observation is listed below.
|
1 2 3 4 5 6 7 8 9 10 11 12 13 14 15 16 17 18 19 20 21 22 23 24 25 26 27 28 29 30 31 32 33 34 35 36 37 38 39 40 41 42 43 44 45 46 47 48 49 50 51 52 53 54 55 56 57 58 59 60 61 62 63 64 65 66 67 68 69 70 71 72 73 74 75 76 77 78 79 80 81 82 83 84 85 86 87 88 |
# Make Predictions with k-nearest neighbors on the Iris Flowers Dataset from csv import reader from math import sqrt # Load a CSV file def load_csv(filename): dataset = list() with open(filename, 'r') as file: csv_reader = reader(file) for row in csv_reader: if not row: continue dataset.append(row) return dataset # Convert string column to float def str_column_to_float(dataset, column): for row in dataset: row[column] = float(row[column].strip()) # Convert string column to integer def str_column_to_int(dataset, column): class_values = [row[column] for row in dataset] unique = set(class_values) lookup = dict() for i, value in enumerate(unique): lookup[value] = i print('[%s] => %d' % (value, i)) for row in dataset: row[column] = lookup[row[column]] return lookup # Find the min and max values for each column def dataset_minmax(dataset): minmax = list() for i in range(len(dataset[0])): col_values = [row[i] for row in dataset] value_min = min(col_values) value_max = max(col_values) minmax.append([value_min, value_max]) return minmax # Rescale dataset columns to the range 0-1 def normalize_dataset(dataset, minmax): for row in dataset: for i in range(len(row)): row[i] = (row[i] - minmax[i][0]) / (minmax[i][1] - minmax[i][0]) # Calculate the Euclidean distance between two vectors def euclidean_distance(row1, row2): distance = 0.0 for i in range(len(row1)-1): distance += (row1[i] - row2[i])**2 return sqrt(distance) # Locate the most similar neighbors def get_neighbors(train, test_row, num_neighbors): distances = list() for train_row in train: dist = euclidean_distance(test_row, train_row) distances.append((train_row, dist)) distances.sort(key=lambda tup: tup[1]) neighbors = list() for i in range(num_neighbors): neighbors.append(distances[i][0]) return neighbors # Make a prediction with neighbors def predict_classification(train, test_row, num_neighbors): neighbors = get_neighbors(train, test_row, num_neighbors) output_values = [row[-1] for row in neighbors] prediction = max(set(output_values), key=output_values.count) return prediction # Make a prediction with KNN on Iris Dataset filename = 'iris.csv' dataset = load_csv(filename) for i in range(len(dataset[0])-1): str_column_to_float(dataset, i) # convert class column to integers str_column_to_int(dataset, len(dataset[0])-1) # define model parameter num_neighbors = 5 # define a new record row = [5.7,2.9,4.2,1.3] # predict the label label = predict_classification(dataset, row, num_neighbors) print('Data=%s, Predicted: %s' % (row, label)) |
Running the data first summarizes the mapping of class labels to integers and then fits the model on the entire dataset.
Then a new observation is defined (in this case I took a row from the dataset), and a predicted label is calculated.
In this case our observation is predicted as belonging to class 1 which we know is “Iris-setosa“.
|
1 2 3 4 |
[Iris-virginica] => 0 [Iris-setosa] => 1 [Iris-versicolor] => 2 Data=[4.5, 2.3, 1.3, 0.3], Predicted: 1 |
Tutorial Extensions
This section lists extensions to the tutorial you may wish to consider to investigate.
- Tune KNN. Try larger and larger k values to see if you can improve the performance of the algorithm on the Iris dataset.
- Regression. Adapt the example and apply it to a regression predictive modeling problem (e.g. predict a numerical value)
- More Distance Measures. Implement other distance measures that you can use to find similar historical data, such as Hamming distance, Manhattan distance and Minkowski distance.
- Data Preparation. Distance measures are strongly affected by the scale of the input data. Experiment with standardization and other data preparation methods in order to improve results.
- More Problems. As always, experiment with the technique on more and different classification and regression problems.
Further Reading
- Section 3.5 Comparison of Linear Regression with K-Nearest Neighbors, page 104, An Introduction to Statistical Learning, 2014.
- Section 18.8. Nonparametric Models, page 737, Artificial Intelligence: A Modern Approach, 2010.
- Section 13.5 K-Nearest Neighbors, page 350 Applied Predictive Modeling, 2013
- Section 4.7, Instance-based learning, page 128, Data Mining: Practical Machine Learning Tools and Techniques, 2nd edition, 2005.
Summary
In this tutorial you discovered how to implement the k-Nearest Neighbors algorithm from scratch with Python.
Specifically, you learned:
- How to code the k-Nearest Neighbors algorithm step-by-step.
- How to evaluate k-Nearest Neighbors on a real dataset.
- How to use k-Nearest Neighbors to make a prediction for new data.
Next Step
Take action!
- Follow the tutorial and implement KNN from scratch.
- Adapt the example to another dataset.
- Follow the extensions and improve upon the implementation.
Leave a comment and share your experiences.
Discover How to Code Algorithms From Scratch!

No Libraries, Just Python Code.
...with step-by-step tutorials on real-world datasets
Discover how in my new Ebook:
Machine Learning Algorithms From Scratch
It covers 18 tutorials with all the code for 12 top algorithms, like:
Linear Regression, k-Nearest Neighbors, Stochastic Gradient Descent and much more...
Finally, Pull Back the Curtain on
Machine Learning Algorithms
Skip the Academics. Just Results.


Jason –
I appreciate your step-by-step approach. Your explanation makes this material accessible for a wide audience.
Keep up the great contributions.
Thanks Damian!
How to use knn to imputate missing value???
Train a model to predict the column that contains the missing data, not including the missing data.
Then use the trained model to predict missing values.
I’m new to Machine learning Can you please let me know How can i train a model based on the above user defined KNN and get use the trained model for further prediction.
Is it possible to integrate Jaccard algorithm with KNN?
Thanks.
I recommend using sklearn, you can start here:
https://machinelearningmastery.com/start-here/#python
where can i get the definition of these below predefined functions (actual backend code)??
GaussianNB()
LinearSVC(random_state=0)
KNeighborsClassifier(n_neighbors=3)
please help!!
Yes, you can see the sklearn github project that has all the code:
https://github.com/scikit-learn/scikit-learn
A few changes for python 3
1.
print ‘Train set: ‘ + repr(len(trainingSet))
print ‘Test set: ‘ + repr(len(testSet))
print needs to be used with brackets
print (“Train set:” + repr(len(trainingSet)))
print (“Test set:”+ repr(len(testSet)))
2. iteritems() changed to items()
sortedVotes = sorted(classVotes.iteritems(), key=operator.itemgetter(1), reverse=True)
should be:
sortedVotes = sorted(classVotes.items(), key=operator.itemgetter(1), reverse=True)
Thanks for sharing.
can u provide me psedocode for nearest neighbor using ball tree algo?
Thanks for the suggestion, perhaps in the future.
1. I got the error message “TypeError: unsupported operand type(s) for -: ‘str’ and ‘str'”
Change
distance += pow(((instance1[x]) – (instance2[x])), 2)
to
distance += pow((float(instance1[x]) – float(instance2[x])), 2)
Thanks. Yes, the example assumes Python 2.7.
invalid character in identifier error and i cant add any line of code. it gives inconsistent use of tabs error but i don’t.
I have some ideas that might help:
https://machinelearningmastery.com/faq/single-faq/why-does-the-code-in-the-tutorial-not-work-for-me
thanks for sharing this information sir…
A very interesting and clear article. I haven’t tried it out yet but will over the weekend.
Thanks.
Thanks Pete, let me know how you go.
Hey Jason, I’ve ploughed through multiple books and tutorials but your explanation helped me to finally understand what I was doing.
Looking forward to more of your tutorials.
Thanks Alan!
Hey Jason!
Thank you for awesome article!
Clear and straight forward explanation. I finaly understood the background under kNN.
p.s.
There’s some code errors in the article.
1) in getResponse it should be “return sortedVote[0]” instead sortedVotes[0][0]
2) in getAccuracy it should be “testSet[x][-1] IN predictions[x]” instead of IS.
Thanks Vadim!
I think the code is right, but perhaps I misunderstood your comments.
If you change getResponse to return sortedVote[0] you will get the class and the count. We don’t want this, we just want the class.
In getAccuracy, I am interested in an equality between the class strings (is), not a set operation (in).
Does that make sense?
Hi,
First of all thanks for the informative tutorial.
I would like to impement regression using KNN. I have a data set with 4 attributes and 5th attribute that i want to predict.
Do i just create a function to take average of neighbours[x][-1] or should i implement it in some other way.
Thanks in advance.
Yes, that is an excellent start.
Thank you very much for this example!
You’re welcome Mario.
Thank you for the post on kNN implementation..
Any pointers on normalization will be greatly appreciated ?
What if the set of features includes fields like name, age, DOB, ID ? What are good algorithms to normalize such features ?
Hey PVA, great question.
Notmalization is just the rescaling of numerical attributes between 0-1. Tools like scikit-learn can do it for you if you like, here’s a recipe: https://machinelearningmastery.com/rescaling-data-for-machine-learning-in-python-with-scikit-learn/
You can compute distances between strings using methods like edit distance, learn more here: http://en.wikipedia.org/wiki/Edit_distance
DOB – well the distance between two dates could be in days, hours or whatever makes sense in your domain.
ID might just be useful as some kind of indirect marker of “when the entry was added to the database” if you don’t have a “record create time”.
I hope this helps.
Thank you for this great tutorial.
Please, is there a way we can save the model as a pkl file or something?
pkl is a pickle format (usually), which you use Python’s pickle module to save and load. Please refer to Python documentation for some examples. It is native to Python but may not be compatible across machines/versions. Therefore, we avoid using it for machine learning models for the fear that it is not helpful to use it to share your model with other. In Tensorflow, for example, HDF5 format is used instead.
A million thanks !
I’ve had so many starting points for my ML journey, but few have been this clear.
Merci !
Glad to here it Landry!
Hi,
when i run the code it shows
ValueError: could not convert string to float: ‘sepallength’
what should i do to run the program.
please help me out as soon as early….
thanks in advance…
Hi kumaran,
I believe the example code still works just fine. If I copy-paste the code from the tutorial into a new file called knn.py and download iris.data into the same directory, the example runs fine for me using Python 2.7.
Did you modify the example in some way perhaps?
it is because the first line in your code may contain info about each columns,
convert
for x in range(len(dataset)-1):
to
for x in range(1,len(dataset)-1):
it will skip the first line and start reading the data from 2nd line
use
for x in range(1,len(dataset)):
if you skipped the last line also
Hi jabson ,
Thanks for your reply..
I am using Anaconda IDE 3.4 .
yes it works well for the iris dataset If i try to put some other dataset it shows value error because those datasets contains strings along with the integers..
example forestfire datasets.
X Y month day FFMC DMC DC ISI temp RH wind rain area
7 5 mar fri 86.2 26.2 94.3 5.1 8.2 51 6.7 0 0
7 4 oct tue 90.6 35.4 669.1 6.7 18 33 0.9 0 0
7 4 oct sat 90.6 43.7 686.9 6.7 14.6 33 1.3 0 0
8 6 mar fri 91.7 33.3 77.5 9 8.3 97 4 0.2 0
8 6 mar sun 89.3 51.3 102.2 9.6 11.4 99 1.8 0 0
Is it possible to classify these datasets also with your code??
please provide me if some other classifer code example in python…
HI KUMARAN
did you get the solution for the problem mentioned in your comment. I am also facing the same problem. Please help me or provide me the solution if you have..
Excellent article on knn. It made the concepts so clear.
Thanks sanksh!
I like how it is explained, simply and clear. Great job.
Thanks!
Great article Jason !! Crisp and Clear.
Nice artical Jason. I am a software engineer new to ML. Your step by step approach made learning easy and fun. Though Python was new to me, it became very easy since I could run small small snippet instead of try to understand the entire program in once.
Appreciate your hardwork. Keep it up.
Thanks Raju.
It’s really fantastic for me. I can’t find a better one
I also face the same problem with Kumaran. After checking, I think the problem “can’t convert string into float” is that the first row is “sepal_length” and so on. Python can’t convert it since it’s totally string. So just delete it or change the code a little.
Hi,
Many thanks for this details article. Any clue for the extension Ideas?
Thanks,
RK
Hi – I was wondering how we can have the data fed into the system without randomly shuffling as I am trying to make a prediction on the final line of data?
Do we remove:
if random.random() < split
and replace with something like:
if len(trainingSet)/len(dataset) < split
# if < 0.67 then append to the training set, otherwise append to test set
The reason I ask is that I know what data I want to predict and with this it seems that it could use the data I want to predict within the training set due to the random selection process.
I also have the same dilemma as you, I performed trial and error, right now I cant seem to make things right which code be omitted to create a prediction.
I am not a software engineer nor I have a background in computer science. I am pretty new to data science and ML as well, I just started learning Python and R but the experience is GREAT!
Thanks so much for this Jason!
This article was absolutely gorgeous. As a computational physicist grad student who has taken an interest in machine learning this was the perfect level to skim, get my hands dirty and have some fun.
Thank you so much for the article on this. I’m excited to see the rest of your site.
Thanks for the article!
I wished to write my own knn python program, and that was really helpful !
Thanks a lot for sharing this.
One thing you didn’t mention though is how you chose k=3.
To get a feeling of how sensitive is the accuracy % to k, i wrote a “screening” function that iterates over k on the training set using leave-one-out cross validation accuracy % as a ranking.
Would you have any other suggestions ?
This is really really helpful. Thanks man !!
An incredibly useful tutorial, Jason. Thank you for this.
Please could you show me how you would modify your code to work with a data set which comprises strings (i.e. text) and not numerical values?
I’m really keen to try this algorithm on text data but can’t seem to find a decent article on line.
Your help is much appreciated.
Mark
Nice tutorial! Very helpful in explaining KNN — python is so much easier to understand than the mathematical operations. One thing though — the way the range function works for Python is that the final element is not included.
In loadDataset() you have
for x in range(len(dataset)-1):This should simply be:
for x in range(len(dataset)):otherwise the last row of data is omitted!
this gets an index out of range..
Thank you so much
great
thank very much
That’s great! I’ve tried so many books and articles to start learning ML. Your article is the first clear one! Thank you a lot! Please, keep teaching us!)
Thanks Gleb!
Hi Jason,
Thanks for this amazing introduction! I have two questions that relate to my study on this.
First is, how is optimization implemented in this code?
Second is, what is the strength of the induction this algorithm is making as explained above, will this is be a useful induction for a thinking machine?
Thank you so much!
HI jason;
it is great tutorial it help me alot thanks for great effort but i have queastion what if i want to split the data in to randomly 100 training set and 50 test set and i want to generate in separate file with there values instead of printing total numbers? becaouse i want to test them in hugin
thank you so much!
Hi Jason,
It is a really great tutorial. Your article is so clear, but I have a problem.
When I run code, I see the right classification.
> predicted=’Iris-virginica’, actual=’Iris-virginica’
> predicted=’Iris-virginica’, actual=’Iris-virginica’
> predicted=’Iris-virginica’, actual=’Iris-virginica’
> predicted=’Iris-virginica’, actual=’Iris-virginica’
…
However, accuracy is 0%. I run accuracy test but there is no problem with code.
How can I fix the accuracy? Where do I make mistake?
Thanks for reply and your helps.
Hi, I solved this doing this:
Originaly, on the step 5, in the function getAccuracy you have:
…
for x in range(len(testSet)):
if testSet[x][-1] is predictions[x]:
correct += 1
…
The key here is in the IF statement:
if testSet[x][-1] is predictions[x]:
Change “IS” to “==” so the getAccuracy now is:
…
for x in range(len(testSet)):
if testSet[x][-1] == predictions[x]:
correct += 1
…
That solve the problem and works ok!!
I think setting the value of K plays an important role in the accuracy of the prediction. How to determine the best value of ‘K’ . Please suggest some best practices ?
Dear, How to do it for muticlass classifcation with data in excelsheet: images of digits(not handwritten) and label of that image in corresponding next column of excel ??
Your this tutorial is totally on numeric data, just gave me the idea with images.
Very clear explanation and step by step working make this very understandable. I am not sure why the list sortedVotes within the function getResponse is reversed, I thought getResponse is meant to return the most common key in the dictionary classVotes. If you reverse the list, doesn’t this return the least common key in the dictionary?
I do not know how to take the k nearest neighbour for 3 classes for ties vote for example [1,1,2,2,0]. Since for two classes, with k=odd values, we do find the maximum vote for the two classes but ties happens if we choose three classes.
Thanks in advance
hi
thanks for this great effort buddy
i have some basic questions:
1: i opened “iris.data’ file and it is simply in html window. how to download?
2: if do a copy paste technique from html page. where to copy paste?
You can use File->Save as in your browser to save the file or copy the text and paste it int a new file and save it as the file “iris.data” expected by the tutorial.
I hope that helps.
Jason.
This is a really simple but thorough explaination. Thanks for the efforts.
Could you suggest me how to draw a scatter plot for the 3 classes. It will be really great if you could upload the code. Thanks in advance!
What if we want to classify text into categories using KNN,
e.g a given paragraph of text defines {Politics,Sports,Technology}
I’m Working on a project to Classify RSS Feeds
How to download the file without using library csv at the first stage?
Nice explanation Jason.. Really appreciate your work..
Thanks Avinash.
Hi! Really comprehensive tutorial, i loved it!
What will you do if some features are more important than others to determine the right class ?
Thanks Agnes.
Often it is a good idea to perform feature selection before building your model:
https://machinelearningmastery.com/an-introduction-to-feature-selection/
Hello,
I get this error message.
Train set: 78
Test set: 21
—————————————————————————
TypeError Traceback (most recent call last)
in ()
72 print(‘Accuracy: ‘ + repr(accuracy) + ‘%’)
73
—> 74 main()
in main()
65 k = 3
66 for x in range(len(testSet)):
—> 67 neighbors = getNeighbors(trainingSet, testSet[x], k)
68 result = getResponse(neighbors)
69 predictions.append(result)
in getNeighbors(trainingSet, testInstance, k)
27 length = len(testInstance)-1
28 for x in range(len(trainingSet)):
—> 29 dist = euclideanDistance(testInstance, trainingSet[x], length)
30 distances.append((trainingSet[x], dist))
31 distances.sort(key=operator.itemgetter(1))
in euclideanDistance(instance1, instance2, length)
20 distance = 0
21 for x in range(length):
—> 22 distance += pow(float(instance1[x] – instance2[x]), 2)
23 return math.sqrt(distance)
24
TypeError: unsupported operand type(s) for -: ‘str’ and ‘str’
Can you please help.
Thank you
It is not clear, it might be a copy-paste error from the post?
Thank you for your answer,
as if i can’t do the subtraction here is the error message
TypeError: unsupported operand type(s) for -: ‘str’ and ‘str’
and i copy/past the code directly from the tutorial
am so happy to be able to extend my gratitude to you.Have searched for good books to explain machine learning(KNN) but those i came across was not as clear and simple as this brilliant and awesome step by step explanation.Indeed you are a distinguished teacher
Thanks.
hi Jason, i really want to get into Machine learning. I want to make a big project for my final year of computer engg. which i am currently in. People are really enervating that way by saying that its too far fetched for a bachelor. I want to prove them wrong. I don’t have much time (6 months from today). I really want to make something useful. Can you send me some links that can help me settle on a project with machine learning? PLZ … TYSM
import numpy as np
from sklearn import preprocessing, cross_validation, neighbors
import pandas as pd
df= np.genfromtxt(‘/home/reverse/Desktop/acs.txt’, delimiter=’,’)
X= np.array(df[:,1])
y= np.array(df[:,0])
X_train, X_test, y_train, y_test = cross_validation.train_test_split(X,y,test_size=0.2)
clf = neighbors.KNeighborsClassifier()
clf.fit(X_train, y_train)
ValueError: Found arrays with inconsistent numbers of samples: [ 1 483]
Then I tried to reshape using this code: df.reshape((483,1))
Again i am getting this error “ValueError: total size of new array must be unchanged”
Advance thanks ….
Hi Jason,
great tutorial, very easy to follow. Thanks!
One question though. You wrote:
“Additionally, we want to control which fields to include in the distance calculation. Specifically, we only want to include the first 4 attributes. One approach is to limit the euclidean distance to a fixed length, ignoring the final dimension.”
Can you explain in more detail what you mean here? Why is the final dimension ignored when we want to include all 4 attributes?
Thanks a lot,
Caroline
The gist of the paragraph is that we only want to calculate distance on input variables and exclude the output variable.
The reason is when we have new data, we will not have the output variable, only input variables. Our job will be to find the k most similar instances to the new data and discover the output variable to predict.
In the specific case, the iris dataset has 4 input variables and the 5th is the class. We only want to calculate distance using the first 4 variables.
I hope that makes things clearer.
Hi Jason! The steps u showed are great. Do you any article regarding the same in matlab.
Thank you.
Thanks Pranav,
Sorry I don’t have Matlab examples at this stage.
Best algorithm tutorial I have ever seen! Thanks a lot!
Thanks Sara, I’m glad to hear that.
Detailed explanation given and I am able to understand the algorithm/code well! Trying to implement the same with my own data set (.csv file).
loadDataset(‘knn_test.csv’, split, trainingSet, testSet)
Able to execute and get the output for small dataset (with 4-5 rows and columns in the csv file).
When I try the same code for a bigger data set with 24 columns (inputs) and 12,000 rows (samples) in the csv file, I get the following error:
TypeError: unsupported operand type(s) for -: ‘str’ and ‘str’
The following lines are indicated in the error message:
distance += pow((instance1[x] – instance2[x]), 2)
dist = euclideanDistance(testInstance, trainingSet[x], length)
neighbors = getNeighbors(trainingSet, testSet[x], k)
main()
Any help or suggestion is appreciated. Thank in advance.
Thanks Nivedita.
Perhaps the loaded data needs to be converted from strings into numeric values?
Thank you for the reply Jason. There are no strings / no-numeric values in the data set. It is a csv file with 24 columns(inputs) and 12,083 rows(samples).
Any other advice?
Help is appreciated.
Understood Nivedita, but confirm that the loaded data is stored in memory as numeric values. Print your arrays to screen and/or use type(value) on specific values in each column.
Implemented this in Golang.
Check it out at – https://github.com/vedhavyas/machine-learning/tree/master/knn
Any feedback is much appreciated.
Also planning to implement as many algorithms as possible in Golang
Well done Vedhavyas.
Thanks for your great effort and implementation but I think that you need to add normalization step before the eucledian distance calculation.
Great suggestion, thanks Baris.
In this case, all input variables have the same scale. But, I agree, normalization is an important step when the scales of the input variables different – and often even when they don’t.
Great article! It would be even fuller if you add some comments in the code; previewing the data and its structure; and a step on normalization although this dataset does not require one.
Great suggestion, thanks Sisay.
hello, i”ve some error like this:
Traceback (most recent call last):
File “C:/Users/FFA/PycharmProjects/Knn/first.py”, line 80, in
main()
File “C:/Users/FFA/PycharmProjects/Knn/first.py”, line 65, in main
loadDataset(‘iris.data’, split, trainingSet, testSet)
File “C:/Users/FFA/PycharmProjects/Knn/first.py”, line 10, in loadDataset
dataset = list(lines)
_csv.Error: iterator should return strings, not bytes (did you open the file in text mode?)
what’s wrong ? how to solve the error ?
Change this line:
to this:
See if that makes a difference.
i have the same problème, i changed previous line but it didn’t work anyway !!
how do i can plot result data set calssifier using matplotlib, thanks
Great question, sorry I don’t have an example at hand.
I would suggest using a simple 2d dataset and use a scatterplot.
hello,
iris.data site link is unreachable. Could you reupload to other site please ? Thank you
Sorry, the UCI Machine Learning Repository that hosts the datasets appears to be down at the moment.
There is a back-up for the website with all the datasets here:
http://mlr.cs.umass.edu/ml/
One of the best articles I have ever read! Everything is so perfectly explained … One BIG THANK YOU!!!
I’m so glad to hear that Gabriela.
Great tutorial, worked very well with python3 had to change the iteritems in the getResponse method to .items()
line 63 & 64:
print (“Train set: ” + repr(len(trainingSet)))
print (“Test set: ” + repr(len(testSet)))
generally great tutorial , Thank you 🙂
Thanks Abdallah.
Hi,
first of all, Thanks for this great informative tutorial.
secondly, as compared to your accuracy of ~98%, i am getting an accuracy of around ~65% for every value of k. Can you tell me if this is fine and if not what general mistake i might be doing?
Thanks 🙂
Sorry to hear that.
Perhaps a different version of Python (3 instead of 2.7?), or perhaps a copy-paste error?
Hi, Jason, this article is awesome, it really gave me clear insight of KNN, and it’s so readable. just want to thank you for your incredible work. Awesome!!
I’m glad you found it useful!
Hi,
Thanks for your article.. ?
I have something to ask you..
Is the accuracy of coding indicates the accuracy of the classification of both groups ? What if want to see the accuracy of classification of true positives ? How to coding ?
Thanks before
Yes Meaz, accuracy is on the whole problem or both groups.
You can change it to report on the accuracy of one group or another, I do not have an off the cuff snippet of code for you though.
Super Article!
After reading tones of articles in which by second paragraph I am lost, this article is like explaining Pythagoras theorem to someone who landed on Algebra!
Please keep doing this Jason
I’m glad to hear it Neeraj.
This is a great tutorial, keep it up. I am trying to use KNN to generate epsilon for my DBSCAN algorithm. My data set is a time series. It only has one feature which is sub-sequenced into different time windows. I am wondering if there is a link where I can get a clear cut explanation like this for such a problem.Do you think KNN can predict epsilon since each of my row has a unique ID not setosa etc in the iris data set.
I don’t know Afees, i would recommend try it and see.
Hi Jason
I am working on a similar solution in R but i am facing problems during training of knn
What problem are you seeing Ahmad?
Thank you very much, it really helped me to understand the concept of knn.
But when i run this clock i get an error, and i couldn’t solve it. Could you please help
import csv
import random
def loadDataset(filename, split, trainingSet=[] , testSet=[]):
with open(filename, ‘rb’) as csvfile:
lines = csv.reader(csvfile)
dataset = list(lines)
for x in range(len(dataset)):
for y in range(4):
dataset[x][y] = float(dataset[x][y])
if random.random() < split:
trainingSet.append(dataset[x])
else:
testSet.append(dataset[x])
trainingSet=[]
testSet=[]
loadDataset('iris.data', 0.66, trainingSet, testSet)
print 'Train: ' + repr(len(trainingSet))
print 'Test: ' + repr(len(testSet))
IndexError Traceback (most recent call last)
in ()
15 trainingSet=[]
16 testSet=[]
—> 17 loadDataset(‘/home/emre/SWE546_DataMining/iris’, 0.66, trainingSet, testSet)
18 print ‘Train: ‘ + repr(len(trainingSet))
19 print ‘Test: ‘ + repr(len(testSet))
in loadDataset(filename, split, trainingSet, testSet)
7 for x in range(len(dataset)):
8 for y in range(4):
—-> 9 dataset[x][y] = float(dataset[x][y])
10 if random.random() < split:
11 trainingSet.append(dataset[x])
IndexError: list index out of range
solved it thanks
Glad to hear it.
How did you solve it?
Hi jason,
I am getting error of syntax in return math.sqrt(distance) and also in undefined variables in main()
Sorry to hear that, what errors exactly?
How should I take testSet from user as input and then print my prediction as output?
AWESOME POST! I cant describe how much this has helped me understand the algorithm so I can write my own C# version. Thank you so much!
I’m glad to here!
Hello,
I have encountered a problem where I need to detect and recognize an object ( in my case a logo ) in an image. My images are some kind of scanned documents that contains mostly text, signatutes and logos. I am interested in localizing the logo and recognizing which logo is it.
My problem seems easier than most object recognition problems since the logo always comes in the same angle only the scale and position that changes. Any help on how to proceed is welcome as I’m out of options right now.
Thanks
Sound great Mark.
I expect CNNs to do well on this problem and some computer vision methods may help further.
Hi Jason, I have folowed through your tutorial and now I am trying to change it to run one of my own files instead of the iris dataset. I keep getting the error:
lines = csv.reader(csvfile)
NameError: name ‘csv’ is not defined
All i have done is change lines 62-64 from:
loadDataset(‘iris.data’, split, trainingSet, testSet)
print ‘Train set: ‘ + repr(len(trainingSet))
print ‘Test set: ‘ + repr(len(testSet))
To:
loadDataset(‘fvectors.csv’, split, trainingSet, testSet)
print( ‘Train set: ‘ + repr(len(trainingSet)))
print( ‘Test set: ‘ + repr(len(testSet)))
I have also tried to it with fvectors instead of fvectors.csv but that doesnt work either. DO you have any idea what is going wrong?
It looks like your python environment might not be installed correctly.
Consider trying this tutorial:
https://machinelearningmastery.com/setup-python-environment-machine-learning-deep-learning-anaconda/
Hi Jason, id missed an import, a silly mistake. But now i get this error:
_csv.Error: iterator should return strings, not bytes (did you open the file in text mode?)
Any ideas?
I got that fixed by changing
with open(‘fvectors.csv’, ‘rb’) as csvfile:
to
with open(‘fvectors.csv’, ‘rt’) as csvfile:
but now i get this error.
dataset[x][y] = float(dataset[x][y])
ValueError: could not convert string to float:
It appears to not like my headers or labels for the data but are the labels not essential for the predicted vs actual part of the code
Nice.
Double check you have the correct data file.
Hello, Thomas, I have the same issue. I changed ‘rb’ to ‘rt’. I get the error ‘dataset[x][y] = float(dataset[x][y])
ValueError: could not convert string to float: ‘sepal_length’, apparently it is caused by the the header, how did you fix it?
Consider opening the file in ASCII format open(filename, ‘rt’). This might work better in Python 3.
Hi Jason
thanks a lot for such a wonderful tutorial for KNN.
when i run this code i found the error as
distance += pow((instance1[x] – instance2[x]), 2)
TypeError: unsupported operand type(s) for -: ‘str’ and ‘str’
can u help me f or clearing this error
Thank u
distance += pow((float(instance1[x]) – float(instance2[x])), 2)
Hi, i have some zipcode point (Tzip) with lat/long. but these points may/maynot fall inside real zip polygon (truezip). i want to do a k nearest neighbor to see the k neighbors of a Tzip point has which majority zipcode. i mean if 3 neighbors of Tzip 77339 says 77339,77339,77152.. then majority voting will determine the class as 77339. i want Tzip and truezip as nominal variable. can i try your code for that? i am very novice at python…thanks in advance.
tweetzip, lat, long, truezip
77339, 73730.689, -990323 77339
77339, 73730.699, -990341 77339
77339, 73735.6, -990351 77152
Perhaps, you may need to tweak it for your example.
Consider using KNN from sklearn, much less code would be required:
https://machinelearningmastery.com/spot-check-classification-machine-learning-algorithms-python-scikit-learn/
Thanks for your reply. i tried to use sklearn as you suggeested. But as for line ‘kfold=model_selection.KFold(n_splits=10,random_state=seed)’ it showed an error ‘seed is not defined’.
Also i think (not sure if i am right) it also take all the variable as numeric..but i want to calculate nearest neighbor distance using 2 numeric variable (lat/long) and get result along each row.
what should i do?
def getNeighbors(trainingSet, testInstance, k):
distances = []
length = len(testInstance)-1
for x in range(len(trainingSet)):
dist = euclideanDistance(testInstance, trainingSet[x], length)
distances.append((trainingSet[x], dist))
distances.sort(key=operator.itemgetter(1))
neighbors = []
for x in range(k):
neighbors.append(distances[x][0])
return neighbors
in this fuction either “length = len(testInstance)-1” -1 shouldn’t be there or the
testInstance = [5, 5, 5] should include a character item at its last index??
Am I correct?
Yes, I believe so.
Thanks
plz anyone has dataset related to human behaviour please please share me
Consider searching kaggle and the uci machine learning repository.
Hello, can you tell me at getResponce what exactly are you doing line by line?Cause I do this in Java and cant figure out what exactly I have to do.
thanks
Hi,
I am trying to run your code in Anaconda Python —–Spyder….
I have landed in errors
(1) AttributeError: ‘dict’ object has no attribute ‘iteritems’
(2) filename = ‘iris.data.csv’
with open(filename, ‘rb’) as csvfile:
Initially while loading and opening the data file , it showed an error like
Error: iterator should return strings, not bytes (did you open the file in text mode?)
when i changed rb to rt , it works….i don’t whether it will create problem later…
Please response ASAP
Thanks
The first error may be caused because the example was developed for Python 2.7 and you are using Python 3. I hope to update the examples for Python 3 in the future.
Yes, In Python 3, change to ‘rt’ top open as a text file.
Hi, for python 3
just replace this line(47):
sortedVotes = sorted(classVotes.iteritems(), key=operator.itemgetter(1), reverse=True)
with this line:
sortedVotes = sorted(classVotes.items(), key=operator.itemgetter(1), reverse=True)
it is in def getResponse(neighbors) function
Thanks Ivan.
I didn’t find anything about performance in this article. Is it so that the performance is really bad?
let’s say we have a training set of 100,000 entries, and test set of 1000. Then the euclidean distance should be calculated 10e8 times? Any workaround for this ?
Yes, you can use more efficient distance measures (e.g. drop the sqrt) or use efficient data structures to track distances (e.g. kd-trees/balls)
Nice !! Thank you 🙂
If you are using Python 3,
Use
1.#instead of rb
with open(filename, ‘r’) as csvfile:
2. #instead of iteritems.
sortedVotes = sorted(classVotes.items(), key=operator.itemgetter(1), reverse=True)
Thanks Vipin!
Hello Jason,
Nice Article. I understand a lot about the KNN under the hood. But one thing though. In scikit learn we use KNN from training to predict in 2 step.
Step 1: Fitting the classifier
Step 2: Predicting
In Fitting section we didn’t pass the test data. Only train data is passed and hence we can see where it is training and where it is testing. With respect to your other blog on Naive Bayes implementation, the part which was calculating mean and std can be considered as fitting/training part while the part which was using Gaussian Normal Distribtuion can be considered as testing/prediction part.
However in this implementation I can not see that distinction. Can you please tell me which part should be considered as training and which part is testing. The reason I am asking this question is because it is always imporatant to correalte with scikit-learn flow so that we get a better idea.
Great question.
There is no training in knn as there is no model. The dataset is the model.
Thanks for the reply…Is it the same for even scikit learn ? What exactly happens when we fit the model for KNN in Scikit Learn then?
Yes it is the same.
Nothing I expect. Perhaps store the dataset in an efficient structure for searching (e.g. kdtree).
Thanks..That’s seems interesting..BTW..I really like your approach..Apart from your e-books what materials (video/books) you think I may need to excel in deep learning and NLP. I want to switch my career as a NLP engineer.
Practice on a lot of problems and develop real and usable skills.
Where do you think I can get best problems that would create real and usable skills? Kaggle?? or somewhere else?
See this post:
https://machinelearningmastery.com/get-started-with-kaggle/
Great post. Why aren’t you normalizing the data?
Great question. Because all features in the iris data have the same units.
HI Jason,
In one of your e-book ‘machine_learning_mastery_with_python’ Chapter – 11 (Spot-Check Classification Algorithms), you have explained KNN by using scikit learn KNeighborsClassifier class. I would like to know the difference between the detailed one what you’ve explained here and the KNeighborsClassifier class. It might be a very basic question for ML practitioner as I’m very new in ML and trying to understand the purposes of different approaches.
Thanks
Golam Sarwar
The tutorial here is to help understand how the kNN method works.
To use it in practice, I would strongly encourage you to use the implementation in a library like sklearn.
The main reasons are to avoid bugs and for performance. Learn more here:
https://machinelearningmastery.com/dont-implement-machine-learning-algorithms/
Thanks…..
nice explication and great tutorial , i hope that you have other blogs about other classification algorithms like this
thanks …. Jason
Thanks.
I do, use the blog search.
Hi Jason,
Nice explanation !!
Can you please show us the implementation of the same (KNN) algorithm in Java also ?
Thanks for the suggestion, perhaps in the future.
Thanks Jason
You’re welcome.
Hi Jason,
Is it normal to get different accuracy, FP, TP, FN, TN on every different try? I am using same data.
Yes, see this post for an explanation of why to expect this in machine learning:
https://machinelearningmastery.com/randomness-in-machine-learning/
Thanks Jason. you can add below explanation to the post to make it more clear:
I’ve discovered that the different accuracy is caused by the below line in the loadDataset function:
if random.random() randomized.csv
Hi,
I am using that function instead of getAccuracy. It gives TP, TN, FP, FN.
def getPerformance(testSet, predictions):
tp = 0
tn = 0
fp = 0
fn = 0
for x in range(len(testSet)):
if testSet[x][-1] == predictions[x]:
if predictions[x] == “yes”:
tp += 1
else:
tn += 1
else:
if predictions[x] == “yes”:
fp += 1
else:
fn += 1
performance = [ ((tp/float(len(testSet))) * 100.0), ((tn/float(len(testSet))) * 100.0), ((fp/float(len(testSet))) * 100.0), ((fn/float(len(testSet))) * 100.0) ]
return performance
HI Barrys,
What is the following line of code checking for –> if predictions[x] == ‘yes’
Seems as if it always is false….
if predictions[x] == “yes”:
tp += 1
else:
tn += 1
This is the best tutorial entry I have seen on any blog post about any topic. It is very easy to follow. The code is correct and not outdated. I love the way everything is structured. It kind of follows the TDD approach where it first builds on the production code step by step, testing each step on the way. Kudos to you for the great work! This is indeed helpful.
Thanks!
i have a probleme in reading from the dataset can you tell me wher is the problem?
import pandas as pd
import numpy as np from sklearn import preprocessing, neighbors from sklearn.model_selection import train_test_split import pandas as pd
df = np.read_txt(‘C:\Users\sms\Downloads\NSLKDD-Dataset-master\NSLKDD-Dataset-master\KDDTrain22Percent.arff’) df.replace(‘?’ , -99999, inplace=True) df.drop([‘class’], 1, inplace=True)
x = np.array(df.drop([‘class’],1)) y = np.array(df[‘class’])
x_train, x_test, y_train, y_test = train_test_split(x,y,test_size=0.2)
clf = neighbors.KNieghborsClassifier() clf.fit(x_train, y_train)
accuracy = clf.score(x_test, y_test) print(accuracy)
What is the problem?
plz upload python code for feature selection using metaheuristic firefly algorithm
Thanks for the suggestion.
Nice, I added some pre tags for you.
Prediction accuracy seems to be very disappointing when I implemented your code? Where did I make mistake?
> predicted=’Iris-versicolor’, actual=’Iris-setosa’
Accuracy: 35.294117647058826%
# python 3 implementation
import random
import csv
split = 0.66
with open(‘iris-data.txt’) as csvfile:
lines = csv.reader(csvfile)
dataset = list(lines)
random.shuffle(dataset)
print(len(dataset))
div = int(split * len(dataset))
train = dataset[:div] # spliting 150 * .66 = 99
print(“This is number of train data ” + str(len(train)))
test = dataset[div:] # test data = 150-99 = 51
print(“This is number of test data ” + str(len(test)))
import math
# square root of the sum of the squared differences between the two arrays of numbers
def euclideanDistance(instance1, instance2, length):
distance = 0
for x in range(length):
# print(instance1[x])
distance += pow((float(instance1[x]) – float(instance2[x])), 2)
return math.sqrt(distance)
import operator
# distances = []
def getNeighbors(trainingSet, testInstance, k):
distances = []
length = len(testInstance) – 1
for x in range(len(trainingSet)):
dist = euclideanDistance(testInstance, trainingSet[x], length)
distances.append((trainingSet[x], dist))
distances.sort(key=operator.itemgetter(1))
neighbors = []
for x in range(k):
neighbors.append(distances[x][0])
return neighbors
classVotes = {}
def getResponse(neighbors):
# classVotes = {}
for x in range(len(neighbors)):
response = neighbors[x][-1]
if response in classVotes:
classVotes[response] += 1
else:
classVotes[response] = 1
sortedVotes = sorted(classVotes.items(), key=operator.itemgetter(1), reverse=True)
return sortedVotes[0][0]
def getAccuracy(testSet, predictions):
correct = 0
for x in range(len(testSet)):
# print(predictions[x])
if testSet[x][-1] == predictions[x]:
correct += 1
return (correct / float(len(testSet))) * 100.0
predictions = []
k = 3
for x in range(len(test)):
# print(len(test[x]))
neighbors = getNeighbors(train, test[x], k)
# print(“N”,neighbors)
result = getResponse(neighbors)
# print(“R”,result)
predictions.append(result)
# print(predictions)
print(‘> predicted=’ + repr(result) + ‘, actual=’ + repr(test[x][-1]))
accuracy = getAccuracy(test, predictions)
print(‘Accuracy: ‘ + repr(accuracy) + ‘%’)
How can can I return no response for an unbiased random response?
I’m using this code to classify random images as letters. I have a dataset of letters for it.
For example, I have a random image that is not a letter but when I use this code to classify I get a letter in response. How can I tell that this image is not a letter? According to my dataset. Should I modify the code to check the result I get in “sortedVotes[0][1]”?
Thank you.
Perhaps you can include “non-letters” in the training dataset also?
But what if I don’t have this type of data?
Thank you.
You may have to invent or contrive it to get the results you are seeking.
Hi, I want this in java language, can you help me out with this?
You could port it to Java.
Hi, How can i plot the output of the labelled data?
What type of plot would you like?
Please do Rotation forest (with LDA and PCA) in python.
Thanks for the suggestion.
Great explanation thinking of where to start ML but this tutorial cleared my doubt and I feeling now I have been confident and can apply this algorithm to any problem thanks to you
I’m glad to hear that.
HI Jason , I seem to be getting the below error. can you please confirm whats that I need to change. quite new to python
import csv
import random
def loadDataset(filename, split, trainingSet=[] , testSet=[]):
with open(filename, ‘rt’) as csvfile:
lines = csv.reader(csvfile)
dataset = list(lines)
for x in range(len(dataset)-1):
for y in range(4):
dataset[x][y] = float(dataset[x][y])
if random.random() < split:
trainingSet.append(dataset[x])
else:
testSet.append(dataset[x])
trainingSet=[]
testSet=[]
loadDataset('iris.data',0.66, trainingSet, testSet)
print ('Train: ' + repr(len(trainingSet)))
print ('Test: ' + repr(len(testSet)))
Traceback (most recent call last):
File "”, line 17, in
loadDataset(‘iris.data’,0.66, trainingSet, testSet)
File “”, line 9, in loadDataset
dataset[x][y] = float(dataset[x][y])
ValueError: could not convert string to float: ‘5.1,3.5,1.4,0.2,Iris-setosa’
@ yuvaraj I just tried your code out (with the correct indentations) and it works perfectly for me with the given data set..
for x in range(len(dataset)-1):
for y in range(4):
dataset[x][y] = float(dataset[x][y])
These lines intend to convert dataset[x][0] dataset[x][1] dataset[x][2] dataset[x][3] from type str to type float so that they can be used for calculating the euclidean distance. You cannot convert ‘Iris-setosa’ to type float.
Hi Jason,
i’m running your code above on my dataset, it has 40’000 lines, 10 features and 1 binary class.
It takes much more time to run it (i have actually not let it finish yet, after 5-10 minutes…) compared to your 6 models code here:
https://machinelearningmastery.com/machine-learning-in-python-step-by-step/
This last code runs much much faster on the same dataset, it takes just a few seconds on a Macbook pro.
Is this normal ? Or maybe something i’m doing wrong…
I let it run today and it took about an hour, accuracy 0.96. why is the other code so much faster ? It does not run on all the data ?
It might be a hardware or environment issue?
Not sure. But you confirm the code on this page runs on all the data, not just a subset, especially the KNN code ?
https://machinelearningmastery.com/machine-learning-in-python-step-by-step/
It runs so fast.
thanks for all this work really, i’ve learned a lot.
You could try running the code on less data.
Hi, Dr. Brownlee
Perhaps instead of using
is, let’s use the==operator sinceisasks for identity, and not equality. I’ve stumbled upon this error myself when trying out your tutorial. Nice work btw. Thank you!Thanks.
Thank you so much Jason. one of the best tutorial about the KNN !!
One thing..in the GetResponse function the command .iteritems() doesn’t existi anymore in Python3…instead is .items()
Thank you again
Thanks for the note.
I have trained my data using knn,with neighbours no : 3, i have calculate distane for predicted data.i got smaller and larger values as distance.
How to calculate acceptance distance for knn, how to calculate the maximum limit for distance in knn.
Please suggest any procedure to calculate maximum limit for distance in knn
Perhaps estimate these values using a test dataset.
i got very huge values a distance but it’s predicted as nearest neighbors,that is reason i wish to find the maximum acceptance distance in knn .
is there any procedure available for calculate maximum acceptance distance in knn.
There may be, I’m not across it. Perhaps check papers on google scholar.
Distance in KNN ,Please tell me what are factors will effects on distance value.
The vales of observations.
How does one plot this data to return an image similar to the one at the beginning?
Good question, sorry I don’t have an example at this stage.
I savor, result in I discovered just what I was having a look for.
You’ve ended my four day lengthy hunt! God Bless
you man. Have a nice day. Bye
Thanks, I’m glad it helped.
Hello, Jason, I so like to purchase your book “Code Algorithms From Scratch in Python”, but I have one question, in the book, are the code all update to python 3? Even in you posts, so many codes are still in python 2, I already learned python3 and I am learning ML, a total newbie, I want to focus on ML, no debug the python 2 code to python 3. I found it very frustrating and annoying that when the code give me error because the discrepancies in python 2 and python 3, could you also please update your post with python 3? Thanks
Not yet, all code are Python 2.7 at this stage.
hai. may i know how your csv looks alike?
It is here:
https://archive.ics.uci.edu/ml/machine-learning-databases/iris/iris.data
Thanks Jason for another great tutorial. One thing i’d to know is , how would you go about plotting a 3d image of the first 3 attributes of the training dataset against the test sample set with labels for a more visual introspective of how the results look like. thanks
A Voronoi tessellation is popular fo visualizing knn in 2d:
https://en.wikipedia.org/wiki/Voronoi_diagram
can we do it with LVQ ?
can we apply this to a dataset having more than two class
Sure.
Here is my take for the same algorithm, a bit more object-oriented.. Maybe more readable to people familiar with Java or Java-like languages: https://github.com/koraytugay/notebook/blob/master/programming_challenges/src/python/iris_flower_knn/App.py
Nice work!
Hi, great tutorial so far. I’m a newbie to Python, and am stuck on the following error in the getNeighbours function:
File “”, line 8
distances.sort(key=operator.itemgetter(1))
^
SyntaxError: invalid syntax
I’m using Python 3, but have tried a few alternatives and still can’t make it work. Can anyone help?
The tutorial assumes Python 2.7.
The code must be updated for Python 3.
Thanks Mr. jason,
i really thank you from the depth of my heart for providing such an easy and simple implementation of this algo with appropriate meaning and need of each function
really once again thank you
I have also done your 14-day course of machine learning which also really helped me a lot….
Hope to learn more from u like this …
Thank You
I’m happy to hear that.
I have some questions:
If I want to create an algorithm without an actual train set does this algorithm classify as an instance base algorithm?
Also is KNN the algorithm of choice for such problem?
As an example we can consider the IRIS dataset, but imagine you add new data on a daily basis.
Thanks a lot for your time.
You must have labelled data in order to prepare a supervised learning model.
So, if I have we a data set like the example dataframe below, could we have such case?
Age . Income . Savings . House Loan Occupation . Credit Risk .Cat (0-2)
23 . 25000 . 3600 . No Private Sector 1
33 . 37000 . 12000 . Yes IT 1
37 . 34500 . 15000 . Yes IT 1
45 . 54000 . 60000 . Yes . Academic 0
26 . 26000 . 4000 . Yes . Private Sector 2
Here the label is the Credit Risk. Assume that something like this arrives “fresh” every day, is KNN a good way to classify the data? Or we can apply another algorithm too?
My only worry is accuracy and overfitting issues, since you won’t have any test data. Also KNN is a very simple algorithm, Finally, assuming the data comes from the same source is it safe to assume that they will not have any bias?
I would recommend using a framework like sklearn to investigate your dataset.
You can get started here:
https://machinelearningmastery.com/start-here/#python
what it actually give the output in Iris dataset? I mean which accuracy is calculated?
Sorry, I don’t follow your question. Perhaps you can provide more context or rephrase your question?
Can i predict more than one parameters from this algorithm. Here in iris data-set types of flowers and is accuracy is calculated. if i added one more parameter for example color then both flower type and color can be predict and it’s accuracy at a same time?
Neural nets can, sklearn models generally cannot predict more than one variable.
Thank you so much. Your way of explanation is to the point and conceptual.
Thanks.
thanks. your way of explanation is to the pint and conceptual.
Point*
Hi Jason, excellent blog. Love all your posts. Thank you very much. However, I had one question on sklearn’s nearest neighbors. I am very confused what “indices” actually mean.
This is from sklearn website. “For the simple task of finding the nearest neighbors between two sets of data, the unsupervised algorithms within sklearn.neighbors can be used”.
>>> from sklearn.neighbors import NearestNeighbors
>>> import numpy as np
>>> X = np.array([[-1, -1], [-2, -1], [-3, -2], [1, 1], [2, 1], [3, 2]])
>>> nbrs = NearestNeighbors(n_neighbors=2, algorithm=’ball_tree’).fit(X)
>>> distances, indices = nbrs.kneighbors(X)
>>> indices
array([[0, 1],
[1, 0],
[2, 1],
[3, 4],
[4, 3],
[5, 4]]…)
>>> distances
array([[ 0. , 1. ],
[ 0. , 1. ],
[ 0. , 1.41421356],
[ 0. , 1. ],
[ 0. , 1. ],
[ 0. , 1.41421356]])
I implemented this on iris data set and this is what I get. Again, how do I interpret 1,2, and 3 below? Thank you very much.
# instantiate learning model (k = 3)
knn = KNeighborsClassifier(n_neighbors=3)
# fitting the model
knn.fit(X_train, y_train)
# predict the response
pred = knn.predict(X_test)
distances, indices = knn.kneighbors(X)
print(indices[1:3])… Q1
[[84 82 35]
[58 18 50]]
print(distances[1:3])..Q2
[[0. 0.17320508 0.17320508]
[0. 0.14142136 0.24494897]]
print(y_train[indices][10:12])…Q3
[[0. 0. 0.]
[0. 0. 0.]]
Probability the index into the saved training data.
I was very excited to study your materials but unfortunately the codes don’t work in Python 3.7.
For example the very first code bit on this page.
Yes, the code was written a long time ago for Py2.7.
I Jason ,new to machine learning,your article is really simple and easy to understand,i have a very basic question,(silly one),
Which is the unknown object that is being predicted
Once we fit the model we can use the model to make a prediction on new data.
In this example, the model takes measurements of a flower and predicts the species of iris flower.
Jason, why do I not find your online example in the downloaded Machine Learning Algorthms from Scratch with Python.
I only see KNN implemented with abalone example. Do I have outdate versions of this ebook?
I provide a fuller example of knn in the book (better design and support for py2 and py3).
Hi Jason,
Thank you so much for the explanation.
I run the code and the accuracy shows 0.0%
Perhaps try knn provided by sklearn?
This is my very first approach of Machine Learning. This is a well described article which made me a fan of ML. I did according to your article and got result. Thank you for this article.
It would be a great help if you could you tell me the next article for me to do since this is my very first day of machine learning.
Thanks, here are some similar tutorials:
https://machinelearningmastery.com/start-here/#code_algorithms
Hello,
Kindly amend the code to load the CSV file from URL using numpy and pandas for python 3 users.
thanks
Thanks for the suggestion.
how I can estimated conditional probability of the predicted class
I recommend using sklearn’s implementation and calling predict_proba():
https://scikit-learn.org/stable/modules/generated/sklearn.neighbors.KNeighborsClassifier.html
HI
great tutorial!
but i have trouble understanding the line if response in classVotes
can you please explain ?
Sure, which part exactly?
Hi Jason, can you pls give a rough estimate of how long does it take to create a good project in ML?
It depends on the project and on the developer/s involved.
It could be one hour, it could be one year.
This process will really speed things up:
https://machinelearningmastery.com/start-here/#process
Hi thanks for the post. One question is: do you think we should put predictions=[] in the for loop? the predictions list should be cleared after each loop
this gots
Traceback (most recent call last):
File “C:\Users\micro\AppData\Local\Programs\Python\Python36-32\distnce1.py”, line 10, in
for x in range(len(dataset)-1):
NameError: name ‘dataset’ is not defined
You might have skipped some lines of code from the tutorial.
I am getting the following error :
iterator should return strings, not bytes (did you open the file in text mode?)
I have saved the data as ‘irisdataset.txt’ in notepad
Please help
The file was opened in binary model, perhaps try changing it to text mode?
Thanks Jason . I changed it to text and its working now. But for any value of k, I am getting 100% accuracy
Perhaps there was a typo when you copied the code?
Hi Jason…
could you help me!
I need this code but it does not work at all :((((
and I’m using python 3.7 with autism dataset and the data has a missing value
what should I do
please anyone can help me !!!
and thank you.
I have an updated version for Python 3 in my book:
https://machinelearningmastery.com/machine-learning-algorithms-from-scratch/
How to fix this error ? Mr Jason
import csv
import random
import math
import operator
def loadDataset(Part1_Train, split, trainingSet=[] , testSet=[]):
with open(‘Part1_Train.csv’, ‘r’) as csvfile:
lines = csv.reader(csvfile)
dataset = list(lines)
for x in range(len(dataset)-1):
for y in range(4):
dataset[x][y] = float(dataset[x][y])
if random.random() predicted=’ + repr(result) + ‘, actual=’ + repr(testSet[x][-1]))
accuracy = getAccuracy(testSet, predictions)
print(‘Accuracy: ‘ + repr(accuracy) + ‘%’)
main()
—————————————————————————
ValueError Traceback (most recent call last)
in ()
72 print(‘Accuracy: ‘ + repr(accuracy) + ‘%’)
73
—> 74 main()
in main()
58 testSet=[]
59 split = 0.67
—> 60 loadDataset(‘Part1_Train.csv’, split, trainingSet, testSet)
61 print (‘Train set: ‘ + repr(len(trainingSet)))
62 print (‘Test set: ‘ + repr(len(testSet)))
in loadDataset(Part1_Train, split, trainingSet, testSet)
10 for x in range(len(dataset)-1):
11 for y in range(4):
—> 12 dataset[x][y] = float(dataset[x][y])
13 if random.random() < split:
14 trainingSet.append(dataset[x])
ValueError: could not convert string to float: '5.1,3.5,1.4,0.2,A'
I have some suggestions here:
https://machinelearningmastery.com/faq/single-faq/why-does-the-code-in-the-tutorial-not-work-for-me
# -*- coding: utf-8 -*-
“””
Created on Sun Apr 28 00:14:28 2019
@author: Feroz
“””
import csv
import random
import math
import operator
from matplotlib import pyplot
def loadDataset(filename, split, trainingSet=[] , testSet=[]):
with open(filename, ‘r’) as csvfile:
lines = csv.reader(csvfile)
dataset = list(lines)
for x in range(len(dataset)-1):
for y in range(4):
dataset[x][y] = float(dataset[x][y])
if random.random() predicted=’ + repr(result) + ‘, actual=’ + repr(testSet[x][-1]))
accuracy = getAccuracy(testSet, predictions)
print(‘Accuracy: ‘ + str(accuracy) + ‘%’)
main()
Here is OUTPUT:
runfile(‘C:/Users/Feroz/Desktop/Project/untitled0.py’, wdir=’C:/Users/Feroz/Desktop/Project’)
Train set: 103
Test set: 47
> predicted=’Iris-setosa’, actual=’Iris-setosa’
> predicted=’Iris-setosa’, actual=’Iris-setosa’
> predicted=’Iris-setosa’, actual=’Iris-setosa’
> predicted=’Iris-setosa’, actual=’Iris-setosa’
> predicted=’Iris-setosa’, actual=’Iris-setosa’
> predicted=’Iris-setosa’, actual=’Iris-setosa’
> predicted=’Iris-setosa’, actual=’Iris-setosa’
> predicted=’Iris-setosa’, actual=’Iris-setosa’
> predicted=’Iris-setosa’, actual=’Iris-setosa’
> predicted=’Iris-setosa’, actual=’Iris-setosa’
> predicted=’Iris-setosa’, actual=’Iris-setosa’
> predicted=’Iris-setosa’, actual=’Iris-setosa’
> predicted=’Iris-setosa’, actual=’Iris-setosa’
> predicted=’Iris-setosa’, actual=’Iris-setosa’
> predicted=’Iris-setosa’, actual=’Iris-setosa’
> predicted=’Iris-setosa’, actual=’Iris-setosa’
> predicted=’Iris-setosa’, actual=’Iris-setosa’
> predicted=’Iris-versicolor’, actual=’Iris-versicolor’
> predicted=’Iris-versicolor’, actual=’Iris-versicolor’
> predicted=’Iris-versicolor’, actual=’Iris-versicolor’
> predicted=’Iris-versicolor’, actual=’Iris-versicolor’
> predicted=’Iris-versicolor’, actual=’Iris-versicolor’
> predicted=’Iris-versicolor’, actual=’Iris-versicolor’
> predicted=’Iris-versicolor’, actual=’Iris-versicolor’
> predicted=’Iris-versicolor’, actual=’Iris-versicolor’
> predicted=’Iris-versicolor’, actual=’Iris-versicolor’
> predicted=’Iris-versicolor’, actual=’Iris-versicolor’
> predicted=’Iris-versicolor’, actual=’Iris-versicolor’
> predicted=’Iris-versicolor’, actual=’Iris-versicolor’
> predicted=’Iris-versicolor’, actual=’Iris-versicolor’
> predicted=’Iris-virginica’, actual=’Iris-virginica’
> predicted=’Iris-virginica’, actual=’Iris-virginica’
> predicted=’Iris-virginica’, actual=’Iris-virginica’
> predicted=’Iris-virginica’, actual=’Iris-virginica’
> predicted=’Iris-virginica’, actual=’Iris-virginica’
> predicted=’Iris-virginica’, actual=’Iris-virginica’
> predicted=’Iris-virginica’, actual=’Iris-virginica’
> predicted=’Iris-virginica’, actual=’Iris-virginica’
> predicted=’Iris-virginica’, actual=’Iris-virginica’
> predicted=’Iris-versicolor’, actual=’Iris-virginica’
> predicted=’Iris-virginica’, actual=’Iris-virginica’
> predicted=’Iris-virginica’, actual=’Iris-virginica’
> predicted=’Iris-virginica’, actual=’Iris-virginica’
> predicted=’Iris-virginica’, actual=’Iris-virginica’
> predicted=’Iris-virginica’, actual=’Iris-virginica’
> predicted=’Iris-virginica’, actual=’Iris-virginica’
> predicted=’Iris-virginica’, actual=’Iris-virginica’
Accuracy: 0.0%
Thanks for creating such a nice tutorial. I run your code and it works perfectly fine but why it gives accuracy 0.0% I’m not getting this. Thanks
Nice work.
I have some suggestions here:
https://machinelearningmastery.com/faq/single-faq/why-does-the-code-in-the-tutorial-not-work-for-me
Good job Jason.
I am new to Python.
After running the first code:
import csv
with open(‘iris.data’, ‘rb’) as csvfile:
lines = csv.reader(csvfile)
for row in lines:
print ‘, ‘.join(row)
I get an error message:
File “C:\Users\AKINSOWONOMOYELE\Anaconda3\lib\site-packages\spyder_kernels\customize\spydercustomize.py”, line 110, in execfile
exec(compile(f.read(), filename, ‘exec’), namespace)
File “C:/Users/AKINSOWONOMOYELE/.spyder-py3/temp.py”, line 5
print ‘, ‘.join(row)
^
SyntaxError: invalid syntax
How do I handle this?
I have some suggestions here:
https://machinelearningmastery.com/faq/single-faq/why-does-the-code-in-the-tutorial-not-work-for-me
Hello Jason,
How come the random return value can split the dataset into training set and test set?
I don't understand the logic, can you help me ?
It returns a number between 0 and 1, and we check if it is below our ratio to decide what list to add the example to.
Traceback (most recent call last):
File “C:/Users/DELL/Desktop/project/python/pro2.py”, line 70, in
neighbors = getNeighbors(train, test[x], k)
File “C:/Users/DELL/Desktop/project/python/pro2.py”, line 34, in getNeighbors
dist = euclideanDistance(testInstance, trainingSet[x], length)
File “C:/Users/DELL/Desktop/project/python/pro2.py”, line 23, in euclideanDistance
distance += pow((float(instance1[x]) – float(instance2[x])), 2)
IndexError: list index out of range
what is this error
That the list index is out of range.
HELLO JASON.
i HAVE FINISHED THE ARTICLE WITH ALL THE 250+ REVIEWS.bUT STILL HAVE DOUBTS WHEN APPLYING KNN IN MY ANALYSIS.wHAT TO DO????PLEASE PROVIDE SUGGESTIONS.THANKS
BEST REGARDS
SANDIPAN SARKAR
This example is for learning purposes only, not for projects.
For actual problems, I recommend using sklearn:
https://machinelearningmastery.com/spot-check-classification-machine-learning-algorithms-python-scikit-learn/
How can we predict by giving new data sets like
sepal-length sepal-width petal-length petal-width Class
5.1 3.5 1.4 0.2 ?
and let our model to predict
I recommend using a scikit-learn implementation, this example is just for learning.
See this post:
https://machinelearningmastery.com/make-predictions-scikit-learn/
Hi, I am in my learning phase, I have a project in hand where I am getting many sensor data from an IoT device on a webserver every minute. I am doing web scraping initially and then the data is stored in CSV format. now all the data including the time date stamp is in string format.
my question is I want to apply Knn for the prediction of the next data set if it contains any anomaly or not so what should be my approach for pre-processing. As in the last, I have to check real-time data for any anomaly present in it.
Thanks
If it is data from IoT, it might be a time series. Perhaps you can model it as a time series classification (anomaly or not).
The tutorials here might give you some ideas:
https://machinelearningmastery.com/start-here/#deep_learning_time_series
please how can i input my query into my knn algorithm for classification, don’t know how to code it
Perhaps you can use the scikit-learn implementation here:
https://scikit-learn.org/stable/modules/generated/sklearn.neighbors.KNeighborsClassifier.html
Hey…..I used this code: I have to do this for pima indians data set
import random
import csv
split = 0.66
with open(‘C:\\Users\\HP\\Desktop\\diabetes.csv’) as csvfile:
lines = csv.reader(csvfile)
dataset = list(lines)
random.shuffle(dataset)
div = int(split * len(dataset))
train = dataset [:div]
test = dataset [div:]
import math
# square root of the sum of the squared differences between the two arrays of numbers
def euclideanDistance(instance1, instance2, length):
distance = 0
for x in range(length):
#print(instance1[x])
distance += pow((float(instance1[x]) – float(instance2[x])), 2)
return math.sqrt(distance)
import operator
#distances = []
def getNeighbors(trainingSet, testInstance, k):
distances = []
length = len(testInstance)-1
for x in range(len(trainingSet)):
dist = euclideanDistance(testInstance, trainingSet[x], length)
distances.append((trainingSet[x], dist))
distances.sort(key=operator.itemgetter(1))
neighbors = []
for x in range(k):
neighbors.append(distances[x][0])
return neighbors
classVotes = {}
def getResponse(neighbors):
#classVotes = {}
for x in range(len(neighbors)):
response = neighbors[x][-1]
if response in classVotes:
classVotes[response] += 1
else:
classVotes[response] = 1
sortedVotes = sorted(classVotes.items(), key=operator.itemgetter(1), reverse=True)
return sortedVotes[0][0]
def getAccuracy(testSet, predictions):
correct = 0
for x in range(len(testSet)):
#print(predictions[x])
if testSet[x][-1] == predictions[x]:
correct += 1
return (correct/float(len(testSet))) * 100.0
predictions=[]
k = 3
for x in range(len(test)):
#print(len(test[x]))
neighbors = getNeighbors(train, test[x], k)
#print(“N”,neighbors)
result = getResponse(neighbors)
#print(“R”,result)
predictions.append(result)
#print(predictions)
print(‘> predicted=’ + repr(result) + ‘, actual=’ + repr(test[x][-1]))
accuracy = getAccuracy(test, predictions)
print(‘Accuracy: ‘ + repr(accuracy) + ‘%’)
error:
File “C:/Users/HP/.spyder-py3/ir.py”, line 23, in euclideanDistance
distance += pow((float(instance1[x]) – float(instance2[x])), 2)
ValueError: could not convert string to float: ‘Pregnancies’
This is a common question that I answer here:
https://machinelearningmastery.com/faq/single-faq/can-you-read-review-or-debug-my-code
Did u use statistical methods or Baysian theory to speed up the convergence when doing parameter matching? Have u applied to pharmacy industry?
I use both, really depends on the project.
A grid search can take you a long way too!
Hi
By the code of this blog post, when you calculate the K nearest neighbors, you consider the node itself as one of those nodes, correct?
No, typically we evaluate a model on data not used to train it.
Here, we use cross validation which separates data into train and test sets many times, examples in the test set are not in the train set.
Hi Jason,
could you also please help with a blog on other instance-based reduction techniques, like IB2 and IB3, in python?
Thanks for the suggestion!
You mean like condensed NN and edited NN? Yes, I have a tutorial on these topics written and scheduled.
Hi Jason,
Thanks for sharing. Do you have the link of your condensed NN and edited NN algorithm? Would love to see how you implement those.
You can use the blog search box.
This might be a good place to start:
https://machinelearningmastery.com/undersampling-algorithms-for-imbalanced-classification/
Hello Jason
I think there is something that should be fixed, in the function ‘cross_validation_split’.
Consider the division of ‘len(dataset) / n_folds’. In cases where the remainder of the division is large,
the result may miss some of the data.
For example, given the following code:
then the output is:
This may also be critical when talking about very large datasets.
Thanks anyway,
Ori
Thanks for sharing Ori!
How can i found one comment or review is Invcentivized / biased using this KNN approach??will you tell me ?
Advance thanks.
Perhaps you can model the problem as text classification:
https://machinelearningmastery.com/best-practices-document-classification-deep-learning/
Hello ! Great article thank you very much ! Your website helps a lot !
I have a question related to your post :
I am currently working on multiparametric voxel classification. In other words, I have several aligned and registered parametric images and want to form cluster of voxels according to their values in each parametric image.
I focus on medical images. The analysis is done in order to characterize and predict the treatment response of patient to their therapy.
I have a lot of types of images at one time for each patient (CT scanner images, molecular images, MRI, etc.).
To see if I can detect remarkable trends, I first want to simply clusterise the voxels with multi-dimensional k-means, hierarchical based approaches and/or PCA.
I know that it is very important to preprocess the data before applying unsupervised clustering. Based on what I have read, it doesn’t seem to be a hard rule on which to choose between NORMALIZING (between 0 and 1) or STANDARDIZING (mean = 0 and std = 1) the data. It seems to depend on data and contexts.
Since my image have very different scales, do you think I should NORMALIZE or STANDARDIZE the value of the voxels in each parametric image ?
Thank you very much for your help.
Cheers !
You’re welcome.
Perhaps try each approach and compare to raw data and use the method that results in the most skillful model.
Thank you ! So according to you also, there no “hard rule”. It confirm a bit what I have read…
This is what I will try but in unsupervised, it is dificult to no which result is the best as we do not have ground truth…
Anyway, thank you very much for your disponibility !
difficult to KNOW* which
(sorry I am french)
How are you Dr.
How I can use KNN based in recommender systems in requirements traceability to trace the requirements.
Requirements traceability is the ability to trace requirements from the beginning until the end of the project.
Its a part of requirement management.
I need python code to implement that
Perhaps start by defining your problem:
https://machinelearningmastery.com/how-to-define-your-machine-learning-problem/
Then perhaps use this process to work through it systematically:
https://machinelearningmastery.com/start-here/#process
Your code line “dist = euclidean_distance(test_row, train_row)” is wrong.
You should switch the order of the arguments.
Look at the for_loop in the implementation of euclidean_distance to see why
The code is correct, both classes have an extra element at the end of their list for the class.
You’re right for standalone predictions though, where no such element would be present.
Hello Dr. Jason Brownlee,
I am working on a PoC for a customer. Let me explain the requirement.
I am given an excel sheet with following columns:
Server_SNo,
Owner,
Hosting Dept,
Bus owner,
Applications hosted,
Functionality,
comments
Except the Server_SNo, other columns may or may not have data.
For some records there is no data except Server_SNo which is the first column.
One business owner can own more than 1 Server.
So, out of 4000 records, about 50% of data contain a direct mapping for a server with the owner. Remaining 50% of data have a combination of other columns (Owner, Hosting Dept, Bus owner, Applications hosted, Functionality and comments)
Here is my problem, I need to find the owner for the given Server_Sno for 50% of data which have a combination of other columns (Owner, Hosting Dept, Bus owner, Applications hosted, Functionality and comments).
Is this an NLP problem? Am I going in the right direction using Python and NLTK for NLP?
Any insights are appreciated.
There is probably a fixed number of “owners”. It could be a classification task with some text inputs. A bag of words model would help as a first step to encode each of the variables.
Hello
I tried to convert the code to java
and i do it but i get different results
/*
* To change this license header, choose License Headers in Project Properties.
* To change this template file, choose Tools | Templates
* and open the template in the editor.
*/
package iris;
import java.io.BufferedReader;
import java.io.File;
import java.io.FileReader;
import java.io.IOException;
import java.util.ArrayList;
import java.util.Arrays;
import java.util.List;
import knntradition.KNNTradition;
import static knntradition.KNNTradition.Max;
import static knntradition.KNNTradition.Sort2DList;
import static knntradition.KNNTradition.euclidean_distance;
import static knntradition.KNNTradition.get_neighbors;
/**
*
* @author Mustapha M. Baua
*/
public class iris {
public KNNTradition knn = new KNNTradition();
public static void main(String[] args)
{
/* # Test the kNN on the Iris Flowers dataset
seed(1)
filename = ‘iris.csv’
dataset = load_csv(filename)
for i in range(len(dataset[0])-1):
str_column_to_float(dataset, i)
*/
List<List> DataSetList = LoadDataSet();
System.out.println(“Lines in DataSetList “+ DataSetList.size());
System.out.println(“”);
/*# convert class column to integers
str_column_to_int(dataset, len(dataset[0])-1)
*/
List<List> lookup = lookup(DataSetList, DataSetList.get(0).size()-1);
DataSetList = str_column_to_int(DataSetList, DataSetList.get(0).size()-1);
//System.out.println(“lookup “+lookup);
DataSetList = normalize_dataset(DataSetList, dataset_minmax(DataSetList));
//System.out.println(DataSetList.get(0));
//System.out.println(DataSetList.get(51));
//System.out.println(DataSetList.get(101));
/*
# evaluate algorithm
n_folds = 5
num_neighbors = 5
scores = evaluate_algorithm(dataset, k_nearest_neighbors, n_folds, num_neighbors)
print(‘Scores: %s’ % scores)
print(‘Mean Accuracy: %.3f%%’ % (sum(scores)/float(len(scores)))) */
int n_folds = 5;
int num_neighbors = 5;
// public static List<List<List>> k_nearest_neighbors(List<List> train, List<List> test,int num_neighbors)
List kNearestNeighbors = k_nearest_neighbors(DataSetList, DataSetList, num_neighbors);
List scores = evaluate_algorithm(DataSetList, kNearestNeighbors,n_folds, num_neighbors);
System.out.println(“Scores are “);
System.out.println(“scores size is “+scores.size()+” “+scores);
System.out.println(“Mean Accuracy: “+ sum(scores)/scores.size());
}
public static double sum(List list)
{
double sum = 0;
for(int k = 0 ; k<list.size();k++)
{
sum += Double.valueOf(list.get(k));
}
return sum;
}
public static List LoadDataSet()
{
List<List> DataSetList = new ArrayList();
try{
File file = new File(“E:\\iris.txt”);
FileReader Reader = new FileReader(file);
BufferedReader lineReader = new BufferedReader(Reader);
String lineText;
System.out.println(“Attempting to read from file in: “+file.getCanonicalPath());
while ((lineText = lineReader.readLine()) != null)
{
String[] Elements = lineText.split(“,”);
//System.out.println(lineText);
List singleList = new ArrayList() ;
singleList.addAll(Arrays.asList(Elements));
DataSetList.add(singleList);
}
System.out.println(“End of Reading File”);
}catch (IOException e)
{
System.out.println(e.getMessage());
}
return DataSetList;
}
/* # Convert string column to integer
def str_column_to_int(dataset, column):
class_values = [row[column] for row in dataset]
unique = set(class_values)
lookup = dict()
for i, value in enumerate(unique):
lookup[value] = i
for row in dataset:
row[column] = lookup[row[column]]
return lookup */
public static List<List> str_column_to_int(List<List> ds, int column)
{
List class_values =new ArrayList();
List unique = new ArrayList();
List<List> lookup = lookup(ds,column);
for(int i = 0;i<ds.size();i++)
class_values.add(ds.get(i).get(column));
for(int i = 0;i<ds.size();i++)
{
String Count = ChFreq(unique, String.valueOf(class_values.get(i)));
if (Count!=null && "0".equals(Count))
unique.add(class_values.get(i));
}
for(int k = 0;k<ds.size();k++)
{
List TempRow = ds.get(k);
for(int h = 0 ;h < lookup.size();h++)
{
if(lookup.get(h).get(1).equals(ds.get(k).get(column)))
{
TempRow.set(column,lookup.get(h).get(0));
ds.set(k, TempRow);
}
}
}
return ds;
}
public static List<List> lookup(List<List> ds, int column)
{
List<List> lookup =new ArrayList();
List class_values =new ArrayList();
List unique = new ArrayList();
for(int i = 0;i<ds.size();i++)
class_values.add(ds.get(i).get(column));
for(int i = 0;i<ds.size();i++)
{
String Count = ChFreq(unique, String.valueOf(class_values.get(i)));
if (Count!=null && "0".equals(Count))
unique.add(class_values.get(i));
}
for(int k = 0;k<unique.size();k++)
{
List TwoItems = new ArrayList();
TwoItems.add(String.valueOf(k));
TwoItems.add(unique.get(k));
lookup.add(TwoItems);
}
return lookup;
}
/* # kNN Algorithm
def k_nearest_neighbors(train, test, num_neighbors):
predictions = list()
for row in test:
output = predict_classification(train, row, num_neighbors)
predictions.append(output)
return(predictions) */
public static List k_nearest_neighbors(List<List> train, List<List> test,int num_neighbors)
{
List predictions = new ArrayList();
for(int k = 0 ; k<test.size();k++)
{
predictions.add(predict_classification(train, test.get(k), num_neighbors));
}
return predictions;
}
/* # Make a prediction with neighbors
def predict_classification(train, test_row, num_neighbors):
neighbors = get_neighbors(train, test_row, num_neighbors)
output_values = [row[-1] for row in neighbors]
prediction = max(set(output_values), key=output_values.count)
return prediction */
public static String predict_classification(List<List> train, List test_row, long num_neighbors)
{
//System.out.println(“predict_classification train set “);
//System.out.println(“train size “+train.size()+” “+train);
List<List> neighbors = get_neighbors(train, test_row, num_neighbors);
List OutputValues = new ArrayList();
String prediction= null;
//System.out.println(neighbors);
//output_values = [row[-1] for row in neighbors]
if(neighbors!=null)
{
for(int i=0;i<neighbors.size();i++)
OutputValues.add(neighbors.get(i).get(neighbors.get(i).size()-2));
//System.out.println("outputvalues "+OutputValues);
prediction = Max(OutputValues);
}
return prediction;
}
// Locate the most similar neighbors
public static List<List> get_neighbors(List<List> train, List test_row,long num_neighbors)
{
List<List> Distances = new ArrayList();
List<List> neighbors = new ArrayList();
double dist;
for(int i=0;i<train.size();i++)
{
List singleList = new ArrayList();
for(int k =0;k<train.get(i).size();k++)
singleList.add(train.get(i).get(k));
dist = euclidean_distance(test_row, train.get(i));
singleList.add(String.valueOf(dist));
Distances.add(singleList);
}
Distances = Sort2DList(Distances);
for(int i=0;i<num_neighbors;i++)
neighbors.add(Distances.get(i));
//System.out.println("neighbors are "+neighbors.size()+" "+ neighbors);
return neighbors;
}
public static List<List> Sort2DList(List<List> list)
{
List maxRow = new ArrayList();
for (int i=0;i<list.size()-1;i++)
{
for(int j=i+1;jDouble.parseDouble(list.get(j).get(list.get(j).size()-1)))
{
maxRow = list.get(i);
list.set(i, list.get(j));
list.set(j, maxRow);
}
}
}
return list;
}
/* # Evaluate an algorithm using a cross validation split
def evaluate_algorithm(dataset, algorithm, n_folds, *args):
folds = cross_validation_split(dataset, n_folds)
scores = list()
for fold in folds:
train_set = list(folds)
train_set.remove(fold)
train_set = sum(train_set, [])
test_set = list()
for row in fold:
row_copy = list(row)
test_set.append(row_copy)
row_copy[-1] = None
predicted = algorithm(train_set, test_set, *args)
actual = [row[-1] for row in fold]
accuracy = accuracy_metric(actual, predicted)
scores.append(accuracy)
return scores */
public static List evaluate_algorithm(List<List> dataset,List neighbors, int n_folds, int num_neighbors)
{
List<List<List>> folds = cross_validation_split(dataset,n_folds);
List scores = new ArrayList();
for(int i = 0;i <n_folds;i++)
{
List<List<List>> train_set=new ArrayList(folds);
List<List> test_set = folds.get(i);
List<List<List>> train_set_copy = new ArrayList(train_set);
train_set_copy.remove(test_set);
//train_set = sum(train_set, [])
//System.out.println(” i = “+ i +” “+ folds.size());
List predicted = new ArrayList();
//if(!(train_set.get(i).equals(test_set)))
//{
for(int j = 0 ;j<train_set_copy.size();j++)
{
predicted = k_nearest_neighbors(train_set_copy.get(j), test_set, num_neighbors);
}
//}
//System.out.println("predicted size is "+predicted.size()+" "+predicted);
List<List> fold = folds.get(i);
List actual = new ArrayList();
for(int j = 0; j < fold.size();j++)
{
actual.add(fold.get(j).get(fold.get(j).size()-1));
}
//System.out.println("actual size "+actual.size()+" "+actual);
double accuracy = accuracy_metric(actual,predicted);
scores.add(String.valueOf(accuracy));
}
return scores;
}
/* # Split a dataset into k folds
def cross_validation_split(dataset, n_folds):
dataset_split = list()
dataset_copy = list(dataset)
fold_size = int(len(dataset) / n_folds)
for _ in range(n_folds):
fold = list()
while len(fold) < fold_size:
index = randrange(len(dataset_copy))
fold.append(dataset_copy.pop(index))
dataset_split.append(fold)
return dataset_split */
public static List<List<List>> cross_validation_split(List<List> dataset, int n_folds)
{
List<List<List>> dataset_split = new ArrayList();
List<List> dataset_copy = dataset;
int fold_size = dataset.size()/n_folds;
for(int k = 0; k< n_folds; k++)
{
List<List> fold = new ArrayList();
while(fold.size()< fold_size)
{
int index = (int) (Math.random()*dataset_copy.size()-1)+0;
fold.add(dataset_copy.get(index));
}
dataset_split.add(fold);
}
return dataset_split;
}
/* # Convert string column to float
def str_column_to_float(dataset, column):
for row in dataset:
row[column] = float(row[column].strip())
*/
public static String ChFreq(List list, String word)
{
int counter = 0;
if(list!=null)
{
for(int i =0 ;i <list.size();i++)
{
if(list.get(i) == null ? word == null : list.get(i).equals(word))
counter++;
}
}else
{
return null;
}
return String.valueOf(counter);
}
/* # Find the min and max values for each column
def dataset_minmax(dataset):
minmax = list()
for i in range(len(dataset[0])):
col_values = [row[i] for row in dataset]
value_min = min(col_values)
value_max = max(col_values)
minmax.append([value_min, value_max])
return minmax */
public static List<List> dataset_minmax(List<List> dataset)
{
List<List> minmax = new ArrayList();
for(int k = 0 ;k < dataset.get(0).size();k ++)
{
List col = GetColumn(dataset,k);
List tempminmax = new ArrayList();
tempminmax.add(Min(col));
tempminmax.add(Max(col));
minmax.add(tempminmax);
}
return minmax;
}
public static List GetColumn(List<List> ds, int col)
{
List column =new ArrayList();
for(int i = 0;i<ds.size();i++)
column.add((ds.get(i).get(col)));
return column;
}
public static String Max(List list)
{
String max = list.get(0);
for(int i=0;i<list.size();i++)
if(Double.valueOf(max)<Double.valueOf(list.get(i)))
max = list.get(i);
return max;
}
public static String Min(List list)
{
String min = list.get(0);
for(int i=0;iDouble.valueOf(list.get(i)))
min = list.get(i);
return min;
}
/* # Rescale dataset columns to the range 0-1
def normalize_dataset(dataset, minmax):
for row in dataset:
for i in range(len(row)):
row[i] = (row[i] – minmax[i][0]) / (minmax[i][1] – minmax[i][0]) */
public static List<List> normalize_dataset(List<List> dataset, List<List> minmax)
{
for(int i = 0; i< dataset.size();i++)
{
List row = dataset.get(i);
for(int j = 0; j<row.size();j++)
{
row.set(j,String.valueOf( (Double.parseDouble(row.get(j)) – Double.parseDouble(minmax.get(j).get(0))) / (Double.parseDouble(minmax.get(j).get(1)) – Double.parseDouble(minmax.get(j).get(0)))));
}
dataset.set(i, row);
}
//System.out.println("normalized dataset "+ dataset);
return dataset;
}
/* # Calculate accuracy percentage
def accuracy_metric(actual, predicted):
correct = 0
for i in range(len(actual)):
if actual[i] == predicted[i]:
correct += 1
return correct / float(len(actual)) * 100.0 */
public static double accuracy_metric(List actual, List predicted)
{
int correct =0;
for(int k = 0;k < actual.size();k++)
{
//for(int h = 0 ;h< predicted.size();h++)
//{
if( actual.get(k).equals(predicted.get(k)))
{
correct +=1;
}
//}
}
//System.out.println("correct "+ correct);
return correct / (actual.size() * 100.0);
}
}
Well done!
Hello ..
but i get different results … is it okay . . because i want to improve the algorithm
Yes, different results across languages is to be expected.
thanks … i treate the problem by multiply the result with 10000
but what do you mean by this step pleaze
train_set = sum(train_set, []) ??
Good question. It looks like it does nothing.
now i solve the problem of results i get exactly correct results
its a problem data type between int and doulble
when i improve the algorithm i will send it to you
thanks
Well done!
Hi Sir,
Thanks for sharing this. Where do I get the below java packages
import knntradition.KNNTradition;
import static knntradition.KNNTradition.Max;
import static knntradition.KNNTradition.Sort2DList;
import static knntradition.KNNTradition.euclidean_distance;
import static knntradition.KNNTradition.get_neighbors;
i copy your sourcecode
but i got error : “name ‘k_nearest_neighbors’ is not defined”
help please 🙁
It sounds like you skipped some code, try copy-pasting the example at the end of the tutorial.
still same,the error position in evaluate_algorithm cannot read k_nearest_neighbors
Hello, Jason.
I would like to find the nearest neighbors of a given row in a dataset. It works well by outputting the dataset itself, however I would like it to print out the Label, for example: iris-setosa, Iris-virginica or Iris-versicolor when dealing with the iris dataset. Just like the way a recommender syatem finds out similarities. How do I go about that?
Each class is assigned an integer called integer encoding as par of data preparation. Keep track of this mapping of classes to integers. Then when you gather the k nearest neighbors – calculate the mode of the integer values and map it back to the string class name.
hello Jason i improve the algorithm and also i take care with this method i found many records repeated because of using Random method so i change the code to be the following
public List<List<List>> cross_validation_split(List<List> dataset, int n_folds)
{
List<List<List>> dataset_split = new ArrayList();
List<List> dataset_copy = dataset;
int fold_size = dataset.size()/n_folds;
int index = 0;
for(int k = 0; k< n_folds; k++)
{
List<List> fold = new ArrayList();
while(fold.size()< fold_size)
{
// deleted line int index = (int) (Math.random()*dataset_copy.size()-1)+0;
fold.add(dataset_copy.get(index));
index++;
}
//System.out.println("fold # "+ k+ " "+fold);
dataset_split.add(fold);
}
return dataset_split;
}
Sorry, I don’t have the capacity to debug your java code.
Dear Jason Brownlee!
The code segments are not arranged i.e. the last combined complete code missing some important code segments while the first than the last has.
The complete code example at the end contains everything needed.
Good lecture Jason and many discussions induced!
I have in mind 2 more extensions to be possibly implemented in case of KNN:
1) Weights of KNN dependent on the distance from predicted point (e.g. inverse of the distance).
2) NN search algorithm improvement/acceleration/paralelization (probably helpful for big datasets).
Regards!
Thanks.
Great extension ideas!
Hi Jason,
First I want to say thank you for your great work and explanations that you did helping us understand this new IT topic.
Now I wanna ask you a thing: I have copy paste the second bunch of code where the program output the predicted value and after I have runned it I have this output:
[Iris-versicolor] => 0
[Iris-virginica] => 1
[Iris-setosa] => 2
Data=[4.5, 2.3, 1.3, 0.3], Predicted: 2
which is different from yours:
[Iris-virginica] => 0
[Iris-setosa] => 1
[Iris-versicolor] => 2
Data=[4.5, 2.3, 1.3, 0.3], Predicted: 1
Can you please explain me why in my run the setosa is clasified as 2 and in your is classified as 1, also the others are different
Many thanks,
zoiks
Yes, you can expected differences in the results given the stochastic nature of the algorithm:
https://machinelearningmastery.com/faq/single-faq/why-do-i-get-different-results-each-time-i-run-the-code
thanks for your answer 🙂
You’re welcome.
Another good post of you Jason, It really helps me in studying Machine Learning by constructing algorithm from scratch.
Thank you very much.
Thanks.
I need to solve a simple KNN code for my course. Can you please send me your email so I can send you the file ? I have to submit today 🙁
I don’t have the capacity to review your code/data:
https://machinelearningmastery.com/faq/single-faq/can-you-read-review-or-debug-my-code
Dear Jason,
I need to calculate the distance between each row and its 25 neighbors and store them as columns fir my project. how can I do, I have tried the following codes but it does not work.
distances =list()
for i in range(600):
row0 = dataset[i]
for row in dataset:
dist = euclidean_distance(row0, row)
distances.append((row, dist))
distances.sort(key=lambda tup: tup[1])
thank in advance
Perhaps this will help:
https://machinelearningmastery.com/distance-measures-for-machine-learning/
why cant i convert string columns into float ?
ValueError: could not convert string to float: ‘Id’
I’m facing
same code copy pasted
If the string contains a float, you can.
If the string contains characters, you will have to encode them such as an ordinal encode, one hot encode for labels or bag of words for free text.
Hi Jason,
Your tutorial is always so helpful. I just have a question here. When we implement the cross_validation_split, the randrange() was used to generate a single random value to locate the row of dataset. Will this random value repeated? If so, will some rows appears several times in some folds and some rows never used?
The indexes selected for each fold are removed to ensure they cannot be reselected, see the call to pop().
Yes, thank you very much!
You’re welcome.
Hi Jason,
Sorry another quesion.
Can I ask what’s the purpose of the step
‘rain_set = sum(train_set, []) ‘
Thank you very much.
Hello great tutorial, you explained the concept well.Please the problem I am trying to solve is for blood classification, where a user desires to search for a particular blood group and the system automatically detects that and displays the result alongside suggestions of other blood groups the user can collect blood from …Please is this possible using KNN
Thanks.
It might be possible, perhaps develop a prototype to explore the idea.
Hi Jason,
Thank you very much for putting this together, it has helped me implement one from scratch with my targets(class) and data sperated into two seperate lists.
I am trying to implement Nested cross validation using your code, but I can’t seem to figure out how to go about it. Can you please provide some insight and code on how to do that by expanding on your evaluate_algorithm function? Also what is the purpose of line 78 in the evaluate_algorithm function and what does do?
I am new to machine learning.
You’re welcome.
Perhaps this will give you some ideas:
https://machinelearningmastery.com/nested-cross-validation-for-machine-learning-with-python/
Thanks again Jason.
Hi Jason,
Thank you very much for this. I ran this part
def evaluate_algorithm(X, algorithm, K, k):
folds = CrossValidationSplit(X, K)
traindata=folds
scores = list()
for fold in folds:
traindata.remove(fold)
traindata = sum(traindata, [])
testdata = list()
for row in fold:
r = list(row)
testdata.append(r)
r[-1] = None
predicted = algorithm(traindata, testdata, k)
actual = [row[-1] for row in fold]
accuracy = accuracy_metric(actual, predicted)
scores.append(accuracy)
return scores, traindata, testdata, actual
and get an error, can you help me please?
ValueError: The truth value of an array with more than one element is ambiguous. Use a.any() or a.all()
These tips will help:
https://machinelearningmastery.com/faq/single-faq/why-does-the-code-in-the-tutorial-not-work-for-me
Hi Team,
I was going through the pseudo-code of K-NN. The first step involved calculating the euclidean distance.
1
2
3
4
5
6
7
X1 X2 Y
2.7810836 2.550537003 0
1.465489372 2.362125076 0
3.396561688 4.400293529 0
1.38807019 1.850220317 0
3.06407232 3.005305973 0
7.627531214 2.759262235 1
In the above data, we are given X1 and X2. And while calculating euclidean distance they are calculating euclidean distance between x1 and x2 but I believe x1 and x2 are two features of a point. And why are we calculating the distance between x1 and x2 these are the two features not two points. Also the plot shown above conveys the same.
Request you to please clarify
Yes, the same idea scales up to any number of features.
Hello Jason,
Was just going through your code, could you explain why did you use range(len(row1)-1) in your euclidean distance code rather than range(len(row1)).
The final values of Euclidean distance over the test set you had provided above are different
for me since you haven’t included the last column from your list.
I am still learning ML and need to understand why the column containing the integer values has been left out while computing the distance in your implementation?
# Test distance function
dataset = [[2.7810836,2.550537003,0],
[1.465489372,2.362125076,0],
[3.396561688,4.400293529,0],
[1.38807019,1.850220317,0],
[3.06407232,3.005305973,0],
[7.627531214,2.759262235,1],
[5.332441248,2.088626775,1],
[6.922596716,1.77106367,1],
[8.675418651,-0.242068655,1],
[7.673756466,3.508563011,1]]
I came across this while I was trying to create a vectorized implementation of your euclidean distance function which is as follows:
My Vectorized Implementation:
def euclediandist(vec1,vec2):
“””
Calculates the eucledian distance between two vectors/points.
Parameters
———-
vec1 : array_like
Data point values for a 1st vector/point
vec2 : array_like
Data point values for a 2nd vector/point
Returns
——-
dist : float
The eucledian distance between 2 vectors.
Instructions
————
Calculate the eucledian distance between two vectors/points
“””
dist=0.0
print(“Difference of vectors:”,vec2-vec1)
print(“Sqaure of Difference:”,np.square(vec2-vec1))
print(“Sum of Sqaure of Difference:”,np.sum(np.square(vec2-vec1)))
print(“Sqrt of Sum of Sqaure of Difference:”,np.sqrt(np.sum(np.square(vec2-vec1))))
print(‘—————————————————————————‘)
dist = np.sqrt(np.sum(np.square(vec2-vec1)))
return dist
________________________________________________________________________
Function Call:
# Retaining Precesion in numpy
np.set_printoptions(precision=17)
dataset_np = np.asarray(dataset)
for i in dataset_np:
euclediandist(dataset_np[0],i)
_________________________________________________________________________
Output:
Difference if vectors: [0. 0. 0.]
Sqaure of Difference: [0. 0. 0.]
Sum of Sqaure of Difference: 0.0
Sqrt of Sum of Sqaure of Difference: 0.0
—————————————————————————
Difference if vectors: [-1.3155942280000001 -0.1884119270000002 0. ]
Sqaure of Difference: [1.7307881727469163 0.0354990542358534 0. ]
Sum of Sqaure of Difference: 1.7662872269827696
Sqrt of Sum of Sqaure of Difference: 1.3290173915275787
—————————————————————————
Difference if vectors: [0.6154780879999997 1.8497565259999997 0. ]
Sqaure of Difference: [0.37881327680813537 3.4215992054795876 0. ]
Sum of Sqaure of Difference: 3.800412482287723
Sqrt of Sum of Sqaure of Difference: 1.9494646655653247
—————————————————————————
Difference if vectors: [-1.39301341 -0.7003166860000001 0. ]
Sqaure of Difference: [1.9404863604398281 0.4904434606900227 0. ]
Sum of Sqaure of Difference: 2.4309298211298507
Sqrt of Sum of Sqaure of Difference: 1.5591439385540549
—————————————————————————
Difference if vectors: [0.2829887200000001 0.45476896999999994 0. ]
Sqaure of Difference: [0.08008261564723845 0.20681481607486085 0. ]
Sum of Sqaure of Difference: 0.2868974317220993
Sqrt of Sum of Sqaure of Difference: 0.5356280721938492
—————————————————————————
Difference if vectors: [4.846447614000001 0.20872523199999993 1. ]
Sqaure of Difference: [23.488054475246297 0.04356622247345379 1. ]
Sum of Sqaure of Difference: 24.531620697719752
Sqrt of Sum of Sqaure of Difference: 4.952940611164215
—————————————————————————
Difference if vectors: [ 2.551357648 -0.46191022800000026 1. ]
Sqaure of Difference: [6.509425848008093 0.21336105873101222 1. ]
Sum of Sqaure of Difference: 7.722786906739105
Sqrt of Sum of Sqaure of Difference: 2.7789902674782985
—————————————————————————
Difference if vectors: [ 4.1415131160000005 -0.7794733330000001 1. ]
Sqaure of Difference: [17.152130890000034 0.607578676858129 1. ]
Sum of Sqaure of Difference: 18.759709566858163
Sqrt of Sum of Sqaure of Difference: 4.3312480380207
—————————————————————————
Difference if vectors: [ 5.894335050999999 -2.7926056580000003 1. ]
Sqaure of Difference: [34.74318569344716 7.798646361093614 1. ]
Sum of Sqaure of Difference: 43.54183205454078
Sqrt of Sum of Sqaure of Difference: 6.59862349695304
—————————————————————————
Difference if vectors: [4.892672866 0.958026008 1. ]
Sqaure of Difference: [23.938247773692652 0.9178138320044161 1. ]
Sum of Sqaure of Difference: 25.856061605697068
Sqrt of Sum of Sqaure of Difference: 5.084885603993178
—————————————————————————
Are taking your last column as a response variable in the test data below
dataset = [[2.7810836,2.550537003,0],
[1.465489372,2.362125076,0],
[3.396561688,4.400293529,0],
[1.38807019,1.850220317,0],
[3.06407232,3.005305973,0],
[7.627531214,2.759262235,1],
[5.332441248,2.088626775,1],
[6.922596716,1.77106367,1],
[8.675418651,-0.242068655,1],
[7.673756466,3.508563011,1]]
We exclude the last value in the vector/row as it is the class label.
Thanks for the quick reply!
can you help me to make KNN with cosine similarity ??
Sorry, I don’t have an example.
Perhaps start with the above example and implement your cosine distance metric instead of euclidean.
Much appreciate, Jason! Just cited you in my graduate work.
Thanks Ted!
Hey Jason,
Great article! So well written -This is very helpful article for everyone. I wish to read more article from you! Thanks for sharing this valuable information!
Thanks!
This was really an interesting topic and I kinda agree with what you have mentioned here!
Thanks!
i’m fairly new to python and this really helped me understand!! But i’m unsure on how to do plotting … i”d like to show : the num of k vs accuracy
Sorry, I don’t have tutorials on the basics of plotting.
Perhaps check the matplotlib API.
I no vulnerability regarding every single piece of it. It is a stunning site and better than anything typical give. I need to appreciative. Magnificent work! All of you complete an impossible blog, and have some unprecedented substance. Continue doing shocking.
Thanks.
I am a beginner in Python, this article is very helpful for me. Thanks for sharing this content and looking more such interesting topics.
Thanks. Glad you enjoyed it.
hi
ihave question ?
can I visulize voroni for the list data set after classificaion ?
I want to make Voronoi diagram for vectors(list ) of the dataset with knn classifier
is that possible?
No example here yet but you can check out a handy function from SciPy that can help you do the plot: https://docs.scipy.org/doc/scipy/reference/generated/scipy.spatial.voronoi_plot_2d.html
I have browsed most of your posts. This post is probably where I got the most useful information for my research
Thank you for the feedback Nclex!
Really nice and interesting post. I was looking for this kind of information and enjoyed reading this one.
Thank you for the feedback!
Hey, I am having an error that says ” could not convert string to float: ‘sepallength’ “.
Any idea on why is it not working and tips on fixing it?
Hi Yusuf…The following may be of interest to you:
https://itsmycode.com/python-valueerror-could-not-convert-string-to-float/
Can you show us how to write a function for Manhattan distance?
Hi Hoi Yu Ng…The following may be of interest:
https://machinelearningmastery.com/distance-measures-for-machine-learning/
That’s a lot. I have read it.
Really helpful article all about the python from scratch! You really have a great stuff on this topic! Thanks for the valuable information…
Great feedback Shein!
Thanks for your post. I’ve been thinking about writing a very comparable post over the last couple of weeks, I’ll probably keep it short and sweet and link to this instead if thats cool. Thanks.
Thank you for your feedback satta!
Yooo thanks for the tutorial man, really love it. god bless your knowledge
Thank you hokiwin for your kind words and support! We greatly appreciate it!
Hello Dr.Jason
Thanks a lot for all your effort , I tried to reimplement the whole experiment over Iris dataset , however I got
Error “list index out of range”
for i in range(len(actual)):
—> 67 if actual[i] == predicted[i]:
68 correct += 1
69 return correct / float(len(actual)) * 100.0
IndexError: list index out of range
I tried to fix the error like that:
for i in range(min(len(actual),len(predicted))):
if actual[i] == predicted[i]:
correct += 1
return correct / float(len(actual)) * 100.0
I got :
Scores: [3.3333333333333335]
Mean Accuracy: 3.333%
I didn’t get the same results as you 96%. Your help and effort is much appreciated If you could help me discover the issue.
Alaa
PhD student
Hi Alaa…Did you copy and paste the code or type it in? Also, have you tried your code within Google Colab and within your local Python environemnt?
Hi Dr.James, I sent two replies but they didn’t appear on the site. I already typed the code and applied on the Google Colab, but I got the same problem. Any other advice or suggestions will be much appreciated.
ALAA
Excellent article. Thanks for sharing.
Thank you your feedback! We appreciate it!