Do you want to do machine learning using Python, but you’re having trouble getting started?
In this post, you will complete your first machine learning project using Python.
In this step-by-step tutorial you will:
Download and install Python SciPy and get the most useful package for machine learning in Python.
Load a dataset and understand it’s structure using statistical summaries and data visualization.
Create 6 machine learning models, pick the best and build confidence that the accuracy is reliable.
If you are a machine learning beginner and looking to finally get started using Python, this tutorial was designed for you.
Kick-start your project with my new book Machine Learning Mastery With Python, including step-by-step tutorials and the Python source code files for all examples.
Let’s get started!
Update Jan/2017: Updated to reflect changes to the scikit-learn API in version 0.18.
Update Mar/2017: Added links to help setup your Python environment.
Update Apr/2018: Added some helpful links about randomness and predicting.
Update Sep/2018: Added link to my own hosted version of the dataset.
Update Feb/2019: Updated for sklearn v0.20, also updated plots.
Update Oct/2019: Added links at the end to additional tutorials to continue on.
Update Nov/2019: Added full code examples for each section.
Update Dec/2019: Updated examples to remove warnings due to API changes in v0.22.
Update Jan/2020: Updated to remove the snippet for the test harness.
Your First Machine Learning Project in Python Step-By-Step Photo by Daniel Bernard. Some rights reserved.
How Do You Start Machine Learning in Python?
The best way to learn machine learning is by designing and completing small projects.
Python Can Be Intimidating When Getting Started
Python is a popular and powerful interpreted language. Unlike R, Python is a complete language and platform that you can use for both research and development and developing production systems.
There are also a lot of modules and libraries to choose from, providing multiple ways to do each task. It can feel overwhelming.
The best way to get started using Python for machine learning is to complete a project.
It will force you to install and start the Python interpreter (at the very least).
It will given you a bird’s eye view of how to step through a small project.
It will give you confidence, maybe to go on to your own small projects.
Beginners Need A Small End-to-End Project
Books and courses are frustrating. They give you lots of recipes and snippets, but you never get to see how they all fit together.
When you are applying machine learning to your own datasets, you are working on a project.
A machine learning project may not be linear, but it has a number of well known steps:
Define Problem.
Prepare Data.
Evaluate Algorithms.
Improve Results.
Present Results.
The best way to really come to terms with a new platform or tool is to work through a machine learning project end-to-end and cover the key steps. Namely, from loading data, summarizing data, evaluating algorithms and making some predictions.
If you can do that, you have a template that you can use on dataset after dataset. You can fill in the gaps such as further data preparation and improving result tasks later, once you have more confidence.
Hello World of Machine Learning
The best small project to start with on a new tool is the classification of iris flowers (e.g. the iris dataset).
This is a good project because it is so well understood.
Attributes are numeric so you have to figure out how to load and handle data.
It is a classification problem, allowing you to practice with perhaps an easier type of supervised learning algorithm.
It is a multi-class classification problem (multi-nominal) that may require some specialized handling.
It only has 4 attributes and 150 rows, meaning it is small and easily fits into memory (and a screen or A4 page).
All of the numeric attributes are in the same units and the same scale, not requiring any special scaling or transforms to get started.
Let’s get started with your hello world machine learning project in Python.
Machine Learning in Python: Step-By-Step Tutorial
(start here)
In this section, we are going to work through a small machine learning project end-to-end.
Here is an overview of what we are going to cover:
Installing the Python and SciPy platform.
Loading the dataset.
Summarizing the dataset.
Visualizing the dataset.
Evaluating some algorithms.
Making some predictions.
Take your time. Work through each step.
Try to type in the commands yourself or copy-and-paste the commands to speed things up.
If you have any questions at all, please leave a comment at the bottom of the post.
Need help with Machine Learning in Python?
Take my free 2-week email course and discover data prep, algorithms and more (with code).
Click to sign-up now and also get a free PDF Ebook version of the course.
1. Downloading, Installing and Starting Python SciPy
Get the Python and SciPy platform installed on your system if it is not already.
I do not want to cover this in great detail, because others already have. This is already pretty straightforward, especially if you are a developer. If you do need help, ask a question in the comments.
1.1 Install SciPy Libraries
This tutorial assumes Python version 3.6+.
There are 5 key libraries that you will need to install. Below is a list of the Python SciPy libraries required for this tutorial:
scipy
numpy
matplotlib
pandas
sklearn
There are many ways to install these libraries. My best advice is to pick one method then be consistent in installing each library.
The scipy installation page provides excellent instructions for installing the above libraries on multiple different platforms, such as Linux, mac OS X and Windows. If you have any doubts or questions, refer to this guide, it has been followed by thousands of people.
On Mac OS X, you can use homebrew to install newer versions of Python 3 and these libraries. For more information on homebrew, see the homepage.
On Linux you can use your package manager, such as yum on Fedora to install RPMs.
If you are on Windows or you are not confident, I would recommend installing the free version of Anaconda that includes everything you need.
Note: This tutorial assumes you have scikit-learn version 0.20 or higher installed.
It is a good idea to make sure your Python environment was installed successfully and is working as expected.
The script below will help you test out your environment. It imports each library required in this tutorial and prints the version.
Open a command line and start the python interpreter:
1
python3
I recommend working directly in the interpreter or writing your scripts and running them on the command line rather than big editors and IDEs. Keep things simple and focus on the machine learning not the toolchain.
[GCC 4.2.1 Compatible Apple LLVM 9.1.0 (clang-902.0.39.2)]
scipy: 1.5.2
numpy: 1.19.1
matplotlib: 3.3.0
pandas: 1.1.0
sklearn: 0.23.2
Compare the above output to your versions.
Ideally, your versions should match or be more recent. The APIs do not change quickly, so do not be too concerned if you are a few versions behind, Everything in this tutorial will very likely still work for you.
If you get an error, stop. Now is the time to fix it.
If you cannot run the above script cleanly you will not be able to complete this tutorial.
My best advice is to Google search for your error message or post a question on Stack Exchange.
2. Load The Data
We are going to use the iris flowers dataset. This dataset is famous because it is used as the “hello world” dataset in machine learning and statistics by pretty much everyone.
The dataset contains 150 observations of iris flowers. There are four columns of measurements of the flowers in centimeters. The fifth column is the species of the flower observed. All observed flowers belong to one of three species.
In this step we are going to load the iris data from CSV file URL.
2.1 Import libraries
First, let’s import all of the modules, functions and objects we are going to use in this tutorial.
1
2
3
4
5
6
7
8
9
10
11
12
13
14
15
16
17
# Load libraries
from pandas import read_csv
from pandas.plotting import scatter_matrix
from matplotlib import pyplot asplt
from sklearn.model_selection import train_test_split
from sklearn.model_selection import cross_val_score
from sklearn.model_selection import StratifiedKFold
from sklearn.metrics import classification_report
from sklearn.metrics import confusion_matrix
from sklearn.metrics import accuracy_score
from sklearn.linear_model import LogisticRegression
from sklearn.tree import DecisionTreeClassifier
from sklearn.neighbors import KNeighborsClassifier
from sklearn.discriminant_analysis import LinearDiscriminantAnalysis
from sklearn.naive_bayes import GaussianNB
from sklearn.svm import SVC
...
Everything should load without error. If you have an error, stop. You need a working SciPy environment before continuing. See the advice above about setting up your environment.
2.2 Load Dataset
We can load the data directly from the UCI Machine Learning repository.
We are using pandas to load the data. We will also use pandas next to explore the data both with descriptive statistics and data visualization.
Note that we are specifying the names of each column when loading the data. This will help later when we explore the data.
If you do have network problems, you can download the iris.csv file into your working directory and load it using the same method, changing URL to the local file name.
3. Summarize the Dataset
Now it is time to take a look at the data.
In this step we are going to take a look at the data a few different ways:
Dimensions of the dataset.
Peek at the data itself.
Statistical summary of all attributes.
Breakdown of the data by the class variable.
Don’t worry, each look at the data is one command. These are useful commands that you can use again and again on future projects.
3.1 Dimensions of Dataset
We can get a quick idea of how many instances (rows) and how many attributes (columns) the data contains with the shape property.
1
2
3
...
# shape
print(dataset.shape)
You should see 150 instances and 5 attributes:
1
(150, 5)
3.2 Peek at the Data
It is also always a good idea to actually eyeball your data.
1
2
3
...
# head
print(dataset.head(20))
You should see the first 20 rows of the data:
1
2
3
4
5
6
7
8
9
10
11
12
13
14
15
16
17
18
19
20
21
sepal-length sepal-width petal-length petal-width class
0 5.1 3.5 1.4 0.2 Iris-setosa
1 4.9 3.0 1.4 0.2 Iris-setosa
2 4.7 3.2 1.3 0.2 Iris-setosa
3 4.6 3.1 1.5 0.2 Iris-setosa
4 5.0 3.6 1.4 0.2 Iris-setosa
5 5.4 3.9 1.7 0.4 Iris-setosa
6 4.6 3.4 1.4 0.3 Iris-setosa
7 5.0 3.4 1.5 0.2 Iris-setosa
8 4.4 2.9 1.4 0.2 Iris-setosa
9 4.9 3.1 1.5 0.1 Iris-setosa
10 5.4 3.7 1.5 0.2 Iris-setosa
11 4.8 3.4 1.6 0.2 Iris-setosa
12 4.8 3.0 1.4 0.1 Iris-setosa
13 4.3 3.0 1.1 0.1 Iris-setosa
14 5.8 4.0 1.2 0.2 Iris-setosa
15 5.7 4.4 1.5 0.4 Iris-setosa
16 5.4 3.9 1.3 0.4 Iris-setosa
17 5.1 3.5 1.4 0.3 Iris-setosa
18 5.7 3.8 1.7 0.3 Iris-setosa
19 5.1 3.8 1.5 0.3 Iris-setosa
3.3 Statistical Summary
Now we can take a look at a summary of each attribute.
This includes the count, mean, the min and max values as well as some percentiles.
1
2
3
...
# descriptions
print(dataset.describe())
We can see that all of the numerical values have the same scale (centimeters) and similar ranges between 0 and 8 centimeters.
1
2
3
4
5
6
7
8
9
sepal-length sepal-width petal-length petal-width
count 150.000000 150.000000 150.000000 150.000000
mean 5.843333 3.054000 3.758667 1.198667
std 0.828066 0.433594 1.764420 0.763161
min 4.300000 2.000000 1.000000 0.100000
25% 5.100000 2.800000 1.600000 0.300000
50% 5.800000 3.000000 4.350000 1.300000
75% 6.400000 3.300000 5.100000 1.800000
max 7.900000 4.400000 6.900000 2.500000
3.4 Class Distribution
Let’s now take a look at the number of instances (rows) that belong to each class. We can view this as an absolute count.
1
2
3
...
# class distribution
print(dataset.groupby('class').size())
We can see that each class has the same number of instances (50 or 33% of the dataset).
1
2
3
4
class
Iris-setosa 50
Iris-versicolor 50
Iris-virginica 50
3.5 Complete Example
For reference, we can tie all of the previous elements together into a single script.
This gives us a much clearer idea of the distribution of the input attributes:
Box and Whisker Plots for Each Input Variable for the Iris Flowers Dataset
We can also create a histogram of each input variable to get an idea of the distribution.
1
2
3
4
...
# histograms
dataset.hist()
plt.show()
It looks like perhaps two of the input variables have a Gaussian distribution. This is useful to note as we can use algorithms that can exploit this assumption.
Histogram Plots for Each Input Variable for the Iris Flowers Dataset
4.2 Multivariate Plots
Now we can look at the interactions between the variables.
First, let’s look at scatterplots of all pairs of attributes. This can be helpful to spot structured relationships between input variables.
1
2
3
4
...
# scatter plot matrix
scatter_matrix(dataset)
plt.show()
Note the diagonal grouping of some pairs of attributes. This suggests a high correlation and a predictable relationship.
Scatter Matrix Plot for Each Input Variable for the Iris Flowers Dataset
4.3 Complete Example
For reference, we can tie all of the previous elements together into a single script.
Now it is time to create some models of the data and estimate their accuracy on unseen data.
Here is what we are going to cover in this step:
Separate out a validation dataset.
Set-up the test harness to use 10-fold cross validation.
Build multiple different models to predict species from flower measurements
Select the best model.
5.1 Create a Validation Dataset
We need to know that the model we created is good.
Later, we will use statistical methods to estimate the accuracy of the models that we create on unseen data. We also want a more concrete estimate of the accuracy of the best model on unseen data by evaluating it on actual unseen data.
That is, we are going to hold back some data that the algorithms will not get to see and we will use this data to get a second and independent idea of how accurate the best model might actually be.
We will split the loaded dataset into two, 80% of which we will use to train, evaluate and select among our models, and 20% that we will hold back as a validation dataset.
We will use stratified 10-fold cross validation to estimate model accuracy.
This will split our dataset into 10 parts, train on 9 and test on 1 and repeat for all combinations of train-test splits.
Stratified means that each fold or split of the dataset will aim to have the same distribution of example by class as exist in the whole training dataset.
For more on the k-fold cross-validation technique, see the tutorial:
We set the random seed via the random_state argument to a fixed number to ensure that each algorithm is evaluated on the same splits of the training dataset.
The specific random seed does not matter, learn more about pseudorandom number generators here:
We are using the metric of ‘accuracy‘ to evaluate models.
This is a ratio of the number of correctly predicted instances divided by the total number of instances in the dataset multiplied by 100 to give a percentage (e.g. 95% accurate). We will be using the scoring variable when we run build and evaluate each model next.
5.3 Build Models
We don’t know which algorithms would be good on this problem or what configurations to use.
We get an idea from the plots that some of the classes are partially linearly separable in some dimensions, so we are expecting generally good results.
Let’s test 6 different algorithms:
Logistic Regression (LR)
Linear Discriminant Analysis (LDA)
K-Nearest Neighbors (KNN).
Classification and Regression Trees (CART).
Gaussian Naive Bayes (NB).
Support Vector Machines (SVM).
This is a good mixture of simple linear (LR and LDA), nonlinear (KNN, CART, NB and SVM) algorithms.
We now have 6 models and accuracy estimations for each. We need to compare the models to each other and select the most accurate.
Running the example above, we get the following raw results:
1
2
3
4
5
6
LR: 0.960897 (0.052113)
LDA: 0.973974 (0.040110)
KNN: 0.957191 (0.043263)
CART: 0.957191 (0.043263)
NB: 0.948858 (0.056322)
SVM: 0.983974 (0.032083)
Note: Your results may vary given the stochastic nature of the algorithm or evaluation procedure, or differences in numerical precision. Consider running the example a few times and compare the average outcome.
What scores did you get?
Post your results in the comments below.
In this case, we can see that it looks like Support Vector Machines (SVM) has the largest estimated accuracy score at about 0.98 or 98%.
We can also create a plot of the model evaluation results and compare the spread and the mean accuracy of each model. There is a population of accuracy measures for each algorithm because each algorithm was evaluated 10 times (via 10 fold-cross validation).
A useful way to compare the samples of results for each algorithm is to create a box and whisker plot for each distribution and compare the distributions.
1
2
3
4
5
...
# Compare Algorithms
plt.boxplot(results,labels=names)
plt.title('Algorithm Comparison')
plt.show()
We can see that the box and whisker plots are squashed at the top of the range, with many evaluations achieving 100% accuracy, and some pushing down into the high 80% accuracies.
Box and Whisker Plot Comparing Machine Learning Algorithms on the Iris Flowers Dataset
5.5 Complete Example
For reference, we can tie all of the previous elements together into a single script.
The complete example is listed below.
1
2
3
4
5
6
7
8
9
10
11
12
13
14
15
16
17
18
19
20
21
22
23
24
25
26
27
28
29
30
31
32
33
34
35
36
37
38
39
40
41
42
# compare algorithms
from pandas import read_csv
from matplotlib import pyplot asplt
from sklearn.model_selection import train_test_split
from sklearn.model_selection import cross_val_score
from sklearn.model_selection import StratifiedKFold
from sklearn.linear_model import LogisticRegression
from sklearn.tree import DecisionTreeClassifier
from sklearn.neighbors import KNeighborsClassifier
from sklearn.discriminant_analysis import LinearDiscriminantAnalysis
We must choose an algorithm to use to make predictions.
The results in the previous section suggest that the SVM was perhaps the most accurate model. We will use this model as our final model.
Now we want to get an idea of the accuracy of the model on our validation set.
This will give us an independent final check on the accuracy of the best model. It is valuable to keep a validation set just in case you made a slip during training, such as overfitting to the training set or a data leak. Both of these issues will result in an overly optimistic result.
6.1 Make Predictions
We can fit the model on the entire training dataset and make predictions on the validation dataset.
1
2
3
4
5
...
# Make predictions on validation dataset
model=SVC(gamma='auto')
model.fit(X_train,Y_train)
predictions=model.predict(X_validation)
You might also like to make predictions for single rows of data. For examples on how to do that, see the tutorial:
We can evaluate the predictions by comparing them to the expected results in the validation set, then calculate classification accuracy, as well as a confusion matrix and a classification report.
We can see that the accuracy is 0.966 or about 96% on the hold out dataset.
The confusion matrix provides an indication of the errors made.
Finally, the classification report provides a breakdown of each class by precision, recall, f1-score and support showing excellent results (granted the validation dataset was small).
1
2
3
4
5
6
7
8
9
10
11
12
13
0.9666666666666667
[[11 0 0]
[ 0 12 1]
[ 0 0 6]]
precision recall f1-score support
Iris-setosa 1.00 1.00 1.00 11
Iris-versicolor 1.00 0.92 0.96 13
Iris-virginica 0.86 1.00 0.92 6
accuracy 0.97 30
macro avg 0.95 0.97 0.96 30
weighted avg 0.97 0.97 0.97 30
6.3 Complete Example
For reference, we can tie all of the previous elements together into a single script.
The complete example is listed below.
1
2
3
4
5
6
7
8
9
10
11
12
13
14
15
16
17
18
19
20
21
22
23
24
# make predictions
from pandas import read_csv
from sklearn.model_selection import train_test_split
Work through the tutorial above. It will take you 5-to-10 minutes, max!
You do not need to understand everything. (at least not right now) Your goal is to run through the tutorial end-to-end and get a result. You do not need to understand everything on the first pass. List down your questions as you go. Make heavy use of the help(“FunctionName”) help syntax in Python to learn about all of the functions that you’re using.
You do not need to know how the algorithms work. It is important to know about the limitations and how to configure machine learning algorithms. But learning about algorithms can come later. You need to build up this algorithm knowledge slowly over a long period of time. Today, start off by getting comfortable with the platform.
You do not need to be a Python programmer. The syntax of the Python language can be intuitive if you are new to it. Just like other languages, focus on function calls (e.g. function()) and assignments (e.g. a = “b”). This will get you most of the way. You are a developer, you know how to pick up the basics of a language real fast. Just get started and dive into the details later.
You do not need to be a machine learning expert. You can learn about the benefits and limitations of various algorithms later, and there are plenty of posts that you can read later to brush up on the steps of a machine learning project and the importance of evaluating accuracy using cross validation.
What about other steps in a machine learning project. We did not cover all of the steps in a machine learning project because this is your first project and we need to focus on the key steps. Namely, loading data, looking at the data, evaluating some algorithms and making some predictions. In later tutorials we can look at other data preparation and result improvement tasks.
Summary
In this post, you discovered step-by-step how to complete your first machine learning project in Python.
You discovered that completing a small end-to-end project from loading the data to making predictions is the best way to get familiar with a new platform.
Your Next Step
Do you work through the tutorial?
Work through the above tutorial.
List any questions you have.
Search-for or research the answers.
Remember, you can use the help(“FunctionName”) in Python to get help on any function.
Do you have a question?
Post it in the comments below.
More Tutorials?
Looking to continue to practice your machine learning skills, take a look at some of these tutorials:
I generally don’t cover unsupervised methods like clustering and projection methods.
This is because I mainly focus on and teach predictive modeling (e.g. classification and regression) and I just don’t find unsupervised methods that useful.
~\Anaconda3\lib\site-packages\sklearn\externals\joblib\parallel.py in _dispatch(self, batch)
714 with self._lock:
715 job_idx = len(self._jobs)
–> 716 job = self._backend.apply_async(batch, callback=cb)
717 # A job can complete so quickly than its callback is
718 # called before we get here, causing self._jobs to
~\Anaconda3\lib\site-packages\sklearn\externals\joblib\_parallel_backends.py in apply_async(self, func, callback)
180 def apply_async(self, func, callback=None):
181 “””Schedule a func to be run”””
–> 182 result = ImmediateResult(func)
183 if callback:
184 callback(result)
~\Anaconda3\lib\site-packages\sklearn\externals\joblib\_parallel_backends.py in __init__(self, batch)
547 # Don’t delay the application, to avoid keeping the input
548 # arguments in memory
–> 549 self.results = batch()
550
551 def get(self):
~\Anaconda3\lib\site-packages\sklearn\externals\joblib\parallel.py in __call__(self)
223 with parallel_backend(self._backend, n_jobs=self._n_jobs):
224 return [func(*args, **kwargs)
–> 225 for func, args, kwargs in self.items]
226
227 def __len__(self):
~\Anaconda3\lib\site-packages\sklearn\externals\joblib\parallel.py in (.0)
223 with parallel_backend(self._backend, n_jobs=self._n_jobs):
224 return [func(*args, **kwargs)
–> 225 for func, args, kwargs in self.items]
226
227 def __len__(self):
Many thanks for this project. It is a very good starting point for me on predictive models. This is what I got. Do you have predictive models on Customer/Product/Market segmentation models?
The API may have changed since I wrote this post. This in turn may have resulted in small changes in predictions that are perhaps not statistically significant.
I also have the same result.
LR: 0.966667 (0.040825)
LDA: 0.975000 (0.038188)
KNN: 0.983333 (0.033333)
CART: 0.983333 (0.033333)
NB: 0.975000 (0.053359)
SVM: 0.991667 (0.025000)
I think cv may be equal to the number of times you want to perform k-fold cross validation for e.g. 10,20etc. and in scoring parameter, you need to mention which type of scoring parameter you want to use for example ‘accuracy’.
Hope this might help….
Hi Jason
I followed your steps but I’m getting error. What should I do? Best regards
>>> # Spot Check Algorithms
… models = []
>>> models.append((‘LR’, LogisticRegression(solver=’liblinear’, multi_class=’ovr’)))
>>> models.append((‘LDA’, LinearDiscriminantAnalysis()))
>>> models.append((‘KNN’, KNeighborsClassifier()))
>>> models.append((‘CART’, DecisionTreeClassifier()))
>>> models.append((‘NB’, GaussianNB()))
>>> models.append((‘SVM’, SVC(gamma=’auto’)))
>>> # evaluate each model in turn
… results = []
>>> names = []
>>> for name, model in models:
… kfold = StratifiedKFold(n_splits=10, random_state=1, shuffle=True)
File “”, line 2
kfold = StratifiedKFold(n_splits=10, random_state=1, shuffle=True)
^
IndentationError: expected an indented block
>>> cv_results = cross_val_score(model, X_train, Y_train, cv=kfold, scoring=’accuracy’)
Traceback (most recent call last):
File “”, line 1, in
NameError: name ‘model’ is not defined
>>> results.append(cv_results)
Traceback (most recent call last):
File “”, line 1, in
NameError: name ‘cv_results’ is not defined
sir i want to work on crop prices data for crop price pridiction project for my minor project but the crop price data does not find plese help me sir and send me crop price csv file link
Hello Jason,
Thank you for this amazing tutorial, it helped me to gain confidence:
Please see my results:
LR: 0.941667 (0.065085)
LDA: 0.975000 (0.038188)
KNN: 0.958333 (0.041667)
NB: 0.950000 (0.055277)
SVM: 0.983333 (0.033333)
The program runs through, but the calculated result is that CART and SVM have the highest accuracy
LR: 0.966667 (0.040825)
LDA: 0.975000 (0.053359)
KNN: 0.983333 (0.050000)
CART: 0.991667 (0.025000)
NB: 0.975000 (0.038188)
SVM: 0.991667 (0.025000)
I have installed all libraries that were in your How to Setup Python environment… blog. All went fine but when i run the starting imports code I get error at first line “ModuleNotFoundError: No module named ‘pandas'”. But I did installl it using “pip install pandas” command. I am working on a windows machine.
Hasnain, try setting the environment variable PYTHON_PATH and PATH to include the path to the site packages of the version of python you have permission to alter
I am starting at square 0, and after clearing a first few hurdles, I was not even able to install the libraries at all… (as a newb), I didn’t see where I even GO to import this:
# Load libraries
import pandas
from pandas.tools.plotting import scatter_matrix
import matplotlib.pyplot as plt
from sklearn import model_selection
from sklearn.metrics import classification_report
from sklearn.metrics import confusion_matrix
from sklearn.metrics import accuracy_score
from sklearn.linear_model import LogisticRegression
from sklearn.tree import DecisionTreeClassifier
from sklearn.neighbors import KNeighborsClassifier
from sklearn.discriminant_analysis import LinearDiscriminantAnalysis
from sklearn.naive_bayes import GaussianNB
from sklearn.svm import SVC
Hi Tanya,
This tutorial is so intuitive that I went through this tutorial with a breeze.
Install PyCharm from JetBrains available here https://www.jetbrains.com/pycharm/download/download-thanks.html?platform=windows&code=PCC
Install PIP (The de-facto python package manager) and then click “Terminal” in PyCharm to bring up the interactive DOS like terminal. Once you have installed PIP then there you can issue the following commands:
pip install numpy
pip install scipy
pip install matplotlib
pip install pandas
pip install sklearn
All other steps in the tutorial are valid and do not need a single line of change apart from where its mentioned
from pandas.tools.plotting import scatter_matrix , change it to
For a beginner i believe Anacondas Jupyter notebooks would be the best option. As they can include markdown for future reference which is essential as beginner (backpropogation :p). But again varies person to person
I also did a similar mistake, I am also a newbie to python, and wrote those import statements in the separate file, and imported the created file, without knowing how imports work…after your reply realized my mistake and now back on track thanks!
I also had problems installing modules on windows. Although, there was no error of any kind if installed from PyCharm IDE.
Also, use 32-bit python interpreter if you wanna use NLTK. It can be done even on 64-bit version, but was not worth the time it would it need.
If you are working on virtual environment then you have to make script first and run it by activating the virtual environment,
If you are not working on virtual environment then run your scripts on time
I like your tutorial for the machine learning in python but at this moment I am stuck. Here is where I am
# Compare Algorithms
fig = plt.figure()
fig.suptitle(‘Algorithm Comparison’)
ax = fig.add_subplot(111)
plt.boxplot(results)
ax.set_xticklabels(names)
plt.show()
Jason nice work.but I had some doubt about that Species column, in that we should predict t test for continuous and catagorical variable only 2 group..in this column there having 3 groups so how we predict t test.please give me answer
Nice work Jason. Of course there is a lot more to tell about the code and the Models applied if this is intended for people starting out with ML (like me). Rather than telling which “button to press” to make work, it would be nice to know why also. I looked at a sample of you book (advanced) if you are covering the why also, but it looks like it’s limited?
On this particular example, in my case SVM reached 99.2% and was thus the best Model. I gather this is because the test and training sets are drawn randomly from the data.
Before anything else, I truly like to thank Jason for this wonderful, concise and practical guideline on using ML for solving a predictive problem.
In terms of the example you have provided, I can confirm ‘Jan de Lange’ ‘s outcome. I’ve got the same accuracy result for SVM (0.991667 to be precise). I’ve just upgraded the Canopy version I had installed on my machine to version 2.1.3.3542 (64 bit) and your reasoning makes sense that this discrepancy could be because of its random selection of data. But this procedure could open up a new ‘can of warm’ as some say. since the selection of best model is on the line.
Thank you again Jason for this practical article on ML.
Absolutely. Machine learning algorithms are stochastic. This is a feature, not a bug. It helps us move through the landscape of possible models efficiently.
Awesome, I have tested the code it is impressive. But how could I use the model to predict if it is Iris-setosa or Iris-versicolor or Iris-virginica when I am given some values representing sepal-length, sepal-width, petal-length and petal-width attributes?
Dear Jason Brownlee, I was thinking about the same question of Nil. To be precise I was wondering how can I know, after having seen that my model has a good fit, which values of sepal-length, sepal-width, petal-length and petal-width corresponds to Iris-setosa eccc..
For instance, if I have p predictors and two classes, how can I know which values of the predictors blend to one class or the other. Knowing the value of predictors allows me to use the model in the daily operativity. Thx
Hi Mr Jason Brownlee, thks for your answer. So all algorithms, such as SVM, LDA, random forest.. have this drawbacks? Can you suggest me something else?
Because logistic regression is not like this, or am I wrong?
All algorithms have limitations and assumptions. For example, Logistic Regression makes assumptions about the distribution of variates (Gaussian) and more: https://en.wikipedia.org/wiki/Logistic_regression
Nevertheless, we can make useful models (skillful) even when breaking assumptions or pushing past limitations.
It seems I’m in the right place in right time! I’m doing my master thesis in machine learning from Stockholm University. Could you give me some references for laughter audio conversation to CSV file? You can send me anything on sujon2100@gmail.com. Thanks a lot and wish your very best and will keep in touch.
Hi again, do you have any publication of this article “Your First Machine Learning Project in Python Step-By-Step”? Or any citation if you know? Thanks.
Sweet way of condensing monstrous amount of information in a one-way street. Thanks!
Just a small thing, you are creating the Kfold inside the loop in the cross validation. Then, you use the same seed to keep the comparison across predictors constant.
That works, but I think it would be better to take it out of the loop. Not only is more efficient, but it is also much immediately clearer that all predictors are using the same Kfold.
You can still justify the use of the seeds in terms of replicability; readers getting the same results on their machines.
Thank you so much for putting this together. I am been a software developer for almost two decades and am getting interested in machine learning. Found this tutorial accurate, easy to follow and very informative.
Thanks for the great post! I am trying to follow this post by using my own dataset, but I keep getting this error “Unknown label type: array ([some numbers from my dataset])”. So what’s the problem on earth, any possible solutions?
Carefully check your data. Maybe print it on the screen and inspect it. You may have some string values that you may need to convert to numbers using data preparation.
hi thanks for great tutorial, i’m also new to ML…this really helps but i was wondering what if we have non-numeric values? i have mixture of numeric and non-numeric data and obviously this only works for numeric. do you also have a tutorial for that or would you please send me a source for it? thank you
We need to convert everything to numeric. For categorical values, you can convert them to integers (label encoding) and then to new binary features (one hot encoding).
Hello Jason
Thank you for publishing this great machine learning tutorial.
It is really awesome awesome awesome………..!
I test your tutorial on python-3 and it works well but what I face here is to load my data set from my local drive. I followed your give instructions but couldn’t be successful.
My syntax is as under:
Dear Jason
Thank you for response
I am using Python 3 with anaconda jupyter notebook
so which python version you would like to suggest me and kindly write here syntax of opening local dataset file from local drive that how can I load utf-8 dataset file from my local drive.
Great tutorial but perhaps I’m missing something here. Let’s assume I already know what model to use (perhaps because I know the data well… for example).
I then use the models to predict:
print(knn.predict(an array of variables of a record I want to classify))
Is this where the whole ML happens?
knn.fit(X_train, Y_train)
What’s the difference between this and say a non ML model/algorithm? Is it that in a non ML model I have to find the coefficients/parameters myself by statistical methods?; and in the ML model the machine does that itself?
If this is the case then to me it seems that a researcher/coder did most of the work for me and wrap it in a nice function. Am I missing something? What is special here?
The work is in the library and choice of good libraries and training on how to use them well on your project can take you a very long way very quickly.
Stats is really about small data and understanding the domain (descriptive models). Machine learning, at least in common practice, is leaning towards automation with larger datasets and making predictions (predictive modeling) at the expense of model interpretation/understandability. Prediction performance trumps traditional goals of stats.
Because of the automation, the focus shifts more toward data quality, problem framing, feature engineering, automatic algorithm tuning and ensemble methods (combining predictive models), with the algorithms themselves taking more of a backseat role.
It does make sense.
You mentioned ‘data quality’. That’s currently my field of work. I’ve been doing this statistically until now, and very keen to try a different approach. As a practical example how would you use ML to spot an error/outlier using ML instead of stats?
Let’s say I have a large dataset containing trees: each tree record contains a specie, height, location, crown size, age, etc… (ah! suspiciously similar to the iris flowers dataset 🙂 Is ML a viable method for finding incorrect data and replace with an “estimated” value? The answer I guess is yes. For species I could use almost an identical method to what you presented here; BUT what about continuous values such as tree height?
Awesome work. Students need to know how the end results will look like. They need to get motivated to learn and one of the effective means of getting motivated is to be able to see and experience the wonderful end results. Honestly, if i were made to study algorithms and understand them i would get bored. But now since i know what amazing results they give, they will serve as driving forces in me to get into details of it and do more research on it. This is where i hate the orthodox college ways of teaching. First get the theory right then apply. No way. I need to see things first to get motivated.
Putting in an extra space or leaving one out where it is needed will surely generate an error message . Some common causes of this error include:
Forgetting to indent the statements within a compound statement
Forgetting to indent the statements of a user-defined function.
The error message IndentationError: expected an indented block would seem to indicate that you have an indentation error. It is probably caused by a mix of tabs and spaces. The indentation can be any consistent white space . It is recommended to use 4 spaces for indentation in Python, tabulation or a different number of spaces may work, but it is also known to cause trouble at times. Tabs are a bad idea because they may create different amount if spacing in different editors .
I am also having this problem, I have indented the code as instructed but nothing executes. It seems to be waiting for more input. I have googled different script endings but nothing happens. Is there something I am missing to execute this script?
I tried to use another dataset. I am not sure what I imported, but even after changing the names, I still get the petal stuff as output. All of it. I commented out that part of the code and even then it gives me those old outputs.
Very Awesome step by step for me ! Even I am beginner of python , this gave me many things about Machine learning ~ supervised ML. Appreciate of your sharing !!
Really nice tutorial. I had one question which has had me confused. Once you chose your best model, (in this instance KNN) you then train a new model to be used to make predictions against the validation set. should one not perform K-fold cross-validation on this model to ensure we don’t overfit?
if this is correct how would you implement this, from my understanding cross_val_score will not allow one to generate a confusion matrix.
I think this is the only thing that I have struggled with in using scikit learn if you could help me it would be much appreciated?
Cross-validation is just a method to estimate the skill of a model on new data. Once you have the estimate you can get on with things, like confirming you have not fooled yourself (hold out validation dataset) or make predictions on new data.
The skill you report is the cross val skill with the mean and stdev to give some idea of confidence or spread.
Thanks for the quick response. So to make sure I understand, one would use cross validation to get a estimate of the skill of a model (mean of cross val scores) or chose the correct hyper parameters for a particular model.
Once you have this information you can just go ahead and train the chosen model with the full training set and test it against the validation set or new data?
Additionally, if the validation result confirms your expectations, you can go ahead and train the model on all data you have including the validation dataset and then start using it in production.
This is a very important topic. I think I’ll write a post about it.
Great tutorial. I am a developer with a computer science degree and a heavy interest in machine learning and mathematics, although I don’t quite have the academic background for the latter except for what was required in college. So, this website has really sparked my interest as it has allowed me to learn the field in sort of the “opposite direction”.
I did notice when executing your code that there was a deprecation warning for the sklearn.cross_validation module. They recommend switching to sklearn.model_selection.
When switching the modules I adjusted the following line…
… and it appears to be working okay. Of course, I had switched all other instances of cross_validation as well, but it seemed to be that the KFold() method dropped the n (number of instances) parameter, which caused a runtime error. Also, I dropped the num_instances variable.
I could have missed something here, so please let me know if this is not a valid replacement, but thought I’d share!
Jason, is everything on your website on that page? or is there another site map?
thanks!
P.S. your code ran flawlessly on my Jupyter Notebook fwiw. Although I did get a different result with SVM coming out on top with 99.1667. So I ran the validation set with SVM and came out with 94 93 93 30 fwiw.
I’m still having a little trouble understanding step 5.1. I’m trying to apply this tutorial to a new data set but, when I try to evaluate the models from 5.3 I don’t get a result.
Jean-Baptiste HubertDecember 11, 2016 at 12:17 am#
Hi Sir,
Thank you for the information.
I am currently a student, in Engineering school in France.
I am working on date mining project, indeed, I have a many date ( 40Go ) about the price of the stocks of many companies in the CAC40.
My goal is to predict the evolution of the yields and I think that Neural Network could be useful.
My idea is : I take for X the yields from “t=0” to “t=n” and for Y the yields from “t=1 to t=n” and the program should find a relation between the data.
Is that possible ? Is it a good way in order to predict the evolution of the yield ?
Thank you for your time
Hubert
Jean-Baptiste
Hi Jason,
I am new to ML. need your help so i can run this.
>>> from matplotlib import pyplot
Traceback (most recent call last):
File “”, line 1, in
File “c:\python27\lib\site-packages\matplotlib\pyplot.py”, line 29, in
import matplotlib.colorbar
File “c:\python27\lib\site-packages\matplotlib\colorbar.py”, line 32, in
import matplotlib.artist as martist
File “c:\python27\lib\site-packages\matplotlib\artist.py”, line 16, in
from .path import Path
File “c:\python27\lib\site-packages\matplotlib\path.py”, line 25, in
from . import _path, rcParams
‘ImportError: DLL load failed: %1 n\x92est pas une application Win32 valide.\n’
Great tutorial! Quick question, for the when we create the models, we do models.append(name of algorithm, alogrithm function), is models an array? Because it seems like a dictionary since we have a key-value mapping (algorithm name, and algorithm function). Thank you!
Hi Jason /any Gurus ,
Good post and will follow it but my question may be little off track.
Asking this question as i am a data modeller /aspiring data architect.
I i feel as Guru/Gurus you can clarify my doubt. The question is at the end .
2. In addition to DB based procedural languages proficiency at at least one of the following i.e. Java/Python/Scala etc.
3. Then comes this AI,Machine learning ,neural Networks etc .
My question is regarding point 3 .
I believe those are algorithms which needs deep functional knowledge and years of experience to add any value to business .
Those are independent of data models and it’s ,physical implementation and part of Business user domain not data architecture domain .
If i take your above example say now 10k users trying to do the similar kind of thing then points 1 and 2 will be Data architects a domain and point 3 will be business analyst domain . may be point 2 can overlap between them to some extent .
Data Architect need not to be hands on/proficient in algorithms i.e. should have just some basic idea as Data architects job is not to invent business logic but implement the business logic physically to satisfy Business users/Analysts .
Am i correct in my assumption as i find the certain things are nearly mutually exclusive and expectations/benchmarks should be set right?
Tried to rephrase and concise but still it is verbose . apologies for that.
Is it expected from a data architect to be algorithm expert as well as data model/database expert?
Algorithms are business centric as well as specific to particular domain of business most of the times.
Giving u an example i.e. SHORTEST PATH ( take it as just an example in making my point)
An organization is providing an app to provide that service .
CAVEAT:Someone may say from comp science dept that it is the basic thing u learn but i feel it is still an algorithm not a data structure .
if we take the above scenario in simplistic term the requirement is as follows
1.there will be say million registered users
2. one can say at least 10 % are using the app same time
3. any time they can change their direction as per contingency like a military op so dumping the partial weighted graph to their device is not an option i.e. users will be connected to main server/server cluster.
4. the challenge is storing the spatial data in DB in correct data model .
scale out ,fault tolerance .
5.implement the shortest path algo and display it using Python/java/Cipher/Oracle spatial/titan etc dynamically.
My question is can a data architect work on this project who does not know the shortest path algorithm but have sufficient knowledge in other areas but the algo with verbose term provided to him/her to implement ?
I m asking this question as now a days people are offering ready made courses etc i.e. machine learning ,NLP,Data scientist etc. and the scenario is confusing
i feel it is misleading as no one can get expert in science overnight and vice versa.
I feel Algorithms are pure science that is a separate discipline .
But to implement it in large scale Scientists/programmers/architects needs to work in tandem with minimal overlapping but continuous discussion.
Last but not the least if i make some sense what is the learning curve should i follow to try to be a data architect in unstructured data in general
I just wanted to validate from a real techie/guru like u as the confusion or no perfect answer are being exploited by management/HR to their own advantage and practice use and throw policy or make people sycophants/redundant without following the basic management principle,
The tech guys except ” few geniuses” are always toiling and management is opening the cork, enjoying at the same time .
Hello Jason,
Thank you very much for these tutorials, i am new to ML and i find it very encouraging to do and end to end project to get started with rather than reading and reading without seeing and end, This really helped me..
One question, when i tried this i got the highest accuracy for SVM.
I am still learning to read these results, but can you tell me why this happened? why did i get high accuracy for SVM instead of KNN?? have i done anything wrong? or is it possible?
Perhaps check that you have loaded the data as you expect and that the loaded values are numeric and not strings. Perhaps print the first few rows: print(df.head(5))
it worked. these tutorial very help for me. im new in Machine learning, but may you explain to me about your simple project above? because i did not see X_test and target
Thank you for sharing this. I bumped into some installation problems.
Eventually, yo get all dependencies installed on MacOS 10.11.6 I had to run this:
Hi Jason,
I am following this page as a beginner and have installed Anaconda as recommended.
As I am on win 10, I installed Anaconda 4.2.0 For Windows Python 2.7 version (x64) and
I am using Anaconda’s Spyder (python 2.7) IDE.
I checked all the versions of libraries (as shown in 1.2 Start Python and Check Versions) and got results like below:
At the 2.1 Import libraries section, I imported all of them and tried to load data as shown in
2.2 Load Dataset. But when I run it, it doesn’t show an output, instead, there is an error:
Traceback (most recent call last):
File “C:\Users\gachon\.spyder\temp.py”, line 4, in
from sklearn import model_selection
ImportError: cannot import name model_selection
Below is my code snippet:
import pandas
from pandas.tools.plotting import scatter_matrix
import matplotlib.pyplot as plt
from sklearn import model_selection
from sklearn.metrics import classification_report
from sklearn.metrics import confusion_matrix
from sklearn.metrics import accuracy_score
from sklearn.linear_model import LogisticRegression
from sklearn.tree import DecisionTreeClassifier
from sklearn.neighbors import KNeighborsClassifier
from sklearn.discriminant_analysis import LinearDiscriminantAnalysis
from sklearn.naive_bayes import GaussianNB
from sklearn.svm import SVC
url = “https://archive.ics.uci.edu/ml/machine-learning-databases/iris/iris.data”
names = [‘sepal-length’, ‘sepal-width’, ‘petal-length’, ‘petal-width’, ‘class’]
dataset = pandas.read_csv(url, names=names)
print(dataset.shape)
When I delete “from sklearn import model_selection” line I get expected results (150, 5).
I updated scikit-learn version to 0.18.1 and it helped.
The error disappeared, the result is shown, but one statement
‘import sitecustomize’ failed; use -v for traceback
is executed above the result.
I tried to find out why, but apparently I might not find the reason.
Is it going to be a problem in my further steps?
How to solve this?
In univariate plots, you mentioned about gaussian distribution.
According to the univariate plots, sepat-width had gaussian distribution. You said there are 2 variables having gaussain distribution. Please tell the other.
I’m trying to use this code with the KDD Cup ’99 dataset, and I am having trouble with LabelEncoding my dataset in to numerical values.
#Modules
import pandas
import numpy
from pandas.tools.plotting import scatter_matrix
import matplotlib.pyplot as plt
from sklearn import preprocessing
from sklearn import cross_validation
from sklearn.metrics import classification_report
from sklearn.metrics import confusion_matrix
from sklearn.metrics import accuracy_score
from sklearn.linear_model import LogisticRegression
from sklearn.tree import DecisionTreeClassifier
from sklearn.neighbors import KNeighborsClassifier
from sklearn.discriminant_analysis import LinearDiscriminantAnalysis
from sklearn.naive_bayes import GaussianNB
from sklearn.svm import SVC
from sklearn.preprocessing import LabelEncoder
#new
from collections import defaultdict
#
Hi. Change all symbols like “ to ” and ’ to ‘. LabaleEncoder will be work correct but not all network. I try to create a neural network for NSL-KDD too. Have you any good examples?
You may get differing results for a variety of reasons. Small changes in the code will affect the result. This is why we often report mean and stdev algorithm performance rather than one number, to given a range of expected performance.
I can’t tell you how grateful I am … I have been trawling through lots of ML stuff to try to get started with a “toy” example. Finally I have found the tutorial I was looking for. Anaconda had old sklearn: 0.17.1 for Windows – which caused an error “ImportError: cannot import name ‘model_selection'”. That was fixed by running “pip install -U scikit-learn” from the Anaconda command-line prompt. Now upgraded to 0.18. Now everything in your imports was fine.
All other tutorials were either too simple or too complicated. Usually the latter!
I managed to get it all working – I am chuffed to bits.
I get exactly the same numbers in the classification report as you do … however, when I changed both seeds to 8 (from 7), then ALL of the numbers end up being 1. Is this good, or bad? I am a bit confused.
I’ve output the “accuracy_score”, “confusion_matrix” & “classification_report” for seeds 7, 9 & 10. Why am I getting a perfect score with seed=9? Many thanks.
Excellent Tutorial. New to Python and set a New Years Resolution to try to understand ML. This tutorial was a great start.
I struck the issue of the sklearn version. I am using Ubuntu 16.04LTS which comes with python-sklearn version 0.17. To update to latest I used the site: http://neuro.debian.net/install_pkg.html?p=python-sklearn
Which gives the commands to add the neuro repository and pull down the 0.18 version.
Also I would like to note there is an error in section 3.1 Dimensions of the Dataset. Your text states 120 Instances when in fact 150 are returned, which you have in the Printout box.
what other variable other than size could I use? I changed size with count and got something similar but not quite. I got key errors for the other stuffs I tried. Is size just a standard command?
I’m trying to use a different data set (KDD CUP 99′) with the above code, but when I try and run the code after modifying “names” and the array to account for the new features and it will not run as it is giving me an error of: “cannot convert string to a float”.
In my data set, there are 3 columns that are text and the rest are integers and floats, I have tried LabelEncoding but it gives me the same error, do you know how I can resolve this?
I would like a chart to see the grand scope of everything for data science that python can do.
You list 6 basic steps. For example in the visualizing step, I would like to know what all the charts are, what they are used for, and what python library it comes from.
I am extremely new to all this, and understand that some steps have to happen for example
1. Get Data
2. Validate Data
3. Missing Data
4. Machine Learning
5. Display Findinds
So for missing data, there are techniques to restore the data, what are they and what libraries are used?
You can handle missing data in a few ways such as:
1. Remove rows with missing data.
2. Impute missing data (e.g. use the Imputer class in sklearn)
3. Use methods that support missing data (e.g. decision trees)
i am planning to use python to predict customer attrition.I have current list of attrited customers with their attributes.I would like to use them as test data and use them to predict any new customers.Can you please help to approach the problem in python ?
Hello Sir, I want to check my data is how many % accurate, In my data , I have 4 columns ,
Taluka , Total_yield, Rain(mm) , types_of soil
Nasik 12555 63.0 dark black
Igatpuri 1560 75.0 shallow
So on,
first, I have to check data is accurate or not, and next step is what is the predicted yield , using regression model.
Here is my model Total_yield = Rain + types_of soil
I use 0 and 1 binary variable for types_of soil.
can you please help me, how to calculate data is accurate ? How many % ?
and how to find predicted yield ?
If you do have network problems, you can download the iris.data file into your working directory and load it using the same method, changing url to the local file name.
I am a very beginner python learner(trying to learn ML as well), I tried to load data from my local file but could not be successful. Will you help me out how exactly code should be written to open the data from local file.
Hi, Jason, first of all thank so much for this amazing lesson.
Just for curiosity I have computed all the values obtained with dataset.describe() with excel and for the 25% value of petal-length I get 1.57500 instead of 1.60000. I have googled for formatting describe() output unsuccessfully. Is there an explanation? Tnx
The 120 records are split into 10 folds. The model is trained on the first 9 folds and evaluated on the records in the 10th. This is repeated so that each fold is given a chance to be the hold out set. 10 models are trained, 10 scores collected and we report the mean of those scores as an estimate of the performance of the model on unseen data.
Generally, I would advise developing a separate service that could be called using REST calls or similar.
If you are working on a prototype, you may be able to call out to a program or script from cgi-bin, but this would require careful engineering to be secure in a production environment.
Hi Jason! This tutorial was a great help, i´m truly grateful for this so thank you.
I have one question about the tutorial though, in the Scattplot Matrix i can´t understand how can we make the dots in the graphs whose variables have no relationship between them (like sepal-lenght with petal_width).
Could you or someone explain that please? how do you make a dot that represents the relationship between a certain sepal_length with a certain petal-width
you match each iris instance’s length and width with each other. for example, iris instance number one is represented by a dot, and the dot’s values are the iris length and width! so actually, when you take all these values and put them on a graph you are basically checking to see if there is a relation. as you can see some in some of these plots the dots are scattered all around, but when we look at the petal width – petal length graph it seems to be linear! this means that those two properties are clearly related. hope this hepled!
Hi Jason,
I am new to ML & Python. Your post is encouraging and straight to the point of execution. Anyhow, I am facing below error when
>>> validataion_size = 0.20
>>> X_train, X_validation, Y_train, Y_validation = model_selection.train_test_split(X, Y, test_size=validation_size, random_state = seed)
Traceback (most recent call last):
File “”, line 1, in
NameError: name ‘validation_size’ is not defined
What could be the miss out? I din’t get any errors in previous steps.
Can you please explain what precision,recall, f1-score, support actually refer to?
Also what the numbers in a confusion matrix refers to?
[ 7 0 0]
[ 0 11 1]
[ 0 2 9]]
Thanks.
It looks like you are trying to load a date-time. You might need to write a custom function to parse the date-time when loading or try removing this column from your dataset.
After typing this piece of code, it is giving me this error. can you plz help me out Jason. Since I am new to ML, dont have so much idea about the error.
Traceback (most recent call last):
File “”, line 2, in
AttributeError: module ‘sklearn.model_selection’ has no attribute ‘Kfold’
the KFold function is case-sensitive. It is ” model_selection.KFold(…) ” not ” model_selection.Kfold(…) ”
update this line:
kfold=model_selection.KFold(n_splits=10, random_state=seed)
Hello Jason ,
Thanks for writing such a nice and explanatory article for beginners like me but i have one concern , i tried finding it out on other websites as well but could not come up with any solution.
Whatever i am writing inside the code editor (Jupyter Qtconsole in my case) , can this not be save as a .py file and shared with my other members over github maybe?. I found some hacks though but i have a thinking that there must be some proper way of sharing the codes written in the editor. , like without the outputs or plots in between.
Can I ask what is the reason of this problem? Thank for answer 🙂 :
(In my code is just the section, where I Import all the needed libraries..)
I have all libraries up to date, but it still gives me this error->
File “C:\Users\64dri\Anaconda3\lib\site-packages\sklearn\model_selection\_search.py”, line 32, in
from ..utils.fixes import rankdata
You’re a rockstar, thank you so much for this tutorial and for your books! It’s been hugely helpful in getting me started on machine learning. I was curious, is it possible to add a non-number property column, or will the algorithms only accept numbers?
For example, if there were a “COLOR” column in the iris dataset, and all Iris-Setosa were blue. how could I get this program to accept and process that COLOR column? I’ve tried a few things and they all seem to fail.
You can encode labels like colors as integers and model that.
Further, you can convert the integers to a binary encoding/one-hot encoding which may me more suitable if there is no ordinal relationship between the labels.
Jason, thanks so much for replying! That makes a lot of sense. When you say binary/one-hot encoding I assume you mean (continuing to use the colors example) adding a column for each color (R,O,Y,G,B,V) and for each flower putting a 1 in the column of it’s color and a 0 for all of the other colors?
That’s feasible for 6 colors (adding six columns) but how would I manage if I wanted to choose between 100 colors or 1000 colors? Are there other libraries that could help deal with that?
for name, model in models:
… kfold = cross_vaalidation.KFold(n=num_instances,n_folds=num_folds,random_state=seed)
… cv_results = model_selection.cross_val_score(model, X_train, Y_train, cv=kfold, scoring=scoring)
File “”, line 3
cv_results = model_selection.cross_val_score(model, X_train, Y_train, cv=kfold, scoring=scoring)
^
SyntaxError: invalid syntax
>>> cv_results = model_selection.cross_val_score(model, X_train, Y_train, cv=kfold, scoring=scoring)
Traceback (most recent call last):
File “”, line 1, in
NameError: name ‘model’ is not defined
>>> cv_results = model_selection.cross_val_score(models, X_train, Y_train, cv=kfold, scoring=scoring)
Traceback (most recent call last):
File “”, line 1, in
NameError: name ‘kfold’ is not defined
>>> cv_results = model_selection.cross_val_score(models, X_train, Y_train, cv =
kfold, scoring = scoring)
Traceback (most recent call last):
File “”, line 1, in
NameError: name ‘kfold’ is not defined
>>> names.append(name)
Traceback (most recent call last):
File “”, line 1, in
NameError: name ‘name’ is not defined
I am new to python and getting these errors after running 5.3 models. Please help me.
Hi, I went through your tutorial. It is super great!
I wonder whether you can recommend a data set that is similar to Iris classification for me to practice?
I need your suggestion, i am working on my thesis here i need to work on machine learning.
Training : positive ,negative, others
Test : unknown data
Want to train machine with training and test with unknown data using SVM,Naive,KNN
How can i make the format of training and test data ?
And how to use those algorithms in it
Using which i can get the TP,TN,FP,FN
Thanking you..
I m new in Machine learning and this was a really helpful tutorial. I have maybe a stupid question I wanted to plot the predictions and the validation value and make a visual comparison and it doesn’t seem like I really understood how I can plot it.
Can you please send me the piece of code with some explanations to do it ?
Great tutorial Jason!
My question is, if I want some new data from a user, how do I do that? If in future I develop my own machine learning algorithm, how do I use it to get some new data?
What steps are taken to develop it?
And thanks for this tutorial.
Hi Jason,
I have a question regards the step after trained the data and know the better algorithm for our case, how we could know the rules formula that the algorithm produced for future uses ?
the best algorithm results for my use case was the “Classification and Regression Trees (CART)”, so how could I know the rules that the algorithm created on my usecase.
how I could extract the weights and use them for evaluate new data .
Thank you so much…this document really helped me a lot…..i was searching for such a document since a long time…this document gave the actual view of how machine learning is implemented through python….Books and courses are really difficult to understand completely and begin with development of project on such a vast concept… books n videos gave me lots of snippets, but i was not understanding how they all fit together.
I’ve already installed Anaconda with Python 3.6 and the panda libraries are listed when I run versions.py. Everything has been fine up till trying to load the iris library. Do I need to use a different terminal within Anaconda?
Your tutorial is fantastic!
I’m trying to follow it but gets stuck on 5.3 Build Models
When I copy your code for this section I get a few Errors
IndentationError: excpected an indented block
NameError: name ‘model’ is not defined
NameError: name ‘cv_results’ is not defined
NameError: name ‘name’ is not defined
Could you please help me find what I’m doing wrong?
Thanks!
see the code and my “results” below:
>>> # Spot Check Algorithms
… models = []
>>> models.append((‘LR’, LogisticRegression()))
>>> models.append((‘LDA’, LinearDiscriminantAnalysis()))
>>> models.append((‘KNN’, KNeighborsClassifier()))
>>> models.append((‘CART’, DecisionTreeClassifier()))
>>> models.append((‘NB’, GaussianNB()))
>>> models.append((‘SVM’, SVC()))
>>> # evaluate each model in turn
… results = []
>>> names = []
>>> for name, model in models:
… kfold = model_selection.KFold(n_splits=10, random_state=seed)
File “”, line 2
kfold = model_selection.KFold(n_splits=10, random_state=seed)
^
IndentationError: expected an indented block
>>> cv_results = model_selection.cross_val_score(model, X_train, Y_train, cv=kfold, scoring=scoring)
Traceback (most recent call last):
File “”, line 1, in
NameError: name ‘model’ is not defined
>>> results.append(cv_results)
Traceback (most recent call last):
File “”, line 1, in
NameError: name ‘cv_results’ is not defined
>>> names.append(name)
Traceback (most recent call last):
File “”, line 1, in
NameError: name ‘name’ is not defined
>>> msg = “%s: %f (%f)” % (name, cv_results.mean(), cv_results.std())
Traceback (most recent call last):
File “”, line 1, in
NameError: name ‘name’ is not defined
>>> print(msg)
1. Click the copy button on the code example (top right of code box, second from the end). This will select all code in the box.
2. Copy the code to the cipboard (control-c on windows, command-c on mac, or right click and click copy).
3. Open your text editor.
4. Paste the code from the clip board.
Hi, one beginner question. What do we get after training is completed in supervised learning, for classification problem ? Do we get weights? How do i use the trained model after that in field, for real classification application lets say? I didn’t get the concept what happens if training is completed. I tried this example: https://github.com/fchollet/keras/blob/master/examples/mnist_mlp.py and it printed me accuracy and loss of test data. Then what now?
As a complete beginner, it sounds so cool to predict the future. Then I saw all these model and complicated stuff, how do I even begin. Thank you for this. It is really great!
I just started following your step by step tutorial for machine learning. In importing libraries step I followed each and every steps you specified, install all libraries via conda, but still I’m getting the following error.
Traceback (most recent call last):
File “C:/Users/dell/PycharmProjects/machine-learning/load_data.py”, line 13, in
from sklearn.linear_model import LogisticRegression
File “C:\Users\dell\Anaconda2\lib\site-packages\sklearn\linear_model\__init__.py”, line 15, in
from .least_angle import (Lars, LassoLars, lars_path, LarsCV, LassoLarsCV,
File “C:\Users\dell\Anaconda2\lib\site-packages\sklearn\linear_model\least_angle.py”, line 24, in
from ..utils import arrayfuncs, as_float_array, check_X_y
ImportError: DLL load failed: Access is denied.
Tutorial DEAP Version 2.1 https://www.youtube.com/watch?v=drd11htJJC0
A Data Envelopment Analysis (Computer) Program. This page describes the computer program Tutorial DEAP Version 2.1 which was written by Tim Coelli.
Thanx for the great tutorial you provided.
I’m also new to MC and python. I tried to use my csv file as you used iris data set. Though it successfully loaded the dataset gives following error.
could not convert string to float: LipCornerDepressor
LipCornerDepressor is normal value such as 0.32145 in excel sheet taken from sql server
Your posts are really good…..
I’m very naive to Python and Machine Learning.
Can you please suggest good reads to get basic clear for machine learning.
Outstanding work on this. I am curious how to port out results that show which records were matched to what in the predictor, when I print(predictions) it does not show what records they are paired with. Thanks!
when I am applying all the models and printing message it shows me the error that it cannot convert string to float. how to resolve this error. my data set is related to fake news … title, text, label
Am using Anaconda Python and I was writing all the commands/ program in the ‘python’ command line, am trying to find a way to save this program to a file? I have tried ‘%save’, but it errored out, any thoughts?
Thank you for the help and insight you provide. When I run the actual validation data through the algorithms, I get a different feel for which one may be the best fit.
Validation Test Accuracy:
LR…….0.80
LDA…..0.97
KNN….0.90
CART..0.87
NB…….0.83
SVM….0.93
My question is, should this influence my choice of algorithm?
Thank you again for providing such a wealth of information on your blog.
# Split-out validation dataset
array = dataset.values
X = array[:,0:4]
Y = array[:,4]
from my dataset , When i give Y=array[:,1] Its working , but if give 2 or 3 or 4 instead of 1 it gives following error !!
But all columns have similar kind of data .
Traceback (most recent call last):
File “/alok/c-analyze/analyze.py”, line 390, in
cv_results = model_selection.cross_val_score(model, X_train, Y_train, cv=kfold, scoring=scoring)
File “/usr/lib64/python2.7/site-packages/sklearn/model_selection/_validation.py”, line 140, in cross_val_score
for train, test in cv_iter)
File “/usr/lib64/python2.7/site-packages/sklearn/externals/joblib/parallel.py”, line 758, in __call__
while self.dispatch_one_batch(iterator):
File “/usr/lib64/python2.7/site-packages/sklearn/externals/joblib/parallel.py”, line 608, in dispatch_one_batch
self._dispatch(tasks)
File “/usr/lib64/python2.7/site-packages/sklearn/externals/joblib/parallel.py”, line 571, in _dispatch
job = self._backend.apply_async(batch, callback=cb)
File “/usr/lib64/python2.7/site-packages/sklearn/externals/joblib/_parallel_backends.py”, line 109, in apply_async
result = ImmediateResult(func)
File “/usr/lib64/python2.7/site-packages/sklearn/externals/joblib/_parallel_backends.py”, line 326, in __init__
self.results = batch()
File “/usr/lib64/python2.7/site-packages/sklearn/externals/joblib/parallel.py”, line 131, in __call__
return [func(*args, **kwargs) for func, args, kwargs in self.items]
File “/usr/lib64/python2.7/site-packages/sklearn/model_selection/_validation.py”, line 238, in _fit_and_score
estimator.fit(X_train, y_train, **fit_params)
File “/usr/lib64/python2.7/site-packages/sklearn/discriminant_analysis.py”, line 468, in fit
self._solve_svd(X, y)
File “/usr/lib64/python2.7/site-packages/sklearn/discriminant_analysis.py”, line 378, in _solve_svd
fac = 1. / (n_samples – n_classes)
I meant there is no much difference in data from each columns ! but still its working only for first column !! It gives the above error for any other column i choose .
But the above error does not occur for 1 column , that is when Y = 1 column,
But the above same error happens when i choose any other column 2 , 3 or 4 .
How this can be applied to predict the value if stastical dataset is given
Say i have given with past 10 years house price now i want to predict the value for house in next one year, two year
Can you help me out in this
I m amature in ML
Thank for this tutorial
It gives me a good kickstart to ML
I getting trouble in doing that please help me out with any simple example
Example I have a dataset containing plumber work Say
attributes are
experience_level , date, rating, price/hour
I want to predict the price/hour for the next date base on experience level and average rating can you please help me regarding this.
Great job with the tutorial, it was really helpful.
I want to ask, how can I use the techics above with a dataset that is not just one line with a few values, but a matrix NX3 with multiple values (measurements from an accelerometer). Is there a tutorial? How can I look up to it?
I have built a linear regression model. y intercept is abnormally high (0.3 million) and adjusted r2 = 0.94. I would like to know what does high intercept mean?
Many books have been written on linear regression and much is known about how to analyze these models effectively. I would recommend diving into the statistics literature.
Excellent tutorial, i am moving from PHP to Python and taking baby steps. I used the Thonny IDE (http://thonny.org/) which is also very useful for python beginners.
Now i understand , jason thanks for amazing tutorials . Just one suggestion along with the codes give a link for reference in detail about this topics !
Traceback (most recent call last):
File “/rahman/c-analyze/analyze.py”, line 390, in
cv_results = model_selection.cross_val_score(model, X_train, Y_train, cv=kfold, scoring=scoring)
File “/usr/lib64/python2.7/site-packages/sklearn/model_selection/_validation.py”, line 140, in cross_val_score
for train, test in cv_iter)
File “/usr/lib64/python2.7/site-packages/sklearn/externals/joblib/parallel.py”, line 758, in __call__
while self.dispatch_one_batch(iterator):
File “/usr/lib64/python2.7/site-packages/sklearn/externals/joblib/parallel.py”, line 608, in dispatch_one_batch
self._dispatch(tasks)
File “/usr/lib64/python2.7/site-packages/sklearn/externals/joblib/parallel.py”, line 571, in _dispatch
job = self._backend.apply_async(batch, callback=cb)
File “/usr/lib64/python2.7/site-packages/sklearn/externals/joblib/_parallel_backends.py”, line 109, in apply_async
result = ImmediateResult(func)
File “/usr/lib64/python2.7/site-packages/sklearn/externals/joblib/_parallel_backends.py”, line 326, in __init__
self.results = batch()
File “/usr/lib64/python2.7/site-packages/sklearn/externals/joblib/parallel.py”, line 131, in __call__
return [func(*args, **kwargs) for func, args, kwargs in self.items]
File “/usr/lib64/python2.7/site-packages/sklearn/model_selection/_validation.py”, line 238, in _fit_and_score
estimator.fit(X_train, y_train, **fit_params)
File “/usr/lib64/python2.7/site-packages/sklearn/discriminant_analysis.py”, line 468, in fit
self._solve_svd(X, y)
File “/usr/lib64/python2.7/site-packages/sklearn/discriminant_analysis.py”, line 378, in _solve_svd
fac = 1. / (n_samples – n_classes)
ZeroDivisionError: float division by zero
# Split-out validation dataset
My code :
array = dataset.values
X = array[:,0:4]
if field == “rh”: #No error if i select this col
Y = array[:,0]
elif field == “rm”: #gives the above error
Y = array[:,1]
elif field == “wh”: #gives the above error
Y = array[:,2]
elif field == “wm”: #gives the above error
Y = array[:,3]
Hi Jason
Great starting tutorial to get the whole picture. Thank you:)
I am a newbie to machine learning. Could you please tell why you have specifically chosen these 6 models?
Hi Jason, I am new to Python, but found this blog really helpful. I tried executing the code and it return all the result as mention above by you, except few graph.
The scatter matrix graph and the evaluation on 6 algorithm did not open on my machine but its showing result on my colleague machine. I checked all the version and its higher or same as you mentioned in blog.
Can you help if this issue can be resolved on my machine?
Many thanks for this — I already got a lot out of this. I feel like a monkey though because I was neither familiar enough with python nor had any clue of ML back alleys yesterday. Today I can see plots on my screen and even if I have no clue what I’m looking at, this is where I wanted to be, so thanks!
A few minor suggestions to make this perhaps even more dummy-proof:
– I’m on Mac and I used python3 because python2 is weirdly set up out of the box and you can’t update easily the libraries needed. I understand you link, rightfully to external installation instructions, so just to say, this stuff works in python3 if you needed further testimony.
– when drawing plots, I started freaking out because the terminal became unresponsive. So if you just made an (unessential) suggestion to run plt.ion() first, linking to, for example: https://matplotlib.org/faq/usage_faq.html#what-is-interactive-mode, it might help dummies like me to not give up too easily. (BTW I find your use command line philosophy and don’t let toolsets get in the way a great one indeed!)
– There seems to be some ‘hack’ involved when defining the dataset, suppose there are no headers and so on… how do you get to load your dataset with an insightful name vector in the first palce (you don’t…) So just a hint of clarification would help here feeling we can trust that we do the right thing in this case because the data is well understood (I mean, this is not really a big deal eh it’s all par for the course but if I didn’t have similar experience in R I’d feel completely lost I think).
I was a bit puzzled by the following sentence in 3.3:
“We can see that all of the numerical values have the same scale (centimeters) and similar ranges between 0 and 8 centimeters.”
Well, just looking at the table, I actually can’t see any of this. There is in fact really nothing telling this to us in the snippet, right? The sentence is a comment based on prior understanding of the dataset. Maybe this could be clarified so clueless readers don’t agonise over whether they are missing some magical power of insight.
– Overall, I could run this and to some extent adapt it quickly to a different dataset until it became relevant what the data was like. I’m stumbling on the data manipulation for 5.1. I suppose it is both because I don’t know python structures and also because I have no clue what is being done in the selection step.
I think in answer to a previous comment you link to doc for the relevant selection function, perhaps it would still be useful to have an extra, ‘for dummies’, detailed explanation of
X = array[:,0:4]
Y = array[:,4]
in the context of the iris dataset. This is what I have to figure out, I think, in order to apply it to say, a 11 column dataset and it would be useful to known what I’m trying to do.
The rest of the difficulties I have are with regards to interpretation of the output and it is fair to say this is outside of the scope of your tutorial which puts dummies like me in a very good position to try to understand while being able to fiddle with a bit of code. All the above comments are extremely minor and really about polishing the readibility for ultimate noobs, they are not really important and your tutorial is a great and efficient resource.
I’m not able to figure out , what errors does the confusion matrix represents ? and what does each column(precision, recall, f1-score, support) in the classification report signifies ?
And last but not the least thanks a lot Sir for this easy to use and wonderful tutorial. Even words are not enough to express my gratitude, you have made a daunting task for every ML Enthusiast a hell lot easier !!!
How do you classify problem into different categories example : Iris dataset was a classification problem and pima-indian-diabetes ,a binary problem. How can we figure out which problem belong to which category and which model to apply on that problem?
consider the formula for area of triangle 1/2 x base x height. When you learn this formula, you understand it and apply it many times for different triangles. BUT you did not learn anything ABOUT the formula itself. . for instance, how many people care that the formula has 2 variables(base and height) and that there is no CONSTANT(like PI) in the formula and many such things about the formula itself? Applying the formula does not teach anything about the nature of the formula itself
A lot of program execution in computers happen much the same way…data is a thing to be modified, applied or used, but not necessarily understood. When you introduce some techniques to understand data, then necessarily the computer or the ‘Machine’ ‘learns’ that there are characteristics about that data, and that at the least, there exists some relationship amongst data in their dataset. This learning is not explicitly programmed rather inferenced, although confusingly, the algorithms themselves are explicitly programmed to infer the meaning of the dataset. The learning is then transferred to the end cycle of making prediction based on the gained understanding of data.
but like you pointed out, it is still statistics and all it’s domain techniques, but as a statistician do you not ‘learn’ more about data than merely use it, unlike your counterparts who see data more as a commodity to be consumed? Because most computer systems do the latter(consumption) rather than the former(data understanding), a system that understands data(with prediction used as a proof of learning) can be called ‘Machine Learning’.
Sir,I’ve been working on bank_note authentication dataset and after applying the above procedure carefully the results were 100% accuracy(both on trained and validation dataset) using SVM and KNN models. Is 100% accuracy possible or have I done something wrong ?
Sir, I’ve considered various other aspects like f1-score, recall, support ; but in each case the result is same 100%. How can I make sure that my system is not fooling me ? What other procedure can I apply to check the accuracy of my dataset ?
Hi, Jason!
I am new to python as well ML. so I am getting the below error while running your code, please help me to code bring-up
File “sample1.py”, line 73, in
predictions = knn.predict(X_validation)
File “/usr/local/lib/python2.7/dist-packages/sklearn/neighbors/classification.py”, line 143, in predict
X = check_array(X, accept_sparse=’csr’)
File “/usr/local/lib/python2.7/dist-packages/sklearn/utils/validation.py”, line 407, in check_array
_assert_all_finite(array)
File “/usr/local/lib/python2.7/dist-packages/sklearn/utils/validation.py”, line 58, in _assert_all_finite
” or a value too large for %r.” % X.dtype)
ValueError: Input contains NaN, infinity or a value too large for dtype(‘float64’).
Hello. This is really an amazing tutorial. I got down to everything but when selecting the best model i hit a snag. Can you help out?
Traceback (most recent call last):
File “/Users/sahityasehgal/Desktop/py/machinetest.py”, line 77, in
cv_results = model_selection.cross_val_score(model, X_train, Y_train, cv=kfold, scoring=’accuracy’)
File “/Users/sahityasehgal/Library/Python/2.7/lib/python/site-packages/sklearn/model_selection/_validation.py”, line 140, in cross_val_score
for train, test in cv_iter)
File “/Users/sahityasehgal/Library/Python/2.7/lib/python/site-packages/sklearn/externals/joblib/parallel.py”, line 758, in __call__
while self.dispatch_one_batch(iterator):
File “/Users/sahityasehgal/Library/Python/2.7/lib/python/site-packages/sklearn/externals/joblib/parallel.py”, line 608, in dispatch_one_batch
self._dispatch(tasks)
File “/Users/sahityasehgal/Library/Python/2.7/lib/python/site-packages/sklearn/externals/joblib/parallel.py”, line 571, in _dispatch
job = self._backend.apply_async(batch, callback=cb)
File “/Users/sahityasehgal/Library/Python/2.7/lib/python/site-packages/sklearn/externals/joblib/_parallel_backends.py”, line 109, in apply_async
result = ImmediateResult(func)
File “/Users/sahityasehgal/Library/Python/2.7/lib/python/site-packages/sklearn/externals/joblib/_parallel_backends.py”, line 326, in __init__
self.results = batch()
File “/Users/sahityasehgal/Library/Python/2.7/lib/python/site-packages/sklearn/externals/joblib/parallel.py”, line 131, in __call__
return [func(*args, **kwargs) for func, args, kwargs in self.items]
File “/Users/sahityasehgal/Library/Python/2.7/lib/python/site-packages/sklearn/model_selection/_validation.py”, line 238, in _fit_and_score
estimator.fit(X_train, y_train, **fit_params)
File “/Users/sahityasehgal/Library/Python/2.7/lib/python/site-packages/sklearn/linear_model/logistic.py”, line 1173, in fit
order=”C”)
File “/Users/sahityasehgal/Library/Python/2.7/lib/python/site-packages/sklearn/utils/validation.py”, line 526, in check_X_y
y = column_or_1d(y, warn=True)
File “/Users/sahityasehgal/Library/Python/2.7/lib/python/site-packages/sklearn/utils/validation.py”, line 562, in column_or_1d
raise ValueError(“bad input shape {0}”.format(shape))
ValueError: bad input shape (94, 4)
This is, by far, is the most effective applied technology tutorial I have utilized.
You get right to the point and still have readers actually working with python, python libraries, IDE options, and of course machine learning. I am an electromechanical engineer with embedded C experience. Until now, I have been bogged down trying to traipse through python wizards’ idiosyncratic coding styles and verbose machine learning theory knowing there exists a friendlier path.
Actually I was working on a project on twitter analysis using python where I am extracting user interests through their tweets. I was thinking of using naive bayes classifier in textblob python library for training classifier with different type of pre-labeled tweets or different categories like politics,sports etc.
My only concern is that will it be accurate as I tried passing like 10 tweets in training set and based on that I tried classifying my test set. I am getting some false cases and accuracy is around 85.
This was great example. I was looking for something similar on internet all this time,glad I found this link. I wanted to compile a ML code end-to-end and see my basic infra is ready to start with the actual course work. As you said, from here we can learn more about each algorithm in detail. It would be great if you can start a Youtube channel and upload some easy to learn videos as well related to ML, Deep learning and Neural Networks.
I’ve been working on a dataset which contains [Male,Female,Infant] as entries in first column rest all columns are integers. How can I replace [Male,Female,Infant] with a similar notation like [0,1,2] or something like that ? What is the most efficient way to do it ?
Nice tutorial, thanks!
Just a little precision if someone encounter the same issue than me:
if you get the error “This application failed to start because it could not find or load the Qt platform plugin “windows”
in “”.” when you are trying to see your data visualizations, it’s maybe (like in my case) because you are using PySide rather than PyQT.
In that case, add these lines before the “import matplotlib.pyplot as plt”:
Fantastic tutorial! Running today I noticed two changes from the tutorial above (undoubtably because time has passed since it was created). New users might find the following observations useful:
#1 – Future Warning
Ran on OS X, Python 3.6.1, in a jupyter notebook, anaconda 4.4.0 installed:
scipy: 0.19.0
numpy: 1.12.1
matplotlib: 2.0.2
pandas: 0.20.1
sklearn: 0.18.1
I replaced this line in the #Load libraries code block:
from pandas.tools.plotting import scatter_matrix
With this:
from pandas.plotting import scatter_matrix
…because a FutureWarning popped up:
/Users/xxx/anaconda/lib/python3.6/site-packages/ipykernel_launcher.py:2: FutureWarning: ‘pandas.tools.plotting.scatter_matrix’ is deprecated, import ‘pandas.plotting.scatter_matrix’ instead.
Note: it does run perfectly even without this fix, this may be more of an issue in the future
#2 – SVM wins!
In the build models section, the results were:
LR: 0.966667 (0.040825)
LDA: 0.975000 (0.038188)
KNN: 0.983333 (0.033333)
CART: 0.966667 (0.040825)
NB: 0.975000 (0.053359)
SVM: 0.991667 (0.025000)
… which means SVM was better here. I added the following code block based on the KNN one:
# Make predictions on validation dataset
svm = SVC()
svm.fit(X_train, Y_train)
predictions = svm.predict(X_validation)
print(accuracy_score(Y_validation, predictions))
print(confusion_matrix(Y_validation, predictions))
print(classification_report(Y_validation, predictions))
which gets these results:
0.933333333333
[[ 7 0 0]
[ 0 10 2]
[ 0 0 11]]
precision recall f1-score support
how to relate this result with input ? I mean, can i interactively provide the values for sepal-length’, ‘sepal-width’, ‘petal-length’, ‘petal-width and result to get whether it which class ?
Excellent tutorial sir, I love your tutorials and I am starting with deep learning with keras.
I would love if you could provide a tutorial for sequence to sequence model using keras and a relevant dataset.
Also I would be obliged if you could point me in some direction towards names entity recognition using seq2seq
Thanks for your great example, this is really helpful, this end-to-end project is the best way to learn ML, much better than text-book which they only focus on the seperate concepts, not the whole forest, will you please do more example like this and explain in detail next time?
This is beautiful tutorial for the starters..
I am a lover of machine learning and want to do some projects and research on it.
I would really need your help and guideline time to time.
Hi Jason,
Love the article. gave me a good start of understanding machine learning. One thing i would like to ask is what is the predicted outcome? Is it which type or “class” of flower that will happen next? i assume switching things up I could use this same outline as a way of getting a prediction on the other columns involved?
Hi again Jason,
Diving deeper into this tutorial and analyzing more I find something that peaked an interest maybe you can shed light on. based off the seed of 7 you get a higher accuracy percentage on the KNN algorithm after using kfold, but when showing the information for the LDA algorithm, it has a higher percentage in accuracy_score after predicting on it. what could this mean?
Another great read Jason. This whole site is full of great pieces and it gives me a good answer on my question. I want to thank you for your time and effort into making such a great place for all this knowledge.
At the beginning of your tutorial you write: “If you are a machine learning beginner and looking to finally get started using Python, this tutorial was designed for you.”
No offense but in this regards, your tutorial is not doing a very good job.
You don’t really go in detail so that we can understand what is been done and why. The explanations are rather weak.
Wrong expectations set i believe.
Hi Jason! I am trying to adapt this for a purely binary dataset, however I’m running into this problem:
# evaluate each model in turn
results = []
name = []
for name, model in models:
kfold = model_selection.KFold(n_splits=10, random_state=seed)
cv_results = model_selection.cross_val_score(model, X_train, Y_train,cv = kfold, scoring=scoring)
results.append(cv_results)
names.append(name)
msg = “%s:%f(%f)”%(name, cv_results.mean(), cv_results.std())
print(msg)
Hi. What should i do to make predictions based on my own test set.? Say i need to predict category of flower with data [5.2, 1.8, 1.6, 0.2]. ie i want to change my X_test to that array. And the prediction should be like “setosa”.
What changes should i do.? I tried giving that value directly to predict(). But it crashes.
Hi Jason, i´m perú and i have to script write in Mac
#Configurar para la red neural
fechantinicio = ‘1970-01-01’
fechantfinal = ‘1974-12-31’
capasinicio = TodasEstaciones.ix[fechantinicio:fechantfinal].as_matrix()[:,[0,2,5]]
capasalida = TodasEstaciones.ix[fechantinicio:fechantfinal].as_matrix()[:,1]
#Construimos la Red Neural
#Definition of the training for the neural network
redneural = Regressor(
layers=[
Layer(“ExpLin”, units=neurones),
Layer(“ExpLin”, units=neurones), Layer(“Linear”)],
learning_rate=tasaaprendizaje,
n_iter=numiteraciones)
redneural.fit(capasinicio, capasalida)
#Get the prediction for the train set
valortest = ([])
for i in range(capasinicio.shape[0]):
prediccion = redneural.predict(np.array([capasinicio[i,:].tolist()]))
valortest.append(prediccion[0][0])
and then run…
ModuleNotFoundError Traceback (most recent call last)
in ()
1 #Construimos la Red Neural
2
—-> 3 from sknn.mlp import Regressor, Layer
4
5
ModuleNotFoundError: No module named ‘sknn’
i have install python in window 7 and i changed the script so:
#construimos la red neural
import numpy as np
from sklearn.neural_network import MLPRegressor
#definicion del entrenamiento para el trabajo de la red neural
Hello Jason, this is a fantastic tutorial! I am using this as a template to experiment with a dataset that has 0 or 1 as a value for each attribute and keep running into this error:
# Load libraries
import numpy
from matplotlib import pyplot
from pandas import read_csv
from pandas import set_option
from pandas.tools.plotting import scatter_matrix
from sklearn.preprocessing import StandardScaler
from sklearn.model_selection import train_test_split
from sklearn.model_selection import KFold
from sklearn.model_selection import cross_val_score
from sklearn.model_selection import GridSearchCV
from sklearn.metrics import classification_report
from sklearn.metrics import confusion_matrix
from sklearn.metrics import accuracy_score
from sklearn.pipeline import Pipeline
from sklearn.linear_model import LogisticRegression
from sklearn.tree import DecisionTreeClassifier
from sklearn.neighbors import KNeighborsClassifier
from sklearn.discriminant_analysis import LinearDiscriminantAnalysis
from sklearn.naive_bayes import GaussianNB
from sklearn.svm import SVC
from sklearn.ensemble import AdaBoostClassifier
from sklearn.ensemble import GradientBoostingClassifier
from sklearn.ensemble import RandomForestClassifier
from sklearn.ensemble import ExtraTreesClassifier
# Load Dataset
filename = ‘ML.csv’
names = [‘Cities’, ‘Entertainment’, ‘RegionalFood’, ‘WestMiss’, ‘NFLTeam’, ‘Coastal’, ‘WarmWinter’, ‘SuperBowl’, ‘Manufacturing’]
data = read_csv(filename, names=names)
print(data.shape)
# types
set_option(‘display.max_rows’, 500)
print(data.dtypes)
# head
set_option(‘display.width’, 100)
print(data.head(20))
# descriptions, change precision to 3 places
set_option(‘precision’, 3)
print(data.describe())
# class distribution
print(data.groupby(‘Cities’).size())
# histograms
data.hist(sharex=False, sharey=False, xlabelsize=1, ylabelsize=1)
pyplot.show()
# correlation matrix
fig = pyplot.figure()
ax = fig.add_subplot(111)
cax = ax.matshow(data.corr(), vmin=-1, vmax=1, interpolation=’none’)
fig.colorbar(cax)
pyplot.show()
# Split-out validation dataset
array = data.values
X = array[:,1:8]
Y = array[:,8]
validation_size = 0.20
seed = 7
X_train, X_validation, Y_train, Y_validation = train_test_split(X, Y,
test_size=validation_size, random_state=seed)
# Test options and evaluation metric
num_folds = 3
seed = 7
scoring = ‘accuracy’
# Spot-Check Algorithms
models = []
models.append((‘CART’, DecisionTreeClassifier()))
models.append((‘NB’, GaussianNB()))
models.append((‘SVM’, SVC()))
results = []
names = []
# evaluate each model in turn
results = []
names = []
for name, model in models:
kfold = KFold(n_splits=3, random_state=seed)
cv_results =cross_val_score(model, X_train, Y_train, cv=kfold, scoring=scoring)
results.append(cv_results)
names.append(name)
msg = “%s: %f (%f)” % (name, cv_results.mean(), cv_results.std())
print(msg)
I get the following error:
File “C:\Users\Giselle\Anaconda3\lib\site-packages\sklearn\utils\multiclass.py”, line 172, in check_classification_targets
raise ValueError(“Unknown label type: %r” % y_type)
awesome detailed blog man…..i always love your method for explanation ..so clean and easy. Great … i start machine learning with r but now doing with python too.
I am getting an error executing below piece of code, can you help?
# evaluate each model in turn
results = []
names = []
for name, model in models:
kfold = ms.KFold(n_splits=10, random_state=seed)
cv_results = ms.cross_val_score(model, X_train, Y_train, cv=kfold, scoring=scoring)
results.append(cv_results)
names.append(name)
msg = “%s: %f (%f)” % (name, cv_results.mean(), cv_results.std())
print(msg)
Error that I am getting:
TypeError: get_params() missing 1 required positional argument: ‘self’
I get the following results when the test is run against each model.
LR: 0.966667 (0.040825)
LDA: 0.975000 (0.038188)
KNN: 0.983333 (0.033333)
CART: 0.966667 (0.040825)
NB: 0.975000 (0.053359)
SVM: 0.991667 (0.025000)
Looks like SVN is the best and not KNN, what is the reason for this?
Hi Jason, have started to learn Machine learning basics using Keras (with TF/Theano as backend). I am going through examples on this site and other resources with the ultimate goal of implementing Document reading/interpretation on constrained data set, e.g bank statements, proof of residence, standard supporting document etc.
Thank you Jason for this simple tutorial for beginners.
I just want to know that what is the effect of n-folds (in above example, we used 10-fold) on model. If we change n-fold, the performance of algorithm varies, how does it effect the performance?
The number of folds, and the specifics of the algorithm and data, will impact the stability of the estimated skill of the model on the problem.
Given a lot of data, often there is diminishing returns going beyond 10.
If in doubt, test the stability of the score (e.g. variance) by estimating model performance using a suite of different k values in k cross validation.
import pandas as pd
import numpy as np
import matplotlib.pyplot as plt
from sklearn.ensemble import RandomForestClassifier
from sklearn import svm
from sklearn.svm import SVR
from sklearn import linear_model
import csv
from numpy import genfromtxt
import time
import datetime
from sklearn import model_selection
from sklearn.metrics import classification_report
from sklearn.metrics import confusion_matrix
from sklearn.metrics import accuracy_score
from sklearn.linear_model import LogisticRegression
from sklearn.tree import DecisionTreeClassifier
from sklearn.neighbors import KNeighborsClassifier
from sklearn.discriminant_analysis import LinearDiscriminantAnalysis
from sklearn.naive_bayes import GaussianNB
from sklearn.svm import SVC
date = []
usage = []
date = genfromtxt(‘date.csv’)
usage = genfromtxt(‘usage.csv’)
test = genfromtxt(‘test.csv’)
File “/Users/nelsondsouza/anaconda/lib/python2.7/site-packages/sklearn/model_selection/_validation.py”, line 140, in cross_val_score
for train, test in cv_iter)
File “/Users/nelsondsouza/anaconda/lib/python2.7/site-packages/sklearn/externals/joblib/parallel.py”, line 758, in __call__
while self.dispatch_one_batch(iterator):
File “/Users/nelsondsouza/anaconda/lib/python2.7/site-packages/sklearn/externals/joblib/parallel.py”, line 608, in dispatch_one_batch
self._dispatch(tasks)
File “/Users/nelsondsouza/anaconda/lib/python2.7/site-packages/sklearn/externals/joblib/parallel.py”, line 571, in _dispatch
job = self._backend.apply_async(batch, callback=cb)
File “/Users/nelsondsouza/anaconda/lib/python2.7/site-packages/sklearn/externals/joblib/_parallel_backends.py”, line 109, in apply_async
result = ImmediateResult(func)
File “/Users/nelsondsouza/anaconda/lib/python2.7/site-packages/sklearn/externals/joblib/_parallel_backends.py”, line 326, in __init__
self.results = batch()
File “/Users/nelsondsouza/anaconda/lib/python2.7/site-packages/sklearn/externals/joblib/parallel.py”, line 131, in __call__
return [func(*args, **kwargs) for func, args, kwargs in self.items]
File “/Users/nelsondsouza/anaconda/lib/python2.7/site-packages/sklearn/model_selection/_validation.py”, line 238, in _fit_and_score
estimator.fit(X_train, y_train, **fit_params)
File “/Users/nelsondsouza/anaconda/lib/python2.7/site-packages/sklearn/discriminant_analysis.py”, line 468, in fit
self._solve_svd(X, y)
File “/Users/nelsondsouza/anaconda/lib/python2.7/site-packages/sklearn/discriminant_analysis.py”, line 378, in _solve_svd
fac = 1. / (n_samples – n_classes)
my data set has 365 rows and only 2 columns is that a problem ?
Also I had a question, if you could lead me in a correct direction,
If my dataset has a column ‘Dates’ .datetime object how should I go about handling it ?
Awesome tutorial.. The program ran so smoothly without any errors. And it was easy to understand. Graphs looked fantastic. Although I could not understand each and every functionality. Do you have any reference to understand the very basics of machine learning in Python?
Is there a way to append the train set with new data so that when ever I want I can add new data into the train model. What I could see creating new train sets.
Thank you Jason!!!
Having done the Coursera ML course by Andrew Ng I wasn’t sure where to go next.
Your clear and well explained example showed me the way!!! Looking forward to reading your other material and spending many many more hours learning and having fun. (And my first foray into Python wasn’t as daunting as I expected thanks to you).
Hi Jason, I am using your tutorial for my own ML model and it’s fantastic! I’m trying to predict make prediction on new data and am using
NB=GaussianNB()
new_prediction = predict.nb(new data)
print(new_prediction)
I am able to successfully get one prediction, how can I get the top 5 classifications for my new data? I have 15 possible classifications and I’d like the predict function to yield the top 5 instead of just the single prediction
Any help would be greatly appreciated, thank you so much!
If I want it to predict n best class labels I need to use predict_proba and manually match the n best probabilities to their class label correct? There is no other way to to yield the top 5 class labels?
I am using python3 on my mac, and I am also using Jupyter notebooks in order to complete the assignment on this webpage. Unfortunately, when I save the Iris dataset in my Desktop folder, and then run the command # shape
print(dataset.shape), the output is
(193, 5)
As you know, the output should be (150,5) and I am not sure why the dimensions of the dataset are wrong. Also, I tried to use the archive: https://archive.ics.uci.edu/ml/machine-learning-databases/iris/iris.data, but the Jupyter output was the following
—————————————————————————
SSLError Traceback (most recent call last)
/Library/Frameworks/Python.framework/Versions/3.6/lib/python3.6/urllib/request.py in do_open(self, http_class, req, **http_conn_args)
1317 h.request(req.get_method(), req.selector, req.data, headers,
-> 1318 encode_chunked=req.has_header(‘Transfer-encoding’))
1319 except OSError as err: # timeout error
/Library/Frameworks/Python.framework/Versions/3.6/lib/python3.6/http/client.py in request(self, method, url, body, headers, encode_chunked)
1238 “””Send a complete request to the server.”””
-> 1239 self._send_request(method, url, body, headers, encode_chunked)
1240
/Library/Frameworks/Python.framework/Versions/3.6/lib/python3.6/http/client.py in _send_request(self, method, url, body, headers, encode_chunked)
1284 body = _encode(body, ‘body’)
-> 1285 self.endheaders(body, encode_chunked=encode_chunked)
1286
/Library/Frameworks/Python.framework/Versions/3.6/lib/python3.6/http/client.py in _send_output(self, message_body, encode_chunked)
1025 del self._buffer[:]
-> 1026 self.send(msg)
1027
/Library/Frameworks/Python.framework/Versions/3.6/lib/python3.6/http/client.py in send(self, data)
963 if self.auto_open:
–> 964 self.connect()
965 else:
/Library/Frameworks/Python.framework/Versions/3.6/lib/python3.6/http/client.py in connect(self)
1399 self.sock = self._context.wrap_socket(self.sock,
-> 1400 server_hostname=server_hostname)
1401 if not self._context.check_hostname and self._check_hostname:
How can I get the correct dimensions of the Iris dataset?
I’ve been eyeballing this tutorial for a while and finally jumped into it! I’d like to thank you for such a clear intro into machine learning! This has been the only tutorial I’ve found so far that actually has you evaluating the data / different models right off that bat.
My sincere gratitude for this work you do to help us all out with ML. I have also been working away at this very wonderful field over the last 3 years now ( PhD research – studying gaze patterns and trying to build predictive models of gaze patterns which represent some sort of behavior). In any case, I was reviewing the code you built here and I was just thinking that I don’t tend to declare the test_size explicitly or the random_state either – I just put it directly into the algorithm
so, your code goes:
X_train, X_validation, Y_train, Y_validation = model_selection.train_test_split(X, Y, test_size=validation_size, random_state=seed) – totally spot on by the way,
My small addition/improvement – if you can call it that – would be to simply say
# test_size keyword argument surely invokes the split method of the train_test_split module (I think) – meaning that the algorithm automatically assigns 80% to the training set and 20% to the test set
would you agree with this method? My python 3.x installation accepts this method just fine –
Also , I don’t know if anyone else might have suggested this, but it is also worth pointing out that for cross_val (cv) – the fold size can be quite resource intensive and also there are underfitting/overfitting issues to be aware of, when doing cross validation –
Indeed the number of folds is important and we must ensure that each fold is sufficiently representative of the broader problem.
As for specifying the test size a different way, that’s fine. Use whatever works best on your problem. The key is developing unbiased estimates of model skill on unseen data.
Thank you, Jason Brownlee, the post is very helpful. I was really lost in so many articles, blogs, open source tools. I was not able to understand how to start ML. Your post really helped me to start at least. I installed ANACONDA, ran the classification model successfully.
Next Step – Understand the concept and apply on some real use cases.
Thanks for this extremely helpful example. I just have a question about your validation method as I was a little confused. It seems to me that you withhold 20% of the data for validation, then perform 10-fold cross-validation on only the 80% training data, then train a new model on entire 80% training data and test with 20% validation data. Is this correct, and if so is it common practice? It seems to me that the best way to get statistics about the best model is to simply use all of the data and perform 10-fold cross-validation. Why do you only perform cross-validation on 80% of the data, then evaluate a new model and only test it with a single validation set?
We hold back a test set so that if we over fit the model via repeated cross validation (e.g. parameter tuning), we still have a final way of checking to see if we have fooled ourselves.
Thanks for that link Jason, it was a great read. I had the exact same question and luckily found this post. I thought that the 20% test set was “wasted” by not using it during cross validation. Now I think the complete opposite. To the point where I have a follow-on question:
Technically speaking, when you visualized the dataset before train-test-splitting it, wouldn’t that count as information leakage, in the strictest sense of the term?
You start by reading in the entire CSV, then visualizing it with plots and as a human think “Hey, that data looks like it’s in such a shape, and sort of looks like it would suit such and such an algorithm.” Maybe the thought is even unconscious. And then that thought could bias your choice of algorithms to evaluate. Which in turn could bias the estimate of the “true” accuracy of the model.
I can phrase this another way. From your linked article, they say you should “lock it [the test set] away until you are completely done with learning”. By “lock it away” I take them to mean you shouldn’t even peek at it as a human at all. No information should leak into your own brain or into any of the training code that you write. That includes even plotting it, right?
Thanks. Loved your result-first approach… Next I will use my own data set for a multi class problem. Hoping i would succeed !
A question
Given i will not have all the time to master writing new ML algorithms, I was wondering do i really need to ? I am an average developer from the past,(and new to Python but find it easy). I am thinking i should rather master how to prepare, present and interpret data – i understand domain very well – , and understand which algorithm (and libraries) to use for best results. I am guessing that, even to master applied ML, it will take many real projects !
I am keen in using ML in predicting data quality problems such as outliers that may need correction. any pointers ?
thank you this was really helpful >> too many indices for array
so I give him the data in 2 dimension instead of 1-D and use this >>> numpy.loadtxt( dataset , delimiter=None , ndmin=2) but he give me this error>>> could not convert string to float ,maybe because there are float and string in the iris file
what’s the solution please I have to split them 🙁
i’m really sorry for the bad english and thank you again <3
Sorry I don’t know where the rest of the previous comment disappeared>>so i a got a question
how could I separate the data such like this
features = dataset[:,0:4]
classification = dataset[:,4]
which is mean in other words when I write print (dataset.shape) I want him to give me :
(150,4) instead of (150,5) I told you that first I try to do this but he told me >> too many indices for array…continue reading at the beginning in the comment above
I’d like to thank you for this concise but very helpful tutorial. I’m new to python and all the the code is clear apart the following part:
# evaluate each model in turn
results = []
names = []
for name, model in models:
kfold = model_selection.KFold(n_splits=10, random_state=seed)
cv_results = model_selection.cross_val_score(model, X_train, Y_train, cv=kfold, scoring=scoring)
results.append(cv_results)
names.append(name)
msg = “%s: %f (%f)” % (name, cv_results.mean(), cv_results.std())
print(msg)
It’s not to clear to me how this ‘for’ cycle works. Specifically what is name and model?
It is evaluating the model using 10 fold cross validation. That means, 10 models are created and each is evaluated and the average score is calculated and stored in the list.
did you mean to write this command?
dataset = pandas.read_csv(url, names = parameters)
I did like you do in this lecture and imported the data file from the link ,But still can not separate the data
I think what he is trying to say is: he followed the tutorial as required, but once he got to the part where he had to load the iris dataset, he received a traceback from the line “dataset = pandas.read_csv(url, names = parameters)” in the python code provided. The traceback i received from this line was “NameError: name ‘pandas’ is not defined. Currently trying to fix, If i solve it before you get a chance to reply i will make sure to comment back on this tread what the problem was and how i fixed it.
for section 2.2 to fix this error, imported panda along with the script. hopefully this did the trick. I do not understand why pandas needed to be imported again, but, i did it.
Actually, it appears that _sup_title is correct; ‘subtitle’ is not recognized. (For me, it didn’t work with ‘subtitle’, but worked like a charm with ‘suptitle’ which must stand for something like “supratitle”…
And I would like to create dataset, which is precisely focused on handwritten language recognition using RNN. Would you please share some of your ideas, thoughts and resources.
Hi , this article is really nice.. I am executing statements..and those are also working fine..But still i am not getting what i am doing..I mean where is the logic? And what is this validation set means.What actually we are doing here? What is the intention?
Hi Jason!
When plotting the multivariate and univariate plots in Jupyter, I found them rather small. Is there a way to increase their size?
I’ve tried using figsize, matplotlib.rcParams nothing seems to be working.Please help me out
hi Jason….first of all thank for such a good tutorial.
my question is: while execution my python interpreter stuck at the following line:
X_train, X_validation, Y_train, Y_validation = model_selection.train_test_split(X, Y, test_size=validation_size, random_state=seed)
and it neither produce any error nor correct output.
Thank you so much Mr Joson, this tutorial is very helpful and professionally designed.
I also got this to ask, can we get the training time for each classifier produced?
The training vs testing error graph as well?
HI Jason,
seem this line of code doesn’t work
dataset.plot(kind = ‘box’, subplots = True, layout = (2,2), sharex = False, sharey = False)
plt.show()
It doesn’t show anything. Could you help me?
Thanks you and best regard
Traceback (most recent call last):
File “machinelearning1.py”, line 63, in
kfold = model_selection.Kfold(n_splits=10,random_state=seed)
AttributeError: ‘module’ object has no attribute ‘Kfold’
I have no idea about machine learning. just blindly following the tutorial example to just get an idea what is ML.
cn you tell me how am I supposed to correct this error.
I also wish you will be explaining all codes and functions in details step by step in future lessons
Thank you for your tutorial, it is amazing. Could you possibly do a follow up to this where you show how to package this, and use it? For instance I am not sure how to feed in new values, either manually or dynamically and then how could I store this data in a csv?
This is a superbly put tutorial for someone starting out in ML. Your step-by-step explanations allow people to actually understand and gain knowledge. Thank you so much for this and others that you have made.
the 5&6 bar shows a different hight on sepal-lenght … did they changed the dataset or anything? Im not concerned, but just curious what could cause such a difference in display/result.
i imported everything properly, except the fact that i did not install theano because im planning to use TF. Can that have an issue on how it deals with data ? should i install it anyway ?
Also i get different results when running my models… for me SVM is the best.
Could that be related to the visualization displaying something else before ?
Could there be any changes to a newer version of the installed libraries ?
NumPy now working differently after they adjusted an algorythm or something like that ?
Maybe all who use the updated versions of all the included tools get this result ;/
you say they give out different results everytime , but it seems like everyone who is going through the tutorial right now is getting the “new” results.
I tried to fix the random seed to make the example reproducible, but it is only reproducible within the set of libraries and their specific versions used. Even the platform can make a difference.
Hi, I’m new to machine learning. I started studying it for college purposes. Your tutorial really helped me and I was able to make it work with different datasets but now I wonder if there’s a way, for example, to set the output (knn.__METHODNAME__(‘Iris-setosa’)) and the method return generated data according to the parameter (in this case, sepal length and width and petal length and width).
Thanks in advance!
hi sir ,can you help to make an artificial neural network on how i import my train data(weight ,biases)in python programming to classify its category in class 1 to 4 manually and input the sample as the program execute or run sir ,i have 5 neuron to test my Ai.
Great tutorial sir 🙂
Im facing a problem in logistic regression with python +numpy +sklearn
How to convert all feature into float or numerical format for classification
Thanks
for me the result comes different:
LR: 0.966667 (0.040825)
LDA: 0.975000 (0.038188)
KNN: 0.983333 (0.033333)
CART: 0.975000 (0.038188)
NB: 0.975000 (0.053359)
SVM: 0.991667 (0.025000)
Nice guide. I did understand everything you have done but I had a small confusion regarding the seed variable being assigned to 7. I didn’t understand its significance. Can you please tell me why we have considered the variable seed and why has it been assigned to 7 and not some other random number?
#load libraries
import pandas as pd
import IPython.display as ipd
import librosa
import librosa.display
import matplotlib.pyplot as plt
from pandas import read_csv
from pandas.plotting import scatter_matrix
from matplotlib import pyplot
from sklearn.model_selection import train_test_split
from sklearn.model_selection import cross_val_score
from sklearn.model_selection import StratifiedKFold
from sklearn.metrics import classification_report
from sklearn.metrics import confusion_matrix
from sklearn.metrics import accuracy_score
from sklearn.linear_model import LogisticRegression
from sklearn.tree import DecisionTreeClassifier
from sklearn.neighbors import KNeighborsClassifier
from sklearn.discriminant_analysis import LinearDiscriminantAnalysis
from sklearn.naive_bayes import GaussianNB
from sklearn.svm import SVC
import pandas
from pandas.tools.plotting import scatter_matrix
import matplotlib.pyplot as plt
from sklearn import model_selection
from sklearn.model_selection import train_test_split
from sklearn.model_selection import cross_val_score
from sklearn.model_selection import KFold
from sklearn.metrics import classification_report
from sklearn.metrics import confusion_matrix
from sklearn.metrics import accuracy_score
from sklearn.linear_model import LogisticRegression
from sklearn.tree import DecisionTreeClassifier
from sklearn.neighbors import KNeighborsClassifier
from sklearn.discriminant_analysis import LinearDiscriminantAnalysis
from sklearn.naive_bayes import GaussianNB
from sklearn.svm import SVC
Traceback (most recent call last):
File “ns.py”, line 26, in
X_train, X_validation, Y_train, Y_validation = cross_validation.train_test_split(X, Y, test_size=validation_size, random_state=seed)
NameError: name ‘cross_validation’ is not defined
Thanks Jason its real great to do this project you open my eyes in the world of machine learning in python.Just have one questions i long does it take to learn algorithms in python?
and
its advisable to learn python libraries for machine learning such as pandas, numply matplotlib and others before start learn different algorithms?
Thanks Jason! its really beautiful to learn about ML using Python . Thanks for your effort to make it effortless. would you please recommend me unsupervised HMM using Python.
Why do you split the data into train and validation sets at the very beginning using “train_test_split”? I thought the K-Fold cross validation does that for us in this line:
Hi Jason,
Thanks for your tutorial, it is really awsome! I want to use machine learning approach for biology problems. I have a question below and hopr you could me give me some suggestions. Thanks in advance.
I have eight DNA sequences which are labeled as eithor “TSS” or “NTSS”. If I want to use your code here to predict whether a DNA sequence is TSS or not, do I need to transfer these sequences into numbers? If yes, do you have any suggestions of how to od that?
This step by step tutorial is very interesting.
But I need yellow fever data set CSV file .. to predict yellow fever using machine learning.
Please any on can help me…@ teklegimay@gmail.com
Thanks for you help. This is awesome.
I have one issue : How can I rescale the axis ?
I have an error : ValueError: x and y must be the same size.
I have 3 features and 1 class for more than 245 000 data points.
please help.
Nice and precise explanation. But can you please elaborate the problem definition here. Happy to see the step by step approach, still missing the actual problem or task we need to explore.
Below mentioned the basic stupid question.
What result we are expecting from this problem solution.
sir i am not geetting what the classification report is ?,wht is the meaning of precision,recall,f1 score and the support ,what it actually tells us,what the table is for? ,and what we understand with the help of the table
Great article. It’s been a lot of help. I’ve been applying this to other free datasets to practice (e.g. the titanic dataset). One thing I haven’t been able to figure out is how to show which columns are the most predictive. Do you know how to do that?
I can’t say thank you enough. This step by step tutorial is awesome. I´m so interested to try ML in a real project and this is a good way. I agree with you, academic is a little slow even though we can see more details.
I really appreciate your post and very thankful to you.
This post is very important for ML beginner like me.
I really loved the content and the way you make complex things simpler.
But I have one doubt, It would be very helpful to me if you help me building my understanding.
Question :
From the section “5.3 Build Models” line number 12
for name, model in models:
Please explain what is ” name, model ” here, its purpose and how it is working, (because I hadn’t seen any FOR loop like this. I had learn python from YouTube videos and have very basic understanding)
P.S. I ran your code and its perfectly working fine.
Hello Jason, I am curious about ai and ml.Tons of thanks for your hard work and commitment.I have done installation of Anaconda and checked all the libraries successfully.My ignorance of programming is compelling me to ask this ridiculuous question. But i cant understand that where to upload dataset ? To be more clear i mean i dont understand even that where to write those url and given command to upload dataset ? on Jupiter notebook, or on conda prompt window ??? Please reply for kind of stupid question. Thanking you in anticipation.
dataset = pandas.read_csv(‘D:\CMPE333\Project\Speed Dating Data_2.csv’, header = 0)
array = dataset.values
X = array[:,0:12]
Y = array[:,12]
validation_size = 0.20
seed = 7
X_train, X_validation, Y_train, Y_validation = model_selection.train_test_spilt(X, Y, test_size=validation_size, random_state=seed)
I got the error:
runfile(‘D:/CMPE333/Project/project.py’, wdir=’D:/CMPE333/Project’)
Traceback (most recent call last):
File “”, line 1, in
runfile(‘D:/CMPE333/Project/project.py’, wdir=’D:/CMPE333/Project’)
File “C:\ProgramData\Anaconda3\lib\site-packages\spyder\utils\site\sitecustomize.py”, line 710, in runfile
execfile(filename, namespace)
File “C:\ProgramData\Anaconda3\lib\site-packages\spyder\utils\site\sitecustomize.py”, line 101, in execfile
exec(compile(f.read(), filename, ‘exec’), namespace)
File “D:/CMPE333/Project/project.py”, line 33, in
X_train, X_validation, Y_train, Y_validation = model_selection.train_test_spilt(X, Y, test_size=validation_size, random_state=seed)
AttributeError: module ‘sklearn.model_selection’ has no attribute ‘train_test_spilt’
The dataset is stored as comma delimited csv file and has been loaded into a dataframe.
Can you tell me where is wrong? Thank you!!!
Hello Json, Thank you. But one thing didn’t clearly.Can you tell me in above example output what we predict? What we find? We are getting summarized the results as a final accuracy score, but about whos?
Getting error in Class Distribution. If I give sum() instead of size() it works fine. Please suggest resolution.
======================================
# class distribution
print(dataset.groupby(‘class’).size())
======================================
Output
Traceback (most recent call last):
File “C:\\Python\ML\ImportLibs.py”, line 30, in
print(dataset.groupby(‘class’).size())
File “C:\Users\Meghal\AppData\Roaming\Python\Python35\site-packages\pandas\core\base.py”, line 59, in __str__
return self.__unicode__()
File “C:\Users\Meghal\AppData\Roaming\Python\Python35\site-packages\pandas\core\series.py”, line 1060, in __unicode__
width, height = get_terminal_size()
File “C:\Users\Meghal\AppData\Roaming\Python\Python35\site-packages\pandas\io\formats\terminal.py”, line 33, in get_terminal_size
return shutil.get_terminal_size()
File “C:\Users\Meghal\AppData\Local\Programs\Python\Python35-32\lib\shutil.py”, line 1071, in get_terminal_size
size = os.get_terminal_size(sys.__stdout__.fileno())
AttributeError: ‘NoneType’ object has no attribute ‘fileno’
============================================
Not sure why, but for me, SVM is giving me a higher accuracy in terms of precision, recall, and f1-score, but it ultimately has the same support score as KNN
Generally, we cannot know what algorithm will be “best” for a given problem. Our job is to use careful experiment to discover what works best for a given prediction problem.
Jason, you are the best!!
Thanks for putting together all that material in a meaningful way, in a simple language and aesthetic environment.
There are not enough words to say how thankful I am.
Hey Jason, fantastic tutorial. I have one questions though. Is there a way I could test the system by inputting a flower and the computer identifying it? Thank’s a million!
Hi Jason, Thanks a lot for the excellent step by step material to give a quick run-through of the methodology.
I am a tenured analytics practitioner and somehow found some time off to learn Python and was looking through the IRIS project itself. I had hypothesised that by adding more ratio variables to the dataset, we should get a better result on the prediction, Your excellent article gives me a ready code to test my hypothesis. I will share my results once I have them. 🙂
Here are the k-Fold results: I used additional variables simply as all ratios of the original length variables respectively with no separate effort on dimensionality reduction.
Drill down to the independent validation results for each technique:
Results for LR : 1.0
Results for LDA : 0.933333333333
Results for KNN : 1.0
Results for CART : 0.9
Results for NB : 0.966666666667
Results for SVM : 1.0
Although validation results are better across the board, I think LDA performs much better by this for K-fold method because other models may require a detailed variable selection or dimensionality reduction effort.
I would be glad to hear more from you on this. I am reachable on abhishek.zen@gmail.com.
Hi Jason,
Thank you for the great tutorial. once we run test and validate the model. How can we deploy the model. Also, how can we make the model predict on new data-set and still continuously learn from the new data.
Thanks Jason for this well explained post!
I am an aspiring data scientist and currently working on Wallmart’s sales forecasting dataset from kaggle.
If it is possible can you please also share a post about predicting the sales for this dataset?
It will be very helpful because I am not finding such a step by step tutorial in Python.
Thanks for the amazing guide
can i know how to get the sensitivity and specificity and recall
you had a good Example Confusion Matrix in R with caret
but in the same page i could get the confusion for python but not the elements like
sensitivity and specificity and recall
Thankyou very much for the great tutorial.
I analyzed every step but one thing it is not clear for me, and maybe it is the most important part of the tutorial 😉
At the end of all our steps I would expect a function or something else to answer Python questions like these:
1. I have a flower with sepal-lenght=5, sepal width=3.5, petal-lenght=1.3 and petal-width=0.3, which class is it?
2. I have an Iris-setosa with sepal-lenght=5, sepal width=3.5, petal-lenght=1.3. What could be the petal-width?
Isn’t this one of the the main objectives of the ML?
This is a brilliant turtorial, thank you. I have a few questions – you split the data in to training and validation, but in this case would it not be classed as training and test?
Also, do you have any posts on tuning hyperparamters such as the learning rate in Logistic Regression? It was my understanding that a validation set would be used for something like this, while holding back the test set until the models been fine-tuned…but now I’m not sure if I’m confused!
Also, in case I want to use X, Y by themselves. How could I arrange them in a ordered manner so I don’t have totally random results because my classes aren’t the right ones?
cv_results = model_selection.cross_val_score(model, X, Y, cv=kfold, scoring=scoring)
With kfold = 3 for example. You will get 3 different groups, each with one type of iris flower because sklearn doesn’t shuffle it by its own and the dataset is arranged by flower-type.
Yes it does. In 3 fold I was getting under 70% accuracy. Shuffling makes it more evenly distributed (not 3 totally different groups). And I could get 90%_ acc
Also, I figured that I could simply use the parameter “Shuffle=True” in .KFold
Excellent way of explaining the basics of machine learning.
I assume that in almost all machine learning program if we are able to classify the data accurately then by applying algorithms we can understand much better about data .
classification is the key in supervised and clustering is the key in unsupervised learning is basics for a very good model.
Here’s a really nit-picky observation: You have two sections labeled 5.3.
Nit-picking aside, this is an excellent starter for ML in Python. I am currently taking the Coursera / Stanford University / Dr. Andrew Ng Machine Learning course and being able to see some of these algorithms that we have been learning about in action is very satisfying. Thank you!
When evaluating we found that KNN presented the best accuracy, KNN: 0.983333 (0.033333). But when the validation set was used in KNN to have the idea of the accuracy, I see that the accuracy now is 0.9 so it decreased, while is was expecting the same accuracy. Can I consider this as over fitting? I can consider that KNN over fitted the train data? Is this difference of accuracy in the same model while training and validating acceptable?
File “ml.py”, line 73, in
cv_results = model_selection.cross_val_score(model, X_train, Y_train, cv=kfold, scoring=scoring)
File “/usr/local/lib/python2.7/dist-packages/sklearn/model_selection/_validation.py”, line 342, in cross_val_score
pre_dispatch=pre_dispatch)
File “/usr/local/lib/python2.7/dist-packages/sklearn/model_selection/_validation.py”, line 206, in cross_validate
for train, test in cv.split(X, y, groups))
File “/usr/local/lib/python2.7/dist-packages/sklearn/externals/joblib/parallel.py”, line 779, in __call__
while self.dispatch_one_batch(iterator):
File “/usr/local/lib/python2.7/dist-packages/sklearn/externals/joblib/parallel.py”, line 625, in dispatch_one_batch
self._dispatch(tasks)
File “/usr/local/lib/python2.7/dist-packages/sklearn/externals/joblib/parallel.py”, line 588, in _dispatch
job = self._backend.apply_async(batch, callback=cb)
File “/usr/local/lib/python2.7/dist-packages/sklearn/externals/joblib/_parallel_backends.py”, line 111, in apply_async
result = ImmediateResult(func)
File “/usr/local/lib/python2.7/dist-packages/sklearn/externals/joblib/_parallel_backends.py”, line 332, in __init__
self.results = batch()
File “/usr/local/lib/python2.7/dist-packages/sklearn/externals/joblib/parallel.py”, line 131, in __call__
return [func(*args, **kwargs) for func, args, kwargs in self.items]
File “/usr/local/lib/python2.7/dist-packages/sklearn/model_selection/_validation.py”, line 458, in _fit_and_score
estimator.fit(X_train, y_train, **fit_params)
File “/usr/local/lib/python2.7/dist-packages/sklearn/linear_model/logistic.py”, line 1217, in fit
check_classification_targets(y)
File “/usr/local/lib/python2.7/dist-packages/sklearn/utils/multiclass.py”, line 172, in check_classification_targets
raise ValueError(“Unknown label type: %r” % y_type)
ValueError: Unknown label type: ‘unknown’
Unfortunately, when I load my dataset (it contains 4 features & 1 class “each with string datatype”), and then run the command
cv_results = model_selection.cross_val_score(model, X_train, Y_train, cv=kfold, scoring=scoring),
I found the following error:
ValueError: could not convert string to float:
Jason, great tutorial, this is extremely helpful! A couple of questions:
1) I realize that this is just an example, but in general, is this the process that you personally use when you are building production models?
2) What would the next steps be in terms of taking this to the next level? Would you choose the model that you think performs best, and then attempt to tune it to get even better results?
Hello,
The tutorial worked like a charm and I had no problem running it. However my need and that of a large number of linguists is different.
As a linguist [and there are many like me throughout the world] we need to identify relationships within a source language or between a source and a target language.
At present I use an automata approach which states
a->b in environment x
This however implies that rules have to be manually written by hand and in the “brave new world” of big data this becomes a huge problem.
I have searched and not located a simple tool which does this job using RNN. The existing tools are extremely complex and adapting them to suit a simple requirement of the type outlined above is practically impossible.
What I need is:
a. A tool which installs itself deploying Python and all accompanying libraries.
b. Asks for input of parallel data
c. generates out rules in the back ground
d. Provides an interface for testing by entering new data and seeing if the output works.
e. It should work on Windows. A large number of such prediction tools are Linux based depriving both Windows and Mac users the facility to deploy them. My Windows10 is hopefully Linux Compatible but I have never tested the shell.
f. Above all ease of use. A large number if not all Linguists are not very familiar with coding.
Do you know of any such tool ? And can such a tool be made available in Open Source. You would have the blessings of a large number of linguists who at present have to do the tedious task of generating out rules by hand and once again generating out new rules every time a sample not considered pops up.
I know the Wishlist above is quite voluminous.Hoping to get some good news
Traceback (most recent call last):
File “”, line 1, in
File “/usr/local/lib/python2.7/dist-packages/pandas/plotting/_core.py”, line 2677, in __call__
sort_columns=sort_columns, **kwds)
File “/usr/local/lib/python2.7/dist-packages/pandas/plotting/_core.py”, line 1902, in plot_frame
**kwds)
File “/usr/local/lib/python2.7/dist-packages/pandas/plotting/_core.py”, line 1729, in _plot
plot_obj.generate()
File “/usr/local/lib/python2.7/dist-packages/pandas/plotting/_core.py”, line 251, in generate
self._setup_subplots()
File “/usr/local/lib/python2.7/dist-packages/pandas/plotting/_core.py”, line 299, in _setup_subplots
layout_type=self._layout_type)
File “/usr/local/lib/python2.7/dist-packages/pandas/plotting/_tools.py”, line 197, in _subplots
fig = plt.figure(**fig_kw)
File “/usr/local/lib/python2.7/dist-packages/matplotlib/pyplot.py”, line 539, in figure
**kwargs)
File “/usr/local/lib/python2.7/dist-packages/matplotlib/backend_bases.py”, line 171, in new_figure_manager
return cls.new_figure_manager_given_figure(num, fig)
File “/usr/local/lib/python2.7/dist-packages/matplotlib/backends/backend_tkagg.py”, line 1049, in new_figure_manager_given_figure
window = Tk.Tk(className=”matplotlib”)
File “/usr/lib/python2.7/lib-tk/Tkinter.py”, line 1818, in __init__
self.tk = _tkinter.create(screenName, baseName, className, interactive, wantobjects, useTk, sync, use)
_tkinter.TclError: no display name and no $DISPLAY environment variable
– What do the bars represent in Algorithm Comparison in Section 5.4? Take LDA for example, the stated accuracy and standard deviation are 0.98 and 0.04. The bar in the chart finishes at about 0.94 and the whisker at about 0.92. Take knn for another example, the stated accuracy and standard deviation are 0.98 and 0.03. However, the bar finishes at 1 and the whisker at 0.92. How do I interpret the bars and whiskers? Is y-axis accuracy?
– how to read the confusion matrix without labels? My guess is row and column (missing) labels represent actual and predicted classes, respectively. However, I am unsure about the order of classes. is there a way to switch on the labels?
I collected and annotated the code in a python script (iris.py), and placed it on the github: https://github.com/dr-riz/iris
Thanks for your reply and reminder. Credits and Source,URLs are now noted in README. 🙂
Re LDA example: the stated accuracy and standard deviation are 0.98 and 0.04. Yes, the box plot renders metrics such as minimum, first quartile, median, third quartile, and maximum but *not* necessarily mean. Hence, we don’t see mean and std in the box plot in Section 5.4.
Nice. Took me a little longer than 10 mins, but works as advertised. (I did everything under python3, no big difference I think.)
What would be really cool here would be a “what is going on here” section at the end. But it’s real nice to have something that actually runs, and be able to poke about with it it a bit.
Hello Jason, I wanted to ask you if the seed dataset can be treated like iris, using your tutorial I arrived at 97% accuracy, do you think it can still improve? The dataset site is: https: //archive.ics.uci.edu/ml/datasets/seeds.
I am getting the syntax error pasted below at the start of the for loop to evaluate each model. I have made sure that I am copying and pasting it directly, and tried a few of my own fixes. Any help as to why this is occurring would be great! Thanks in advance!
for name, model in models:
File “”, line 1
for name, model in models:
^
SyntaxError: unexpected EOF while parsing
I tried the above tutorial.But i got accuracies differ from the given above for the same dataset.why?also the boxplot for the same is changing each time
I think I downloaded the same dataset as you have here but the sepal-length data seems to have changed a bit. Not to worry though as you can easily follow the exact same steps except you just have to make predictions using SVC ()
Hi Jason, watched your videos and you are awesome, can you tell me how to train our own image data database ans split into train and test sets, labels…thank you for listening to me…
a. In Section 4.1 – HIstogram – the distribution in Sepal Length is quite different from yours. May be that’s due to the random nature of Machine Learning ?
b. In section 5.4 – Box and whisker plot: the plots for LR , LDA and CART are similar but for
KNN, SVM; I could only get a “+” sign at around 0.92 (no box and no whisker shown). For NB, I could only get 1 “+” sign at 0.92 and 1 “+” sign at around “0.83”.
Grateful if you could advise. Thanks.
I am using :
window 10, python 3.5.2 – Anaconda custom (64 bit)
scipy: 1.0.0
numpy: 1.13.3
matplotlib: 1.5.3
pandas: 0.18.1
statsmodels: 0.6.1
sklearn: 0.19.1
theano: 0.9.0.dev-unknown-git
Using TensorFlow backend.
keras: 2.1.2
Thanks, but something goes “wrong”. Grateful if you could advise.
In section 5.4 – Box and whisker plot: the plots for LR , LDA and CART are similar to that shown in your web page
but for KNN, SVM; I could only get a “+” sign at around 0.92 (no box and no whisker shown). For NB, I could only get 1 “+” sign at 0.92 and 1 “+” sign at around “0.83”.
This is amazing tutorial and it’s really helps me to understand well!!.. Please I want to know, do you have this type of tutorials for “pyspark” ? Can you suggest me any links, books, pdf or any tutorials? Thank you
Yeah I made some mistake while loading the data. I corrected it.
I have some questions.
What is confusion matrix and support in final result? Can you please tell about these things? For logistic regression/ classification algorithms, we need to calculate weights and we need to provide learning rate for cost function and we need to minimize it right? Is it taken care in python libraries?
I also got the same error about reshaping the data. I double checked the loading of my data and it’s loading fine. Not sure what the problem is. Any help will be appreciated. Great tutorial Jason!
I have a technical problem please! I have downloaded Anaconda 3.6 for windows in my desktop.However, I am unable to see Terminal window or Anaconda Prompt although I have the anaconda navigator installed. Is there something wrong?
Sorry, If its a very basic question. I am a newbie in Machine Learning. Was trying to understand the explanation.
I have a question at below code block, where we are splitting the dataset into input (X) and output(Y). What is the use of the output set ? What is its significance ?
# Split-out validation dataset
array = dataset.values
X = array[:,0:4]
Y = array[:,4]
validation_size = 0.20
seed = 7
X_train, X_validation, Y_train, Y_validation = model_selection.train_test_split(X, Y, test_size=validation_size, random_state=seed)
Jason, one more more clarification needed on the “output values” . In many articles , I have seen that ML works only on numeric values (even its of different type we need to convert it to numeric). Doesn’t it apply to the “output values” we are using ? Don’t we need to convert them to numeric ?
Sir,
Through your article i have successfully installed python 2.7 anaconda and every stage i got it successful. Now as i tried to delve into this tutorial i am problems.
I first run a check on versions of libraries as you said and the result is okay:
The next step which is to import libraries and i did by copy and pasting into a script file running with this command: python script.py and not error shown.
Where i had problem is to load the dataset csv from ML repo.
As i execute the command to load dataset from a script file
i have the following error
—————————————————————————————-
Traceback (most recent call last):
File “script.py”, line 4, in
dataset = pandas.read_csv(url, names=names)
NameError: name ‘pandas’ is not defined
Got it now.
If i am correct, the initially supplied output values gives the model an inference that for some given set of inputs, this would be the output ? And finally, based on this my model will be trained and then work on the entirely new inputs provided to the system ?
I’m always fan of your tutorials. Please, have done any tutorials like this for explaining every algorithm in depth including mathematics behind them, how and what exactly happening in side the algorithm.
i’m also using my own dataset, and i get the same error as Martine above:
File “/Users/Hugues/anaconda3/lib/python3.6/site-packages/sklearn/utils/multiclass.py”, line 172, in check_classification_targets
raise ValueError(“Unknown label type: %r” % y_type)
ValueError: Unknown label type: ‘continuous’
I can check my dataset, but what should we be looking for ? I have used that dataset with the LSTM model without any error messages.
The multiclass.py code that is giving the error is:
if y_type not in [‘binary’, ‘multiclass’, ‘multiclass-multioutput’,
‘multilabel-indicator’, ‘multilabel-sequences’]:
raise ValueError(“Unknown label type: %r” % y_type)
line 172 is the last line
looks like ‘continuous’ is not expected. Where is ‘continuous’ coming from ?
googling this error code i find the following solution:
“You are passing floats to a classifier which expects categorical values as the target vector.”
I thought my last column is categorical because it contains only 1 and 0, but i guess i0’m wrong. Is there a way out ?
What would be the next step, therefore, if I wanted to apply this prediction to new data? I.e. if we got a new data set with just the measurements, how do we program the use of the predictions we’ve found to estimate the species?
RE: is the validation dataset nugatory given the k-fold validation process
Whilst the idea of separating out a “final independent test data set (30 samples)” away from the k-fold cross validation process seems nice, is it not actually wasting the opportunity to develop and compare the N model types using the larger and therefore more useful data set within the k-fold process ?
In short, the k-fold process seems to already be doing everything that the hold-out sample is purporting to do.
Out another way, surely the hold out data is no more independent than the i(th) hold out data partitioned within i(th) k-kold execution ?
This post is a great starting point – I am new to coding (with only basics at hand), python with lot of interest in ML. The post has got me started with it… I was able to run most of the tutorial successfully with few experiments by changing the graphs, seed values, kfolds etc. Few questions though –
1. In one of the answers you have explained how kfold works on February 17, 2017 –
Now in the for loop, where you define kfold for a model at hand, that split is done only once right? I mean e.g. for LR, being first model to evaluate, we split the data of 120 in 10 folds with 12 items in each. Then as explained in the above post – The model is trained on the first 9 folds and evaluated on the records in the 10th. When we go for next set of 9, we are NOT resplitting the 120 items in new 10 sets right?
2. Also, when you say model is trained on first 9 folds – It means that we are looking at the relationships of the 4 numeric values and the class (out of 3 – Iris-setosa, Iris-versicolor, Iris-virginica) which they belong to, right?
3. When the dataset is split between X and Y values (Y being the output/ result of relationships between 4 values in X), where in the code are we actually mentioning this? I mean how/ where does the algorithm gets to know that X are the independent variables and Y is the dependent variable in which we want to classify our data?
Hi Jason on my dataset I used kfold but couldn’t find any significant difference. Can you explain why this may happen. Also, does using kfold cross_validation lead to overfitting?
P.S:
Excellent tutorial Jason, and thanks very much for it.
One noob question here though –
Where do ‘dataset’ and ‘plt’ get associated in the code above? I ask this coz I don’t see any code where we are associating ‘dataset’ and ‘plt’; and yet when we call ‘plt.show()’, the plot that gets drawn has data from the ‘dataset’.
From the examples I studied to understand pyplot, the recurring idea is
1. set the range to be plotted along the x-axis [ let’s says that’s e ]
2. provide the corresponding values to be plotted along the y-axis [ let’s say that’s f ]
3. Steps 1 and 2 are accomplished by the call – ‘plt.plot( e, f )’
4. After the call to ‘plot’, the call to ‘show’ is made which will display the plot
ex:
e = np.arange(0.0, 2.0, 0.01)
f = 1 + np.sin(2*np.pi*t)
plt.plot(e, f)
plt.show()
As you can see, the call to ‘plot’ provides the values to ‘plt’ and the call to ‘show’ will cause the plotting and display of the same from ‘plt’.
However, in your example, I don’t see any line which is equivalent to the ‘plot’ call.
So my question is – When and where does ‘plt’ get the values from ‘dataset’ that it uses to draw the plot?
Hello Jason,
I have a project in which it should predict the disease by specifying the symptoms.How can I implement this and can you please help me with the attributes of symptoms and all.
Well I got the example running but only after I deleted “scoring=scoring” in code below:
for name, model in models:
kfold = model_selection.KFold(n_splits=10, random_state=seed)
cv_results = model_selection.cross_val_score(model, X_train, Y_train, cv=kfold, scoring=scoring)
results.append(cv_results)
names.append(name)
msg = “%s: %f (%f)” % (name, cv_results.mean(), cv_results.std())
With “scoring=scoring” I received error message something like “scoring not defined”.
Then when I added “scoring=scoring” back I did not received the error and the program runs fine.
I did get this exact error also. Then when I removed “scoring=scoring”, thinking ‘well, maybe the compliler or whatever is smart enough to deal with this’ , the code worked as expected. Then when I reinserted “scoring=scoring”, I did not get the error meassage and the code continued to run as expected.
Just started your tutorial. Looks like the best introduction to machine learning. I’m getting the following error while trying to load the iris dataset. Would appreciate your assistance in correcting my problem. Thanks.
============= RESTART: /Users/TinkersHome/Documents/load_data.py =============
>>> dataset = pandas.read_csv(url, names=names)
Traceback (most recent call last):
File “/Library/Frameworks/Python.framework/Versions/3.6/lib/python3.6/urllib/request.py”, line 1318, in do_open
encode_chunked=req.has_header(‘Transfer-encoding’))
File “/Library/Frameworks/Python.framework/Versions/3.6/lib/python3.6/http/client.py”, line 1239, in request
self._send_request(method, url, body, headers, encode_chunked)
File “/Library/Frameworks/Python.framework/Versions/3.6/lib/python3.6/http/client.py”, line 1285, in _send_request
self.endheaders(body, encode_chunked=encode_chunked)
File “/Library/Frameworks/Python.framework/Versions/3.6/lib/python3.6/http/client.py”, line 1234, in endheaders
self._send_output(message_body, encode_chunked=encode_chunked)
File “/Library/Frameworks/Python.framework/Versions/3.6/lib/python3.6/http/client.py”, line 1026, in _send_output
self.send(msg)
File “/Library/Frameworks/Python.framework/Versions/3.6/lib/python3.6/http/client.py”, line 964, in send
self.connect()
File “/Library/Frameworks/Python.framework/Versions/3.6/lib/python3.6/http/client.py”, line 1400, in connect
server_hostname=server_hostname)
File “/Library/Frameworks/Python.framework/Versions/3.6/lib/python3.6/ssl.py”, line 407, in wrap_socket
_context=self, _session=session)
File “/Library/Frameworks/Python.framework/Versions/3.6/lib/python3.6/ssl.py”, line 814, in __init__
self.do_handshake()
File “/Library/Frameworks/Python.framework/Versions/3.6/lib/python3.6/ssl.py”, line 1068, in do_handshake
self._sslobj.do_handshake()
File “/Library/Frameworks/Python.framework/Versions/3.6/lib/python3.6/ssl.py”, line 689, in do_handshake
self._sslobj.do_handshake()
ssl.SSLError: [SSL: CERTIFICATE_VERIFY_FAILED] certificate verify failed (_ssl.c:777)
When practise 5.Algorithm, I encountered this error message. Also checked all the installed tools & packages, which are all up-to-date.
Kindly please help me to fix it, thanks very much.
>>> # Spot Check Algorithms
… models = []
>>> models.append((‘LR’, LogisticRegression()))
>>> models.append((‘LDA’, LinearDiscriminantAnalysis()))
>>> models.append((‘KNN’, KNeighborsClassifier()))
>>> models.append((‘CART’, DecisionTreeClassifier()))
>>> models.append((‘NB’, GaussianNB()))
>>> models.append((‘SVM’, SVC()))
>>> # evaluate each model in turn
… results = []
>>> names = []
>>> for name, model in models:
… kfold = model_selection.KFold(n_splits=10, random_state=seed)
File “”, line 2
kfold = model_selection.KFold(n_splits=10, random_state=seed)
^
IndentationError: expected an indented block
>>> cv_results = model_selection.cross_val_score(model, X_train, Y_train, cv=kfold, scoring=scoring)
Traceback (most recent call last):
File “”, line 1, in
NameError: name ‘model’ is not defined
>>> results.append(cv_results)
Traceback (most recent call last):
File “”, line 1, in
NameError: name ‘cv_results’ is not defined
>>> names.append(name)
Traceback (most recent call last):
File “”, line 1, in
NameError: name ‘name’ is not defined
>>> msg = “%s: %f (%f)” % (name, cv_results.mean(), cv_results.std())
Traceback (most recent call last):
File “”, line 1, in
NameError: name ‘name’ is not defined
>>> print(msg)
Traceback (most recent call last):
File “”, line 1, in
NameError: name ‘msg’ is not defined
I’m learning ML and PLN and i have a lot of doubts:
you can recommend some article, blog (and so on) to learn more about this? I have to implement a model switching different classifiers for predict/discriminate a class. The model is described below:
– I have a set S of words;
– Each word W of S is a class for prediction;
Two different of vector of features are used:
1 – The first is a vector which use PMI score between W and n-gram ocurring before W and PMI between W and n-gram placed after W. Then, the vector length is twice length of S (set of words);
2 – Other is a vector of 500 most words (vocabulary) ocurring in a context (variable size) surrounding all words of S. If the word (feature) exists in a sentence for training, the vector puts ‘1’ or ‘0’, otherwise. Frequency of word on document (context/sentence) don’t matter here.
I know that i have to vectorize features and create a array of counts, but i can’t understand even a little about what way i’ve to follow after that steps (roughly explained).
Basically, above informations are the most important.
Finally, i wanna use the different classifiers in a “plugable” way. Its possible?
In my case, I am POSTing the IRIS data to a Flask web service, but I don’t see how to get that data into a pandas dataframe using any of the “read_csv” or other methods available. I tried to use io.String(csv_variable), then using read_csv on that, but it still doesn’t work.
First of all, great introduction to cross validation! Your tutorial is comprehensive and I appreciate that you went through everything step-by-step as much as possible.
Just a question regarding section 5.3 Build Models. This was taken from your code directly:
As I have looked at other websites on cross validation as well, I am confused on the X and y inputs. Should it be X_train and Y_train or X and Y (original target and data)? Because I looked at sklearn documentation (http://scikit-learn.org/stable/modules/cross_validation.html#cross-validation), it seems that the original target and data were used instead, and they did not perform a train_test_split to obtain X_train and Y_train.
The model will learn the relationship between flower measurements and iris flower species. Once fit, it can be used to predict the flower species for new flower measurements.
Great example to see what you can and can’t do with your data.
I ran this with my own sample and well, did not get over 70% accuracy so it looks like my data is just not good 😛
I just had to do some small adjustment since this line is hard-coded:
# Split-out validation dataset
array = dataset.values
X = array[:,0:4]
Y = array[:,4]
validation_size = 0.20
seed = 7
X_train, X_validation, Y_train, Y_validation = model_selection.train_test_split(X, Y, test_size=validation_size, random_state=seed)
I had to change it because my dataset has only 3 independent variables:
# Split-out validation dataset
array = dataset.values
n = dataset.shape[1]-1
X = array[:,0:n]
Y = array[:,n]
validation_size = 0.20
seed = 7
X_train, X_validation, Y_train, Y_validation = model_selection.train_test_split(X, Y, test_size=validation_size, random_state=seed)
I think this should work regardless of the number of attributes in any given dataset(?)
i need to build a taxi passenger seeking system using machine learning, i am a beginner. how should i go about it? please suggest some relevant source codes for reference
Thanks for the tutorial. When I run the code, the Support Vector Machine got the best score (precision 0.94), while the knn got precision 0.90, as in your example. I am using Python 3. Is the different result caused by the global warming? 🙂
I have Python: 2.7.10 (default, May 23 2015, 09:40:32) and the following versions of the libraries:
scipy: 0.15.1
numpy: 1.9.2
matplotlib: 1.4.3
pandas: 0.16.2
sklearn: 0.18.1
I have modified your example considering the following structure for the dataset:
Age Weight Height Metbio RH Tair Trad PMV TSV gender
0 61 61.4 175 2.14 31.98 21.35 20.58 -0.38 0 male
1 39 81.0 178 2.19 46.88 24.25 24.09 0.30 1 male
[…]
All works fine, except for the following part:
I have created a validation dataset considering:
# Split-out validation dataset
array = dataset.values
X = array[:,0:8]
#the line above is interpreted as “all rows for columns 0 through 8”
Y = array[:,9]
#the line above is interpreted as “all rows for column 9”
validation_size = 0.20
# 20% as a validation dataset
seed = 7
#what does this parameter means?
X_train, X_validation, Y_train, Y_validation = model_selection.train_test_split(X, Y, test_size=validation_size, random_state=seed)
Now when I try to built and evaluate the 6 models with this code:
# Spot Check Algorithms
models = []
models.append((‘LR’, LogisticRegression()))
models.append((‘LDA’, LinearDiscriminantAnalysis()))
models.append((‘KNN’, KNeighborsClassifier()))
models.append((‘CART’, DecisionTreeClassifier()))
models.append((‘NB’, GaussianNB()))
models.append((‘SVM’, SVC()))
# evaluate each model in turn
results = []
names = []
for name, model in models:
kfold = model_selection.KFold(n_splits=10, random_state=seed)
cv_results = model_selection.cross_val_score(model, X_train, Y_train, cv=kfold, scoring=scoring)
results.append(cv_results)
names.append(name)
msg = “%s: %f (%f)” % (name, cv_results.mean(), cv_results.std())
print(msg)
It appears this message:
>>> # Spot Check Algorithms
… models = []
>>> models.append((‘LR’, LogisticRegression()))
>>> models.append((‘LDA’, LinearDiscriminantAnalysis()))
>>> models.append((‘KNN’, KNeighborsClassifier()))
>>> models.append((‘CART’, DecisionTreeClassifier()))
>>> models.append((‘NB’, GaussianNB()))
>>> models.append((‘SVM’, SVC()))
>>> # evaluate each model in turn
… results = []
>>> names = []
>>> for name, model in models:
… kfold = model_selection.KFold(n_splits=10, random_state=seed)
File “”, line 2
kfold = model_selection.KFold(n_splits=10, random_state=seed)
^
IndentationError: expected an indented block
>>> cv_results = model_selection.cross_val_score(model, X_train, Y_train, cv=kfold, scoring=scoring)
Traceback (most recent call last):
File “”, line 1, in
NameError: name ‘model’ is not defined
>>> results.append(cv_results)
>>> names.append(name)
Traceback (most recent call last):
File “”, line 1, in
NameError: name ‘name’ is not defined
>>> msg = “%s: %f (%f)” % (name, cv_results.mean(), cv_results.std())
Traceback (most recent call last):
File “”, line 1, in
NameError: name ‘name’ is not defined
>>> print(msg)
Traceback (most recent call last):
File “”, line 1, in
NameError: name ‘msg’ is not defined
>>>
Your Instruction were great. I am new to coding and I would like to know if you have codes for fantasy sports. Will the process above work with fantasy sports.
how long will it take to run the program? i follow all instruction, and there is no errors, but still running and only get the first graph, and the dataset description? is it take to long to complete run ? note i use windows 7
i have solved the problem, where i should should close the figures and the results will be displayed, I have tried to change the dataset for example to Heart Dataset, where there are 14 attributes and only two classes, for sure there were an errors. Sir, if I use the heart dataset in which part of the project should I do the modifications? thanks in advance I’m just started to learn Python in Machine learning. your help is really appreciated
Thanks a bunch for the awesome example. Like others I received 0.991667 for SVM.
The problem, however, I am having relates to the last step – getting prediction values. Below you can find my stack trace.
/usr/local/lib/python2.7/site-packages/sklearn/utils/validation.pyc in check_consistent_length(*arrays)
202 if len(uniques) > 1:
203 raise ValueError(“Found input variables with inconsistent numbers of”
–> 204 ” samples: %r” % [int(l) for l in lengths])
205
206
ValueError: Found input variables with inconsistent numbers of samples: [4, 30]
—–
till step 5.2 its fine for me but from point 5.3 am getting error as below:-
# Spot Check Algorithms
… models = []
>>> models.append((‘LR’, LogisticRegression()))
Traceback (most recent call last):
File “”, line 1, in
NameError: name ‘LogisticRegression’ is not defined
>>> models.append((‘LDA’, LinearDiscriminantAnalysis()))
Traceback (most recent call last):
File “”, line 1, in
NameError: name ‘LinearDiscriminantAnalysis’ is not defined
>>> models.append((‘KNN’, KNeighborsClassifier()))
Traceback (most recent call last):
File “”, line 1, in
NameError: name ‘KNeighborsClassifier’ is not defined
>>> models.append((‘CART’, DecisionTreeClassifier()))
Traceback (most recent call last):
File “”, line 1, in
NameError: name ‘DecisionTreeClassifier’ is not defined
>>> models.append((‘NB’, GaussianNB()))
Traceback (most recent call last):
File “”, line 1, in
NameError: name ‘GaussianNB’ is not defined
>>> models.append((‘SVM’, SVC()))
Traceback (most recent call last):
File “”, line 1, in
NameError: name ‘SVC’ is not defined
>>> # evaluate each model in turn
… results = []
>>> names = []
>>> for name, model in models:
… kfold = model_selection.KFold(n_splits=10, random_state=seed)
File “”, line 2
kfold = model_selection.KFold(n_splits=10, random_state=seed)
^
IndentationError: expected an indented block
>>> cv_results = model_selection.cross_val_score(model, X_train, Y_train, cv=kfold, scoring=scoring)
Traceback (most recent call last):
File “”, line 1, in
NameError: name ‘model_selection’ is not defined
>>> results.append(cv_results)
Traceback (most recent call last):
File “”, line 1, in
NameError: name ‘cv_results’ is not defined
>>> names.append(name)
Traceback (most recent call last):
File “”, line 1, in
NameError: name ‘name’ is not defined
>>> msg = “%s: %f (%f)” % (name, cv_results.mean(), cv_results.std())
Traceback (most recent call last):
File “”, line 1, in
NameError: name ‘name’ is not defined
>>> print(msg)
ok i’ll try it on ipython may be directly copy paste into command line might have done this and one more thing do i have to define alogo names in square brackets and define the seed values in results square brackets
Where can we see the visual representation of variate and univariate plots? I’m only seeing textual representation of the data. Please notify where to type dataset.plot(.. code
Hi Jason, I really found your guide useful and easy to follow. I am developing my Master Thesis and I am trying to apply ML to predict electricity prices (therefore numerical class). Which algorithm would you recommend me more (more than one if it is possible)?
As far as I know, classification algorithms are used in those cases where the class is binary like in this example. Why do we compare regression model with other classification models in this example then? Does that make sense? Can regression models be applied for classification purposes and vice versa?
If you are predicting a quantity, you will want to use regression algorithms. I would recommend testing a suite of methods to see which works best on your specific dataset.
The random number generator used in the splitting of data and within some of the algorithms is actually a pseudorandom number generator. We can seed it so that it will generate the same sequence of random numbers each time the code is run. This helps in tutorials so that you can get the same results that I got.
Thank you for the explanation. please find the below questions
1. I changed file name to iris22==> it gave error OK
2. I removed all data in iris.data ==> it gave the same output.
3. If any changes in the iris.data file does not change the output
Hey Jason,
I trained my data on a linear regression model, now I want to predict the value of label based on the values of indicators that the user inputs. Can this be done?
I’m really not getting it anywhere.
Please help me out
I just want to say that this was fantastic. Knew the basics of Python and had it installed already, and everything worked without a hitch.
In my case I just wanted to get a sense of what’s involved on a step by step level in machine learning but I’m definitely not a data scientist and only somewhat a developer, so while some of the concepts that came up are not familiar (not yet anyway) the whole thing gave me a good feel for what it would be like. Well done.
cv_results=model_selection.cross_val_score(model,X_train, Y_train, cv=kfold, scoring=scoring)
Traceback (most recent call last):
File “”, line 1, in
NameError: name ‘model’ is not defined
Hi Jason can u provide a link which guides the syntax of all model for validation that u have to use in this..
As you have only use KNN for validation but i want to all the other models for learning. as i am a total beginner and little bit bit confused what parameters to use in SVM or Linear Regression etc..
I loved the tutorial. great work!!
first I tried it on ubuntu 14.04 LTS, but because of version problems, I had to upgrade to ubuntu 16.04 LTS. I could run the tutorial successfully. Thanks 🙂
Hello! Great learning thank you for taking the time to do this. Few questions if you don’t mind answering them i’m very very new to all this including python forgive me.
In 5.1 what is Seed? why is it 7?
Also for the K-fold say you have 5 sets of data [1,2,3,4,5] each with 10 data set size do you do [1(for testing),2,3,4,5] and 2-5 as training until every bin has cycled through as testing set? Like after that it would be [1,2(for testing),3,4,5] and 1,3,4,5 as training until it’s complete?
Also why do you have validation_size = 0.20 if your using K-fold? Isn’t K-fold cross validation already solving it?
Also now that we have the model how can I extract it? So I can use it so i can plug in my own values for the attributes and have the model give me a classification?
Seed is the initialization of the pseudorandom number generator. It generates random numbers used by the algorithm and evaluation of the algorithm. The seed can be anything. Learn more about randomness in ml here: https://machinelearningmastery.com/randomness-in-machine-learning/
Correct re k-fold cross-validation (CV). We use CV to estimate the skill of the model on new data. We use the validation set to confirm that indeed the estimate is sensible (not biased), that we did not mess up in some major way.
Hello Sir…
I’m truly saying from the bottom of my heart your tutorial really helps me a lot especially beginners like me. if you could also provide some more projects like above step-by-step procedures on like Titanic Data Set,Loan Prediction Data Set,Bigmart Sales Data Set and Boston Housing Data Set that would be really really a great helps to beginners like me.
Thank you very much for your interesting explanation
But I have an important question as to how we transform this project into an application in which we can enter data for this plant and the application predicts any type of plant
I would be very thankful for this (how to convert the project into an application that can be used)
The application is also rich with Python with Anconda
It makes many errors and the final error given by running is
File “C:\Users\Chathura Herath\PycharmProjects\MoreModels\venv\lib\site-packages\sklearn\utils\validation.py”, line 433, in check_array
array = np.array(array, dtype=dtype, order=order, copy=copy)
ValueError: could not convert string to float: ‘PentalWidth’
for what its worth to others i installed py using anaconda.
there is an development environment in this called Spyder (python 3.6) which is quite helpful.
hello
models.append((‘LR’,LogisticRegression()))
models.append((‘LDA’,LinearDiscriminantAnalysis()))
models.append((‘KNN’,KNeighborsClassifier()))
models.append((‘CART’,DecisionTreeClassifier()))
models.append((‘NB’,GaussianNB()))
models.append((‘SVM’,SVC()))
are there more for cosine similarity, euclidean distance, mahalanobis distance?
Thanks for the work youve done im sure its been a great help for a lot of people.
So i wanted so make sure of something. in step number 5 and 6 which is evaluating an algorithm and making predictions. So step 5 basically dividing 80% of the data to become training data and the 20% to validate the trained model.
What i wanted to ask is when we use the 10-fold cross validation to estimate accuracy of the model, we split up the dataset to 10 part, 9 of which we use to train and 1 part of the dataset to test the model. Now is the dataset were dividing from the training part of the original dataset or in other words 80% of the original dataset?
Another thing is it says that the 10-fold cross validation to spilt tha dataset into 10 parts then train and validate for all combinations of train and test spilts. It means that for 1 combination of train and test data, lets say the first of the ten part of data becomes the test data while the rest becomes the train data, then on another combination of train test data, the second part of the ten part of data becomes the test data etc for all combinations?
Jason, thank you for your post. I am from Rio de Janeiro, Brazil and I am currently finishing my Computer Engineering course on College. We have learned the very basics of machine learning. It would be very useful if you go ahead and show us how to feed these algorithms with real images and show us the result.
I am using Sublime Text as the IDE and Python 2.7 with all the necessary environment. Your tutorial worked fine for me, without any error when building.
hey jason,thanks for post,i completed intro course of machine learning on udacity but didnt able to hand on code that much.without application and practising codes there is no way to learn.please suggest me the project based webiste for practise and anything new i should do as per your concern…
I started working on this project. I have encounterd an issue with 5.1
array = dataset.values
it is saying ndarray object of numpy module. I am using latest Anaconda. I have check the installs as you mentioned. All modules are installed and are of higher version.
I know the ML algorithms theory wise but new to practical sessions. I have not done any thing practically. But by following your tutorial I could install all the libraries.
As I started to implement “your first machine learning step by step”, I did not understand where to type the code.
There is no >>> prompt in anaconda prompt.
Please help me its all new. Should I type every thing in one text editor and then run as
python filename.py
Great intro!! Really appreciated. The one part that didn’t work for me was all the plt.show(). I have triple checked my versions. Any idea what I am doing wrong?
i have tried your above approach on Iris data set with seed = 7, i got the same result as expected in this approach. when i tried the below approach with seed (or) random_state=42 , getting the 100 % accuracy, i didn’t understand why changing the seed (or) random_state=42 increased the performance or there is any mistake in my code ?
Please find the belowcode
# Split-out validation dataset
array = dataset.values
X = array[:,0:4]
Y = array[:,4]
validation_size = 0.20
seed = 42
X_train, X_validation, Y_train, Y_validation = model_selection.train_test_split(X, Y, test_size=validation_size, random_state=seed)
# Test options and evaluation metric
seed = 42
scoring = ‘accuracy’
# Spot Check Algorithms
models = []
models.append((‘LR’, LogisticRegression()))
models.append((‘LDA’, LinearDiscriminantAnalysis()))
models.append((‘KNN’, KNeighborsClassifier()))
models.append((‘CART’, DecisionTreeClassifier()))
models.append((‘NB’, GaussianNB()))
models.append((‘SVM’, SVC()))
# evaluate each model in turn
results = []
names = []
for name, model in models:
kfold = model_selection.KFold(n_splits=10, random_state=seed)
cv_results = model_selection.cross_val_score(model, X_train, Y_train, cv=kfold, scoring=scoring)
results.append(cv_results)
names.append(name)
msg = “%s: %f (%f)” % (name, cv_results.mean(), cv_results.std())
print(msg)
Hello sir ,
In this tutorial you have showed a basic project which load pre-defined dataset.Can you please tell me how can I create my own dataset and load it here ? And also I have trained data and now how can I input new image so that machine can identify that and print it’s name ?
I only came recently across this blog post. Very well written, congratulations. I have a question about the ‘brute force’s approach you used to define the best predictive ML approach. You tried all of them. But due to the very small dataset would you rely on such a small difference? That is within the variance of the model, so I could pick almost any of those. Do you have posted about a dataset ? eventually larger) where trends might be eventually different?
Indeed, with overlapping skill scores, we might have to use statistical hypothesis tests to see if indeed there is a meaningful difference between the skill of the different methods. The student’s t-test would be a good starting point.
Very nice blog to start with. Thanks for the same. I am following most of your emails in my ML journey. Started a week ago.
A small issue in this blog.
from sklearn.neighbors import KNeighborsClassifiers
Traceback (most recent call last):
File “”, line 1, in
from sklearn.neighbors import KNeighborsClassifiers
ImportError: cannot import name ‘KNeighborsClassifiers’
Please suggest .. Rest all I am able to understand
Awesome stuff! one thing, when you apply the model (KNN) on the validation data, does it create a new mapping function or it uses the one it created during the test phase?
Thank you Dr.Jason for writing wonderful simple Machine learning project for the beginners. I am getting exactly same results for the accuracy as given in your tutorial. I am finding bit difficulty in interpreting statistical results.
Hi,
I have been working on binary text classification, so, I used the above code but before predicting the output I converted it into numerical data using
df = handle_non_numerical_data(dataset)
now, Prediction on training,validation data all worked fine, but How to give a new set to predict the class, when I am trying to use the above function it classifies the new dataset differently as in there is no relation between training dataset and this dataset. How to solve this problem ?
I am a newbie, trying to learn Machine learning with little or no help around me. Then I found your blog and its awesome to learn it from here!!!
i want to know 1 thing here why we have separated data and class names in two tables X_train and Y_train? Can’t we keep the data and classes in one single table say X_train only so that the very first row say
5.9,3,5.1,1.8,Iris-virginica
Assalam-o alaikum!
Very nice tutorial.. Can you give me any idea about simplest implementation of any of Machine Learning algorithms for processing big data? I want the implementation to in Python like you have did above in your tutorial.
Regards
I have a few questions:
1) How do I print out the confusion matrix of TP, FP, TN, FN, rather than just the precision, recall, etc?
2) How do I just train on one set of data and test on a separate set of data?
– This would require the ability to save my model. How do I do that programmatically for later run throughs, without the need to re-train?
3) Is there a best way to selectively scale discrete values to 0-1 range, without affecting the boolean values?
4) Is the n_spits always a good way to go? How do I know the best value for that, without doing several run-throughs?
I am stuck at confusion matrix. looking at the output below, how I know which row represents what class?
[[ 7 0 0]
[ 0 11 1]
[ 0 2 9]]
I was trying to follow below statements, but could not tell which row/ column represent Iris-setosa (/Iris-versicolor/Iris-virginica) looking at above output matrix. Can you help?
Expected down the side: Each row of the matrix corresponds to a predicted class.
Predicted across the top: Each column of the matrix corresponds to an actual class.
Hello Doctor,First of all, thank you very much for this tutorial.
I have implemented this code on my own dataset that I have created. It is one class to differentiate between two types of attacks. The dataset contain 267 features and more than 120,000 records. For the experimental, I created randomly a small database of 2000 records and the same feature numbers, The output is as follows:
LR: 0.927639 (0.020943)
LDA: 0.964074 (0.008784)
KNN: 0.763901 (0.045070)
CART: 0.979401 (0.007253)
NB: 0.680964 (0.021898)
SVM: 0.560485 (0.022857)
==============================================
—————SVM————–
0.5464135021097046
[[256 0]
[215 3]]
precision recall f1-score support
==============================================
.Note that this is the first test of samples of dataset.
Does this look right? does makes sense
If the problem is not linear why the result is less in SVM? while in the CART (0.99)
Any suggestion would be appreciated
Thank you introduction
Thanks, I like that you’ve mentioned in the end of the tutorial, that we don’t have to know or understand everything in the tutorial.
I like that your lesson are so concise. long tutorial make me lost
my question is where should I go from here so I can understand and apply the machine learning to my goals
Man!, where are you before few months!
you replay fast, and you are always following up with your students
I lost so much time trying to read over the internet to get started
I wish that I found your tutorials before few months ago
Hi jason!
i have more interested ML . I’m in a beginner stage now .
I have one doubt
ML is, that
“we giving past input and output data , based on that we are expecting machines to give same output as in the past data for out future input”????
Like the following
data set:
input output
AA 1
BB 2
CC 3
in future if i give AA it should return 1.
but tradition programming also doing the same right?
only one thing is different that is unsupervised learning in that machine it self should build a program.
Hi
there is no prediction algorithm here ?
how to make the prediction step
how many variable of test data will be used to prediction ?
where is x – and y axis colum
you just build the model gives good accuracy but how to make use of prediction
I am using url =”https://raw.githubusercontent.com/uiuc-cse/data-fa14/gh-pages/data/iris.csv”
since UCI is not working.
All the code is getting executed but plt.hist() is showing error
~\Anaconda3\lib\site-packages\pandas\plotting\_tools.py in _subplots(naxes, sharex, sharey, squeeze, subplot_kw, ax, layout, layout_type, **fig_kw)
235
236 # Create first subplot separately, so we can share it if requested
–> 237 ax0 = fig.add_subplot(nrows, ncols, 1, **subplot_kw)
238
239 if sharex:
~\Anaconda3\lib\site-packages\matplotlib\figure.py in add_subplot(self, *args, **kwargs)
1072 self._axstack.remove(ax)
1073
-> 1074 a = subplot_class_factory(projection_class)(self, *args, **kwargs)
1075
1076 self._axstack.add(key, a)
~\Anaconda3\lib\site-packages\matplotlib\axes\_subplots.py in __init__(self, fig, *args, **kwargs)
62 raise ValueError(
63 “num must be 1 <= num 64 maxn=rows*cols, num=num))
65 self._subplotspec = GridSpec(rows, cols)[int(num) – 1]
66 # num – 1 for converting from MATLAB to python indexing
I really like that you solved the same problem using 6 different models, it gives a great basis for my future modeling of real-world problems because it shows me that I can easily compare results in my particular case to pick the best model. I understand that some of them may give dramatically better results depending on the problem and training/validation data. Thanks for sharing this! I’m looking forward to reading more of your posts.
thanks for your tutorial. Really helpful. I am a complete beginner. I am seeing two errors checking for the right models. First is an indentationError (couldn’t fix it by deleting spaces). Second is NameError: name ‘model’ is not defined
Please assist. Thanks!
>>> # Spot Check Algorithms
… models = []
>>> models.append((‘LR’, LogisticRegression()))
>>> models.append((‘LDA’, LinearDiscriminantAnalysis()))
>>> models.append((‘KNN’, KNeighborsClassifier()))
>>> models.append((‘CART’, DecisionTreeClassifier()))
>>> models.append((‘NB’, GaussianNB()))
>>> models.append((‘SVM’, SVC()))
>>> # evaluate each model in turn
… results = []
>>> names = []
>>> for name, model in models:
… kfold = model_selection.KFold(n_splits=10, random_state=seed)
File “”, line 2
kfold = model_selection.KFold(n_splits=10, random_state=seed)
^
IndentationError: expected an indented block
>>> cv_results = model_selection.cross_val_score(model, X_train, Y_train, cv=kfold, scoring=scoring)
Traceback (most recent call last):
File “”, line 1, in
NameError: name ‘model’ is not defined
>>> results.append(cv_results)
Traceback (most recent call last):
File “”, line 1, in
NameError: name ‘cv_results’ is not defined
>>> names.append(name)
Traceback (most recent call last):
File “”, line 1, in
NameError: name ‘name’ is not defined
>>> msg = “%s: %f (%f)” % (name, cv_results.mean(), cv_results.std())
Traceback (most recent call last):
File “”, line 1, in
NameError: name ‘name’ is not defined
>>> print(msg)
Very helpful introduction. Thanks for that!
I’m wondering how I could get the equation for example of the logistic regression.
Could you please guide me in the right direction?
i have a question about algorithm comparison figure, what does that dotted line represents?
also i used the same code but i not getting that dotted line in my figure why this is so?
Big thanks for your great posts!! You are contributing greatly in expanding the ML community and knowledge!!
2 questions please for you or anyone in the community.
I ‘ve been using WEKA and now I am also entering in the world of Python scikit.
WEKA gives you the option to include the p-value in the results, but it seems there is nothing around (or I completely missed it) in Python scikit..
Question 1:
– How can we also include the Statistical Significance (with p-value=0.05, for paired t-test ) in the above command line that gave this results list:
LR: 0.966667 (0.040825)
LDA: 0.975000 (0.038188)
KNN: 0.983333 (0.033333)
CART: 0.975000 (0.038188)
NB: 0.975000 (0.053359)
SVM: 0.981667 (0.025000)
It is helpful to know the p-value of the result in order to confidently claim the difference between the accuracy performance of the compared algorithms/models we are comparing.
In other words, what do we have to do to also display in the list of the above results the p-value?
Question 2:
– What if we wanted to calculate the AUC ROC instead of the accuracy?
Should we switch the following
seed = 7
scoring = ‘accuracy’
into just
seed = 7
scoring = ‘auc’ . ?
Many thanks in advance and apologies to you and the rest of the community for my ignorance.
Hi. I’m trying to use this with a csv with two cols (date, price) but get the error: “could not convert string to float: ‘2014-12-31′”.
Could anyone tell me what I’m doing wrong please?
Here “model_selection.cross_val_score” calculates the score based on the training data. But score/ accuracy are calculated for the model with respect to validation data. This gives the performance of the model. But herein you have used this method prior to using the validation data. Could you please explain the logic behind. I am new to Machine learning and have gone through the algorithms also. So have come up with this question. Please help!
Please confirm me if my understanding is correct or not which I am sharing underneath–
Estimates of performance for our machine learning algorithm using approach- “K-fold Cross Validation” is done by the following way :
First the original training data set is split into training data and test/validation data.
Then this derived training set is again split into n- number of folds using KFold(). Now with n-1 number of folds(sets of data), algorithm under consideration is trained. Then with the n-th fold(set) of data, algorithm is tested and the accuracy/ score is calculated between {the result obtained with this test data set} and the result obtained for each of {n-1 folds of training data set}. So we obtain n-1 counts of accuracy values for these n-1 folds of data. Finally the mean of this is calculated which gives the net accuracy of the algorithm used.
Please confirm me if my understanding is correct or not.
You may have answered this question before, so please excuse the possible repetitiveness:
As you were exploring the relationships between the features, you noticed some correlations/patterns. Did that allow you to narrow down your choices of algorithms? If so, how?
My overall question: when do you know you can really leverage on the correlative relationships and/or gaussian representations when choosing a model? Is it true that sometimes it’s too expensive (and hence not preferred in the workplace) to run and test six different algorithms when the data can get really big?
Yes, if the data looks gaussian I think about standardizing instead of normalizing. If I see lots of correlation, I think about feature selection methods, etc.
A good starting point is to test many methods and let these intuitions arrive as experience over time. Often these intuitions breakdown in the face of rigorous+systematic testing.
Hello my friend.Nice tutorial.I am a little rookie in machine learning and i am struggling to complete the tutorial with this dataset: http://archive.ics.uci.edu/ml/datasets/Wine.
Can you please help me?It is important for me to understand how it works.
Thank you very much for your time and the tutorial.
A Very good course for beginners to get a feel of how thing really work in ML and how algo can be applied on data. I think this is the best way to start ML journey for anyone. LAter on you can build deep understanding and expertise in python as well as ML Algos. Great work! Jason!.
I’m getting this error when I execute the line
cv_results = model_selection.cross_val_score(model, X_train, Y_train, cv = kfold, scoring = scoring_met)
ValueError: Found input variables with inconsistent numbers of samples: [120, 30]
Hi Jason, great article you have there, it’s simple and clear. Congrats.
I’m trying to use this concept to classify a data based on description (texts), but as I understood these functions that you use just accept numbers. DO you have any suggestions in how can I scalonate my texts?
I am a newbie to ML and not a programmer. This tutorial explained to me all the steps in detail and was easy to understand. It gave me a new level of confidence which I didn’t get after going through so many courses and theory. Thank you so much !
Good afternoon teacher, after you have finished this project with the iris database, I know that as you said above, not all the steps of a machine learning project were performed, so I would like to know after having done all these tests and validated the model, how would I put it into production and test it on real data?
I work through the project. I had to type most of the codes to help me understand the what each functions and object meant and it was very intellectual. Thanks. Appreciate!
i just found this and i am truly impressed. i was about to write something like this, but instead i will just link to yours! problem solved. well done on breaking it down like that. ran it through and it worked like a charm.
Thank you for this tutorial, it’s very useful and helped me a lot. I was only wondering if I can graphically display the models that come from the algorithms? So for example when making a decision tree, that I actually show it on the screen.
I really appreciate this tutorial. It makes machine learning is something fun to do. I’ve tried your code, examined 1-by-1 every syntax you used, and then, the result I got just like the others which is the best model is SVC. After that, I was curious about the other models’ result. So, I repeated the last step for the other models and I compared each other. LDA gave a better accuracy score than SVC. How could this happen? Does this case depend on the value of validation size or something else? I made no change from step 1 until step 5.
I’m wondering, is it possible to make confusion matrix based on just one attribute out of eg. 65 attributes? If it is possible, how? I’ve search, and used the parameter ‘target’, and resulted in 3×3 confusion matrix instead of 4×4 (the attribute has 4 categories). I wonder how it ended like that, and whether I had code it wrongly. Can you help give me some tips or explain how does this happen.
Hello Jason How are you, your tutorial is so much effective to learn machine learning from scrach for all beginner like me. i have run your code successfully,but i faced problem during working on various dat set csv file, like : “https://www.kaggle.com/new-york-city/nyc-baby-names “.which contains various New York City baby names, including (mother’s) ethnicity information.when i run your code with this data set i got this error “ValueError: could not convert string to float: ‘HAZEL’ ” it is similar to all other data set, i keep the csv file column number to your irish data set column number.keep array same but every time i get same error,Please give me a solution,thanks in advance
Hello Jason, I got all the results right. But I also got three warnings while building the models:
C:\Python27\lib\site-packages\sklearn\linear_model\logistic.py:432: FutureWarning: Default solver will be changed to ‘lbfgs’ in 0.22. Specify a solver to silence this warning. FutureWarning)
C:\Python27\lib\site-packages\sklearn\linear_model\logistic.py:459: FutureWarning: Default multi_class will be changed to ‘auto’ in 0.22. Specify the multi_class option to silence this warning. “this warning.”, FutureWarning)
C:\Python27\lib\site-packages\sklearn\svm\base.py:196: FutureWarning: The default value of gamma will change from ‘auto’ to ‘scale’ in version 0.22 to account better for unscaled features. Set gamma explicitly to ‘auto’ or ‘scale’ to avoid this warning. “avoid this warning.”, FutureWarning)
I did not change anything in the code. Can you please tell me what is the error?
Thanks for your efforts, undoubtedly it was a good start.
But it’d be really nice if you can please add little more details about the interpretation of the graphs (what and how they’re providing such information) and the statistics (precision, recall, f1-score, support)
And last but not the least, would you please let us know which other tutorials should we follow afterwards? Please provide the links with priorities, one must follow in terms of diving a bit more into it but not yet intelligent enough in prioritising the guidelines /learning process. 🙂
Thanks.
Absolutely fantastic page… I’m just starting out with ML (with only fairly basic Python skills.. but a lot of programming background) but this is a great way to get going
My only suggestion would be to add a bit more text at the top to explain what we are trying to achieve with the flower data (sorry if I’ve missed it).
I think it’s ‘given the data.. predict what type of Iris each row (or subsequent rows) is’.. but.. I’m not 100% sure
hey!
Can we use it for any other image classification ? like emotions,etc and how can we extract different features in this training like hog, sift or surf features etc..
This tutorial was very useful for a beginner like me. I have 2 queries:
1. How to save the trained model to some other file and use it for prediction, so that I need not run this entire code every time I want to do prediction for an input data?
2. How to visualize the training function on any plot of the data set after training? i.e., the curves separating the regions for the 3 classes we are having, on the data set plot.
I am very new to ML. I thought the field of ML is frustrating. But now, thanks for your result-oriented-step-by-step approach, I kind of like it. Many thanks dear! Keep the good work.
hi. thanks for the great tutorial!
one thing i don’t understand though- in section 5.3 your write:
“We get an idea from the plots that some of the classes are partially linearly separable in some dimensions, so we are expecting generally good results.”
could you please elaborate a little bit about that? it seems to me like all groupings of data points on all parameters combinations are very heterogeneous in regards to classes, aren’t they?
I am applying on my dataset that raises accuracy of about 92% in matlab apps, but here I am trying on both nn and on the examples above, my accuracy is not increasing then that of 40%…
It’s really helpful. Can you suggest me how to plot the classified samples to show visual classification to a lay man. That see how was the original data and how it is after classifying?
Thank you so much for these perfect tutorials. I however have a question regarding the application of the machine learning analysis, and as I am a beginner in this domain I feel like I have some lack of terminology here which makes the search for the answer relatively hard. So I apology in advance if you already answered the question on one of the page of the website and if I just missed it.
I have a dataset made of objects belonging to either class A or class B, and obviously I want the algorithms to determine for each object its class. And this work perfectly so far (90-95% of accuracy with SVM, NB and KNN algorithms). However, I ‘overfed’ on purpose the training set by inputing N parameters to build the prediction models, while usually only a third of this N parameters are known to be relevant for the classification (when classifying these objects by hand, I mean).
I believe – but perhaps I am wrong here – that the ML models will weight each of the input parameters in term of relevance, and I would like now to access to these weights and I want to see if the classification is only made using the parameters known to be relevant or if another parameters left usually aside is also of importance for the classification.
So is there a way to extract the weight of each parameters as set by the prediction model?
An algorithm may or may not make the “weight” of each input available to you.
Instead, you can use methods designed to report the relevance or importance of each input variable. Some of these methods are called feature selection methods and others are called feature importance methods. You can get started here: https://machinelearningmastery.com/an-introduction-to-feature-selection/
Here is another algorithm called Self-Organizing Maps apply on IRIS dataset, and works very well. The source code and demo have been posted on Github: https://github.com/njali2001/popsom , please feel free to enjoy it.
Ronakkumar Ashokbhai ModiNovember 19, 2018 at 5:03 pm#
Hii,
when i am going to install scipy library with python 3.4 i got error message “python3.4 does not found registry”.
But i already install python 3.4.So,give me proper solution regarding it.
Thanks a lot, Jason. you’ll easy-to-understand tutorial gave me a very very quick intro to ML using Python. And it also pointed me to the advanced use of ML algorithms. Speeded up my work considerably. Thanks a lot!!!
Great !! This was the first model I trained myself… I’ve recorded a video following the steps you described. Great idea of yours to create a walkthrough
Thanks for this tutorial, please see the results that i had that were similar to yours, but in my case, the boxplot for the Algorithm Comparison did not have the blue dotted lines that you had for KNN, NB and SVM. The code is the same as yours and hence i am puzzled as to why is the boxplot a bit different?
Hi Jason Brownlee. I am following your tutorials from the last 2 months time to time and I am learning things quite in a nice manner. I have a question why is the result different for selecting the best model when I am printing the results in a separate for loop:
for count in range(len(names)):
msg = “{0}: {1} ({2})”.format(names[count], cv_results[count].mean(), cv_results[count].std())
print(msg)
It has been specified that either theano or tensorflow will be required. pertaining to the fact that tensorflow is cumbersome to install in windows, I successfully installed theano. But installation and verification of keras requires tensorflow as it contains commands with tensorflow module. Trying to install tensorflow gave problems as told. How do I proceed with the setting up of the environment?
Hey Jason – nice tutorial. I wanted to collect your thoughts (apologies if this was addressed earlier in the thread, but the thread is quite long). I’ve run this exercise in both Python and R, as I wanted to compare the algorithms in both languages, and I’ve noticed that the predictive power in R seems to be consistently higher on the test sets (see confusion matrix), even though overall accuracy is lower, with Linear Discriminant Analysis (LDA) consistently the most performant. In Python, the test sets seem to not be predicted as well (see confusion matrix) even though accuracy is generally higher and Support Vector Machines (SVM) consistently more performant in Python. What explains this difference? It surprised me because I considered I might model something in R and then convert the code over to Python, but this somewhat alters those kinds of plans if the model would need to change in the process.
I am getting a output showing the error message while checking for best model. Can you help me clarify my doubt?
Traceback (most recent call last):
File “E:\Project\Implementation\sample.py”, line 48, in
cv_results = model_selection.cross_val_score(model, X_train, Y_train, cv=kfold, scoring=scoring)
File “C:\Users\user\AppData\Local\Programs\Python\Python36-32\lib\site-packages\sklearn\model_selection\_validation.py”, line 342, in cross_val_score
pre_dispatch=pre_dispatch)
File “C:\Users\user\AppData\Local\Programs\Python\Python36-32\lib\site-packages\sklearn\model_selection\_validation.py”, line 206, in cross_validate
for train, test in cv.split(X, y, groups))
File “C:\Users\user\AppData\Local\Programs\Python\Python36-32\lib\site-packages\sklearn\externals\joblib\parallel.py”, line 779, in __call__
while self.dispatch_one_batch(iterator):
File “C:\Users\user\AppData\Local\Programs\Python\Python36-32\lib\site-packages\sklearn\externals\joblib\parallel.py”, line 625, in dispatch_one_batch
self._dispatch(tasks)
File “C:\Users\user\AppData\Local\Programs\Python\Python36-32\lib\site-packages\sklearn\externals\joblib\parallel.py”, line 588, in _dispatch
job = self._backend.apply_async(batch, callback=cb)
File “C:\Users\user\AppData\Local\Programs\Python\Python36-32\lib\site-packages\sklearn\externals\joblib\_parallel_backends.py”, line 111, in apply_async
result = ImmediateResult(func)
File “C:\Users\user\AppData\Local\Programs\Python\Python36-32\lib\site-packages\sklearn\externals\joblib\_parallel_backends.py”, line 332, in __init__
self.results = batch()
File “C:\Users\user\AppData\Local\Programs\Python\Python36-32\lib\site-packages\sklearn\externals\joblib\parallel.py”, line 131, in __call__
return [func(*args, **kwargs) for func, args, kwargs in self.items]
File “C:\Users\user\AppData\Local\Programs\Python\Python36-32\lib\site-packages\sklearn\externals\joblib\parallel.py”, line 131, in
return [func(*args, **kwargs) for func, args, kwargs in self.items]
File “C:\Users\user\AppData\Local\Programs\Python\Python36-32\lib\site-packages\sklearn\model_selection\_validation.py”, line 458, in _fit_and_score
estimator.fit(X_train, y_train, **fit_params)
File “C:\Users\user\AppData\Local\Programs\Python\Python36-32\lib\site-packages\sklearn\linear_model\logistic.py”, line 1217, in fit
check_classification_targets(y)
File “C:\Users\user\AppData\Local\Programs\Python\Python36-32\lib\site-packages\sklearn\utils\multiclass.py”, line 172, in check_classification_targets
raise ValueError(“Unknown label type: %r” % y_type)
ValueError: Unknown label type: ‘unknown’
>>>
After much failure, I was able to get this to work!
however I had to set the LR model as follows to prevent error due to getting a ‘future warning error’
LogisticRegression(solver=’lbfgs’, multi_class=’auto’, max_iter=1000)
as well as:
SVC(gamma=’auto’)
my results were as follows:
LR: 0.983333 (0.033333)
LDA: 0.975000 (0.038188)
KNN: 0.983333 (0.033333)
CART: 0.983333 (0.033333)
NB: 0.975000 (0.053359)
SVM: 0.991667 (0.025000)
———————————————
0.9333333333333333
[[ 7 0 0]
[ 0 10 2]
[ 0 0 11]]
precision recall f1-score support
I am a complete beginner with ML but this at least gave me a place to start. Do you think the changes I made to the parameters or the models could have changed the data to make it less accurate?
import pandas errors out – raise ImportError(‘dateutil 2.5.0 is the minimum required version’)
Forums talks about lowering version – are they referring to downgrade from version 2.7 of python?
then import sklearn fails – ImportError: No module named sklearn
I was able to install sklearn from this command sudo pip install -U scikit-learn scipy matplotlib
my pip version is 9.0.1. Is that the problem?
Thank you for the instruction. I am learning how to use the method to do my project. I have a dataset with X and Y, X are all 5-min resolution data , Y has both 5-min and 30-min data. Now I need to forecast 30-min data and the probability, which way should I go?
1) aggregate all 5-min X data to 30-min X data by averaging 5-min data in every 30 minute, then use 30-min X data and 30-min Y data to do training and testing, in this way, the probability can be easily forecast. My concern is I have some time sensitive X data. If I use 30-min X data to do forecast, it won’t reflect the variability of X data as accurate as in 5-min resolution. this would lead to inaccurate forecast in Y data.
2) use all 5-min X data and 5-min Y data to do training and testing, and forecast 5-min Y data with the trained model, then average the 5-min Y data into 30-min Y data. But in this way, how can I get the probability for the 30-min Y data, the trained model can only forecast probability for 5-min Y data directly. Is there any way to convert the probability from 5-min resolution to 30-min?
Hello
Thanks for your good training.
I have a question from you.
I want to predict the probability value for every 0
That is, how much is it possible to convert from 0 to 1
what do I do
help me.
thanks a lot
Just worked through the tutorial, and I learnt a bunch of things along the way, as well as saw the whole pipeline of classification projects as implemented in industry. But it was all for classification. Do you’ve similar tutorials like this for regression, time series etc.?
hello Jason i bought your book (deep learning with python ) it’s very important. so my question is what’s the best function activation used for multiclassification (Example IRIS) .
Thank you for the tutorial. Amazing work done to get kick started on machine learning. I followed the tutorial and got same cross validation score as yours. But for testing purpose i calculated the prediction score for each of the models and got the result as follows :
LR : 0.8
LDA : 0.9666666666666667
KNN : 0.9
CART : 0.9
NB : 0.8333333333333334
SVM : 0.9333333333333333
Based on the cross validation score if we select KNN but the prediction score of LDA is highest here. Why is that? Can you help me in drawing some conclusion here.
Thanks 🙂
/home/user/.local/lib/python3.5/site-packages/sklearn/utils/validation.py:761: DataConversionWarning: A column-vector y was passed when a 1d array was expected. Please change the shape of y to (n_samples, ), for example using ravel().
y = column_or_1d(y, warn=True)
/home/user/.local/lib/python3.5/site-packages/sklearn/utils/validation.py:761: DataConversionWarning: A column-vector y was passed when a 1d array was expected. Please change the shape of y to (n_samples, ), for example using ravel().
y = column_or_1d(y, warn=True)
/home/user/.local/lib/python3.5/site-packages/sklearn/utils/validation.py:761: DataConversionWarning: A column-vector y was passed when a 1d array was expected. Please change the shape of y to (n_samples, ), for example using ravel().
y = column_or_1d(y, warn=True)
/home/user/.local/lib/python3.5/site-packages/sklearn/utils/validation.py:761: DataConversionWarning: A column-vector y was passed when a 1d array was expected. Please change the shape of y to (n_samples, ), for example using ravel().
y = column_or_1d(y, warn=True)
main.py:122: DataConversionWarning: A column-vector y was passed when a 1d array was expected. Please change the shape of y to (n_samples, ), for example using ravel().
knn.fit(X_train, Y_train)
KNN: 0.957953 (0.006179)
CART: 0.987552 (0.003800)
NB: 0.916668 (0.006903)
SVM: 0.658934 (0.055898)
LR: 1.000000 (0.000000)
LDA: 0.977768 (0.005342)
KNN: 0.957953 (0.006179)
CART: 0.988441 (0.004228)
NB: 0.916668 (0.006903)
SVM: 0.658934 (0.055898)
0.9649390243902439
[[973 35]
[ 34 926]]
precision recall f1-score support
Dear Jason,
Thanks for the useful and interesting materials.
I have a question please: you said in 5.4 Select Best Model “In this case, we can see that it looks like Logistic Regression (LR) has the largest estimated accuracy score.”
In fact LR has the lowest mean. do you mean low mean = high accuracy? but we could have high mean with high accuracy. Could you please make it clear? thank you.
Though you’ve mentioned my results may vary… from top till bottom, I got the exact same result as your screenshots… bang… Thanks for the article… though a longer path to go still, one step at a time. Thanks.
I got the same results, but I don’t understand why you mention “K-Nearest Neighbors (KNN) has the largest estimated accuracy score.” According to the list, SVM presents a higher score
Can you please help me to understand. First you make standard test_train_spit and next you make cross validation. Shouldn’t we do either this or that? You use cross validation only to select best model but you do predictions on initially created train,test datasets (80%,20%).
We can overfit during cross validation model selection. It is helpful to have a final dataset to help confirm the chosen model/models are skillful on unseen data.
This is just a suggestion, you can model the problem any way you wish.
Just to make sure. I was given a task: Use leave-one-out cross-validation to determine the correct model and report the results in terms of average performance across cross-validation samples.
First I split dataset to Train/Test samples.
Then I use leave one out cross val (on train sample) to determine best model.
After that I predict values using cross_val_score on test sample only or on whole dataset?
Instead, I would recommend split into train/test, use k-fold cv on train for model selection, then fit a final model on all train and evaluate on test to get an unbiased idea of how good the model might be. Then fit a new final model on all data and start using it to make predictions on real unseen data.
Dear Jason,
Thanks for the useful and interesting materials.But, how to handle the Outliers.
Is there any best practices to do so? Should it be handle before we split the data?
Hello sir, I hope this meets you well. Thank you very much for this tutorial.
Right now, I’m trying to use this lesson to assist me in my own predictions.
I am using a lung cancer dataset that has attributes of 2 or 1 which gives a yes or no output for the chances of lung cancer.
I’ve been getting some errors from the statistical summary downwards, please how do I go about this.
Secondly, if I am able to successfully make predictions at the end after taking the necessary steps you suggest, how do I implement this prediction in my web application.
I read your post on how to save and load a model with sci-kit learn to make predictions but I don’t quite get it…. After saving this model using pickle, how do I enter new inputs to get a prediction from this model??
Hi! this is really awesome first project! and the blog as a whole is amazing and very useful!
Thanks a lot!
in the sklearn docs I found an option for ordinary KFold() function StratifiedKFold().
This is basically the same with only difference it returns stratified folds. The folds are made with preserving the percentage of samples for each class. I think this is especially useful with very unbalanced classes ditribution
hello the project is really helpful
i wanted to know how to load the data from the stored csv file in my system??
and how to use something else rather than panda??
using yours dataset and implementing things the way you implemented that is working correctly but further when i m implementing for my own dataset the error comes
hi sir,
I am facing error in the step of “cv_results = model_selection.cross_val_score(model, X_train, Y_train, cv=kfold, scoring=scoring)”
will you please resolve.I am unable to understand this.
error named is :
C:\Users\HPPC\Anaconda3\lib\site-packages\sklearn\model_selection\_validation.py:542: FutureWarning: From version 0.22, errors during fit will result in a cross validation score of NaN by default. Use error_score=’raise’ if you want an exception raised or error_score=np.nan to adopt the behavior from version 0.22.
FutureWarning)
—————————————————————————
ValueError Traceback (most recent call last)
in
12 for name, model in models:
13 kfold = model_selection.KFold(n_splits=10, random_state=seed)
—> 14 cv_results = model_selection.cross_val_score(model, X_train, Y_train, cv=kfold, scoring=scoring)
15 results.append(cv_results)
16 names.append(name)
~\Anaconda3\lib\site-packages\sklearn\externals\joblib\parallel.py in _dispatch(self, batch)
714 with self._lock:
715 job_idx = len(self._jobs)
–> 716 job = self._backend.apply_async(batch, callback=cb)
717 # A job can complete so quickly than its callback is
718 # called before we get here, causing self._jobs to
~\Anaconda3\lib\site-packages\sklearn\externals\joblib\_parallel_backends.py in apply_async(self, func, callback)
180 def apply_async(self, func, callback=None):
181 “””Schedule a func to be run”””
–> 182 result = ImmediateResult(func)
183 if callback:
184 callback(result)
~\Anaconda3\lib\site-packages\sklearn\externals\joblib\_parallel_backends.py in __init__(self, batch)
547 # Don’t delay the application, to avoid keeping the input
548 # arguments in memory
–> 549 self.results = batch()
550
551 def get(self):
~\Anaconda3\lib\site-packages\sklearn\externals\joblib\parallel.py in __call__(self)
223 with parallel_backend(self._backend, n_jobs=self._n_jobs):
224 return [func(*args, **kwargs)
–> 225 for func, args, kwargs in self.items]
226
227 def __len__(self):
~\Anaconda3\lib\site-packages\sklearn\externals\joblib\parallel.py in (.0)
223 with parallel_backend(self._backend, n_jobs=self._n_jobs):
224 return [func(*args, **kwargs)
–> 225 for func, args, kwargs in self.items]
226
227 def __len__(self):
very nicely done, Jason! I used Jupyter notebook and had no issues replicating your findings using similar package versions. All the errors I encountered were my own typos.
a few questions:
1. SVM seems to have performed better; is there a reason you chose to show validation for KNN instead? (my validation of SVM shows 93% accuracy.)
2. Is the reason you call knn.fit() on the training data again because model parameters don’t persist beyond appending results to the list?
Thanks so much Jason! This (along with your “How to Setup a Python Environment) were incredibly straightforward and easy to follow. The only minor confusion was that you need to run all the code within one file, but I was able to figure that out from the comments (might be worth noting up top though). I’ve never done a coding tutorial that worked so cleanly 🙂
I am very excited to have just completed my first ML project.
I’m trying to apply ML to a project using what I learned here, currently in the phase of reshaping my model training data and could use some help with a problem.
Currently, all the values of my attributes are either a negative integer or “Not available” and I want the model to be trained to take into account when an attribute value is “Not available” because for a same Class I have rows with a value on that attribute and rows with “Not available” in that attribute. You have any tips on how to go about that?
Build an application / web-page / mobile app which will perform the following tasks:
The program will take the following input: Weather (for example sunny, rainy etc), Season (e.g., summer, winter), Geographic Scene (e.g., hilly terrain, open field, crowded market etc) and other inputs which can be thought of by the students themselves. Given the input the program will generate a virtual reality scene. The generated virtual scene can be used for training ML algorithms to detect objects in varying environmental conditions.
thanks for your tutorial.
I don’t understand why the predictions are not made with the model previously constructed models[2] but with a new fit. Would it be possible to use the previous one?
Hi Jason,
i went to the tutorial.It is very helpful beginner. But i have a query regarding target variable how we will select class if it is not given in the data set.
from pandas.tools.plotting import scatter_matrix
import matplotlib.pyplot as plt
from sklearn import model_selection
from sklearn.metrics import classification_report
from sklearn.metrics import confusion_matrix
from sklearn.metrics import accuracy_score
from sklearn.linear_model import LogisticRegression
from sklearn.tree import DecisionTreeClassifier
from sklearn.neighbors import KNeighborsClassifier
from sklearn.discriminant_analysis import LinearDiscriminantAnalysis
from sklearn.naive_bayes import GaussianNB
from sklearn.svm import SVC
I can run everything up to the:
dataset.plot(kind=’box’, subplots=True, layout=(2,2), sharex=False, sharey=False)
plt.show()
Then the error i get is:
This application failed to start because it could not find or load the Qt platform plugin “cocoa”
in “”.
Reinstalling the application may fix this problem.
/Users/qiqi/PycharmProjects/ml/venv/bin/python /Users/qiqi/PycharmProjects/ml/ml53.py
Traceback (most recent call last):
File “/Users/qiqi/PycharmProjects/ml/ml53.py”, line 5, in
dataset = pandas.read_csv(url, names=names)
NameError: name ‘pandas’ is not defined
Process finished with exit code 1
Excuse me, I met the following error. And pandas are not in the last step. Thank you very much!
Yes, I am following the instruction.
As a matter of fact, in the last step it showed that scipy: 1.2.1 numpy: 1.16.3
matplotlib: 3.0.3 pandas: 0.24.2 sklearn: 0.20.3.
I am curious about what is the problem. I saw someone met this question either but the answer does work for me. And I installed it on mac and am using Pycharm CE version. I will check it. Even if I used import pandas, it didn’t work. Thank you very much!
I am using Pycharm IDE and in this particualr line :
cv_results= model_selection.cross_val_score(model, x_train, y_train, cv=kfold, scoring=scoring)
C:\Users\Lenovo\PycharmProjects\Sample_Project\venv\lib\site-packages\sklearn\model_selection\_validation.py:542: FutureWarning: From version 0.22, errors during fit will result in a cross validation score of NaN by default. Use error_score=’raise’ if you want an exception raised or error_score=np.nan to adopt the behavior from version 0.22.
FutureWarning)
Traceback (most recent call last):
File “C:/Users/Lenovo/PycharmProjects/Sample_Project/readingdatasets/Irisdataset.py”, line 63, in
cv_results= model_selection.cross_val_score(model, x_train, y_train, cv=kfold, scoring=scoring)
File “C:\Users\Lenovo\PycharmProjects\Sample_Project\venv\lib\site-packages\sklearn\model_selection\_validation.py”, line 402, in cross_val_score
error_score=error_score)
File “C:\Users\Lenovo\PycharmProjects\Sample_Project\venv\lib\site-packages\sklearn\model_selection\_validation.py”, line 240, in cross_validate
for train, test in cv.split(X, y, groups))
File “C:\Users\Lenovo\PycharmProjects\Sample_Project\venv\lib\site-packages\sklearn\externals\joblib\parallel.py”, line 917, in __call__
if self.dispatch_one_batch(iterator):
File “C:\Users\Lenovo\PycharmProjects\Sample_Project\venv\lib\site-packages\sklearn\externals\joblib\parallel.py”, line 759, in dispatch_one_batch
self._dispatch(tasks)
File “C:\Users\Lenovo\PycharmProjects\Sample_Project\venv\lib\site-packages\sklearn\externals\joblib\parallel.py”, line 716, in _dispatch
job = self._backend.apply_async(batch, callback=cb)
File “C:\Users\Lenovo\PycharmProjects\Sample_Project\venv\lib\site-packages\sklearn\externals\joblib\_parallel_backends.py”, line 182, in apply_async
result = ImmediateResult(func)
File “C:\Users\Lenovo\PycharmProjects\Sample_Project\venv\lib\site-packages\sklearn\externals\joblib\_parallel_backends.py”, line 549, in __init__
self.results = batch()
File “C:\Users\Lenovo\PycharmProjects\Sample_Project\venv\lib\site-packages\sklearn\externals\joblib\parallel.py”, line 225, in __call__
for func, args, kwargs in self.items]
File “C:\Users\Lenovo\PycharmProjects\Sample_Project\venv\lib\site-packages\sklearn\externals\joblib\parallel.py”, line 225, in
for func, args, kwargs in self.items]
File “C:\Users\Lenovo\PycharmProjects\Sample_Project\venv\lib\site-packages\sklearn\model_selection\_validation.py”, line 528, in _fit_and_score
estimator.fit(X_train, y_train, **fit_params)
File “C:\Users\Lenovo\PycharmProjects\Sample_Project\venv\lib\site-packages\sklearn\linear_model\logistic.py”, line 1289, in fit
check_classification_targets(y)
File “C:\Users\Lenovo\PycharmProjects\Sample_Project\venv\lib\site-packages\sklearn\utils\multiclass.py”, line 171, in check_classification_targets
raise ValueError(“Unknown label type: %r” % y_type)
ValueError: Unknown label type: ‘unknown’
Hello Dr.Jason,
i use anaconda terminal on a windows 8.1 64 bit, python 3.7.3 64 bit
when import scipy i get this error :
(base) C:\Users\roberto>python
Python 3.7.3 (default, Mar 27 2019, 17:13:21) [MSC v.1915 64 bit (AMD64)] :: Anaconda, Inc. on win32
Type “help”, “copyright”, “credits” or “license” for more information.
>>> import scipy
Traceback (most recent call last):
File “”, line 1, in
File “C:\Users\roberto\Anaconda3\lib\site-packages\scipy\__init__.py”, line 62, in
from numpy import show_config as show_numpy_config
File “C:\Users\roberto\AppData\Roaming\Python\Python37\site-packages\numpy\__init__.py”, line 142, in
from . import core
File “C:\Users\roberto\AppData\Roaming\Python\Python37\site-packages\numpy\core\__init__.py”, line 23, in
WinDLL(os.path.abspath(filename))
File “C:\Users\roberto\Anaconda3\lib\ctypes\__init__.py”, line 356, in __init__
self._handle = _dlopen(self._name, mode)
OSError: [WinError 193] %1 non è un’applicazione di Win32 valida
>>>
—————————————————————————————————————–
but if i use python 3.7.3 32bit it’s all ok and i get all results as on your tutorial,
what’s happens? and what i have do to use anaconda terminal 64bit ?
Thank you very much!
(base) C:\Users\roberto>anaconda32
3.7.3 (v3.7.3:ef4ec6ed12, Mar 25 2019, 21:26:53) [MSC v.1916 32 bit (Intel)]
After executing the code of validation dataset we are not getting the graph of Box and Whisker Plot Comparing Machine Learning Algorithms on the Iris Flowers Dataset….We are getting nameError: name ‘model_selection’ is not defined…please give solution…
hello!
thank you for the tutorial. it was great to follow it along.
yes, i got the results in the end, indeed, but how to i input data to get a prediction for the trained model?
Hi Jason. Great tutorial. I have a small question.
Under section “6. Make Predictions” you say “KNN algorithm is very simple and was an accurate model based on our tests”. How did you come to this conclusion ?
Previously, we established that SVM is most accurate as its value is 0.99. So why and how KNN is accurate here?
Does the seed value to the parameter ‘random_state’ need to be same for the ‘train_test_split()’ function and the ‘KFold()’ function.
You have used 7 here for both. Is that just a coincidence?
Am I correct in understanding that the ‘seed’ value to ‘random_state’ puts a lock over the random shuffling and uses the same data splits which it used for the first time?
Also, what is the life of this state (random_state)?
Does it persist in memory or is this restricted to runs in that particular ‘session’ ?
Also, are we evaluating the algorithms with both mean and standard deviation?
I understand that it is standard practice to include both as it gives you a correct idea of the variation in the data values. But in this case, does variation really matter?
If we add a 3rd column, “Coefficient of Variation”, should we deduce that the model with the least varied scores is the best performer or should we stick to the mean accuracy?
For improving my results using feature selection, I am referring to the correlation matrix and selecting mainly those features which have a relatively strong positive correlation with the target variable ‘quality’. Should the variables which show strong negative correlation be excluded or included in this case? Can you explain more on how to use the correlation matrix to arrive at decisions related to feature selection? Thanks for this helpful post BTW!
Hi Jason,
Thanks for providing the reference to the correlation article you shared. But I am not very clear on some basic questions –
Q.1. – How do I use negative correlation?
If you can provide your comments on how negative correlation can be useful in this particular example (wine dataset), it will help me draw analogies and work out other problems using similar understanding.
Q.2. – Is the call on which features to include/exclude initially made by looking at the correlation matrix values? What is the process you personally follow when you have features negatively correlated with your target variable?
Do we only look at the magnitude of correlation when making these decisions?
This tutorial was really helpful to get started. But when i think of it, How should we select the apt classifier/estimator for a project?
In real world use cases, I assume that, there might be large amount of data . So training a classifier will take large amount of time. So, is it possible to train multiple estimators and pick-out the best one as we did here, considering time and space complexity?
Or how is it done in real use cases with millions of data?
I tried it for the first time, it worked but for the second time when i run this :
# Spot Check Algorithms
models = []
models.append((‘LR’, LogisticRegression()))
models.append((‘LDA’, LinearDiscriminantAnalysis()))
models.append((‘KNN’, KNeighborsClassifier()))
models.append((‘CART’, DecisionTreeClassifier()))
models.append((‘NB’, GaussianNB()))
models.append((‘SVM’, SVC()))
# evaluate each model in turn
results = []
names = []
for name, model in models:
kfold = cross_validation.KFold(n=num_instances, n_folds=num_folds, random_state=seed)
cv_results = cross_validation.cross_val_score(model, X_train, Y_train, cv=kfold, scoring=scoring)
results.append(cv_results)
names.append(name)
msg = “%s: %f (%f)” % (name, cv_results.mean(), cv_results.std())
print(msg)
I have this error
NameError Traceback (most recent call last)
in
11 names = []
12 for name, model in models:
—> 13 kfold = cross_validation.KFold(n=num_instances, n_folds=num_folds, random_state=seed)
14 cv_results = cross_validation.cross_val_score(model, X_train, Y_train, cv=kfold, scoring=scoring)
15 results.append(cv_results)
import pandas
from pandas.plotting import scatter_matrix
import matplotlib.pyplot as plt
from sklearn import model_selection
from sklearn.model_selection import train_test_split
from sklearn.model_selection import cross_val_score
from sklearn.metrics import classification_report
from sklearn.metrics import confusion_matrix
from sklearn.metrics import accuracy_score
from sklearn.linear_model import LogisticRegression
from sklearn.tree import DecisionTreeClassifier
from sklearn.neighbors import KNeighborsClassifier
from sklearn.discriminant_analysis import LinearDiscriminantAnalysis
from sklearn.naive_bayes import GaussianNB
from sklearn.svm import SVC
hi sir!
it’s great to see such kind of post from you. I have applied this iris data in MATLAB and I get the same kind of result. sir i have some other dataset and the code is running properly but i a not able to plot its result. Your help will be highly appreciated
waiting for your kind response
>>> # Spot Check Algorithms
… models = []
>>> models.append((‘LR’, LogisticRegression(solver=’liblinear’, multi_class=’ovr’)))
>>> models.append((‘LDA’, LinearDiscriminantAnalysis()))
>>> models.append((‘KNN’, KNeighborsClassifier()))
>>> models.append((‘CART’, DecisionTreeClassifier()))
>>> models.append((‘NB’, GaussianNB()))
>>> models.append((‘SVM’, SVC(gamma=’auto’)))
>>> # evaluate each model in turn
… results = []
>>> names = []
>>> for name, model in models:
… kfold = model_selection.KFold(n_splits=10, random_state=seed)
File “”, line 2
kfold = model_selection.KFold(n_splits=10, random_state=seed)
^
IndentationError: expected an indented block
>>> cv_results = model_selection.cross_val_score(model, X_train, Y_train, cv=kfold, scoring=scoring)
Traceback (most recent call last):
File “”, line 1, in
NameError: name ‘model’ is not defined
>>> results.append(cv_results)
Traceback (most recent call last):
File “”, line 1, in
NameError: name ‘cv_results’ is not defined
>>> names.append(name)
Traceback (most recent call last):
File “”, line 1, in
NameError: name ‘name’ is not defined
>>> msg = “%s: %f (%f)” % (name, cv_results.mean(), cv_results.std())
Traceback (most recent call last):
File “”, line 1, in
NameError: name ‘name’ is not defined
>>> print(msg)
Traceback (most recent call last):
File “”, line 1, in
NameError: name ‘msg’ is not defined
hi i investigate the problem and it seems that data i am using has varying length therefore it throws this exception. how can i fix it to get rid of this reshape error: ValueError: cannot reshape array of size 868190 into shape (12)?
# Load libraries
import pandas
from pandas.plotting import scatter_matrix
import matplotlib.pyplot as plt
from sklearn import model_selection
from sklearn.metrics import classification_report
from sklearn.metrics import confusion_matrix
from sklearn.metrics import accuracy_score
from sklearn.linear_model import LogisticRegression
from sklearn.tree import DecisionTreeClassifier
from sklearn.neighbors import KNeighborsClassifier
from sklearn.discriminant_analysis import LinearDiscriminantAnalysis
from sklearn.naive_bayes import GaussianNB
from sklearn.svm import SVC
Hello Jason,
I guess that fit_transform does fit and transform, the Scaler sc is set after fitting like other regression model, X_test and X_train actually are processed in the same way.
First and foremost thanks for this wonderful, awesome post.
Just worked seamlessly in the very first attempt, being struggling with other tutorials
which really never works in the first try.
Hello Jason. I am new to Machine learning and currently working on how to use evolutionary algorithm to learn optimum weights for feed forward neural network. Please how do I go about this. What is the strategy for coding it and obtaining result
I wanted to know one question regarding the training of the model. If my data is having the same trend can my model also predict the data on different offset? or I have to train my model for all the offset?
First, thanks very much for this tutorial. it is easy to follow and well explained. Could please shed some light on how to interpret the Algorithm comparison chart? KNN accuracy_score, confusion_matrix, and classification_report? Finally, based on the knn results how one might draw conclusions?
This was my first ML tutorial in python. Thank you for writing such a simple and easy to follow tutorial. I followed every step and my results were as follows:
If one wanted to use a different model, where can we find tutorials on the code or are the models already built into the sklearn? Which book would you recommend for beginners in ML without any Statistics background knowledge?
Hi Jason,
I have learned machine learning by your clear tutorials like this one.
tell you the truth I am trying to visualize a dataset’s distribution, but I do not know how to plot the samples belongs to 2 different class sing two different colors as you did plot all the samples with one color, blue.
U have tested some other links, but they do not work.
Dear Jason,
I have read it, but all the illustrated figures in the given link are provided with one color, blue. I applied this command and it works for me.
Hello, can you please advise on an example with 2 input files :
1. training input file
2. test file
so have code of M learning that knows to predict result (like if transaction is a fraud) in missing result column at test file based on what it learned in the training file
Hello,
I’m following your tutorial but using different dataset that includes dates, entry id, temp, humid, moisture etc so when give this dataset to the model it gives me error that couldn’t convert string to float and secondly, the graphs I’m trying to plot is not plotting idk why. Kindly help me.
Thanks Jason, I am trying find algorithm where the test phase code takes the data also from (another) csv and not slicing from train data (so simulating “real scenario” testing several packs of data). Can you please refer me to such?
python code for a tv cable providr has 170 customers over 8km radis.the service provider wishes to restrict his service over 2 km radius w& retain maximum customers as possible .the remaining cutomers will be transefed to other service provide.i want idea about this problem plz can anybody hlp me plz.
Its actually helpful thank you very much!… I want to know how can the recall , precision and f1 score of each model can be represented in a bar diagram instead of box plots for comparison?
Dr. Jason, you have a unique website! Because…
– Your Python code examples work – that’s my highest compliment to anyone because this scenario seems to have become a great rarity these days!
– Your information is vey useful, and is absolutely the best way to get started with ML.
– You take the time to respond to all the emails.
– You know what it takes to teach this subject, and share it clearly.
You are so correct about this being the best way to teach ML. After wasting my money on a stack of ML books, I found your website. So, now, instead of trying to read and understand those books, they’ve just become a reference library that I seldom turn to – because I come to this website first! (And based on all learned from this site, I did just buy one more book – YOURS!
Hello, please I’m a student. I have a project that I’m about to start on building a classification system for malware with machine learning using python but i don’t know where to start. Please i need your counsel on this.
Hey Jason, first of all want to congratulate you man for all this effort and willing to help. Look, I`m don’t have a programming background and I am almost finishing Shaw’s “Learning Python the Hard Way”. My objective in the mid term is to dive into image/pattern recognition through OpenCV (not exactly face but human body behavior captured from pictures). Do you think your guide could help me, or could you give me in a few words about what should be my “path” to master it? The point is, from a complete beginner, machine learning, deep learning, AI is very messy. Just want to hear from you. Thanks and greetings from Brazil!
ImportError: cannot import name ‘RandomizedLogisticRegression’ from ‘sklearn.linear_model’ (C:\Users\Kefyalew\Anaconda2\envs\FakenewsEnv\lib\site-packages\sklearn\linear_model\__init__.py)
Hi,
I managed to go through the whole example but I found it easier to use Spyder! I got exactly the same output and numbers as in your findings.
Next step; going deeper and learning the syntax and the algos then moving into deep learning example…
Hello, thank you so much sir for this beginner lesson its really been helpfull, however i found this an error ”from pandas.plotting import scatter_matrix” since pandas have been imported already ‘from pandas import scatter_matrix’ should do .
Thank you.
A little suggestion (if I did not miss it :P), please if you could also include the link to the next tutorial from you that you think we should follow to move on.
Thanks for your Tutorial Machine Learning!
Actually, I’m a beginner in both Python and Machine learning,; however, I could run this tutorial very well!
Thanks!
I follow next tutorial …
Thank you for the tutorial. I am just wondering i have Anaconda 1.9.7, using Jupyter and somehow matplotlib is not recognized
To fix this i did:
import sys
!conda install –yes –prefix {sys.prefix} matplotlib
import matplotlib.pyplot as plt
print(‘matplotlib: {}’.format(matplotlib.__version__))
Not getting an error when doing this.
But when I want to visualize, I still get an error that Matplotlib is required.
This is awesome! Rightly ranked high on google search 🙂 I’m working through this tutorial to predict accuracy and repeatability of a linear machine movement that requires sub 10 micron accuracy. I guess the classification would be the type of mechanicals used.
Hi, thanks for the great tutorial. For my it seems to cut off too early though, because I don’t know how put this model into use for the next dataset, which is kinda the whole point. Anyways, really appreciate the effort for making me set up the environment now.
hay dear
i want ask u some question and any other who have interest for my question
qu 1: how i can use data mining, machine learning and deep learning concepts in one thesis
In step 5.4 you are describing SVM model has the largest estimated accuracy score, but KNN is the one which you made as your final model, is there any specific reason for that or it has been selected just for the sake of this example and simplicity?
i was following the tutorial step by step. In the following line, what is model supposed to mean? we have not defined “model” anywhere before this line.
“It looks like perhaps two of the input variables have a Gaussian distribution. This is useful to note as we can use algorithms that can exploit this assumption.”
Quoting the above text from your article, how can I exclude an algorithm for classifying data with a non-Gaussian distribution.
Thank u. I always learn something from your posts :).
My question is related to “presenting results” as you mentioned. or interpreting results.
Why boxplot for SVM is “weird”? and different from the rest?
How to interpret the values of confusion-matrix and classification_report in this specific context?
Questions please:
Is there a multivariate method of superimposing of y_pred and y_validation for the X variables?
In Section 4.1 we have multivariate scatter plots. Is there a way of multivariate scatter plots with different coloured points within each scatterplot to indicate by colour the specific iris species . For example plot sepal length v petal length, and show say yellow=versicolor, red=setosa, blue=virginica. Do the same for sepal length v sepal width with same colour scheme.
I refer to this as “a scatter plot with points colored by class” and I have tons of examples on the blog, at least for simple 2-variable datastes. Try a blog search.
For multiple pairwise scatter plots, you can use something like this, assuming your data is loaded as a dataframe df.
1
2
3
4
5
6
7
8
...
# define a mapping of class values to colors
color_dict={0:'red',1:'green',2:'blue'}
# map each row to a color based on the class value
colors=[color_dict[x]forxindf.values[:,-1]]
# pair-wise scatter plots of all numerical variables
Nice way of starting with python.. However when i was trying to build models as you mentioned above, encountered the below error
for name, model in models:
… kfold = StratifiedKFold(n_splits=10, random_state=1)
File “”, line 2
kfold = StratifiedKFold(n_splits=10, random_state=1)
^
IndentationError: expected an indented block
>>> cv_results = cross_val_score(model, X_train, Y_train, cv=kfold, scoring=’accuracy’)
Traceback (most recent call last):
File “”, line 1, in
NameError: name ‘model’ is not defined
>>> results.append(cv_results)
Traceback (most recent call last):
File “”, line 1, in
NameError: name ‘cv_results’ is not defined
>>> names.append(name)
Traceback (most recent call last):
File “”, line 1, in
NameError: name ‘name’ is not defined
>>> print(‘%s: %f (%f)’ % (name, cv_results.mean(), cv_results.std()))
Traceback (most recent call last):
File “”, line 1, in
NameError: name ‘name’ is not defined
>>> # Compare Algorithms
… pyplot.boxplot(results, labels=names)
Traceback (most recent call last):
File “”, line 2, in
File “C:\Users\p.khaneja\AppData\Local\Continuum\anaconda3\lib\site-packages\matplotlib\pyplot.py”, line 2479, in boxplot
is not None else {}))
File “C:\Users\p.khaneja\AppData\Local\Continuum\anaconda3\lib\site-packages\matplotlib\cbook\deprecation.py”, line 307, in wrapper
return func(*args, **kwargs)
File “C:\Users\p.khaneja\AppData\Local\Continuum\anaconda3\lib\site-packages\matplotlib\__init__.py”, line 1601, in inner
return func(ax, *map(sanitize_sequence, args), **kwargs)
File “C:\Users\p.khaneja\AppData\Local\Continuum\anaconda3\lib\site-packages\matplotlib\axes\_axes.py”, line 3670, in boxplot
labels=labels, autorange=autorange)
File “C:\Users\p.khaneja\AppData\Local\Continuum\anaconda3\lib\site-packages\matplotlib\cbook\__init__.py”, line 1251, in boxplot_stats
raise ValueError(“Dimensions of labels and X must be compatible”)
ValueError: Dimensions of labels and X must be compatible
>>> pyplot.title(‘Algorithm Comparison’)
Text(0.5, 1.0, ‘Algorithm Comparison’)
>>> pyplot.show()
Hi Jason, I went through the example without any problem but I am trying to understand the precision, recall, f1-score, support. Similarly accuracy, macro avg, weighted avg.
Would it be possible for you to explain them a bit or point me to documentation.
~\Anaconda3\lib\site-packages\sklearn\utils\validation.py in check_consistent_length(*arrays)
233 if len(uniques) > 1:
234 raise ValueError(“Found input variables with inconsistent numbers of”
–> 235 ” samples: %r” % [int(l) for l in lengths])
236
237
ValueError: Found input variables with inconsistent numbers of samples: [30, 1]
Traceback (most recent call last):
File “C:/Users/Computer/AppData/Local/Programs/Python/Python38-32/Scripts/plot.py”, line 4, in
dataset = read_csv(url, names=names)
builtins.NameError: name ‘read_csv’ is not defined
Jason – Hello from rainy San Francisco, California. Thanks for putting this together. Great feeling to be able to scratch the surface a little bit.
I am working with the 0.22 release of sklearn and got this message:
kfold = StratifiedKFold(n_splits=10, random_state=1)
C:\Users\kochh\AppData\Roaming\Python\Python37\site-packages\sklearn\model_selection\_split.py:296: FutureWarning: Setting a random_state has no effect since shuffle is False. This will raise an error in 0.24. You should leave random_state to its default (None), or set shuffle=True.
So I ran a non-randomized version via
kfold = StratifiedKFold(n_splits=10)
which yielded
and a randomized one via
kfold = StratifiedKFold(n_splits=10,random_state=1,shuffle=True)
which got me
LR: 0.941667 (0.065085)
LDA: 0.975000 (0.038188)
KNN: 0.958333 (0.041667)
CART: 0.941667 (0.053359)
NB: 0.950000 (0.055277)
SVM: 0.983333 (0.033333)
so LR wins by a nice margin.
A small note… if you go through it sequentially, in section 5.2, you are calling cross_val_score() with ‘model’ as the first argument, but that hasn’t been defined in any of the sections above. I assume most people will realize this quickly and move on.
Again, thanks for getting me started. I will definitely take you up on the email course-offer, but would be happy to spend some money if you have material for purchase.
while I try to execute this
…
model = …
# Test options and evaluation metric
kfold = StratifiedKFold(n_splits=10, random_state=1, shuffle=True)
cv_results = cross_val_score(model, X_train, Y_train, cv=kfold, scoring=’accuracy’)
I get the following error.
TypeError: estimator should be an estimator implementing ‘fit’ method, Ellipsis was passed
does it have anything to do with my sklearn?because the version I am using is a bit older.
yeah thanks.
here are my results
LR: 0.960897 (0.052113)
LDA: 0.973974 (0.040110)
KNN: 0.957191 (0.043263)
CART: 0.956282 (0.062981)
NB: 0.948858 (0.056322)
SVM: 0.983974 (0.032083)
but I have 2 questions:
1.the test harness part that was throwing me errors is not included on the complete example right?why is that and what exactly does that section do?
2.there is a training step in machine learning before making predictions right?I got confused.or are we using already trained models?and how about fitting the model on the training step,what does that mean?
I followed all scripts step by step use Anaconda Jupiter platform and got the same results except the ” 5.2 Test Harness ” step:
//////////////////////////////////////////////////////////////////////////
…
model = …
# Test options and evaluation metric
kfold = StratifiedKFold(n_splits=10, random_state=1, shuffle=True)
cv_results = cross_val_score(model, X_train, Y_train, cv=kfold, scoring=’accuracy’)
/////////////////////////////////////////////////////
I got the following error:
————————————————————————— TypeError Traceback (most recent call last) in 48 # Test options and evaluation metric 49 kfold = StratifiedKFold(n_splits=10, random_state=1, shuffle=True) —> 50 cv_results = cross_val_score(model, X_train, Y_train, cv=kfold, scoring=’accuracy’) 51 52 # Spot Check Algorithms ~\Anaconda3\lib\site-packages\sklearn\model_selection\_validation.py in cross_val_score(estimator, X, y, groups, scoring, cv, n_jobs, verbose, fit_params, pre_dispatch, error_score) 382 “”” 383 # To ensure multimetric format is not supported –> 384 scorer = check_scoring(estimator, scoring=scoring) 385 386 cv_results = cross_validate(estimator=estimator, X=X, y=y, groups=groups, ~\Anaconda3\lib\site-packages\sklearn\metrics\scorer.py in check_scoring(estimator, scoring, allow_none) 268 if not hasattr(estimator, ‘fit’): 269 raise TypeError(“estimator should be an estimator implementing ” –> 270 “‘fit’ method, %r was passed” % estimator) 271 if isinstance(scoring, str): 272 return get_scorer(scoring) TypeError: estimator should be an estimator implementing ‘fit’ method, Ellipsis was passed
Hi, Jason.
It seems that I managed the previous issue, however, there is another one. Please, advise:
“/Users/YuriDanilov/PycharmProjects/Week 6/venv/bin/python” “/Users/YuriDanilov/PycharmProjects/Week 6/ML НовыйПроект.py”
Traceback (most recent call last):
File “/Library/Frameworks/Python.framework/Versions/3.6/lib/python3.6/urllib/request.py”, line 1318, in do_open
encode_chunked=req.has_header(‘Transfer-encoding’))
File “/Library/Frameworks/Python.framework/Versions/3.6/lib/python3.6/http/client.py”, line 1239, in request
self._send_request(method, url, body, headers, encode_chunked)
File “/Library/Frameworks/Python.framework/Versions/3.6/lib/python3.6/http/client.py”, line 1285, in _send_request
self.endheaders(body, encode_chunked=encode_chunked)
File “/Library/Frameworks/Python.framework/Versions/3.6/lib/python3.6/http/client.py”, line 1234, in endheaders
self._send_output(message_body, encode_chunked=encode_chunked)
File “/Library/Frameworks/Python.framework/Versions/3.6/lib/python3.6/http/client.py”, line 1026, in _send_output
self.send(msg)
File “/Library/Frameworks/Python.framework/Versions/3.6/lib/python3.6/http/client.py”, line 964, in send
self.connect()
File “/Library/Frameworks/Python.framework/Versions/3.6/lib/python3.6/http/client.py”, line 1400, in connect
server_hostname=server_hostname)
File “/Library/Frameworks/Python.framework/Versions/3.6/lib/python3.6/ssl.py”, line 407, in wrap_socket
_context=self, _session=session)
File “/Library/Frameworks/Python.framework/Versions/3.6/lib/python3.6/ssl.py”, line 814, in __init__
self.do_handshake()
File “/Library/Frameworks/Python.framework/Versions/3.6/lib/python3.6/ssl.py”, line 1068, in do_handshake
self._sslobj.do_handshake()
File “/Library/Frameworks/Python.framework/Versions/3.6/lib/python3.6/ssl.py”, line 689, in do_handshake
self._sslobj.do_handshake()
ssl.SSLError: [SSL: CERTIFICATE_VERIFY_FAILED] certificate verify failed (_ssl.c:777)
During handling of the above exception, another exception occurred:
Traceback (most recent call last):
File “/Users/YuriDanilov/PycharmProjects/Week 6/ML НовыйПроект.py”, line 33, in
dataset = read_csv(url, names=names)
File “/Users/YuriDanilov/PycharmProjects/Week 6/venv/lib/python3.6/site-packages/pandas/io/parsers.py”, line 685, in parser_f
return _read(filepath_or_buffer, kwds)
File “/Users/YuriDanilov/PycharmProjects/Week 6/venv/lib/python3.6/site-packages/pandas/io/parsers.py”, line 440, in _read
filepath_or_buffer, encoding, compression
File “/Users/YuriDanilov/PycharmProjects/Week 6/venv/lib/python3.6/site-packages/pandas/io/common.py”, line 196, in get_filepath_or_buffer
req = urlopen(filepath_or_buffer)
File “/Library/Frameworks/Python.framework/Versions/3.6/lib/python3.6/urllib/request.py”, line 223, in urlopen
return opener.open(url, data, timeout)
File “/Library/Frameworks/Python.framework/Versions/3.6/lib/python3.6/urllib/request.py”, line 526, in open
response = self._open(req, data)
File “/Library/Frameworks/Python.framework/Versions/3.6/lib/python3.6/urllib/request.py”, line 544, in _open
‘_open’, req)
File “/Library/Frameworks/Python.framework/Versions/3.6/lib/python3.6/urllib/request.py”, line 504, in _call_chain
result = func(*args)
File “/Library/Frameworks/Python.framework/Versions/3.6/lib/python3.6/urllib/request.py”, line 1361, in https_open
context=self._context, check_hostname=self._check_hostname)
File “/Library/Frameworks/Python.framework/Versions/3.6/lib/python3.6/urllib/request.py”, line 1320, in do_open
raise URLError(err)
urllib.error.URLError:
Perhaps try downloading the data file to your workstation, place in the same directory as your code file, and change the code to load your local file rather than the URL.
Hi, Jason.
Done as recommended. I copied data from web to Excel and save it as CSV file. Please, have a look. Something is wrong with data formatting in source file, isn’t it? Please, advise.
“/Users/YuriDanilov/PycharmProjects/Week 6/venv/bin/python” “/Users/YuriDanilov/PycharmProjects/Week 6/ML НовыйПроект.py”
Load the dataset:
————————-
Shape:
(150, 5)
Head:
sepal-length sepal-width … petal-width class
0 5.1;3.5;1.4;0.2;Iris-setosa;; NaN … NaN NaN
1 4.9;3.0;1.4;0.2;Iris-setosa;; NaN … NaN NaN
2 4.7;3.2;1.3;0.2;Iris-setosa;; NaN … NaN NaN
3 4.6;3.1;1.5;0.2;Iris-setosa;; NaN … NaN NaN
4 5.0;3.6;1.4;0.2;Iris-setosa;; NaN … NaN NaN
5 5.4;3.9;1.7;0.4;Iris-setosa;; NaN … NaN NaN
6 4.6;3.4;1.4;0.3;Iris-setosa;; NaN … NaN NaN
7 5.0;3.4;1.5;0.2;Iris-setosa;; NaN … NaN NaN
8 4.4;2.9;1.4;0.2;Iris-setosa;; NaN … NaN NaN
9 4.9;3.1;1.5;0.1;Iris-setosa;; NaN … NaN NaN
10 5.4;3.7;1.5;0.2;Iris-setosa;; NaN … NaN NaN
11 4.8;3.4;1.6;0.2;Iris-setosa;; NaN … NaN NaN
12 4.8;3.0;1.4;0.1;Iris-setosa;; NaN … NaN NaN
13 4.3;3.0;1.1;0.1;Iris-setosa;; NaN … NaN NaN
14 5.8;4.0;1.2;0.2;Iris-setosa;; NaN … NaN NaN
15 5.7;4.4;1.5;0.4;Iris-setosa;; NaN … NaN NaN
16 5.4;3.9;1.3;0.4;Iris-setosa;; NaN … NaN NaN
17 5.1;3.5;1.4;0.3;Iris-setosa;; NaN … NaN NaN
18 5.7;3.8;1.7;0.3;Iris-setosa;; NaN … NaN NaN
19 5.1;3.8;1.5;0.3;Iris-setosa;; NaN … NaN NaN
[20 rows x 5 columns]
Description:
sepal-width petal-length petal-width class
count 0.0 0.0 0.0 0.0
mean NaN NaN NaN NaN
std NaN NaN NaN NaN
min NaN NaN NaN NaN
25% NaN NaN NaN NaN
50% NaN NaN NaN NaN
75% NaN NaN NaN NaN
max NaN NaN NaN NaN
Class distribution:
Series([], dtype: int64)
Data visualization: Box and Whisker plots
Data visualization: Histograms
Data visualization: Scatter plot matrix
Traceback (most recent call last):
File “/Users/YuriDanilov/PycharmProjects/Week 6/ML НовыйПроект.py”, line 36, in
scatter_matrix(dataset)
File “/Users/YuriDanilov/PycharmProjects/Week 6/venv/lib/python3.6/site-packages/pandas/plotting/_misc.py”, line 139, in scatter_matrix
**kwds
File “/Users/YuriDanilov/PycharmProjects/Week 6/venv/lib/python3.6/site-packages/pandas/plotting/_matplotlib/misc.py”, line 48, in scatter_matrix
rmin_, rmax_ = np.min(values), np.max(values)
File “”, line 6, in amin
File “/Users/YuriDanilov/PycharmProjects/Week 6/venv/lib/python3.6/site-packages/numpy/core/fromnumeric.py”, line 2746, in amin
keepdims=keepdims, initial=initial, where=where)
File “/Users/YuriDanilov/PycharmProjects/Week 6/venv/lib/python3.6/site-packages/numpy/core/fromnumeric.py”, line 90, in _wrapreduction
return ufunc.reduce(obj, axis, dtype, out, **passkwargs)
ValueError: zero-size array to reduction operation minimum which has no identity
Oh, sorry, Jason, I copied the data to Numbers as far as I work on MacOS. It seems that I solved this issue as well. However, there is a question: I’ve found out that iris.csv from web was copied to Numbers in MacOS with “;” between figures and two “;;” at the end of each line. Replacing “;” to “,” by hands solved the issues with data display, however, how to avoid it next time? Please, advise.
Hi jason,
i was traing model using ‘petal_length’ and ‘petal_width’ only and i got accuracy of about 95%
than i trained the model again with all featues which also resulted in accuracy of 95%
afterwards i tried ‘sepal_length’ and ‘sepal_width’ only, now accuracy is 78%.
So, my questions are:
1. “Can I safely assume that ‘sepal_length’ and ‘sepal_width’ are of no use”?
2. “can i remove them as to make my model less complex’ ?
I have Used ‘GaussianNB’.
Here is my code snippet:
##### Using only ‘petal_length’ and ‘petal_width’
X = data[[‘petal_length’,’petal_width’]]
Y = data[‘class’]
You are simply Awsome Jason ! Thanks ..it took me around 1.5 year for daring to face first ML program..but the way you written and explained is deserves a big round of applause . 🙂
Thank you so much on this beautiful post. First of a kind, really. I have followed and everything works perfectly:
LR: 0.951807 (0.052427)
LDA: 0.976923 (0.035251)
KNN: 0.951807 (0.052427)
CART: 0.953205 (0.061888)
NB: 0.952448 (0.062375)
SVM: 0.984615 (0.030769)
I have some other question regarding this. I have XYZ data on which I have represented various world object like pylons, conductors, trees, buildings and etc. Can I use XYZ data in order to extract the previous objects using something similar to your example above?
Hi I’m going to get into machine learning and Deep Landing but I have no background in algorithmic thinking or programming like Python. But I only know the Python programming language syntax. I was wondering if you could guide me on what to do from beginner to advanced in order to learn machine learning? If the training is project-oriented it is very good. I’m going to do a simple project to fit in my resume as I learn machine learning.
I found this video. Can you give me a thought on this tutorial to start here or not? https://www.youtube.com/watch?v=_uQrJ0TkZlc&t=5954s
worked right out of the box using Anaconda3! you are an amazing human being. I’d like to continue with the way you teach machine learning. I’m intimidated though because my knowledge in programming is average, I have c, c++, visual basic, php, javascript – the old stuffs – background so I can easily follow. I have done a lot of projects and did afterwork for some projects not initially done by me.So I THINK I can follow.
What I’m scared of is the fact that this involves a lot of science and understanding algorithms which is a difficult subject let alone calculus and probability & statistics and my memory is defective,
I’d like to try and thank you for your contribution to this world it means enormously to many many people the world over.
I want to do my research on diabetic ratinopathy using machine learning with python please help me out how can I start my research work . I have only 2 months to complete my work
What would you recommend for Nominal dataset, so far I can see that you used Label Encoding for Ordinal and that’s completely fine because there is a relationship among each category in variable.
However, my dataset is purely categorical-nominal and I used one-hot encoding for all of them, which gave me 200+ columns, what would you recommend for that?
I used a feature selection (chi2 and forest-based) to reduce features as well as PCA for dimensionality. What else I can do?
m’ I correct that there are many limitations regarding nominal data.
Could you tell me what I could do or I could not for this data type?
Thanks for the tutorial, but how am I continuing from here, I have the model I need to use (SVM) he is accurate in 96 presents. And whats next, how am I going to continue working on the model.
Well, I would like to create a machine learning model to recognize the color of traffic lights, right now I’m using image processing to count the number of yellow, red and blue pixels, getting the max number out of them which is the color of the traffic light, and it works very well.
My question is how can I start programming and write code to build the model?
Thank you very much for this tutoriel and sorry for my english.
I have some questions:
when i learned confusion matrix, the last one is applied on a model which predict categorical variable with two values ( yes or no). But in this case the variable have three values, now i dont know how to interpret it. I don’t know which case is false positive, false negative
Also i’m beginner in machine learning and i have some weakness in statistic, so could you please give me a way to go?
I am new to machine learning, and coding in general. I am using a dataset that has column data with completely different meanings/scales for each observation. Does this matter? I see that the example data has is all in cm.
Example:
column 1 column 2 . column 3
12 45 53
13 44 54
12 44 54
if each number represents a different variable ( 12 = male, 13 = female) (45 = tall, 44 = short) do I have to find a way to standardize each observation?
Yes, in some cases it will be a good idea to scale data with different measures. In the case of LDA, probably standardize the data is a good move, e.g. as part of a pipeline when using k-fold cross validation.
My question is how do I actually predict about image. I got a dataset of traffic lights with stats about the appearance of each color 0-5 (ranges of red) 6-11 (ranges of green) 12- 15(ranges of yellow)
This is my code:
from sklearn.metrics import confusion_matrix
from sklearn.metrics import accuracy_score
from sklearn.ensemble import RandomForestClassifier
from sklearn.model_selection import train_test_split
hi.
i have a question.u said before that we have to convert data to a list after that we convert the list to an array.in the example up we find : array=dataset.values.
we did not use the numpy array in this case?
and what does this line of code means?
so there is a relationship between numpy and pandas array?
but when i tried array=numpy.array(dataset) i got errors and i thinked that it was the same code.could u explain it for me please.
and thnx for the reply.
Thanks for this step by step example. This is the first one that makes sense and is easy to follow.
My question is how do you understand the results of a model? What is determine to be a good model? I am learning to use SparkSQL/databricks and the have different fuNctions with different results MSE and MAE.
Typically a model is chosen that is both relatively simple and performs well compared to other models on a hold out dataset and the results are stable over multiple evaluations.
Hey Jason,
great work and really helpful ,however i need to know about the ” Hyperparameter Tunnig”.
when to use it and what would be the steps regarding the same followed by the type of dataset used.
thanks if you would reply.
Thank you Jason! This was really helpful. Do you have guidance or a recommendation regarding the size of the test data set relative to the validation data set? In this example we used 20%, is there some rule of thumb for test group sizes?
Also what exactly is this bit doing? does it have something to do with the number of variables in the algorithm?
X = array[:,0:4]
y = array[:,4]
Again thanks for this tutorial, it really is helpful and I hope you continue to do this. Hands down the best/easiest tutorial I’ve found.
hi, thks for step by step ML introdcution. I’m new to learn ML. Are there only 6 supervised model to use in Python for prediction. If not, what other model can be used.
Btw, how will we know supervised model not suitable to use but need to consider other algorithm such as NLP, DL,..etc
Helllo there!
This tutorial was very useful for me to get into ML. Recently, I completed Andrew Ng course of ML and was stuck what to do next. This post helped me get through it so smoothly. So, jason I have two questions for you:
1.What should I do next to get my hand dirty in the field of ML?
2.This question is related to iris project , I tried to implement the LDA model to find the
predictions but it popped some errors as follows:
—————————————————————————
TypeError Traceback (most recent call last)
in
1 model = LinearDiscriminantAnalysis
—-> 2 model.fit(X_train, Y_train)
3 predictions = model.predict(X_validation)
Hello Jason:
I am really enjoying your tutorial, thanks for offering this training.
While stepping thru your tutorial, I am also experimenting by changing the code to see what I get and why I get. Anyway, here is an example of my experiment (assigning of X and y before train_test_split() call):
Instead of slicing the dataset DF for assign to X and y:
X = array[:,0:4]
y = array[:,4]
I experimented followings:
# Experiment A: Split-out validation dataset (feature columns assigned to a set ‘{}’)
feature_col_names = {‘sepal-length’, ‘sepal-width’, ‘petal-length’, ‘petal-width’}
class_col_name = ‘class’
X = dataset[feature_col_names].values
y = dataset[class_col_name].values
# Experiment B: Split-out validation dataset (feature columns assigned to a list ‘[]’)
feature_col_names = [‘sepal-length’, ‘sepal-width’, ‘petal-length’, ‘petal-width’]
class_col_name = ‘class’
X = dataset[feature_col_names].values
y = dataset[class_col_name].values
In either of the steps (your slicing method and my experiments) gives the same result of spotcheck:
LR: 0.941667 (0.065085)
LDA: 0.975000 (0.038188)
KNN: 0.958333 (0.041667)
CART: 0.950000 (0.040825)
NB: 0.950000 (0.055277)
SVM: 0.983333 (0.033333)
My questions are:
1. Is there any advantage of using your slicing method in assigning X and y ?
2. Is there any issue of using column names variable (as I did above)
3. Which one is more accurate, column variable as a ‘list’ [] or ‘set’ {}?
Hello Jason:
Thanks for your reply. As I read, you preferred Array over DataFrame.
Is there any particular advantage of using array over dataframe ?
I would like to know, because I prefer Pandas dataframe.
FitFailedWarning)
/home/zigbee/.local/lib/python3.7/site-packages/sklearn/model_selection/_validation.py:536: FitFailedWarning: Estimator fit failed. The score on this train-test partition for these parameters will be set to nan. Details:
ValueError: could not convert string to float: ‘Some-college’
FitFailedWarning)
im using this tutorial on Adult dataset and facing problem with end print statement error come couldnot convert string to float please help Mr jason
Thanks for this first-project for ML, it was quite useful. Interestingly the LDA ended up as strongest after k-fold validation, with the SVM a lot lower than Dr. Jason’s value (maybe a statistical artifact considering the large standard deviation):
model = SVC(gamma=’auto’)
model.fit(X_training, y_training)
predictions = model.predict(X_validation)
doesn’t this create and train a new SVC machine on the whole data set? meaning it would give different results than if the machine was trained part-by-part through cross-validation. Is there a way to return the machine after being trained specifically on k-folding?
Correct. Yes, we have already estimated how well the model will perform on average when making new predictions. That was the whole point of doing the cross-validation.
Thank you so much for the privilege of participating in this project. I have a few questions.
1) Out of all the models we used, it seemed to me that we have used SVM for making our prediction. How can we make predictions with the other model?
2) For instance, if I am to do a forecast of prediction of let’s say wind power with varying weather conditions, can this method we have used be applied to it?
3) Can you please give a clearer explanation of the prediction results?
How can I approach to build a ML model to forecast percent free space available on a drive for a particular server and drive.
Feature variables (X) – servername, drive, date/time
Output variables (Y) – precetfree
Do you have any suggestions on how I can get srtarted?
Thanks for all the work, your approach is making getting into machine learning really efficient for me. I want to take advantage of the technology for practical uses even though I don’t have much time to spare in learning all about it, so I really appreciate it.
The reason I write is because the 5.5 complete example runs for me but raises this error:
“FutureWarning: Setting a random_state has no effect since shuffle is False. This will raise an error in 0.24. You should leave random_state to its default (None), or set shuffle=True.”
Solved it by changing the first line of the for loop to :
kfold = StratifiedKFold(n_splits=10, random_state=1, shuffle=True)
But i try to run with my own dataset. It stated out this warning..What does it mean and how i can solve it?
C:\Users\user\anaconda3\lib\site-packages\sklearn\model_selection\_split.py:667: UserWarning: The least populated class in y has only 1 members, which is less than n_splits=10.
% (min_groups, self.n_splits)), UserWarning)
Hi Jason – I would like to appreciate your effort to put forth a comparable hello world program in machine language. This indeed give us an idea on how to go about for ML programs, different stages before we finally test the algorithm.
My theory was put to test and was able to quickly understand the complete workflow. I was able to understand the utility of univariate and multi-variable plot in principal. To be honest, i was able to to understand the “in-principal” use of each section which was otherwise non-relating for me. I being a master of connecting dots, it helps me learn when i am able to connect the dots.
working through your example and wanted to post my data
LR: 0.955909 (0.044337)
LDA: 0.975641 (0.037246)
KNN: 0.950524 (0.040563)
CART: 0.966550 (0.041087)
NB: 0.951166 (0.052812)
SVM: 0.983333 (0.033333)
Great article, thank you for that. The only question i have is if there is a way to download the data set after we make predictions? for example, we upload the csv with these numeric attributes, with an empty column (eg ‘category’) and in return we get that column populated
Hi, I am new to machine learning. I have given a set of nighttime satellite images and few CSV files, I need to create a machine learning model. Could you please tell me what would be the role of images, what should I extract from them?
Thank your valuable training. My question is what would be the results? I mean can we have any correlation as out put? or what kind of figure( plot) would be the outputs?
Hi, when making univariate and multivariate diagrams there are only 3 pairs of data sets, this also appears when viewing data in python. Any ideas why? thanks
Okay, this is an excellent tutorial. The level of thoroughness is just right, it’s explained so that I can follow everything and understand, without getting boring.
Well, except this. You write
“The confusion matrix provides an indication of the three errors made.”
For the life of me, I can only find one error in the confusion matrix, a virginica predicted to be a versicolor. With 30 elements in the validation set, one error also gives me a 97% accuracy rate. Is this just a typo, or am I missing something?
Hello Jason,
Great tutorial,
I have a question not related to this post,
I have a dataset with repeated measures(correlation is present) and mix variables(numeric and categorical) and my target is binary (yes,no).
What machine learning model would you suggest (for example what classifier)?
Also can i run a unsupervised model in this situation?
Thanks for helping with great posts.
I tried to import the following libraries in command line, but it was showing the error “from is not recognized as an internal or external command, operable program or batch file”. What should be done, can I write code in Jupyter Notebook?
from pandas import read_csv
from pandas.plotting import scatter_matrix
from matplotlib import pyplot
from sklearn.model_selection import train_test_split
from sklearn.model_selection import cross_val_score
from sklearn.model_selection import StratifiedKFold
from sklearn.metrics import classification_report
from sklearn.metrics import confusion_matrix
from sklearn.metrics import accuracy_score
from sklearn.linear_model import LogisticRegression
from sklearn.tree import DecisionTreeClassifier
from sklearn.neighbors import KNeighborsClassifier
from sklearn.discriminant_analysis import LinearDiscriminantAnalysis
from sklearn.naive_bayes import GaussianNB
from sklearn.svm import SVC
I follow this first tutorial and apply my recent discovery to Jupyter Notebook with a template for taking the paper format of IEEE.
And the result in PDF is so cool. I need a little bit more drilling with the concepts in ML, but mixed with automated reasoning with PySwip I think It will be a cool work.
Hi Jason,
Would it be correct to say that while doing train_test_split, adding the parameter ‘stratify=y’ is a better/recommended way to go?
I tried with and without stratify and got perfect predictions (accuracy=1) when stratified, but am not sure if that is just coincidental for this data set or is always recommended?
Your explanation really helpful for me to practice on python. It’s very kind of you to show us how to do what in the codes.
It’s hard for me to say, but as someone new to these, i find it’s hard for me to understand ‘what the code is actually do’ in one go. I think that for me to better understand what this step-by-step tutorial is actually do, I need the flowchart diagram.I’m sorry,could you maybe provide it please.
Hello Jason – Out of my interest I am learning ML with Python. I don’t have a development background(So not sure if this is a good start) and been in QA for almost 10 yrs. I was looking for a place to start and somehow landed here. I tried the example and it was interesting so I am going to continue with the rest. I do have a question on
This evaluates the Model and gives scores for 10 splits of the entire dataset. Is there a way I can see what are those 10 splits or is this like a black box and we only get the score for each set?
One question though , In the defintion of split this is what has been written
“Generate indices to split data into training and test set.” What does this mean?
Also if I use train_test_split , I declare train & test percentage but in case of split() , how does it decide what % of data will be treated for train and for test. Is it like data_sample_count / kfold_split ?
In the above link, they have plotted svm classification plot for iris dataset. Accordingly, how to plot any classification plot (like svm,knn,lda,decision tree etc) for our own dataset. Thankyou for your response.
How could we create a plot for the model evaluation results and compare the spread and the mean accuracy of each model?
can you show the plot for model evaluation results for your algorithm?
I have a question in “Compare Algorithms” step, in this line below:
cv_results = cross_val_score(model, X_train, Y_train, cv=kfold, scoring=’accuracy’)
Why the input of cross_val_score function is X_train and Y_train rather than X and y, like this:
cv_results = cross_val_score(model, X, y, cv=kfold, scoring=’accuracy’)
I mean why don’t we use cross_val_score on the dataset rather than the train set ?
Because when I use this function on the dataset, the highest score is LDA not SVM.
LR: 0.953333 (0.042687)
LDA: 0.980000 (0.030551) (highest)
KNN: 0.966667 (0.033333)
CART: 0.946667 (0.065320)
NB: 0.960000 (0.044222)
SVM: 0.973333 (0.032660)
Then I use LDA to make predictions and the result of accuracy score is 1.0
1.0
[[11 0 0]
[ 0 13 0]
[ 0 0 6]]
precision recall f1-score support
I read your tutorial and I came to know about ML. I want to ask a question. How to improve a particular algorithm so that percentage of accuracy increases by using an improved algorithm? For example, you used SVM as the final model. How to improve it so that accuracy increases?
Thank you for your guidance and I will go through it. However, I also want to ask is how to make our own algorithms from scratch that could give an expected accuracy level just like the algorithms mentioned in your post? Do you have any reference to how to devise our own algorithms?
Hi Jason,
I’m new to Machine learning and this is my first model.
I even added printing of accuracy by validating it as its done in the last for this example,
Looking at it accuracy is 1 for LDA and KNN, but currently in the example and from the below, mean value is more for SVM, so which should be used and can you explain why?
LR: Mean:0.941667 STD: (0.065085), : Accuracy: 0.833333
LDA: Mean:0.975000 STD: (0.038188), : Accuracy: 1.000000
KNN: Mean:0.958333 STD: (0.041667), : Accuracy: 1.000000
CART: Mean:0.950000 STD: (0.040825), : Accuracy: 0.966667
NB: Mean:0.950000 STD: (0.055277), : Accuracy: 0.966667
SVM: Mean:0.983333 STD: (0.033333), : Accuracy: 0.966667
Typically we choose the “simplest model” with the “best performance”. There is always tension between these two concerns and often “better performance” wins.
Thank you Jason for all the comprehensive posts, I learned a lot, I have read almost all of your posts. Actually, I am in the middle of a machine learning practice and really need your professional hits to resolve the faced challenge.
The problem: I have a list of clients and the model should predict whether they would reorder any specific product or not.
The point is I have historical information of conditions for each time of ordering of these products for every single client.
Some products are in common and some not for these clients and number of orders and historical data of orders for each client is imbalanced i.e. some clients have 20 products in the list and some have 5, I have more than 10000 historical records of some customer and less than 5000 for some others.
I want to make a model to predict each product reordering based on each client’s behavior and condition (client behavior and condition=historical data). Which model is better and How can I high light products and client ID to the model?
I recommend testing a suite of different framings of the problem, different data preparations, different models, and model configuration in order to discover what works well for your specific dataset.
Now, I have a question about working with PyCharm IDE.
I ran the code first shown in Step 2, loading the data.
When trying to load the dataset I’m getting an SSL error executing:
dataset = read_csv(url, names=names)
Note: url is defined as “https://raw.githubusercontent.com/jbrownlee/Datasets/master/iris.csv”
urllib.error.URLError:
So, something is missing in my PyCharm project environment. Any idea what this can be?
Thanks for the advice. Now I gotta learn what all the steps in this tutorial did!
Algorithmic comparisons, validations, predictions (probably the most interesting subject) etc.
The IDE is convenient but not necessary; I should follow your advice.
Now, the thing I should decide is next step(s) to answer the above questions. You seem to have posted more tutorials but also published a book. More advice here would be appreciated.
Hi,
First of all big thanks for this excellent tutorial. it helped me a lot to get starting with machine learning techniques.
I’m just stuck in the creation of a validation dataset, in this line
X_train, X_validation, Y_train, Y_validation = train_test_split(X, y, test_size=0.20, random_state=1)
it shows me that the train_test_split variable is not defined in the code. and to be honest I don’t really understand what this line is supposed to do.
can you please help me to finish this tutorial?
thanks for sharing the link. another question please, how can I know from my result the overfitting and underfitting?
if the training score is .9 and the testing score .95 is it mean overfitting?
Good question, focus on the out of sample/test set performance. Overfitting/underfiting is a diagnostic you can do for poorly performing models in some cases. Like neural nets. Ignore for now/model selection. Also see this: https://machinelearningmastery.com/overfitting-machine-learning-models/
Hi, first, congrats on the tutorial! It really helped me to understand better how to apply ML through Python!!! However, as I’m new in this field, I have two questions, and if you could answer me, I’d be so grateful. First, I’d like to print the predictions. Then, I’d like to evaluate the algorithms through the Area Under the Curve. How can I do these two things? Can you help me?
Hi! I’m sorry by my last message. My real problem at this moment is:
I tried to calculate the AUC for the models in the code above plus the inclusion of RFC. To do this I used the code below:
resultsauc = [ ]
namesauc = [ ]
for name, model in models:
probs = model.predict_proba(X_validation)
probs = probs[:, 1]
auc_results = roc_auc_score(Y_validation, probs)
resultsauc.append(auc_results)
namesauc.append(name)
print(name, auc_results)
However, Python send me the following message:
Traceback (most recent call last):
File “C:\Users\Acer\OneDrive\Working on\Machine_Learning\05.ML&Python\MachineLearning.py”, line 156, in
probs = model.predict_proba(X_validation)
File “C:\Users\Acer\AppData\Local\Programs\Python\Python38-32\lib\site-packages\sklearn\linear_model\_logistic.py”, line 1463, in predict_proba
check_is_fitted(self)
File “C:\Users\Acer\AppData\Local\Programs\Python\Python38-32\lib\site-packages\sklearn\utils\validation.py”, line 63, in inner_f
return f(*args, **kwargs)
File “C:\Users\Acer\AppData\Local\Programs\Python\Python38-32\lib\site-packages\sklearn\utils\validation.py”, line 1041, in check_is_fitted
raise NotFittedError(msg % {‘name’: type(estimator).__name__})
sklearn.exceptions.NotFittedError: This LogisticRegression instance is not fitted yet. Call ‘fit’ with appropriate arguments before using this estimator.
Hi. When I use your Python code with another dataset, I get as error that the target type is not binary and not multiclass, but continuous. So the target type must be binary or multiclass but my dataset is continuous. What can I change so that I can use your python code with my dataset without an error?
I would be very happy about a feedback. 🙂
File “/opt/anaconda3/lib/python3.7/site-packages/sklearn/model_selection/_split.py”, line 641, in _make_test_folds
allowed_target_types, type_of_target_y))
Really amazing post I have ever seen about ML. I am a new bee, thank you for sharing such a wonderful post with examples and step by step explanation. Will continue to follow your post, well done.
Hi, I was just wondering how I could actively apply this. For example, with this model, is it possible to somehow integrate it into some code so that I can key in the parameters, and it gives the identity of the flower? Thank you.
Hi Jason. Thanks for the tutorial. I found it easy to follow and everything worked first time.
I do have a couple of questions for you. As this is the first ever ML program I’ve created I don’t fully understand what’s happening. Can you please tell me in the simplest of terms what exactly the machine is learning? Am I correct in thinking that it takes the data from the set then uses the petal/sepal data to predict what species of Iris this data belongs too?
We are predicting flower species based on flower measurements. We are using some historically collected data, tested some models to see what is good at making this prediction, then selected a model to make predictions on some data.
Hi. Thank you for the above tutorial. really helpful. Now I need help with a school project here. I want to build an ANN traffic control system that predicts the number of cars approaching a roundabout and indicate the right traffic light. Any help or pointing to where I can begin or tutorials available will be much appreciated
Thanks for this tutorial. I think that I may be misunderstanding how the split function works. You have this string in the code: X = array[:,0:4] and y = array[:,4]
I am assuming that X is the input, i.e. the various lengths. I am not clear as to y column 4 is also included in the input. I assume column 4 is the the out (which i am taking to indicate the iris class) as this is what is passed to y.
Secondly, is it possible to amend the code to deal with multiple outputs? I have 3 outputs. I know that I could run the code in turn for each output but I suspect that my outputs are correlated and any derived relationship has map the 3 outputs to the 3 inputs in one step.
Hello,
I am new to Machine Learning and i have tried your model/codes on my dataset but am having below errors. Can you help?
Traceback (most recent call last):
File “C:\Users\Public\Documents\Sheena\venv\lib\site-packages\joblib\parallel.py”, line 820, in dispatch_one_batch
tasks = self._ready_batches.get(block=False)
File “C:\Program Files\WindowsApps\PythonSoftwareFoundation.Python.3.9_3.9.1776.0_x64__qbz5n2kfra8p0\lib\queue.py”, line 168, in get
raise Empty
_queue.Empty
During handling of the above exception, another exception occurred:
Traceback (most recent call last):
File “C:\Users\Public\Documents\Sheena\ML Testing.py”, line 40, in
cv_results = cross_val_score(model, X_train, Y_train, cv=kfold, scoring=’accuracy’)
File “C:\Users\Public\Documents\Sheena\venv\lib\site-packages\sklearn\utils\validation.py”, line 63, in inner_f
return f(*args, **kwargs)
File “C:\Users\Public\Documents\Sheena\venv\lib\site-packages\sklearn\model_selection\_validation.py”, line 445, in cross_val_score
cv_results = cross_validate(estimator=estimator, X=X, y=y, groups=groups,
File “C:\Users\Public\Documents\Sheena\venv\lib\site-packages\sklearn\utils\validation.py”, line 63, in inner_f
return f(*args, **kwargs)
File “C:\Users\Public\Documents\Sheena\venv\lib\site-packages\sklearn\model_selection\_validation.py”, line 250, in cross_validate
results = parallel(
File “C:\Users\Public\Documents\Sheena\venv\lib\site-packages\joblib\parallel.py”, line 1041, in __call__
if self.dispatch_one_batch(iterator):
File “C:\Users\Public\Documents\Sheena\venv\lib\site-packages\joblib\parallel.py”, line 831, in dispatch_one_batch
islice = list(itertools.islice(iterator, big_batch_size))
File “C:\Users\Public\Documents\Sheena\venv\lib\site-packages\sklearn\model_selection\_validation.py”, line 250, in
results = parallel(
File “C:\Users\Public\Documents\Sheena\venv\lib\site-packages\sklearn\model_selection\_split.py”, line 332, in split
for train, test in super().split(X, y, groups):
File “C:\Users\Public\Documents\Sheena\venv\lib\site-packages\sklearn\model_selection\_split.py”, line 80, in split
for test_index in self._iter_test_masks(X, y, groups):
File “C:\Users\Public\Documents\Sheena\venv\lib\site-packages\sklearn\model_selection\_split.py”, line 693, in _iter_test_masks
test_folds = self._make_test_folds(X, y)
File “C:\Users\Public\Documents\Sheena\venv\lib\site-packages\sklearn\model_selection\_split.py”, line 645, in _make_test_folds
raise ValueError(
ValueError: Supported target types are: (‘binary’, ‘multiclass’). Got ‘unknown’ instead.
I believe probably your “model” variable is created with some parameters wrong. May be you look in that direction. Can’t tell much from this given information.
hi jason, i was wondering, is it not necesarry to convert the target value (iris sentosa etc) into numerical data? as far as i know python can only run numerical data not string data. sorry if my question is stupid i just started learning machine learning. thank you in advance!
Depends on your model. Decision tree can give you string data as output, but neural network needs to be numerical and then you interpret the numerical data into other strings.
2nd, Please guide me how I can define or communicate my model result to my management or you can say a LAYMAN? For example, I follow all of your steps and my results are
Thanks for the reply. I’m totally new to Data Science and self studying it. For last 4 days, I m doing research on this “how to interpret a MAE, MEan and Std to a layman” but couldn’t find anything good.
I don’t think I can give you any good explanation at this level. This is a good book for real beginners that I believe you will find some insight: https://amzn.com/0062731025
in this line-> “for name, model in models”
how could it detect which part is name in which part is model? isnt models a list type variable?
sorry if my question is dumb, thanks in advance
That’s a Python syntax. The “models” is a list of the form [(name,model), (name,model), …]
Hence the for line you quoted will take each name-model pair in each iteration.
Your number is a bit low. But did you tried multiple times with different random seed? If you still see a low number for different run, there should be something wrong with your data or your models.
found my problem… i was mucking with the previous array slice, and had left it saying:
X = array[:,0:2]
changing it back to
X = array[:,0:4]
fixed the problem
Thank you so much! I love the information you provide here, I love the way in which you provide it. The scope is at the sweet spot to satisfy my curiosity but not overwhelm me.
I love the images and plots that accompany the informaiton and make your post much more accessible!
This post and your attitude is empowering me to retake on this very deep and vast subject. Have a blessed day!
Thanks for taking your time to write this excellent piece for free. I happened to to have bumped on this well after versions had changed. The version you used or anything near that can no longer be downloaded. Any hope of rewriting using newer one as some lines seems not work any more?
Thank you so much for explaining everything in detail. I actually have quote a few doubts:
1. Why and when should we clean the dataset?
2. Is there any method in allotting the ratios of train-test-validation dataset (instead of us allotting the ratios)?
3. Will the results vary if we give different ratios for train-test-validation with different models? If yes, how?
# Split-out validation dataset
import numpy as np
from sklearn.model_selection import train_test_split
array = df.values
X = array[:,1:60]
y = array[:,60]
X_train, X_validation, Y_train, Y_validation = train_test_split(X, y, test_size=0.20, random_state=1)
# Spot Check Algorithms
from pandas import read_csv
from matplotlib import pyplot
from sklearn.model_selection import train_test_split
from sklearn.model_selection import cross_val_score
from sklearn.model_selection import StratifiedKFold
from sklearn.linear_model import LogisticRegression
from sklearn.tree import DecisionTreeClassifier
from sklearn.neighbors import KNeighborsClassifier
from sklearn.discriminant_analysis import LinearDiscriminantAnalysis
from sklearn.naive_bayes import GaussianNB
from sklearn.svm import SVC
# evaluate each model in turn
results = []
names = []
for name, model in models:
kfold=StratifiedKFold(n_splits=10,random_state=1,shuffle=True)
cv_results=cross_val_score(model, X_train, Y_train, cv=kfold, scoring=’accuracy’ )
results.append(cv_results)
names.append(name)
print(‘%s: %f (%f)’ % (name, cv_results.mean(), cv_results.std()))
I’m getting this Error:
ValueError: Supported target types are: (‘binary’, ‘multiclass’). Got ‘unknown’ instead
Seams the problem is this row :cv_results=cross_val_score(model, X_train, Y_train, cv=kfold, scoring=’accuracy’ )
Can you help me ?
I’m eager to help, but I just don’t have the capacity to debug code for you.
I am happy to make some suggestions:
Consider aggressively cutting the code back to the minimum required. This will help you isolate the problem and focus on it.
Consider cutting the problem back to just one or a few simple examples.
Consider finding other similar code examples that do work and slowly modify them to meet your needs. This might expose your misstep.
Consider posting your question and code to StackOverflow.
I have just one question, please:
In the section where we evaluate some algorithms, you wrote:
cv_results = cross_val_score(model, X_train, Y_train, cv=kfold, scoring=’accuracy’)
Why you considered the training set only (X_train, Y_train) and not the WHOLE data set?
Is there something wrong with the code in 5.1 Create a Validation Dataset? The last number of X = array[:,0:4] should be 3, not 4. I am not really sure by the way.
Hello! So I’m doing this project and am trying to integrate some machine learning into it.
I want to recreate a physics equation (using data generated by the equation itself or through experimentation) with unsupervised machine learning. Using the code above, are there functions that allow me to generate an equation or possibly view relationships between variables?
Thanks a lot by the way. Your articles are the best that I have seen online teaching machine learning, and you’re such a great teacher!
Hi Alson…That sounds like a very interesting application! We do not currently have content specific that objective, however I would recommend the following location as a great starting point for all of the content we have developed.
thanks a lot for sharing such a nice tutorial, it helps a lot in starting, i have query, I would like to see the confusion matrix for each fold, could you please advise in this regard.
Can you post a model for very basic case like two numbers
odd ,odd = addition
odd , even = subtraction
even , odd = multiplication
even , even = division
Hello, James. I was just wondering how this is considered as machine learning because I have a very vague understanding of what machine learning is. Can you specifically tell me where the machine learning part is. Thank you very much for the tutorial.
Machine Learning or ML is the study of systems that can learn from experience (e.g. data that describes the past). You can learn more about the definition of machine learning in this post:
What is Machine Learning?
Predictive Modeling is a subfield of machine learning that is what most people mean when they talk about machine learning. It has to do with developing models from data with the goal of making predictions on new data. You can learn more about predictive modeling in this post:
Gentle Introduction to Predictive Modeling
Artificial Intelligence or AI is a subfield of computer science that focuses on developing intelligent systems, where intelligence is comprised of all types of aspects such as learning, memory, goals, and much more.
Machine Learning is a subfield of Artificial Intelligence.
Nvm, I think I see it, but please still tell me where the machine learning part is because I might be wrong. Btw, how does cross_val_score work? Thanks
Hi Chris…While we do not recommend any particular Python platform, many have provided feedback that the majority of the code listings we provide in our content will work quite well in Jupyter Notebook, Anaconda, or Google Colab. Please proceed with what works best for you.
Hi Jason,
This is amazing! Thank you so much for sharing!
How can i see the data from the CSV along with the algorithm’s prediction? I would like to see which one’s the model got wrong.
Thanks again!
This is exactly what I was looking for! A way to quickly get my hands dirty with this stuff, even if I don’t understand everything going on in the background.
After I did the tutorial as instructed, I went back to the beginning to try to understand more of what was going on. Eventually I was looking up each algorithm presented here and their parameters. While I didn’t quite understand what all the parameters of the algorithms did, I fiddled with several of them, trying to refine each model as much as I could.
I ended up getting the LDA (solver = ‘eigen’, shrinkage = 0.2) predicting as well as the SVM (0.983333) on the CV. To my surprise and joy, that model ended up predicting the validation data perfectly!
Anyway, it was a fun way to start this journey and I look forward to learning a lot more.
Very descriptive article for beginners, thank you very much. Do you have any other article like this that shows how to give the real life user inputs and how the output is given. It will be very helpful if the same IRIS project is used.
Hello,
in 5.4 select the best model, in the results only SVM appears and when comparing the algorithms only SVM appears.
How can I solve this?
Thank you.
Great intro and it was very nice to run into this tutorial to get me started. Lol i’ll have to go over it a few times to grok everything but thank you so much for this. These are my results:
I am starting at square 0, and after clearing a first few hurdles, I was not even able to install the libraries at all… (as a newb), I didn’t see where I even GO to import this:
Thank you very much for such a detailed tutorial on Machine Learning. I really appreciate your effort to help beginners like me. I am looking forward to learning more about it.
Thanks for the walkthrough, I got stuck unnecessarily because my editor autocorrect the StratifiedKFold to StratifiedGroupKFold but that’s just a me problem
How does this change if your data is not all in the same units or uses text? for example, i have a csv file, each row contains a description of an animal and in the column next to it i have the animal that the descriptions belong to. i want to be given new rows of descriptions and have the model predict what animal the description belongs to.
I did enjoy this proect and I can easily follow on whats going on but there is a part where I do have to review the code a little more. Here are my results. I have a request, I would like to modified the project and put it on my github. I don’t own the code, so that is why I am asking. I am hoping this will help show my understanding of machine learning.
Hi…The issue you’re facing could be due to the use of “smart quotes” (‘ and ’) around the model names instead of standard single quotes ('). Python does not recognize smart quotes, which might be causing the issue.
Here is the corrected code:
python

# Spot Check Algorithms

models = []

models.append(('LR', LogisticRegression()))

models.append(('LDA', LinearDiscriminantAnalysis()))

models.append(('KNN', KNeighborsClassifier()))

models.append(('CART', DecisionTreeClassifier()))

models.append(('NB', GaussianNB()))

models.append(('SVM', SVC()))

# evaluate each model in turn
Make sure you’re also using the appropriate imports for these models. Here’s a full example including the imports and evaluation:
python

# Import necessary libraries

from sklearn.model_selection import KFold, cross_val_score

from sklearn.linear_model import LogisticRegression

from sklearn.discriminant_analysis import LinearDiscriminantAnalysis

from sklearn.neighbors import KNeighborsClassifier

from sklearn.tree import DecisionTreeClassifier

from sklearn.naive_bayes import GaussianNB

from sklearn.svm import SVC

from sklearn.datasets import make_classification
# Generate some sample data
X, y = make_classification(n_samples=100, n_features=4, random_state=1)
array = data.values
X = array[:,0:4] # features first 4 row
y = array[: 4] # targets last column
X_train, X_validation, Y_train, Y_validation = train_test_split(X, y, test_size=0.20, random_state=1)
#You now have training data in the X_train and Y_train for preparing models
# and a X_validation and Y_validation sets that we can use later.
# ValueError: Found input variables with inconsistent numbers of samples: [150, 4]
hi jason can you tell me why I’m getting this ValueError?
Hi Rachit…The **ValueError** occurs because the number of samples in \( X \) (features) and \( y \) (targets) are inconsistent. Let me break this down step by step to explain what went wrong in your code and how to fix it.
### Problem in the Code
1. **Array slicing issue for y**: python
y = array[: 4]
– This line is incorrect because you are trying to slice the first **4 rows** of the dataset for \( y \), instead of selecting the **last column**.
– As a result, \( y \) becomes an array of shape \((4, n)\), with only the first 4 rows of the dataset, rather than a 1D array (or 2D column) corresponding to the target column of the dataset.
2. **Mismatch in sample sizes**:
– \( X \) has 150 rows (assuming your dataset has 150 samples).
– \( y \) only has 4 rows due to incorrect slicing.
When you try to split the data into training and validation sets using train_test_split, it raises an error because \( X \) and \( y \) must have the same number of rows (samples).
—
### Correct Approach
You need to properly slice \( y \) to ensure it corresponds to the last column of the dataset. Here’s how you can fix it:
python

# Assuming the target is the last column

X = array[:, 0:4]  # Features: all rows, first 4 columns

y = array[:, 4]    # Target: all rows, last column
### Explanation of Fixes
1. **Proper slicing for features (X)**:
– \( X \) includes all rows and the first 4 columns (features).
2. **Proper slicing for targets (y)**:
– \( y \) includes all rows and only the last column (target).
3. **Consistent sample sizes**:
– Now both \( X \) and \( y \) have the same number of rows (samples), which avoids the ValueError.
—
### Additional Notes
– Ensure that your dataset has the expected structure:
– \( X \) is typically a 2D array of shape \((n_{\text{samples}}, n_{\text{features}})\).
– \( y \) should be a 1D array (or 2D column vector) of shape \((n_{\text{samples}},)\) or \((n_{\text{samples}}, 1)\).
– If the target column is not the last one, adjust the slicing accordingly: python
y = array[:, column_index] # Use the correct column index for the target
I was so worried about this jargoon term they call MACHINE LEARNING! Now I’m equipped with the right mindset to continue this process. I will save this page, because I’ll come back here when I have become.
Selection of the Best Model
LR: 0.941667 (0.065085)
LDA: 0.975000 (0.038188)
KNN: 0.958333 (0.041667)
CART: 0.958333 (0.041667)
NB: 0.950000 (0.055277)
SVM: 0.983333 (0.033333) > This is the best model with a 98.33% accuracy
I looked at the code as it was given by our honours lecture for applied data science module here in the University of South Africa (UNISA), wow man this has boosted my hopes of being competent and mastering data science because looking at the job prospects here in south africa I think i might end up doing data science as a side thing will holding on another Job,since its Job opportunities are hard to get into and am already 32 years
Hence I will do data science for passion and hope to contribute to the growth of the field and become its pioneer
Hello Jason, thank you for your detailed explanation. I got a deprecated function warning for the LogisticRegression function. The interpreter suggested I replace it with:
sklearn.multiclass.OneVsRestClassifier
“FutureWarning: ‘multi_class’ was deprecated in version 1.5 and will be removed in 1.7. Use OneVsRestClassifier(LogisticRegression(..)) instead. Leave it to its default value to avoid this warning.”
I did this by adding the following model definition:
“from sklearn.multiclass import OneVsRestClassifier”
and changing the LR model append to:
“models.append((‘LR’, OneVsRestClassifier(LogisticRegression(solver=’liblinear’))))”
Minor quibble with the boxplot, labels is being deprecated and changed to “tick_labels”.
“plt.boxplot(results,tick_labels=names)”
I used the Anaconda Navigator 2.7.0 and Spyder 3.13.9 for my development. Worked when Visual Studio 2026 wouldn’t compile the SciPy due to an incompatibility with intel OneAPI Fortran compiler.

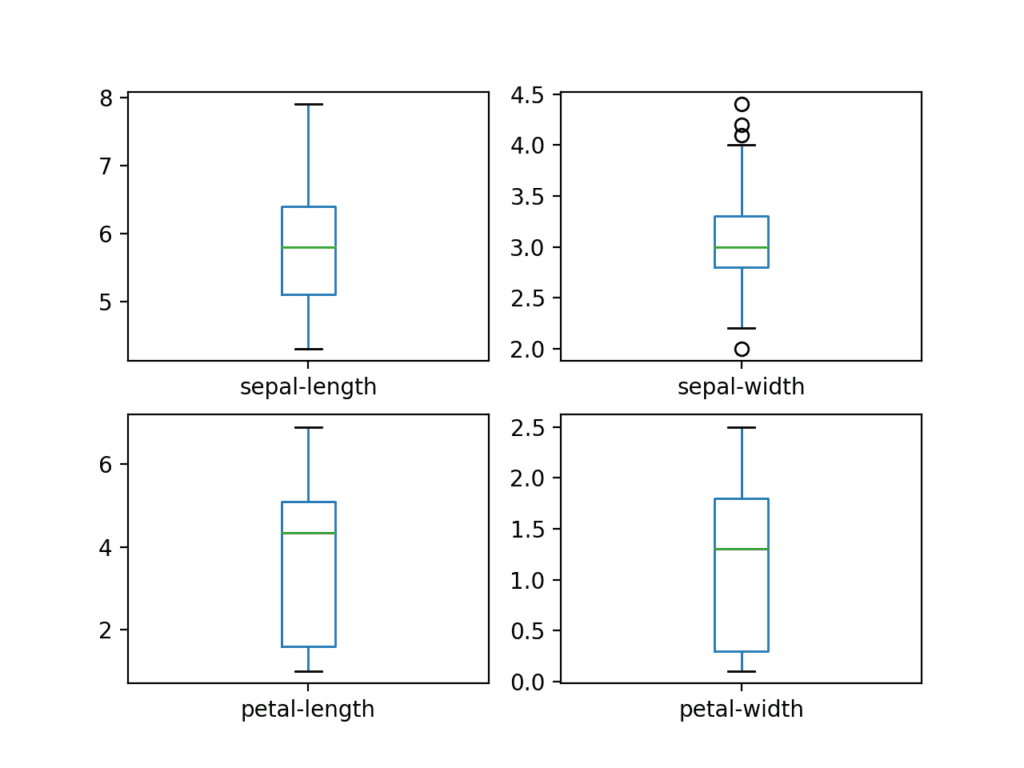
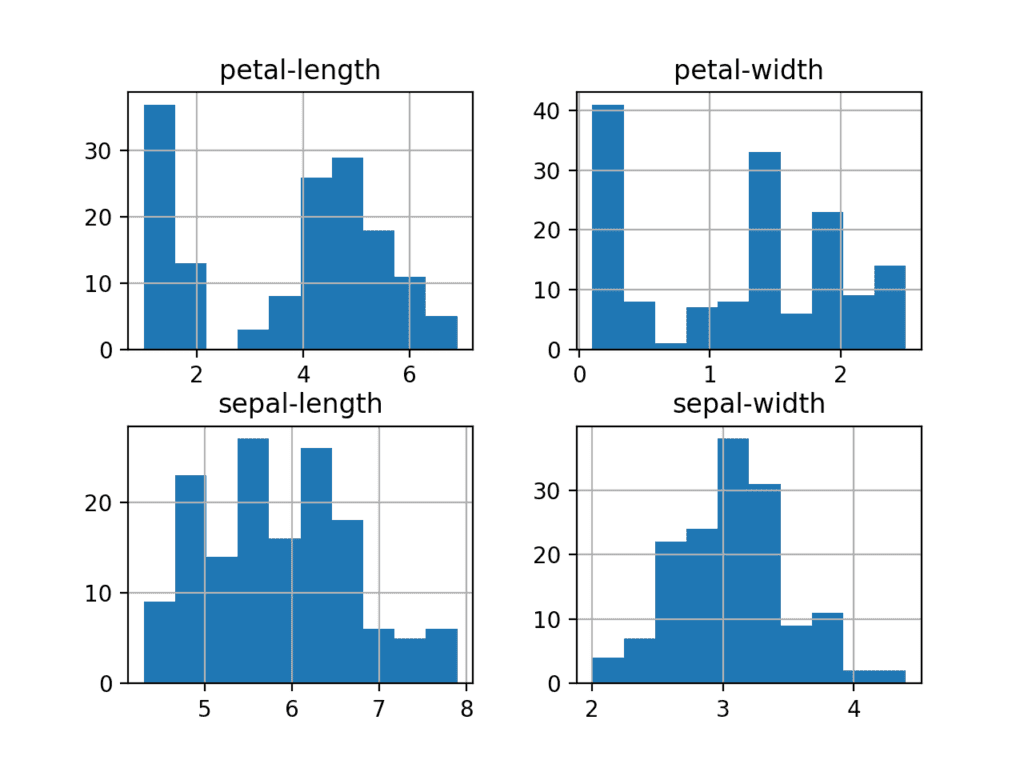
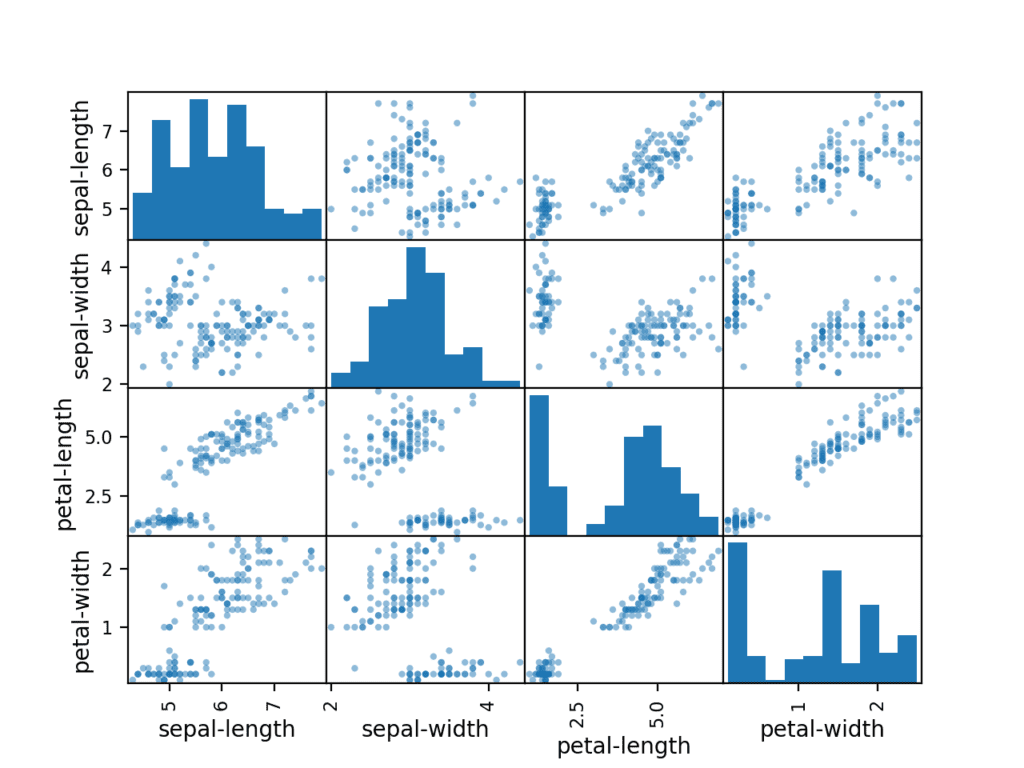
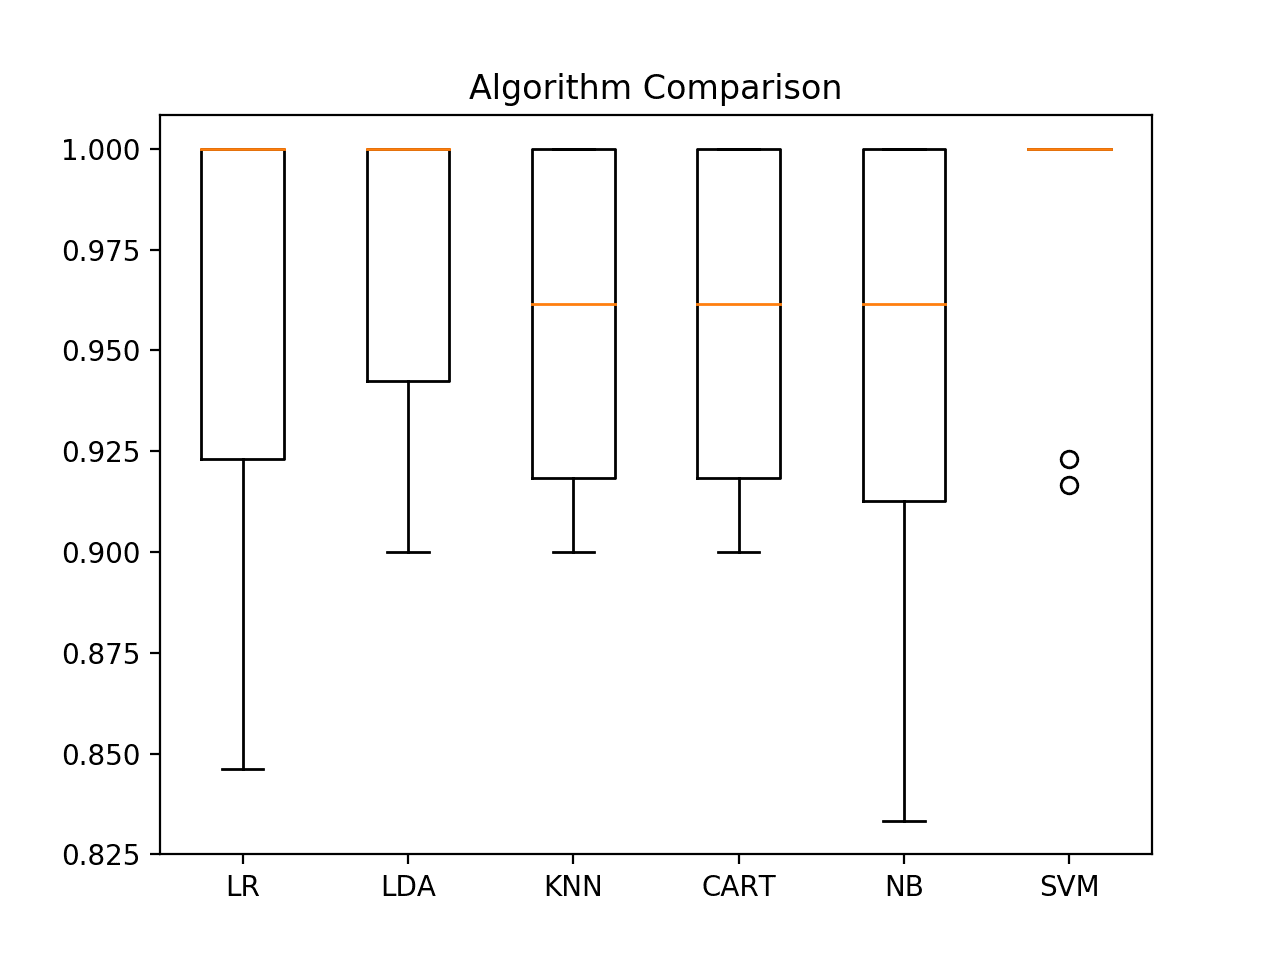


Awesome… But in your Blog please introduce SOM ( Self Organizing maps) for unsupervised methods and also add printing parameters ( Coefficients )code.
I generally don’t cover unsupervised methods like clustering and projection methods.
This is because I mainly focus on and teach predictive modeling (e.g. classification and regression) and I just don’t find unsupervised methods that useful.
Jason,
Can you elaborate what you don’t find unsupervised methods useful?
Because my focus is predictive modeling.
DeprecationWarning: the imp module is deprecated in favour of importlib; see the module’s documentation for alternative uses
what is the error?
You can ignore this warning for now.
Can you please help, where i’m doing mistake???
# Spot Check Algorithms
models = []
models.append((‘LR’, LogisticRegression(solver=’liblinear’, multi_class=’ovr’)))
models.append((‘LDA’, LinearDiscriminantAnalysis()))
models.append((‘KNN’, KNeighborsClassifier()))
models.append((‘CART’, DecisionTreeClassifier()))
models.append((‘NB’, GaussianNB()))
models.append((‘SVM’, SVC(gamma=’auto’)))
# evaluate each model in turn
results = []
names = []
for name, model in models:
kfold = model_selection.KFold(n_splits=10, random_state=seed)
cv_results = model_selection.cross_val_score(model, X_train, Y_train, cv=kfold, scoring=scoring)
results.append(cv_results)
names.append(name)
msg = “%s: %f (%f)” % (name, cv_results.mean(), cv_results.std())
print(msg)
ValueError Traceback (most recent call last)
in
13 for name, model in models:
14 kfold = model_selection.KFold(n_splits=10, random_state=seed)
—> 15 cv_results = model_selection.cross_val_score(model, X_train, Y_train, cv=kfold, scoring=scoring)
~\Anaconda3\lib\site-packages\sklearn\model_selection\_validation.py in cross_val_score(estimator, X, y, groups, scoring, cv, n_jobs, verbose, fit_params, pre_dispatch, error_score)
400 fit_params=fit_params,
401 pre_dispatch=pre_dispatch,
–> 402 error_score=error_score)
403 return cv_results[‘test_score’]
404
~\Anaconda3\lib\site-packages\sklearn\model_selection\_validation.py in cross_validate(estimator, X, y, groups, scoring, cv, n_jobs, verbose, fit_params, pre_dispatch, return_train_score, return_estimator, error_score)
238 return_times=True, return_estimator=return_estimator,
239 error_score=error_score)
–> 240 for train, test in cv.split(X, y, groups))
241
242 zipped_scores = list(zip(*scores))
~\Anaconda3\lib\site-packages\sklearn\externals\joblib\parallel.py in __call__(self, iterable)
915 # remaining jobs.
916 self._iterating = False
–> 917 if self.dispatch_one_batch(iterator):
918 self._iterating = self._original_iterator is not None
919
~\Anaconda3\lib\site-packages\sklearn\externals\joblib\parallel.py in dispatch_one_batch(self, iterator)
757 return False
758 else:
–> 759 self._dispatch(tasks)
760 return True
761
~\Anaconda3\lib\site-packages\sklearn\externals\joblib\parallel.py in _dispatch(self, batch)
714 with self._lock:
715 job_idx = len(self._jobs)
–> 716 job = self._backend.apply_async(batch, callback=cb)
717 # A job can complete so quickly than its callback is
718 # called before we get here, causing self._jobs to
~\Anaconda3\lib\site-packages\sklearn\externals\joblib\_parallel_backends.py in apply_async(self, func, callback)
180 def apply_async(self, func, callback=None):
181 “””Schedule a func to be run”””
–> 182 result = ImmediateResult(func)
183 if callback:
184 callback(result)
~\Anaconda3\lib\site-packages\sklearn\externals\joblib\_parallel_backends.py in __init__(self, batch)
547 # Don’t delay the application, to avoid keeping the input
548 # arguments in memory
–> 549 self.results = batch()
550
551 def get(self):
~\Anaconda3\lib\site-packages\sklearn\externals\joblib\parallel.py in __call__(self)
223 with parallel_backend(self._backend, n_jobs=self._n_jobs):
224 return [func(*args, **kwargs)
–> 225 for func, args, kwargs in self.items]
226
227 def __len__(self):
~\Anaconda3\lib\site-packages\sklearn\externals\joblib\parallel.py in (.0)
223 with parallel_backend(self._backend, n_jobs=self._n_jobs):
224 return [func(*args, **kwargs)
–> 225 for func, args, kwargs in self.items]
226
227 def __len__(self):
~\Anaconda3\lib\site-packages\sklearn\model_selection\_validation.py in _fit_and_score(estimator, X, y, scorer, train, test, verbose, parameters, fit_params, return_train_score, return_parameters, return_n_test_samples, return_times, return_estimator, error_score)
526 estimator.fit(X_train, **fit_params)
527 else:
–> 528 estimator.fit(X_train, y_train, **fit_params)
529
530 except Exception as e:
~\Anaconda3\lib\site-packages\sklearn\linear_model\logistic.py in fit(self, X, y, sample_weight)
1284 X, y = check_X_y(X, y, accept_sparse=’csr’, dtype=_dtype, order=”C”,
1285 accept_large_sparse=solver != ‘liblinear’)
-> 1286 check_classification_targets(y)
1287 self.classes_ = np.unique(y)
1288 n_samples, n_features = X.shape
~\Anaconda3\lib\site-packages\sklearn\utils\multiclass.py in check_classification_targets(y)
169 if y_type not in [‘binary’, ‘multiclass’, ‘multiclass-multioutput’,
170 ‘multilabel-indicator’, ‘multilabel-sequences’]:
–> 171 raise ValueError(“Unknown label type: %r” % y_type)
172
173
ValueError: Unknown label type: ‘continuous’
I have some suggestions here:
https://machinelearningmastery.com/faq/single-faq/can-you-read-review-or-debug-my-code
Thanks jason ur teachings r really helpful more power to u thanks a ton…learning lots of predictive modelling from ur pages!!!
Thank you for your kind words and feedback, Vaisakh!
Jason
Many thanks for this project. It is a very good starting point for me on predictive models. This is what I got. Do you have predictive models on Customer/Product/Market segmentation models?
LR: 0.941667 (0.065085)
LDA: 0.975000 (0.038188)
KNN: 0.958333 (0.041667)
CART: 0.933333 (0.050000)
NB: 0.950000 (0.055277)
SVM: 0.983333 (0.033333)
Hi Princess Leja…You are very welcome! We do not content devoted to that topic.
RandomForestClassifier : 1.0
I got quite different results though i used same seed and splits
Svm : 0.991667 (0.025) with highest accuracy
KNN : 0.9833
CART : 0.9833
Why ?
Im getting error saying
Cannot perform reduce with flexible type
While comparing algos using boxplots
Sorry, I have not seen this error before. Are you able to confirm that your environment is up to date?
I followed your steps and I got the similar result as Aishwarya
SVM: 0.991667 (0.025000)
KNN: 0.983333 (0.033333)
CART: 0.975000 (0.038188)
Interface for smartphones is not user friendly. I can not scroll through the code.
The API may have changed since I wrote this post. This in turn may have resulted in small changes in predictions that are perhaps not statistically significant.
Ive done this on kaggle.
Under ML kernal
http://Www.kaggle.com/aishuvenkat09
Sorry
http://Www.kaggle.com/aishwarya09
Well done!
Hi ,
I have same issues with above our friends discussed
LR: 0.966667 (0.040825)
LDA: 0.975000 (0.038188)
KNN: 0.983333 (0.033333)
CART: 0.983333 (0.033333)
NB: 0.975000 (0.053359)
SVM: 0.991667 (0.025000)
In that svm has more accuracy when comapre to rest
so i go ahead svm
Yes.
Yes. I got the same. Dr. Jason had mentioned that results might vary.
I also have the same result.
LR: 0.966667 (0.040825)
LDA: 0.975000 (0.038188)
KNN: 0.983333 (0.033333)
CART: 0.983333 (0.033333)
NB: 0.975000 (0.053359)
SVM: 0.991667 (0.025000)
Nice.
cv_results = model_selection.cross_val_score(model, X_train, Y_train, cv=kfold, scoring=scoring)
sir i am getting error in this in of code.What should i do?
What error?
File “”, line 1, in
NameError: name ‘model’ is not defined
Looks like you may have missed a few lines of code.
Perhaps try copy-pasting the complete example at the end of each section?
I think cv may be equal to the number of times you want to perform k-fold cross validation for e.g. 10,20etc. and in scoring parameter, you need to mention which type of scoring parameter you want to use for example ‘accuracy’.
Hope this might help….
Correct.
More on how cross validation works here:
https://machinelearningmastery.com/k-fold-cross-validation/
Bro kindly use train_test_split() in the place of model_selection
Try this
cv_results = model_selection.cross_val_score(model, X_train, Y_train, cv=kfold, scoring=None)
It worked for me!
put the kfold = , and cv_results = , part inside the for loop it will work fine.
thank you so much really its very useful
in the last step you are used KNN to make predictions why you are used KNN can we use SVM
and can we make compare with all the models in predictions ?
It is just an example, you can make predictions with any model you wish.
Often we prefer simpler models (like knn) over more complex models (like svm).
Hi Jason
I followed your steps but I’m getting error. What should I do? Best regards
>>> # Spot Check Algorithms
… models = []
>>> models.append((‘LR’, LogisticRegression(solver=’liblinear’, multi_class=’ovr’)))
>>> models.append((‘LDA’, LinearDiscriminantAnalysis()))
>>> models.append((‘KNN’, KNeighborsClassifier()))
>>> models.append((‘CART’, DecisionTreeClassifier()))
>>> models.append((‘NB’, GaussianNB()))
>>> models.append((‘SVM’, SVC(gamma=’auto’)))
>>> # evaluate each model in turn
… results = []
>>> names = []
>>> for name, model in models:
… kfold = StratifiedKFold(n_splits=10, random_state=1, shuffle=True)
File “”, line 2
kfold = StratifiedKFold(n_splits=10, random_state=1, shuffle=True)
^
IndentationError: expected an indented block
>>> cv_results = cross_val_score(model, X_train, Y_train, cv=kfold, scoring=’accuracy’)
Traceback (most recent call last):
File “”, line 1, in
NameError: name ‘model’ is not defined
>>> results.append(cv_results)
Traceback (most recent call last):
File “”, line 1, in
NameError: name ‘cv_results’ is not defined
Sorry to hear that.
Try to copy the complete example at the end of the section into a text file and preserve white space:
https://machinelearningmastery.com/faq/single-faq/how-do-i-copy-code-from-a-tutorial
It’s Ok now. I didnt know python is sensible to TAB. It’s wonderfull. Thanks Thanks
You’re welcome.
Could you elaborate a bit more about the difference between prediction and projection?
For example I got a data set that I collected throughout a year, and I would like to predict/project what will happen next year.
Good question, you find a model that performs well on your available data, fit a final model and use it to predict on new data.
It sounds like perhaps your data is a time series, if so perhaps this would be a good place to start:
https://machinelearningmastery.com/start-here/#timeseries
sir i want to work on crop prices data for crop price pridiction project for my minor project but the crop price data does not find plese help me sir and send me crop price csv file link
Perhaps this will help:
https://machinelearningmastery.com/faq/single-faq/where-can-i-get-a-dataset-on-___
Hello Jason,
Thank you for this amazing tutorial, it helped me to gain confidence:
Please see my results:
LR: 0.941667 (0.065085)
LDA: 0.975000 (0.038188)
KNN: 0.958333 (0.041667)
NB: 0.950000 (0.055277)
SVM: 0.983333 (0.033333)
predictions: [‘Iris-setosa’ ‘Iris-versicolor’ ‘Iris-versicolor’ ‘Iris-setosa’
‘Iris-virginica’ ‘Iris-versicolor’ ‘Iris-virginica’ ‘Iris-setosa’
‘Iris-setosa’ ‘Iris-virginica’ ‘Iris-versicolor’ ‘Iris-setosa’
‘Iris-virginica’ ‘Iris-versicolor’ ‘Iris-versicolor’ ‘Iris-setosa’
‘Iris-versicolor’ ‘Iris-versicolor’ ‘Iris-setosa’ ‘Iris-setosa’
‘Iris-versicolor’ ‘Iris-versicolor’ ‘Iris-virginica’ ‘Iris-setosa’
‘Iris-virginica’ ‘Iris-versicolor’ ‘Iris-setosa’ ‘Iris-setosa’
‘Iris-versicolor’ ‘Iris-virginica’]
0.9666666666666667
[[11 0 0]
[ 0 12 1]
[ 0 0 6]]
precision recall f1-score support
Iris-setosa 1.00 1.00 1.00 11
Iris-versicolor 1.00 0.92 0.96 13
Iris-virginica 0.86 1.00 0.92 6
accuracy 0.97 30
macro avg 0.95 0.97 0.96 30
weighted avg 0.97 0.97 0.97 30
You’re welcome!
Well done!
The program runs through, but the calculated result is that CART and SVM have the highest accuracy
LR: 0.966667 (0.040825)
LDA: 0.975000 (0.053359)
KNN: 0.983333 (0.050000)
CART: 0.991667 (0.025000)
NB: 0.975000 (0.038188)
SVM: 0.991667 (0.025000)
Nice work. Thanks.
I have installed all libraries that were in your How to Setup Python environment… blog. All went fine but when i run the starting imports code I get error at first line “ModuleNotFoundError: No module named ‘pandas'”. But I did installl it using “pip install pandas” command. I am working on a windows machine.
Sorry to hear that. Consider rebooting your machine?
I had the same problem initially, because I made 2 python files.. one for loading the libraries, and another for loading the iris dataset.
Then I decided to put the two commands in one python file, it solved problem. 🙂
Yes, all commands go in the one file. Sorry for the confusion.
Hasnain, try setting the environment variable PYTHON_PATH and PATH to include the path to the site packages of the version of python you have permission to alter
export PYTHONPATH=”$PYTHONPATH:/path/to/Python/2.7/site-packages/”
export PATH=”$PATH:/path/to/Python/2.7/site-packages/”
obviously replacing “/path/to” with the actual path. My system Python is in my /Users//Library folder but I’m on a Mac.
You can add the export lines to a script that runs when you open a terminal (“~/.bash_profile” if you use BASH).
That might not be 100% right, but it should help you on your way.
Thanks for posting the tip Dan, I hope it helps.
got it to work have no idea how but it worked! I am like the kid at t-ball that closes his eyes and takes a swing!
I’m glad to hear that!
I am starting at square 0, and after clearing a first few hurdles, I was not even able to install the libraries at all… (as a newb), I didn’t see where I even GO to import this:
# Load libraries
import pandas
from pandas.tools.plotting import scatter_matrix
import matplotlib.pyplot as plt
from sklearn import model_selection
from sklearn.metrics import classification_report
from sklearn.metrics import confusion_matrix
from sklearn.metrics import accuracy_score
from sklearn.linear_model import LogisticRegression
from sklearn.tree import DecisionTreeClassifier
from sklearn.neighbors import KNeighborsClassifier
from sklearn.discriminant_analysis import LinearDiscriminantAnalysis
from sklearn.naive_bayes import GaussianNB
from sklearn.svm import SVC
Perhaps this step-by-step tutorial will help you set up your environment:
https://machinelearningmastery.com/setup-python-environment-machine-learning-deep-learning-anaconda/
if u r using python 3
save all the commands as a py file
then in a pythin shell enter
exec(open(“[path to file with name]”).read())
if u open shell in the same path as the saved thing
then u only need to enter the filename alone
ex:
lets say i saved it as load.py
then
exec(open(“load.py”).read())
this will execute all commands in the current shell
Hi Tanya,
This tutorial is so intuitive that I went through this tutorial with a breeze.
Install PyCharm from JetBrains available here https://www.jetbrains.com/pycharm/download/download-thanks.html?platform=windows&code=PCC
Install PIP (The de-facto python package manager) and then click “Terminal” in PyCharm to bring up the interactive DOS like terminal. Once you have installed PIP then there you can issue the following commands:
pip install numpy
pip install scipy
pip install matplotlib
pip install pandas
pip install sklearn
All other steps in the tutorial are valid and do not need a single line of change apart from where its mentioned
from pandas.tools.plotting import scatter_matrix , change it to
from pandas.plotting import scatter_matrix
Thanks for the tips Rahul.
For a beginner i believe Anacondas Jupyter notebooks would be the best option. As they can include markdown for future reference which is essential as beginner (backpropogation :p). But again varies person to person
I find notebooks confuse beginners more than help.
Running a Python script on the command line is so much simpler.
Except for me, on Debian Stretch with pandas 0.19.2, I had to use
from pandas.tools.plotting import scatter_matrix
You must update your version of Pandas.
use jupyter notebook …there all the essential libraries are preinstalled
I also did a similar mistake, I am also a newbie to python, and wrote those import statements in the separate file, and imported the created file, without knowing how imports work…after your reply realized my mistake and now back on track thanks!
I also had problems installing modules on windows. Although, there was no error of any kind if installed from PyCharm IDE.
Also, use 32-bit python interpreter if you wanna use NLTK. It can be done even on 64-bit version, but was not worth the time it would it need.
If you are working on virtual environment then you have to make script first and run it by activating the virtual environment,
If you are not working on virtual environment then run your scripts on time
Could you please go into the mathematical concept behind KNN and why the accuracy resulted in the highest score? Thank you
I like your tutorial for the machine learning in python but at this moment I am stuck. Here is where I am
# Compare Algorithms
fig = plt.figure()
fig.suptitle(‘Algorithm Comparison’)
ax = fig.add_subplot(111)
plt.boxplot(results)
ax.set_xticklabels(names)
plt.show()
This is the answer I am getting from it
TypeError Traceback (most recent call last)
in ()
3 fig.suptitle(‘Algorithm Comparison’)
4 ax = fig.add_subplot(111)
—-> 5 plt.boxplot(results)
6 ax.set_xticklabels(names)
7 plt.show()
~\Anaconda3\lib\site-packages\matplotlib\pyplot.py in boxplot(x, notch, sym, vert, whis, positions, widths, patch_artist, bootstrap, usermedians, conf_intervals, meanline, showmeans, showcaps, showbox, showfliers, boxprops, labels, flierprops, medianprops, meanprops, capprops, whiskerprops, manage_xticks, autorange, zorder, hold, data)
2846 whiskerprops=whiskerprops,
2847 manage_xticks=manage_xticks, autorange=autorange,
-> 2848 zorder=zorder, data=data)
2849 finally:
2850 ax._hold = washold
~\Anaconda3\lib\site-packages\matplotlib\__init__.py in inner(ax, *args, **kwargs)
1853 “the Matplotlib list!)” % (label_namer, func.__name__),
1854 RuntimeWarning, stacklevel=2)
-> 1855 return func(ax, *args, **kwargs)
1856
1857 inner.__doc__ = _add_data_doc(inner.__doc__,
~\Anaconda3\lib\site-packages\matplotlib\axes\_axes.py in boxplot(self, x, notch, sym, vert, whis, positions, widths, patch_artist, bootstrap, usermedians, conf_intervals, meanline, showmeans, showcaps, showbox, showfliers, boxprops, labels, flierprops, medianprops, meanprops, capprops, whiskerprops, manage_xticks, autorange, zorder)
3555
3556 bxpstats = cbook.boxplot_stats(x, whis=whis, bootstrap=bootstrap,
-> 3557 labels=labels, autorange=autorange)
3558 if notch is None:
3559 notch = rcParams[‘boxplot.notch’]
~\Anaconda3\lib\site-packages\matplotlib\cbook\__init__.py in boxplot_stats(X, whis, bootstrap, labels, autorange)
1839
1840 # arithmetic mean
-> 1841 stats[‘mean’] = np.mean(x)
1842
1843 # medians and quartiles
~\Anaconda3\lib\site-packages\numpy\core\fromnumeric.py in mean(a, axis, dtype, out, keepdims)
2955
2956 return _methods._mean(a, axis=axis, dtype=dtype,
-> 2957 out=out, **kwargs)
2958
2959
~\Anaconda3\lib\site-packages\numpy\core\_methods.py in _mean(a, axis, dtype, out, keepdims)
68 is_float16_result = True
69
—> 70 ret = umr_sum(arr, axis, dtype, out, keepdims)
71 if isinstance(ret, mu.ndarray):
72 ret = um.true_divide(
TypeError: cannot perform reduce with flexible type
HOW CAN I FIX THIS?
Perhaps post your code and error to stackoverflow.com?
Jason nice work.but I had some doubt about that Species column, in that we should predict t test for continuous and catagorical variable only 2 group..in this column there having 3 groups so how we predict t test.please give me answer
The Student’s t-test is for numerical data only, you can learn more here:
https://machinelearningmastery.com/parametric-statistical-significance-tests-in-python/
I also got a traceback on this section:
TypeError: cannot perform reduce with flexible type
Quick check on stackoverflow show’s that plt.boxplot() cannot accept strings. Personally, I had an error in section 5.4 line 15.
Wrong code: results.append(results)
Coorect: resilts.append(cv_results)
woohoo for tracebacks and wrong data-types. Hope someone finds this helpful.
Are you able to confirm that your python libraries are up to date?
Well done
Thank you sir!
Nice work Jason. Of course there is a lot more to tell about the code and the Models applied if this is intended for people starting out with ML (like me). Rather than telling which “button to press” to make work, it would be nice to know why also. I looked at a sample of you book (advanced) if you are covering the why also, but it looks like it’s limited?
On this particular example, in my case SVM reached 99.2% and was thus the best Model. I gather this is because the test and training sets are drawn randomly from the data.
This tutorial and the book are laser focused on how to use Python to complete machine learning projects.
They already assume you know how the algorithms work.
If you are looking for background on machine learning algorithms, take a look at this book:
https://machinelearningmastery.com/master-machine-learning-algorithms/
Jan de Lange and Jason,
Before anything else, I truly like to thank Jason for this wonderful, concise and practical guideline on using ML for solving a predictive problem.
In terms of the example you have provided, I can confirm ‘Jan de Lange’ ‘s outcome. I’ve got the same accuracy result for SVM (0.991667 to be precise). I’ve just upgraded the Canopy version I had installed on my machine to version 2.1.3.3542 (64 bit) and your reasoning makes sense that this discrepancy could be because of its random selection of data. But this procedure could open up a new ‘can of warm’ as some say. since the selection of best model is on the line.
Thank you again Jason for this practical article on ML.
Thanks Alan.
Absolutely. Machine learning algorithms are stochastic. This is a feature, not a bug. It helps us move through the landscape of possible models efficiently.
See this post:
https://machinelearningmastery.com/randomness-in-machine-learning/
And this post on finalizing a model:
https://machinelearningmastery.com/train-final-machine-learning-model/
Does that help?
Got it working too, changing the scatter_matrix import like Rahul did.
But I also had to install tkinter first (yum install tkinter).
Very nice tutorial, Jason!
Glad to hear it!
Awesome, I have tested the code it is impressive. But how could I use the model to predict if it is Iris-setosa or Iris-versicolor or Iris-virginica when I am given some values representing sepal-length, sepal-width, petal-length and petal-width attributes?
Great question. You can call model.predict() with some new data.
For an example, see Part 6 in the above post.
Dear Jason Brownlee, I was thinking about the same question of Nil. To be precise I was wondering how can I know, after having seen that my model has a good fit, which values of sepal-length, sepal-width, petal-length and petal-width corresponds to Iris-setosa eccc..
For instance, if I have p predictors and two classes, how can I know which values of the predictors blend to one class or the other. Knowing the value of predictors allows me to use the model in the daily operativity. Thx
Not knowing the statistical relationship between inputs and outputs is one of the down sides of using neural networks.
Hi Mr Jason Brownlee, thks for your answer. So all algorithms, such as SVM, LDA, random forest.. have this drawbacks? Can you suggest me something else?
Because logistic regression is not like this, or am I wrong?
All algorithms have limitations and assumptions. For example, Logistic Regression makes assumptions about the distribution of variates (Gaussian) and more:
https://en.wikipedia.org/wiki/Logistic_regression
Nevertheless, we can make useful models (skillful) even when breaking assumptions or pushing past limitations.
Dear Sir,
It seems I’m in the right place in right time! I’m doing my master thesis in machine learning from Stockholm University. Could you give me some references for laughter audio conversation to CSV file? You can send me anything on sujon2100@gmail.com. Thanks a lot and wish your very best and will keep in touch.
Sorry I mean laughter audio to CSV conversion.
Sorry, I have not seen any laughter audio to CSV conversion tools/techniques.
Hi again, do you have any publication of this article “Your First Machine Learning Project in Python Step-By-Step”? Or any citation if you know? Thanks.
No, you can reference the blog post directly.
Sweet way of condensing monstrous amount of information in a one-way street. Thanks!
Just a small thing, you are creating the Kfold inside the loop in the cross validation. Then, you use the same seed to keep the comparison across predictors constant.
That works, but I think it would be better to take it out of the loop. Not only is more efficient, but it is also much immediately clearer that all predictors are using the same Kfold.
You can still justify the use of the seeds in terms of replicability; readers getting the same results on their machines.
Thanks again!
Great suggestion, thanks Roberto.
Hello Jaso.
Thank you so much for your help with Machine Learning and congratulations for your excellent website.
I am a beginner in ML and DeepLearning. Should I download Python 2 or Python 3?
Thank you very much.
Francisco
I use Python 2 for all my work, but my students report that most of my examples work in Python 3 with little change.
Jason,
Thank you so much for putting this together. I am been a software developer for almost two decades and am getting interested in machine learning. Found this tutorial accurate, easy to follow and very informative.
Thanks ShawnJ, I’m glad you found it useful.
Jason,
Thanks for the great post! I am trying to follow this post by using my own dataset, but I keep getting this error “Unknown label type: array ([some numbers from my dataset])”. So what’s the problem on earth, any possible solutions?
Thanks,
Hi Wendy,
Carefully check your data. Maybe print it on the screen and inspect it. You may have some string values that you may need to convert to numbers using data preparation.
hi thanks for great tutorial, i’m also new to ML…this really helps but i was wondering what if we have non-numeric values? i have mixture of numeric and non-numeric data and obviously this only works for numeric. do you also have a tutorial for that or would you please send me a source for it? thank you
Great question fara.
We need to convert everything to numeric. For categorical values, you can convert them to integers (label encoding) and then to new binary features (one hot encoding).
after I post my comment here i saw this: “DictVectorizer ” i think i can use it for converting non-numeric to numeric, right?
I would recommend the LabelEncoder class followed by the OneHotEncoder class in scikit-learn.
I believe I have tutorials on these here:
https://machinelearningmastery.com/data-preparation-gradient-boosting-xgboost-python/
thank you it’s great
Hello Jason
Thank you for publishing this great machine learning tutorial.
It is really awesome awesome awesome………..!
I test your tutorial on python-3 and it works well but what I face here is to load my data set from my local drive. I followed your give instructions but couldn’t be successful.
My syntax is as under:
import unicodedata
url = open(r’C:\Users\mazhar\Anaconda3\Lib\site-packages\sindhi2.csv’, encoding=’utf-8′).readlines()
names = [‘class’, ‘sno’, ‘gender’, ‘morphology’, ‘stem’,’fword’]
dataset = pandas.read_csv(url, names=names)
python-3 jupyter notebook does not loads this. Kindly help me in regard.
Hi Mazhar, thanks.
Are you able to load the file on the command line away from the notebook?
Perhaps the notebook environment is causing trouble?
Mazhar try this:
import pandas as pd
.
.
.
file= \”namefile.csv\” #or c:/____/___/
df = pd.read_csv(file)
in Jupyter
https://www.anaconda.com/download/
https://anaconda.org/anaconda/python
Dear Jason
Thank you for response
I am using Python 3 with anaconda jupyter notebook
so which python version you would like to suggest me and kindly write here syntax of opening local dataset file from local drive that how can I load utf-8 dataset file from my local drive.
Hi Mazhar, I teach using Python 2.7 with examples from the command line.
Many of my students report that the code works in Python 3 and in notebooks with little or no changes.
try with this command:
df = pd.read_csv(file, encoding=’latin-1′) #if you are working with csv “,” or “;” put sep=’|’,
nice tutorial
Great tutorial but perhaps I’m missing something here. Let’s assume I already know what model to use (perhaps because I know the data well… for example).
knn = KNeighborsClassifier()
knn.fit(X_train, Y_train)
I then use the models to predict:
print(knn.predict(an array of variables of a record I want to classify))
Is this where the whole ML happens?
knn.fit(X_train, Y_train)
What’s the difference between this and say a non ML model/algorithm? Is it that in a non ML model I have to find the coefficients/parameters myself by statistical methods?; and in the ML model the machine does that itself?
If this is the case then to me it seems that a researcher/coder did most of the work for me and wrap it in a nice function. Am I missing something? What is special here?
Hi Andy,
Yes, your comment is generally true.
The work is in the library and choice of good libraries and training on how to use them well on your project can take you a very long way very quickly.
Stats is really about small data and understanding the domain (descriptive models). Machine learning, at least in common practice, is leaning towards automation with larger datasets and making predictions (predictive modeling) at the expense of model interpretation/understandability. Prediction performance trumps traditional goals of stats.
Because of the automation, the focus shifts more toward data quality, problem framing, feature engineering, automatic algorithm tuning and ensemble methods (combining predictive models), with the algorithms themselves taking more of a backseat role.
Does that make sense?
It does make sense.
You mentioned ‘data quality’. That’s currently my field of work. I’ve been doing this statistically until now, and very keen to try a different approach. As a practical example how would you use ML to spot an error/outlier using ML instead of stats?
Let’s say I have a large dataset containing trees: each tree record contains a specie, height, location, crown size, age, etc… (ah! suspiciously similar to the iris flowers dataset 🙂 Is ML a viable method for finding incorrect data and replace with an “estimated” value? The answer I guess is yes. For species I could use almost an identical method to what you presented here; BUT what about continuous values such as tree height?
Hi Andy,
Maybe “outliers” are instances that cannot be easily predicted or assigned ambiguous predicted probabilities.
Instance values can be “fixed” by estimating new values, but whole instance can also be pulled out if data is cheap.
Awesome work Jason. This was very helpful and expect more tutorials in the future.
Thanks.
I’m glad you found it useful Shailendra.
Thank you for the good work you doing over here.
i want to know how electricity appliance consumption dataset is captured
Thanks, I’m glad it helped.
If you are referring to the time series examples, you can learn more about the dataset here:
https://archive.ics.uci.edu/ml/datasets/individual+household+electric+power+consumption
Awesome work. Students need to know how the end results will look like. They need to get motivated to learn and one of the effective means of getting motivated is to be able to see and experience the wonderful end results. Honestly, if i were made to study algorithms and understand them i would get bored. But now since i know what amazing results they give, they will serve as driving forces in me to get into details of it and do more research on it. This is where i hate the orthodox college ways of teaching. First get the theory right then apply. No way. I need to see things first to get motivated.
Thanks Shuvam,
I’m glad my results-first approach gels with you. It’s great to have you here.
Thanks Jason,
while i am trying to complete this.
# Spot Check Algorithms
models = []
models.append((‘LR’, LogisticRegression()))
models.append((‘LDA’, LinearDiscriminantAnalysis()))
models.append((‘KNN’, KNeighborsClassifier()))
models.append((‘CART’, DecisionTreeClassifier()))
models.append((‘NB’, GaussianNB()))
models.append((‘SVM’, SVC()))
# evaluate each model in turn
results = []
names = []
for name, model in models:
kfold = cross_validation.KFold(n=num_instances, n_folds=num_folds, random_state=seed)
cv_results = cross_validation.cross_val_score(model, X_train, Y_train, cv=kfold, scoring=scoring)
results.append(cv_results)
names.append(name)
msg = “%s: %f (%f)” % (name, cv_results.mean(), cv_results.std())
print(msg)
showing below error.-
kfold = cross_validation.KFold(n=num_instances, n_folds=num_folds, random_state=seed)
^
IndentationError: expected an indented block-
Hi Puneet, looks like a copy-paste error.
Check for any extra new lines or white space around that line that is reporting the error.
https://stackoverflow.com/questions/4446366/why-am-i-getting-indentationerror-expected-an-indented-block
This solved it for me. Copy code to notepad, replace all tabs with 4 spaces.
Nice work.
Putting in an extra space or leaving one out where it is needed will surely generate an error message . Some common causes of this error include:
Forgetting to indent the statements within a compound statement
Forgetting to indent the statements of a user-defined function.
The error message IndentationError: expected an indented block would seem to indicate that you have an indentation error. It is probably caused by a mix of tabs and spaces. The indentation can be any consistent white space . It is recommended to use 4 spaces for indentation in Python, tabulation or a different number of spaces may work, but it is also known to cause trouble at times. Tabs are a bad idea because they may create different amount if spacing in different editors .
http://net-informations.com/python/err/indentation.htm
Great advice
Here’s help for copy-pasting code:
https://machinelearningmastery.com/faq/single-faq/how-do-i-copy-code-from-a-tutorial
Thanks Json,
I am new to ML. need your help so i can run this.
as i have followed the steps but when trying to build and evalute 5 model using this.
—————————————-
# Spot Check Algorithms
models = []
models.append((‘LR’, LogisticRegression()))
models.append((‘LDA’, LinearDiscriminantAnalysis()))
models.append((‘KNN’, KNeighborsClassifier()))
models.append((‘CART’, DecisionTreeClassifier()))
models.append((‘NB’, GaussianNB()))
models.append((‘SVM’, SVC()))
# evaluate each model in turn
results = []
names = []
for name, model in models:
kfold = cross_validation.KFold(n=num_instances, n_folds=num_folds, random_state=seed)
cv_results = cross_validation.cross_val_score(model, X_train, Y_train, cv=kfold, scoring=scoring)
results.append(cv_results)
names.append(name)
msg = “%s: %f (%f)” % (name, cv_results.mean(), cv_results.std())
print(msg)
————————————————————————————————
facing below mentioned issue.
File “”, line 13
kfold = cross_validation.KFold(n=num_instances, n_folds=num_folds, random_state=seed)
^
IndentationError: expected an indented block
—————————————
Kindly help.
Puneet, you need to indent the block (tab or four spaces to the right). That is the way of building a block in Python
I am also having this problem, I have indented the code as instructed but nothing executes. It seems to be waiting for more input. I have googled different script endings but nothing happens. Is there something I am missing to execute this script?
>>> for name, model in models:
… kfold = model_selection.KFold(n_splits=10, random_state=seed)
… cv_results = model_selection.cross_val_score(model, X_train, Y_train, cv=kfold, scoring=scoring)
… results.append(cv_results)
… names.append(name)
… msg = “%s: %f (%f)” % (name, cv_results.mean(), cv_results.std())
… print(msg)
…
Save the code to a file and run it from the command line. I show how here:
https://machinelearningmastery.com/faq/single-faq/how-do-i-run-a-script-from-the-command-line
just another Python noob here,sending many regards and thanks to Jason :):)
Thanks george, stick with it!
Does this tutorial work with other data sets? I’m trying to work on a small assignment and I want to use python
It should provide a great template for new projects sergio.
I tried to use another dataset. I am not sure what I imported, but even after changing the names, I still get the petal stuff as output. All of it. I commented out that part of the code and even then it gives me those old outputs.
Very Awesome step by step for me ! Even I am beginner of python , this gave me many things about Machine learning ~ supervised ML. Appreciate of your sharing !!
I’m glad to hear that Albert.
Thank you for the step by step instructions. This will go along way for newbies like me getting started with machine learning.
You’re welcome, I’m glad you found the post useful Umar.
Hello Jason,
from __future__ import division
models = []
models.append((‘LR’, LogisticRegression(solver=’liblinear’, multi_class=’ovr’)))
models.append((‘LDA’, LinearDiscriminantAnalysis()))
models.append((‘KNN’, KNeighborsClassifier()))
models.append((‘CART’, DecisionTreeClassifier()))
models.append((‘NB’, GaussianNB()))
models.append((‘SVM’, SVC(gamma=’auto’)))
# evaluate each model in turn
results = []
names = []
for name, model in models:
kfold = model_selection.KFold(n_splits=10, random_state=seed)
cv_results = model_selection.cross_val_score(model, X_train, y_train, cv=kfold, scoring=scoring)
results.append(cv_results)
names.append(name)
msg = “%s: %f (%f)” % (name, cv_results.mean(), cv_results.std())
print(msg)
I am getting erroe of ” ZeroDivisionError: float division by zero”
Sorry to hear that, I have some suggestions here:
https://machinelearningmastery.com/faq/single-faq/why-does-the-code-in-the-tutorial-not-work-for-me
Hi Jason,
Really nice tutorial. I had one question which has had me confused. Once you chose your best model, (in this instance KNN) you then train a new model to be used to make predictions against the validation set. should one not perform K-fold cross-validation on this model to ensure we don’t overfit?
if this is correct how would you implement this, from my understanding cross_val_score will not allow one to generate a confusion matrix.
I think this is the only thing that I have struggled with in using scikit learn if you could help me it would be much appreciated?
Hi Mike. No.
Cross-validation is just a method to estimate the skill of a model on new data. Once you have the estimate you can get on with things, like confirming you have not fooled yourself (hold out validation dataset) or make predictions on new data.
The skill you report is the cross val skill with the mean and stdev to give some idea of confidence or spread.
Does that make sense?
Hi Jason,
Thanks for the quick response. So to make sure I understand, one would use cross validation to get a estimate of the skill of a model (mean of cross val scores) or chose the correct hyper parameters for a particular model.
Once you have this information you can just go ahead and train the chosen model with the full training set and test it against the validation set or new data?
Hi Mike. Correct.
Additionally, if the validation result confirms your expectations, you can go ahead and train the model on all data you have including the validation dataset and then start using it in production.
This is a very important topic. I think I’ll write a post about it.
This is amazing 🙂 You boosted my morale
I’m so glad to hear that Sahana.
Hi
while doing data visualization and running commands dataset.plot(……..) i am having the following error.kindly tell me how to fix it
array([[,
],
[,
]], dtype=object)
Looks like no data Jhon. It also looks like it’s printing out an object.
Are you running in a notebook or on the command line? The code was intended to be run directly (e.g. command line).
Hi Jason,
Great tutorial. I am a developer with a computer science degree and a heavy interest in machine learning and mathematics, although I don’t quite have the academic background for the latter except for what was required in college. So, this website has really sparked my interest as it has allowed me to learn the field in sort of the “opposite direction”.
I did notice when executing your code that there was a deprecation warning for the sklearn.cross_validation module. They recommend switching to sklearn.model_selection.
When switching the modules I adjusted the following line…
kfold = cross_validation.KFold(n=num_instances, n_folds=num_folds, random_state=seed)
to…
kfold = model_selection.KFold(n_folds=num_folds, random_state=seed)
… and it appears to be working okay. Of course, I had switched all other instances of cross_validation as well, but it seemed to be that the KFold() method dropped the n (number of instances) parameter, which caused a runtime error. Also, I dropped the num_instances variable.
I could have missed something here, so please let me know if this is not a valid replacement, but thought I’d share!
Once again, great website!
Thanks for the support and the kind words Brendon. I really appreciate it (you made my day!)
Yes, the API has changed/is changing and your updates to the tutorial look good to me, except I think n_folds has become n_splits.
I will update this example for the new API very soon.
🙂 Now on to more tutorials for me!
You can access more here Brendon:
https://machinelearningmastery.com/start-here/
Jason, is everything on your website on that page? or is there another site map?
thanks!
P.S. your code ran flawlessly on my Jupyter Notebook fwiw. Although I did get a different result with SVM coming out on top with 99.1667. So I ran the validation set with SVM and came out with 94 93 93 30 fwiw.
No, not everything, just a small and useful sample.
Yes, machine learning algorithms are stochastic, learn more here:
https://machinelearningmastery.com/randomness-in-machine-learning/
Thanks. I actually just read that article. Very helpful.
I’m still having a little trouble understanding step 5.1. I’m trying to apply this tutorial to a new data set but, when I try to evaluate the models from 5.3 I don’t get a result.
What is the problem exactly Sergio?
Step 5.1 should create a validation dataset. You can confirm the dataset by printing it out.
Step 5.3 should print the result of each algorithm as it is trained and evaluated.
Perhaps check for a copy-paste error or something?
Does this tutorial work the exact same way for other data sets? because I’m not using the Hello World dataset
The project template is quite transferable.
You will need to adapt it for your data and for the types of algorithms you want to test.
Hi Sir,
Thank you for the information.
I am currently a student, in Engineering school in France.
I am working on date mining project, indeed, I have a many date ( 40Go ) about the price of the stocks of many companies in the CAC40.
My goal is to predict the evolution of the yields and I think that Neural Network could be useful.
My idea is : I take for X the yields from “t=0” to “t=n” and for Y the yields from “t=1 to t=n” and the program should find a relation between the data.
Is that possible ? Is it a good way in order to predict the evolution of the yield ?
Thank you for your time
Hubert
Jean-Baptiste
Hi Jean-Baptiste, I’m not an expert in finance. I don’t know if this is reasonable, sorry.
This post might help with phrasing your time series problem for supervised learning:
https://machinelearningmastery.com/time-series-forecasting-supervised-learning/
Hi Jason,
If I include an new item in the models array as:
models.append((‘LNR – Linear Regression’, LinearRegression()))
with the library:
from sklearn.linear_model import LinearRegression
I got an error in the \sklearn\utils\validation.py”, line 529, in check_X_y
y = y.astype(np.float64)
as:
ValueError: could not convert string to float: ‘Iris-setosa’
Let me know best to fix that! As you can see from my code, I would like to include the Linear Regression algorithms in my array model too!
Thank you for your help,
Ernest
Hi Ernest, it is a classification problem. We cannot use LinearRegression.
Try adding another classification algorithm to the list.
Hi Jason,
I am new to ML. need your help so i can run this.
>>> from matplotlib import pyplot
Traceback (most recent call last):
File “”, line 1, in
File “c:\python27\lib\site-packages\matplotlib\pyplot.py”, line 29, in
import matplotlib.colorbar
File “c:\python27\lib\site-packages\matplotlib\colorbar.py”, line 32, in
import matplotlib.artist as martist
File “c:\python27\lib\site-packages\matplotlib\artist.py”, line 16, in
from .path import Path
File “c:\python27\lib\site-packages\matplotlib\path.py”, line 25, in
from . import _path, rcParams
‘ImportError: DLL load failed: %1 n\x92est pas une application Win32 valide.\n’
Sorry, I have not seen that error before. Perhaps this post will help you setup your environment:
https://machinelearningmastery.com/setup-python-environment-machine-learning-deep-learning-anaconda/
hello oumaima,
i am also facing the same error? were you able to solve your error? how? please help!
Great tutorial! Quick question, for the when we create the models, we do models.append(name of algorithm, alogrithm function), is models an array? Because it seems like a dictionary since we have a key-value mapping (algorithm name, and algorithm function). Thank you!
It is a list of tuples where each tuple contains a string name and a model object.
Hi Jason /any Gurus ,
Good post and will follow it but my question may be little off track.
Asking this question as i am a data modeller /aspiring data architect.
I i feel as Guru/Gurus you can clarify my doubt. The question is at the end .
In current Data management environment
1. Data architecture /Physical implementation and choosing appropriate tools,back end,storage,no sql, SQL, MPP, sharding, columnar ,,scale up/out ,distributed processing etc .
2. In addition to DB based procedural languages proficiency at at least one of the following i.e. Java/Python/Scala etc.
3. Then comes this AI,Machine learning ,neural Networks etc .
My question is regarding point 3 .
I believe those are algorithms which needs deep functional knowledge and years of experience to add any value to business .
Those are independent of data models and it’s ,physical implementation and part of Business user domain not data architecture domain .
If i take your above example say now 10k users trying to do the similar kind of thing then points 1 and 2 will be Data architects a domain and point 3 will be business analyst domain . may be point 2 can overlap between them to some extent .
Data Architect need not to be hands on/proficient in algorithms i.e. should have just some basic idea as Data architects job is not to invent business logic but implement the business logic physically to satisfy Business users/Analysts .
Am i correct in my assumption as i find the certain things are nearly mutually exclusive and expectations/benchmarks should be set right?
Regards
sasanka ghosh
Hi Sasanka, sorry, I don’t really follow.
Are you able to simplify your question?
Hi Jason ,
Many thanks that u bothered to reply .
Tried to rephrase and concise but still it is verbose . apologies for that.
Is it expected from a data architect to be algorithm expert as well as data model/database expert?
Algorithms are business centric as well as specific to particular domain of business most of the times.
Giving u an example i.e. SHORTEST PATH ( take it as just an example in making my point)
An organization is providing an app to provide that service .
CAVEAT:Someone may say from comp science dept that it is the basic thing u learn but i feel it is still an algorithm not a data structure .
if we take the above scenario in simplistic term the requirement is as follows
1.there will be say million registered users
2. one can say at least 10 % are using the app same time
3. any time they can change their direction as per contingency like a military op so dumping the partial weighted graph to their device is not an option i.e. users will be connected to main server/server cluster.
4. the challenge is storing the spatial data in DB in correct data model .
scale out ,fault tolerance .
5.implement the shortest path algo and display it using Python/java/Cipher/Oracle spatial/titan etc dynamically.
My question is can a data architect work on this project who does not know the shortest path algorithm but have sufficient knowledge in other areas but the algo with verbose term provided to him/her to implement ?
I m asking this question as now a days people are offering ready made courses etc i.e. machine learning ,NLP,Data scientist etc. and the scenario is confusing
i feel it is misleading as no one can get expert in science overnight and vice versa.
I feel Algorithms are pure science that is a separate discipline .
But to implement it in large scale Scientists/programmers/architects needs to work in tandem with minimal overlapping but continuous discussion.
Last but not the least if i make some sense what is the learning curve should i follow to try to be a data architect in unstructured data in general
regards
sasanka ghosh
Really this depends on the industry and the job. I cannot give you good advice for the general case.
You can get valuable results without being an expert, this applies to most fields.
Algorithms are a tool, use them as such. They can also be a science, but we practitioners don’t have the time.
I hope that helps.
Thanks Jsaon.
I appreciate your time and response .
I just wanted to validate from a real techie/guru like u as the confusion or no perfect answer are being exploited by management/HR to their own advantage and practice use and throw policy or make people sycophants/redundant without following the basic management principle,
The tech guys except ” few geniuses” are always toiling and management is opening the cork, enjoying at the same time .
Regards
sasanka ghosh
Hello Jason,
Thank you very much for these tutorials, i am new to ML and i find it very encouraging to do and end to end project to get started with rather than reading and reading without seeing and end, This really helped me..
One question, when i tried this i got the highest accuracy for SVM.
LR: 0.966667 (0.040825)
LDA: 0.975000 (0.038188)
KNN: 0.983333 (0.033333)
CART: 0.983333 (0.033333)
NB: 0.975000 (0.053359)
SVM: 0.991667 (0.025000)
so i decided to try that out too,,
svm = SVC()
svm.fit(X_train, Y_train)
prediction = svm.predict(X_validation)
these were my results using SVM,
0.933333333333
[[ 7 0 0]
[ 0 10 2]
[ 0 0 11]]
precision recall f1-score support
Iris-setosa 1.00 1.00 1.00 7
Iris-versicolor 1.00 0.83 0.91 12
Iris-virginica 0.85 1.00 0.92 11
avg / total 0.94 0.93 0.93 30
I am still learning to read these results, but can you tell me why this happened? why did i get high accuracy for SVM instead of KNN?? have i done anything wrong? or is it possible?
The results reported are a mean estimated score with some variance (spread).
It is an estimate on the performance on new data.
When you apply the method on new data, the performance may be in that range. It may be lower if the method has overfit the training data.
Overfitting is a challenge and developing a robust test harness to ensure we don’t fool/mislead ourselves during model development is important work.
I hope that helps as a start.
i want to buy your book.
i try this tutorial and the result is very awesome
i want to learn from you
thanks….
Thanks inzar.
You can see all of my books and bundles here:
https://machinelearningmastery.com/products
Why the leading comma in X = array[:,0:4]?
This is Python array notation for [rows,columns]
Learn more about slicing arrays in Python here:
http://structure.usc.edu/numarray/node26.html
In 1.2 , should warn to install scikit-learn
Thanks for the note.
Please see section 1.1 Install SciPy Libraries where it says:
Best ML tutorial for Python. Thank you, Jason.
Thanks!
when i tried run, i have error message” TypeError: Empty ‘DataFrame’: no numeric data to plot” help me
Sorry to hear that.
Perhaps check that you have loaded the data as you expect and that the loaded values are numeric and not strings. Perhaps print the first few rows: print(df.head(5))
thanks very much Jason for your time
it worked. these tutorial very help for me. im new in Machine learning, but may you explain to me about your simple project above? because i did not see X_test and target
regard in advance
Glad to hear it baso!
Thank you for sharing this. I bumped into some installation problems.
Eventually, yo get all dependencies installed on MacOS 10.11.6 I had to run this:
brew install python
pip install –user numpy scipy matplotlib ipython jupyter pandas sympy nose scikit-learn
export PATH=$PATH:~/Library/Python/2.7/bin
Thanks for sharing Andrea.
I’m a macports guy myself, here’s my recipe:
Hi Jason,
I am following this page as a beginner and have installed Anaconda as recommended.
As I am on win 10, I installed Anaconda 4.2.0 For Windows Python 2.7 version (x64) and
I am using Anaconda’s Spyder (python 2.7) IDE.
I checked all the versions of libraries (as shown in 1.2 Start Python and Check Versions) and got results like below:
Python: 2.7.12 |Anaconda 4.2.0 (64-bit)| (default, Jun 29 2016, 11:07:13) [MSC v.1500 64 bit (AMD64)]
scipy: 0.18.1
numpy: 1.11.1
matplotlib: 1.5.3
pandas: 0.18.1
sklearn: 0.17.1
At the 2.1 Import libraries section, I imported all of them and tried to load data as shown in
2.2 Load Dataset. But when I run it, it doesn’t show an output, instead, there is an error:
Traceback (most recent call last):
File “C:\Users\gachon\.spyder\temp.py”, line 4, in
from sklearn import model_selection
ImportError: cannot import name model_selection
Below is my code snippet:
import pandas
from pandas.tools.plotting import scatter_matrix
import matplotlib.pyplot as plt
from sklearn import model_selection
from sklearn.metrics import classification_report
from sklearn.metrics import confusion_matrix
from sklearn.metrics import accuracy_score
from sklearn.linear_model import LogisticRegression
from sklearn.tree import DecisionTreeClassifier
from sklearn.neighbors import KNeighborsClassifier
from sklearn.discriminant_analysis import LinearDiscriminantAnalysis
from sklearn.naive_bayes import GaussianNB
from sklearn.svm import SVC
url = “https://archive.ics.uci.edu/ml/machine-learning-databases/iris/iris.data”
names = [‘sepal-length’, ‘sepal-width’, ‘petal-length’, ‘petal-width’, ‘class’]
dataset = pandas.read_csv(url, names=names)
print(dataset.shape)
When I delete “from sklearn import model_selection” line I get expected results (150, 5).
Am I missing something here?
Thank you for your time and endurance!
Hi Sohib,
You must have scikit-learn version 0.18 or higher installed.
Perhaps Anaconda has documentation on how to update sklearn?
Thank you for reply.
I updated scikit-learn version to 0.18.1 and it helped.
The error disappeared, the result is shown, but one statement
‘import sitecustomize’ failed; use -v for traceback
is executed above the result.
I tried to find out why, but apparently I might not find the reason.
Is it going to be a problem in my further steps?
How to solve this?
Thank you in advance!
I’m glad to hear it fixed your problem.
Sorry, I don’t know what “import sitecustomize” is or why you need it.
Can i get the same tutorial with java
Hi Jason,
Nice tutorial.
In univariate plots, you mentioned about gaussian distribution.
According to the univariate plots, sepat-width had gaussian distribution. You said there are 2 variables having gaussain distribution. Please tell the other.
Thanks
The distribution of the others may be multi-modal. Perhaps a double Gaussian.
Hi, Jason. Could you please tell me the reason Why you choose KNN in example above ?
Hi Thinh,
No reason other than it is an easy algorithm to run and understand and good algorithm for a first tutorial.
Hi Jason,
I’m trying to use this code with the KDD Cup ’99 dataset, and I am having trouble with LabelEncoding my dataset in to numerical values.
#Modules
import pandas
import numpy
from pandas.tools.plotting import scatter_matrix
import matplotlib.pyplot as plt
from sklearn import preprocessing
from sklearn import cross_validation
from sklearn.metrics import classification_report
from sklearn.metrics import confusion_matrix
from sklearn.metrics import accuracy_score
from sklearn.linear_model import LogisticRegression
from sklearn.tree import DecisionTreeClassifier
from sklearn.neighbors import KNeighborsClassifier
from sklearn.discriminant_analysis import LinearDiscriminantAnalysis
from sklearn.naive_bayes import GaussianNB
from sklearn.svm import SVC
from sklearn.preprocessing import LabelEncoder
#new
from collections import defaultdict
#
#Load KDD dataset
data_set = “NSL-KDD/KDDTrain+.txt”
names = [‘duration’,’protocol_type’,’service’,’flag’,’src_bytes’,’dst_bytes’,’land’,’wrong_fragment’,’urgent’,’hot’,’num_failed_logins’,’logged_in’,’num_compromised’,’su_attempted’,’num_root’,’num_file_creations’,
‘num_shells’,’num_access_files’,’num_outbound_cmds’,’is_host_login’,’is_guest_login’,’count’,’srv_count’,’serror_rate’,’srv_serror_rate’,’rerror_rate’,’srv_rerror_rate’,’same_srv_rate’,’diff_srv_rate’,’srv_diff_host_rate’,
‘dst_host_count’,’dst_host_srv_count’,’dst_host_same_srv_rate’,’dst_host_diff_srv_rate’,’dst_host_same_src_port_rate’,’dst_host_srv_diff_host_rate’,’dst_host_serror_rate’,’dst_host_srv_serror_rate’,’dst_host_rerror_rate’,
‘dst_host_srv_rerror_rate’,’class’]
#Diabetes Dataset
#data_set = “Datasets/pima-indians-diabetes.data”
#names = [‘preg’, ‘plas’, ‘pres’, ‘skin’, ‘test’, ‘mass’, ‘pedi’, ‘age’, ‘class’]
#data_set = “Datasets/iris.data”
#names = [‘sepal_length’,’sepal_width’,’petal_length’,’petal_width’,’class’]
dataset = pandas.read_csv(data_set, names=names)
array = dataset.values
X = array[:,0:40]
Y = array[:,40]
label_encoder = LabelEncoder()
label_encoder = label_encoder.fit(Y)
label_encoded_y = label_encoder.transform(Y)
validation_size = 0.20
seed = 7
X_train, X_validation, Y_train, Y_validation = cross_validation.train_test_split(X, label_encoded_y, test_size=validation_size, random_state=seed)
# Test options and evaluation metric
num_folds = 7
num_instances = len(X_train)
seed = 7
scoring = ‘accuracy’
# Algorithms
models = []
models.append((‘LR’, LogisticRegression()))
models.append((‘LDA’, LinearDiscriminantAnalysis()))
models.append((‘KNN’, KNeighborsClassifier()))
models.append((‘CART’, DecisionTreeClassifier()))
models.append((‘NB’, GaussianNB()))
models.append((‘SVM’, SVC()))
# evaluate each model in turn
results = []
names = []
for name, model in models:
kfold = cross_validation.KFold(n=num_instances, n_folds=num_folds, random_state=seed)
cv_results = cross_validation.cross_val_score(model, X_train, Y_train, cv=kfold, scoring=scoring)
results.append(cv_results)
names.append(name)
msg = “%s: %f (%f)” % (name, cv_results.mean()*100, cv_results.std()*100)#multiplying by 100 to show percentage
print(msg)
# Compare Algorithms
fig = plt.figure()
fig.suptitle(‘Algorithm Comparison’)
ax = fig.add_subplot(111)
plt.boxplot(results)
ax.set_xticklabels(Y)
plt.show()
Am I doing something wrong with the LabelEncoding process?
Hi. Change all symbols like “ to ” and ’ to ‘. LabaleEncoder will be work correct but not all network. I try to create a neural network for NSL-KDD too. Have you any good examples?
What is “NSL-KDD”?
Hello Jason,
Please see https://github.com/defcom17/NSL_KDD
I’m not familiar with this, sorry.
How come it is concluded that KNN algorithm is accurate model when mean value for SVM algorithm is closer to 1 in comparison to KNN ?
Either algorithm would be effective on the dataset.
Hi, I’m running a bit of a different setup than yours.
The modules and version of python I’m using are more recent releases:
Python: 3.5.2 |Anaconda 4.2.0 (32-bit)| (default, Jul 5 2016, 11:45:57) [MSC v.1900 32 bit (Intel)]
scipy: 0.18.1
numpy: 1.11.3
matplotlib: 1.5.3
pandas: 0.19.2
sklearn: 0.18.1
And I’ve gotten SVM as the best algorithm in terms of accuracy at 0.991667 (0.025000).
Would you happen to know why this is, considering more recent versions?
I also happened to get a rather different boxplot but I’ll leave it at what I’ve said thus far.
Hi Dan,
You may get differing results for a variety of reasons. Small changes in the code will affect the result. This is why we often report mean and stdev algorithm performance rather than one number, to given a range of expected performance.
This post on randomness in ml algorithms might also help:
https://machinelearningmastery.com/randomness-in-machine-learning/
Hi Jason
I can’t tell you how grateful I am … I have been trawling through lots of ML stuff to try to get started with a “toy” example. Finally I have found the tutorial I was looking for. Anaconda had old sklearn: 0.17.1 for Windows – which caused an error “ImportError: cannot import name ‘model_selection'”. That was fixed by running “pip install -U scikit-learn” from the Anaconda command-line prompt. Now upgraded to 0.18. Now everything in your imports was fine.
All other tutorials were either too simple or too complicated. Usually the latter!
Thank you again 🙂
Glad to hear it Duncan.
Thanks for the tip for Anaconda uses.
I’m here to help if you have questions!
Hi Jason,
Wonderful service. All of your tutorials are very helpful
to me. Easy to understand.
Expecting more tutorials on deep neural networks.
Malathi
You’re very welcome Malathi, glad to hear it.
Hi Jason
I managed to get it all working – I am chuffed to bits.
I get exactly the same numbers in the classification report as you do … however, when I changed both seeds to 8 (from 7), then ALL of the numbers end up being 1. Is this good, or bad? I am a bit confused.
Thanks again.
Well done Duncan!
What do you mean all the numbers end up being one?
Hi Jason
I’ve output the “accuracy_score”, “confusion_matrix” & “classification_report” for seeds 7, 9 & 10. Why am I getting a perfect score with seed=9? Many thanks.
(seed=7)
0.9
[[10 0 0]
[ 0 8 1]
[ 0 2 9]]
precision recall f1-score support
Iris-setosa 1.00 1.00 1.00 10
Iris-versicolor 0.80 0.89 0.84 9
Iris-virginica 0.90 0.82 0.86 11
avg / total 0.90 0.90 0.90 30
(seed=9)
1.0
[[13 0 0]
[ 0 9 0]
[ 0 0 8]]
precision recall f1-score support
Iris-setosa 1.00 1.00 1.00 13
Iris-versicolor 1.00 1.00 1.00 9
Iris-virginica 1.00 1.00 1.00 8
avg / total 1.00 1.00 1.00 30
(seed=10)
0.9666666666666667
[[10 0 0]
[ 0 12 1]
[ 0 0 7]]
precision recall f1-score support
Iris-setosa 1.00 1.00 1.00 10
Iris-versicolor 1.00 0.92 0.96 13
Iris-virginica 0.88 1.00 0.93 7
avg / total 0.97 0.97 0.97 30
Random chance. This is why it is a good idea to use cross-validation with many repeats and report mean and standard deviation scores.
More on randomness in machine learning here:
https://machinelearningmastery.com/randomness-in-machine-learning/
from sklearn import model_selection
showing Import Error: can not import model_selection
You need to update your version of sklearn to 0.18 or higher.
Jason
Excellent Tutorial. New to Python and set a New Years Resolution to try to understand ML. This tutorial was a great start.
I struck the issue of the sklearn version. I am using Ubuntu 16.04LTS which comes with python-sklearn version 0.17. To update to latest I used the site:
http://neuro.debian.net/install_pkg.html?p=python-sklearn
Which gives the commands to add the neuro repository and pull down the 0.18 version.
Also I would like to note there is an error in section 3.1 Dimensions of the Dataset. Your text states 120 Instances when in fact 150 are returned, which you have in the Printout box.
Keep up the good work.
Jim
I’m glad to hear you worked around the version issue Jim, nice work!
Thanks for the note on the typo, fixed!
hi Jason.nice work here. I’m new to your blog. What does the y-axis in the box plots represent?
Hi Raphael,
The y-axis in the box-and-whisker plots are the scale or distribution of each variable.
Thank you for this wonderful tutorial.
You’re welcome Kayode.
hi Jason,
In this line
dataset.groupby(‘class’).size()
what other variable other than size could I use? I changed size with count and got something similar but not quite. I got key errors for the other stuffs I tried. Is size just a standard command?
Great question Raphael.
You can learn more about Pandas groupby() here:
http://pandas.pydata.org/pandas-docs/stable/groupby.html
Jason,
I’m trying to use a different data set (KDD CUP 99′) with the above code, but when I try and run the code after modifying “names” and the array to account for the new features and it will not run as it is giving me an error of: “cannot convert string to a float”.
In my data set, there are 3 columns that are text and the rest are integers and floats, I have tried LabelEncoding but it gives me the same error, do you know how I can resolve this?
Hi Scott,
If the values are indeed strings, perhaps you can use a method that supports strings instead of numbers, perhaps like a decision tree.
If there are only a few string values for the column, a label encoding as integers may be useful.
Alternatively, perhaps you could try removing those string features from the dataset.
I hope that helps, let me know how you go.
I would like a chart to see the grand scope of everything for data science that python can do.
You list 6 basic steps. For example in the visualizing step, I would like to know what all the charts are, what they are used for, and what python library it comes from.
I am extremely new to all this, and understand that some steps have to happen for example
1. Get Data
2. Validate Data
3. Missing Data
4. Machine Learning
5. Display Findinds
So for missing data, there are techniques to restore the data, what are they and what libraries are used?
You can handle missing data in a few ways such as:
1. Remove rows with missing data.
2. Impute missing data (e.g. use the Imputer class in sklearn)
3. Use methods that support missing data (e.g. decision trees)
I hope that helps.
Hi Jason,
I am a Non Tech Data Analyst and use SPSS extensively on Academic / Business Data over the last 6 years.
I understand the above example very easily.
I want to work on Search – Language Translation and develop apps.
Whats the best way forward …
Do you also provide Skype Training / Project Mentoring..
Thanks in advance.
Thanks Mohammed.
Sorry, I don’t have good advice for language translation applications.
I dont have any Development / Coding Background.
However, following your guidelines I downloaded SciPy and tested the code.
Everything worked perfectly fine.
Looking forward to go all in…
I’m glad to hear that Mohammed
Hi Jason,
I am new to Machine learning and am trying out the tutorial. I have following environment :
>>> import sys
>>> print(‘Python: {}’.format(sys.version))
Python: 2.7.10 (default, Jul 13 2015, 12:05:58)
[GCC 4.2.1 Compatible Apple LLVM 6.1.0 (clang-602.0.53)]
>>> import scipy
>>> print(‘scipy: {}’.format(scipy.__version__))
scipy: 0.18.1
>>> import numpy
>>> print(‘numpy: {}’.format(numpy.__version__))
numpy: 1.12.0
>>> import matplotlib
>>> print(‘matplotlib: {}’.format(matplotlib.__version__))
matplotlib: 2.0.0
>>> import pandas
>>> print(‘pandas: {}’.format(pandas.__version__))
pandas: 0.19.2
>>> import sklearn
>>> print(‘sklearn: {}’.format(sklearn.__version__))
sklearn: 0.18.1
When I try to load the iris dataset, it loads up fine and prints dataset.shape but then my python interpreter hangs. I tried it out 3-4 times and everytime it hangs after I run couple of commands on dataset.
>>> url = “https://archive.ics.uci.edu/ml/machine-learning-databases/iris/iris.data”
>>> names = [‘sepal-length’, ‘sepal-width’, ‘petal-length’, ‘petal-width’, ‘class’]
>>> dataset = pandas.read_csv(url, names=names)
>>> print(dataset.shape)
(150, 5)
>>> print(dataset.head(20))
sepal-length sepal-width petal-length petal-width class
0 5.1 3.5 1.4 0.2 Iris-setosa
1 4.9 3.0 1.4 0.2 Iris-setosa
2 4.7 3.2 1.3 0.2 Iris-setosa
3 4.6 3.1 1.5 0.2 Iris-setosa
4 5.0 3.6 1.4 0.2 Iris-setosa
5 5.4 3.9 1.7 0.4 Iris-setosa
6 4.6 3.4 1.4 0.3 Iris-setosa
7 5.0 3.4 1.5 0.2 Iris-setosa
8 4.4 2.9 1.4 0.2 Iris-setosa
9 4.9 3.1 1.5 0.1 Iris-setosa
10 5.4 3.7 1.5 0.2 Iris-setosa
11 4.8 3.4 1.6 0.2 Iris-setosa
12 4.8 3.0 1.4 0.1 Iris-setosa
13 4.3 3.0 1.1 0.1 Iris-setosa
14 5.8 4.0 1.2 0.2 Iris-setosa
15 5.7 4.4 1.5 0.4 Iris-setosa
16 5.4 3.9 1.3 0.4 Iris-setosa
17 5.1 3.5 1.4 0.3 Iris-setosa
18 5.7 3.8 1.7 0.3 Iris-setosa
19 5.1 3.8 1.5 0.3 Iris-setosa
>>> print(datase
It does not let me type anything further.
I would appreciate your help.
Thanks,
Purvi
Hi Purvi, sorry to hear that.
Perhaps you’re able to comment out the first parts of the tutorial and see if you can progress?
Hi Jason
i am planning to use python to predict customer attrition.I have current list of attrited customers with their attributes.I would like to use them as test data and use them to predict any new customers.Can you please help to approach the problem in python ?
my test data :
customer1 attribute1 attribute2 attribute3 … attrited
my new data
customer N, attribute 1,…… ?
Thanks for your help in advance.
Hi Sam, as a start, this process will help you clearly define and work through your predictive modeling problem:
https://machinelearningmastery.com/start-here/#process
I’m happy to answer questions as you work through the process.
Hello Sir, I want to check my data is how many % accurate, In my data , I have 4 columns ,
Taluka , Total_yield, Rain(mm) , types_of soil
Nasik 12555 63.0 dark black
Igatpuri 1560 75.0 shallow
So on,
first, I have to check data is accurate or not, and next step is what is the predicted yield , using regression model.
Here is my model Total_yield = Rain + types_of soil
I use 0 and 1 binary variable for types_of soil.
can you please help me, how to calculate data is accurate ? How many % ?
and how to find predicted yield ?
I’m not sure I understand Kiran.
This process will help you describe and work through your predictive modeling project:
https://machinelearningmastery.com/start-here/#process
# Load dataset
url = “https://archive.ics.uci.edu/ml/machine-learning-databases/iris/iris.data”
names = [‘sepal-length’, ‘sepal-width’, ‘petal-length’, ‘petal-width’, ‘class’]
dataset = pandas.read_csv(url, names=names)
The dataset should load without incident.
If you do have network problems, you can download the iris.data file into your working directory and load it using the same method, changing url to the local file name.
I am a very beginner python learner(trying to learn ML as well), I tried to load data from my local file but could not be successful. Will you help me out how exactly code should be written to open the data from local file.
Sure.
Download the file as iris.data into your current working directory (where your python file is located and where you are running the code from).
Then load it as:
Hi, Jason, first of all thank so much for this amazing lesson.
Just for curiosity I have computed all the values obtained with dataset.describe() with excel and for the 25% value of petal-length I get 1.57500 instead of 1.60000. I have googled for formatting describe() output unsuccessfully. Is there an explanation? Tnx
Not sure, perhaps you could look into the Pandas source code?
OK, I will do.
HI Jason
I don’t quite follow the KFOLD section ?
We started of with 150 data-entries(rows)
We then use a 80/20 split for validation/training that leaves us with 120
The split 10 boggles me ??
Does it take 10 items from each class and train with 9 ? what does the other 1 left do then ?
Hi jacques,
The 120 records are split into 10 folds. The model is trained on the first 9 folds and evaluated on the records in the 10th. This is repeated so that each fold is given a chance to be the hold out set. 10 models are trained, 10 scores collected and we report the mean of those scores as an estimate of the performance of the model on unseen data.
Does thar help?
I am trying to integrate machine learning into a PHP website I have created. Is there any way I can do that using the guidelines you provided above?
I have not done this Alhassan.
Generally, I would advise developing a separate service that could be called using REST calls or similar.
If you are working on a prototype, you may be able to call out to a program or script from cgi-bin, but this would require careful engineering to be secure in a production environment.
Hi Jason! This tutorial was a great help, i´m truly grateful for this so thank you.
I have one question about the tutorial though, in the Scattplot Matrix i can´t understand how can we make the dots in the graphs whose variables have no relationship between them (like sepal-lenght with petal_width).
Could you or someone explain that please? how do you make a dot that represents the relationship between a certain sepal_length with a certain petal-width
Hi Simão,
The x-axis is taken for the values of the first variable (e.g. sepal_length) and the y-axis is taken for the second variable (e.g. petal_width).
Does that help?
you match each iris instance’s length and width with each other. for example, iris instance number one is represented by a dot, and the dot’s values are the iris length and width! so actually, when you take all these values and put them on a graph you are basically checking to see if there is a relation. as you can see some in some of these plots the dots are scattered all around, but when we look at the petal width – petal length graph it seems to be linear! this means that those two properties are clearly related. hope this hepled!
Hi Jason,
from France and just to say you “Thank you for this very clear tutorial!”
Sébastien
I’m glad you found it useful Sébastien.
Hi Jason,
I am new to ML & Python. Your post is encouraging and straight to the point of execution. Anyhow, I am facing below error when
>>> validataion_size = 0.20
>>> X_train, X_validation, Y_train, Y_validation = model_selection.train_test_split(X, Y, test_size=validation_size, random_state = seed)
Traceback (most recent call last):
File “”, line 1, in
NameError: name ‘validation_size’ is not defined
What could be the miss out? I din’t get any errors in previous steps.
My Environment details:
OS: Windows 10
Python : 3.5.2
scipy : 0.18.1
numpy : 1.11.1
sklearn : 0.18.1
matplotlib : 0.18.1
Hi Raj,
Double check you have the code from section “5.1 Create a Validation Dataset” where validation_size is defined.
I hope that helps.
Hey Jason,
Can you please explain what precision,recall, f1-score, support actually refer to?
Also what the numbers in a confusion matrix refers to?
[ 7 0 0]
[ 0 11 1]
[ 0 2 9]]
Thanks.
Hi Roy,
You can learn all about the confusion matrix in this post:
https://machinelearningmastery.com/confusion-matrix-machine-learning/
You can learn all about precision and recall in this article:
https://en.wikipedia.org/wiki/Precision_and_recall
Hi Jason,
Thank you very much for your tutorial.
I am a little bit confused about the confusion matrix, because you are using a 3×3 matrix while it should be a 2×2 matrix.
Learn more about the confusion matrix here:
https://machinelearningmastery.com/confusion-matrix-machine-learning/
Hi Jason,
Now I unserstand the meaning of your confusion matrix, so I don’t need any explanation.
Thank you and best regards.
You’re welcome.
what code should i use to load data from my working directory??
This post will help you out Santosh:
https://machinelearningmastery.com/load-machine-learning-data-python/
Hi Jason,
I have a ValueError and i don’t know how can i solve this problem
My problem like that,
ValueError: could not convert string to float: ‘2013-06-27 11:30:00.0000000’
Can u give some information abaut the fixing this problem?
Thank you
It looks like you are trying to load a date-time. You might need to write a custom function to parse the date-time when loading or try removing this column from your dataset.
>>> for name, model in models:
… kfold=model_selection.Kfold(n_splits=10, random_state=seed)
… cv_results =model_selection.cross_val_score(model, X_train, Y_train, cv=kfold, scoring=scoring)
… results.append(cv_results)
… names.append(name)
… msg=”%s: %f (%f)” % (name, cv_results.mean(), cv_results.std())
… print(msg)
…
After typing this piece of code, it is giving me this error. can you plz help me out Jason. Since I am new to ML, dont have so much idea about the error.
Traceback (most recent call last):
File “”, line 2, in
AttributeError: module ‘sklearn.model_selection’ has no attribute ‘Kfold’
the KFold function is case-sensitive. It is ” model_selection.KFold(…) ” not ” model_selection.Kfold(…) ”
update this line:
kfold=model_selection.KFold(n_splits=10, random_state=seed)
THANK U
Hello Jason ,
Thanks for writing such a nice and explanatory article for beginners like me but i have one concern , i tried finding it out on other websites as well but could not come up with any solution.
Whatever i am writing inside the code editor (Jupyter Qtconsole in my case) , can this not be save as a .py file and shared with my other members over github maybe?. I found some hacks though but i have a thinking that there must be some proper way of sharing the codes written in the editor. , like without the outputs or plots in between.
You can write Python code in a text editor and save it as a myfile.py file. You can then run it on the command line as follows:
Consider picking up a book on Python.
Hello Jason,
Nice tutorials I done this today.
I didn’t really understand everything, { I will follow your advice, will do it again, write all the question down, and use the help function.}
The tutorials just works, I take around 2 hours to do it typing every single line.
install all the dependencies, run on each blocks types, to check.
Thanks, I be visiting your blogs, time to time.
Regards,
Well done, and thanks for your support.
Post any questions you have as comments or email me using the “contact” page.
Just I am a beginner too, I am using Visual studio code.
Look good.
What exactly is confusion matrix?
Great question, see this post:
https://machinelearningmastery.com/confusion-matrix-machine-learning/
Can I ask what is the reason of this problem? Thank for answer 🙂 :
(In my code is just the section, where I Import all the needed libraries..)
I have all libraries up to date, but it still gives me this error->
File “C:\Users\64dri\Anaconda3\lib\site-packages\sklearn\model_selection\_search.py”, line 32, in
from ..utils.fixes import rankdata
ImportError: cannot import name ‘rankdata’
( scipy: 0.18.1
numpy: 1.11.1
matplotlib: 1.5.3
pandas: 0.18.1
sklearn: 0.17.1)
Sorry, I have not seen this issue Dan, consider searching or posting to StackOverflow.
Jason,
You’re a rockstar, thank you so much for this tutorial and for your books! It’s been hugely helpful in getting me started on machine learning. I was curious, is it possible to add a non-number property column, or will the algorithms only accept numbers?
For example, if there were a “COLOR” column in the iris dataset, and all Iris-Setosa were blue. how could I get this program to accept and process that COLOR column? I’ve tried a few things and they all seem to fail.
Great question Cameron!
sklearn requires all input data to be numbers.
You can encode labels like colors as integers and model that.
Further, you can convert the integers to a binary encoding/one-hot encoding which may me more suitable if there is no ordinal relationship between the labels.
Jason, thanks so much for replying! That makes a lot of sense. When you say binary/one-hot encoding I assume you mean (continuing to use the colors example) adding a column for each color (R,O,Y,G,B,V) and for each flower putting a 1 in the column of it’s color and a 0 for all of the other colors?
That’s feasible for 6 colors (adding six columns) but how would I manage if I wanted to choose between 100 colors or 1000 colors? Are there other libraries that could help deal with that?
Yes you are correct.
Yes, sklearn offers LabelEncoder and OneHotEncoder classes.
Here is a tutorial to get you started:
https://machinelearningmastery.com/data-preparation-gradient-boosting-xgboost-python/
Awesome! thanks so much Jason!
You’re welcome, let me know how you go.
for name, model in models:
… kfold = cross_vaalidation.KFold(n=num_instances,n_folds=num_folds,random_state=seed)
… cv_results = model_selection.cross_val_score(model, X_train, Y_train, cv=kfold, scoring=scoring)
File “”, line 3
cv_results = model_selection.cross_val_score(model, X_train, Y_train, cv=kfold, scoring=scoring)
^
SyntaxError: invalid syntax
>>> cv_results = model_selection.cross_val_score(model, X_train, Y_train, cv=kfold, scoring=scoring)
Traceback (most recent call last):
File “”, line 1, in
NameError: name ‘model’ is not defined
>>> cv_results = model_selection.cross_val_score(models, X_train, Y_train, cv=kfold, scoring=scoring)
Traceback (most recent call last):
File “”, line 1, in
NameError: name ‘kfold’ is not defined
>>> cv_results = model_selection.cross_val_score(models, X_train, Y_train, cv =
kfold, scoring = scoring)
Traceback (most recent call last):
File “”, line 1, in
NameError: name ‘kfold’ is not defined
>>> names.append(name)
Traceback (most recent call last):
File “”, line 1, in
NameError: name ‘name’ is not defined
I am new to python and getting these errors after running 5.3 models. Please help me.
It looks like you might not have copied all of the code required for the example.
Hi, I went through your tutorial. It is super great!
I wonder whether you can recommend a data set that is similar to Iris classification for me to practice?
Thanks Mier,
I recommend some datasets here:
https://machinelearningmastery.com/practice-machine-learning-with-small-in-memory-datasets-from-the-uci-machine-learning-repository/
Hi Jason,
That’s an amazing tutorial, quite clear and useful.
Thanks a bunch!
Thanks Medine.
Hi Jason,
Can you let me know how can I start with Fraud Detection algorithms for a retail website ?
Thanks,
Sean
Hi Sean, this process will help you work through your problem:
https://machinelearningmastery.com/start-here/#process
You are doing great with your work.
I need your suggestion, i am working on my thesis here i need to work on machine learning.
Training : positive ,negative, others
Test : unknown data
Want to train machine with training and test with unknown data using SVM,Naive,KNN
How can i make the format of training and test data ?
And how to use those algorithms in it
Using which i can get the TP,TN,FP,FN
Thanking you..
This article might help:
https://en.wikipedia.org/wiki/Precision_and_recall
I m new in Machine learning and this was a really helpful tutorial. I have maybe a stupid question I wanted to plot the predictions and the validation value and make a visual comparison and it doesn’t seem like I really understood how I can plot it.
Can you please send me the piece of code with some explanations to do it ?
thank you very much
You can use matplotlib, for example:
Thanks a lot. It was very helpful.
You’re welcome Kamol, I’m glad to hear it.
Hi
Sorry for a dumb question.
Can you briefly describe, what the end result means (i.e.. what the program has predicted)
Given an input description of flower measurements, what species of flower is it?
We are predicting the iris flower species as one of 3 known species.
LR: 0.966667 (0.040825)
LDA: 0.975000 (0.038188)
KNN: 0.983333 (0.033333)
CART: 0.975000 (0.038188)
NB: 0.975000 (0.053359)
SVM: 0.991667 (0.025000)
Why am I getting the highest accuracy for SVM?
I’m a beginner, there was a similar query above but I couldn’t quite understand your reply.
Could you please help me out? Have I done any mistake?
Why is a very hard question to answer.
Our role is to find what works, ensure the results are robust, then figure out how we can use the model operationally.
Okay. Thanks a lot for the prompt response!
The tutorial was very helpful.
Glad to hear it Anusha.
Great tutorial Jason!
My question is, if I want some new data from a user, how do I do that? If in future I develop my own machine learning algorithm, how do I use it to get some new data?
What steps are taken to develop it?
And thanks for this tutorial.
Not sure I understand. Collect new data from your domain and store it in a CSV or write code to collect it.
Hi Jason,
I have a question regards the step after trained the data and know the better algorithm for our case, how we could know the rules formula that the algorithm produced for future uses ?
and thanks for the tutorial, its really helpful
You can extract the weights if you like. Not sure I understand why you want the formula for the network. It would be complex and generally unreadable.
You can finalize the mode, save the weights and topology for later use if you like.
the best algorithm results for my use case was the “Classification and Regression Trees (CART)”, so how could I know the rules that the algorithm created on my usecase.
how I could extract the weights and use them for evaluate new data .
Thanks for your prompt response
See this post on how to finalize your model:
https://machinelearningmastery.com/train-final-machine-learning-model/
Thank you so much…this document really helped me a lot…..i was searching for such a document since a long time…this document gave the actual view of how machine learning is implemented through python….Books and courses are really difficult to understand completely and begin with development of project on such a vast concept… books n videos gave me lots of snippets, but i was not understanding how they all fit together.
I’m glad to hear that.
can i get such more tutorials for more detailed understanding?……..It will be really helpfull.
Sure, see here:
https://machinelearningmastery.com/start-here/#python
Can’t load the iris dataset either through the url or copied to working folder without the NameError: name ‘pandas’ is not defined
You need to install the Pandas library.
See this tutorial:
https://machinelearningmastery.com/setup-python-environment-machine-learning-deep-learning-anaconda/
I’ve already installed Anaconda with Python 3.6 and the panda libraries are listed when I run versions.py. Everything has been fine up till trying to load the iris library. Do I need to use a different terminal within Anaconda?
You may need to close and re-open the terminal window, or maybe restart your system after installation.
add a line
import pandas
at the top
Thanks Sunil!
Hi Jason,
Your tutorial is fantastic!
I’m trying to follow it but gets stuck on 5.3 Build Models
When I copy your code for this section I get a few Errors
IndentationError: excpected an indented block
NameError: name ‘model’ is not defined
NameError: name ‘cv_results’ is not defined
NameError: name ‘name’ is not defined
Could you please help me find what I’m doing wrong?
Thanks!
see the code and my “results” below:
>>> # Spot Check Algorithms
… models = []
>>> models.append((‘LR’, LogisticRegression()))
>>> models.append((‘LDA’, LinearDiscriminantAnalysis()))
>>> models.append((‘KNN’, KNeighborsClassifier()))
>>> models.append((‘CART’, DecisionTreeClassifier()))
>>> models.append((‘NB’, GaussianNB()))
>>> models.append((‘SVM’, SVC()))
>>> # evaluate each model in turn
… results = []
>>> names = []
>>> for name, model in models:
… kfold = model_selection.KFold(n_splits=10, random_state=seed)
File “”, line 2
kfold = model_selection.KFold(n_splits=10, random_state=seed)
^
IndentationError: expected an indented block
>>> cv_results = model_selection.cross_val_score(model, X_train, Y_train, cv=kfold, scoring=scoring)
Traceback (most recent call last):
File “”, line 1, in
NameError: name ‘model’ is not defined
>>> results.append(cv_results)
Traceback (most recent call last):
File “”, line 1, in
NameError: name ‘cv_results’ is not defined
>>> names.append(name)
Traceback (most recent call last):
File “”, line 1, in
NameError: name ‘name’ is not defined
>>> msg = “%s: %f (%f)” % (name, cv_results.mean(), cv_results.std())
Traceback (most recent call last):
File “”, line 1, in
NameError: name ‘name’ is not defined
>>> print(msg)
Make sure you have the same tab indenting as in the example. Maybe re-add the tabs yourself after you copy-paste the code.
I’m having this same problem. How would I add the Indentations after I paste the code? Whenever I paste the code, it automatically executes the code.
How to copy code from the tutorial:
1. Click the copy button on the code example (top right of code box, second from the end). This will select all code in the box.
2. Copy the code to the cipboard (control-c on windows, command-c on mac, or right click and click copy).
3. Open your text editor.
4. Paste the code from the clip board.
This will preserve all white space.
Does that help?
Hi, one beginner question. What do we get after training is completed in supervised learning, for classification problem ? Do we get weights? How do i use the trained model after that in field, for real classification application lets say? I didn’t get the concept what happens if training is completed. I tried this example: https://github.com/fchollet/keras/blob/master/examples/mnist_mlp.py and it printed me accuracy and loss of test data. Then what now?
See this post on how to train a final model:
https://machinelearningmastery.com/train-final-machine-learning-model/
Wow… It’s really great stuff man…. Thanks you….
I’m glad to hear that.
As a complete beginner, it sounds so cool to predict the future. Then I saw all these model and complicated stuff, how do I even begin. Thank you for this. It is really great!
You’re very welcome.
Hello Jason,
I just started following your step by step tutorial for machine learning. In importing libraries step I followed each and every steps you specified, install all libraries via conda, but still I’m getting the following error.
Traceback (most recent call last):
File “C:/Users/dell/PycharmProjects/machine-learning/load_data.py”, line 13, in
from sklearn.linear_model import LogisticRegression
File “C:\Users\dell\Anaconda2\lib\site-packages\sklearn\linear_model\__init__.py”, line 15, in
from .least_angle import (Lars, LassoLars, lars_path, LarsCV, LassoLarsCV,
File “C:\Users\dell\Anaconda2\lib\site-packages\sklearn\linear_model\least_angle.py”, line 24, in
from ..utils import arrayfuncs, as_float_array, check_X_y
ImportError: DLL load failed: Access is denied.
Can you please help me with this?
Thank You!
I have not seen this error and I don’t know about windows sorry.
It looks like you might not have admin permissions on your workstation.
Tutorial DEAP Version 2.1
https://www.youtube.com/watch?v=drd11htJJC0
A Data Envelopment Analysis (Computer) Program. This page describes the computer program Tutorial DEAP Version 2.1 which was written by Tim Coelli.
Thanks for sharing the link.
Good afternoon Dr. Jason could help me with the next problem. How could you modify the KNN algorithm to detect the most relevant variables?
You can use feature importance scores from bagged trees or gradient boosting.
Consider using sklearn to calculate and plot feature importance.
Thank u…
I’m glad the post helped.
Hi Jason
Thanx for the great tutorial you provided.
I’m also new to MC and python. I tried to use my csv file as you used iris data set. Though it successfully loaded the dataset gives following error.
could not convert string to float: LipCornerDepressor
LipCornerDepressor is normal value such as 0.32145 in excel sheet taken from sql server
Here is the code without library files.
# Load dataset
url = “F:\FINAL YEAR PROJECT\Amila\FTdata.csv”
names = [‘JawLower’, ‘BrowLower’, ‘BrowRaiser’, ‘LipCornerDepressor’, ‘LipRaiser’,’LipStretcher’,’Emotion_Id’]
dataset = pandas.read_csv(url, names=names)
# shape
print(dataset.shape)
# class distribution
print(dataset.groupby(‘Emotion_Id’).size())
# Split-out validation dataset
array = dataset.values
X = array[:,0:4]
Y = array[:,4]
validation_size = 0.20
seed = 7
X_train, X_validation, Y_train, Y_validation = model_selection.train_test_split(X, Y, test_size=validation_size, random_state=seed)
# Test options and evaluation metric
seed = 7
scoring = ‘accuracy’
# Spot Check Algorithms
models = []
models.append((‘LR’, LogisticRegression()))
models.append((‘LDA’, LinearDiscriminantAnalysis()))
models.append((‘KNN’, KNeighborsClassifier()))
models.append((‘CART’, DecisionTreeClassifier()))
models.append((‘NB’, GaussianNB()))
models.append((‘SVM’, SVC()))
# evaluate each model in turn
results = []
names = []
for name, model in models:
kfold = model_selection.KFold(n_splits=10, random_state=seed)
cv_results = model_selection.cross_val_score(model, X_train, Y_train, cv=kfold, scoring=scoring)
results.append(cv_results)
names.append(name)
msg = “%s: %f (%f)” % (name, cv_results.mean(), cv_results.std())
print(msg)
This error might be specific to your data.
Consider double checking that your data is loaded as you expect. Maybe print some raw data or plots to confirm.
Thank you very much for the easy to follow tutorial.
I’m glad you found it useful.
Hi, Jason
Your posts are really good…..
I’m very naive to Python and Machine Learning.
Can you please suggest good reads to get basic clear for machine learning.
Thanks.
A good place to start for python machine learning is here:
https://machinelearningmastery.com/start-here/#python
I hope that helps.
Outstanding work on this. I am curious how to port out results that show which records were matched to what in the predictor, when I print(predictions) it does not show what records they are paired with. Thanks!
Thanks!
The index can be used to align predictions with inputs. For example, the first prediction is for the first input, and so on.
when I am applying all the models and printing message it shows me the error that it cannot convert string to float. how to resolve this error. my data set is related to fake news … title, text, label
Ensure you have converted your text data to numerical values.
Awesome tutorial on basics of machine learning using Python. Thank you Jason!
Thanks Shravan.
Am using Anaconda Python and I was writing all the commands/ program in the ‘python’ command line, am trying to find a way to save this program to a file? I have tried ‘%save’, but it errored out, any thoughts?
You can write your programs in a text file then run them on the command line as follows:
Thank you for the help and insight you provide. When I run the actual validation data through the algorithms, I get a different feel for which one may be the best fit.
Validation Test Accuracy:
LR…….0.80
LDA…..0.97
KNN….0.90
CART..0.87
NB…….0.83
SVM….0.93
My question is, should this influence my choice of algorithm?
Thank you again for providing such a wealth of information on your blog.
Tes it should.
ML algorithms are stochastic and you need to evaluate them in such a way to take this int account.
This post might clarify what I mean:
https://machinelearningmastery.com/randomness-in-machine-learning/
# Split-out validation dataset
array = dataset.values
X = array[:,0:4]
Y = array[:,4]
from my dataset , When i give Y=array[:,1] Its working , but if give 2 or 3 or 4 instead of 1 it gives following error !!
But all columns have similar kind of data .
Traceback (most recent call last):
File “/alok/c-analyze/analyze.py”, line 390, in
cv_results = model_selection.cross_val_score(model, X_train, Y_train, cv=kfold, scoring=scoring)
File “/usr/lib64/python2.7/site-packages/sklearn/model_selection/_validation.py”, line 140, in cross_val_score
for train, test in cv_iter)
File “/usr/lib64/python2.7/site-packages/sklearn/externals/joblib/parallel.py”, line 758, in __call__
while self.dispatch_one_batch(iterator):
File “/usr/lib64/python2.7/site-packages/sklearn/externals/joblib/parallel.py”, line 608, in dispatch_one_batch
self._dispatch(tasks)
File “/usr/lib64/python2.7/site-packages/sklearn/externals/joblib/parallel.py”, line 571, in _dispatch
job = self._backend.apply_async(batch, callback=cb)
File “/usr/lib64/python2.7/site-packages/sklearn/externals/joblib/_parallel_backends.py”, line 109, in apply_async
result = ImmediateResult(func)
File “/usr/lib64/python2.7/site-packages/sklearn/externals/joblib/_parallel_backends.py”, line 326, in __init__
self.results = batch()
File “/usr/lib64/python2.7/site-packages/sklearn/externals/joblib/parallel.py”, line 131, in __call__
return [func(*args, **kwargs) for func, args, kwargs in self.items]
File “/usr/lib64/python2.7/site-packages/sklearn/model_selection/_validation.py”, line 238, in _fit_and_score
estimator.fit(X_train, y_train, **fit_params)
File “/usr/lib64/python2.7/site-packages/sklearn/discriminant_analysis.py”, line 468, in fit
self._solve_svd(X, y)
File “/usr/lib64/python2.7/site-packages/sklearn/discriminant_analysis.py”, line 378, in _solve_svd
fac = 1. / (n_samples – n_classes)
ZeroDivisionError: float division by zero
Perhaps take a closer look at your data.
But the very similar in all the columns .
I meant there is no much difference in data from each columns ! but still its working only for first column !! It gives the above error for any other column i choose .
Have a look at the data :
index,1column,2 column,3column,….,8column
0,238,240,1103,409,1038,4,67,0
1,41,359,995,467,1317,8,71,0
2,102,616,1168,480,1206,7,59,0
3,0,34,994,181,1115,4,68,0
4,88,1419,1175,413,1060,8,71,0
5,826,10886,1316,6885,2086,263,119,0
6,88,472,1200,652,1047,7,64,0
7,0,322,957,533,1062,11,73,0
8,0,200,1170,421,1038,5,63,0
9,103,1439,1085,1638,1151,29,66,0
10,0,1422,1074,4832,1084,27,74,0
11,1828,754,11030,263845,1209,10,79,0
12,340,1644,11181,175099,4127,13,136,0
13,71,1018,1029,2480,1276,18,66,1
14,0,3077,1116,1696,1129,6,62,0
“”””””
‘”””””
Total 105 data records
But the above error does not occur for 1 column , that is when Y = 1 column,
But the above same error happens when i choose any other column 2 , 3 or 4 .
How to plot the graph for actual value against the predicted value here ?
How to save this plotted graphs and again view them back when required from terminal itself ?
It would make for a dull graph as this is a classification problem.
You might be better of reviewing the confusion matrix of a set of predictions.
How this can be applied to predict the value if stastical dataset is given
Say i have given with past 10 years house price now i want to predict the value for house in next one year, two year
Can you help me out in this
I m amature in ML
Thank for this tutorial
It gives me a good kickstart to ML
I m waiting for your reply
This is called a time series forecasting problem.
You can learn more about how to work through time series forecasting problems here:
https://machinelearningmastery.com/start-here/#timeseries
I getting trouble in doing that please help me out with any simple example
Example I have a dataset containing plumber work Say
attributes are
experience_level , date, rating, price/hour
I want to predict the price/hour for the next date base on experience level and average rating can you please help me regarding this.
Sorry, I cannot write an example for you.
Great job with the tutorial, it was really helpful.
I want to ask, how can I use the techics above with a dataset that is not just one line with a few values, but a matrix NX3 with multiple values (measurements from an accelerometer). Is there a tutorial? How can I look up to it?
Each feature would be a different input variable as in the example above.
Hey Jason,
I have built a linear regression model. y intercept is abnormally high (0.3 million) and adjusted r2 = 0.94. I would like to know what does high intercept mean?
Think of the intercept as the bias term.
Many books have been written on linear regression and much is known about how to analyze these models effectively. I would recommend diving into the statistics literature.
Excellent tutorial, i am moving from PHP to Python and taking baby steps. I used the Thonny IDE (http://thonny.org/) which is also very useful for python beginners.
Thanks for sharing.
Thank you so much, Jason! I’m new to machine learning and python but found your tutorial extremely helpful and easy to follow – thank you for posting!
Thanks Tmoe, I’m really glad to hear that!
Thanks for all,now I am starting use ML!!!
I’m glad to hear that!
# Spot Check Algorithms
models = []
models.append((‘LR’, LogisticRegression()))
models.append((‘LDA’, LinearDiscriminantAnalysis()))
When i print models , this is the output :
[(‘LR’, LogisticRegression(C=1.0, class_weight=None, dual=False, fit_intercept=True,
intercept_scaling=1, max_iter=100, multi_class=’ovr’, n_jobs=1,
penalty=’l2′, random_state=None, solver=’liblinear’, tol=0.0001,
verbose=0, warm_start=False)), (‘LDA’, LinearDiscriminantAnalysis(n_components=None, priors=None, shrinkage=None,
solver=’svd’, store_covariance=False, tol=0.0001)), (‘KNN’, KNeighborsClassifier(algorithm=’auto’, leaf_size=30, metric=’minkowski’,
metric_params=None, n_jobs=1, n_neighbors=5, p=2,
weights=’uniform’))
What are these extra values inside LogisticRegression (…) and for all the other algorithms ?
How did they get appended ?
You can learn about them in the sklearn API:
http://scikit-learn.org/stable/modules/classes.html
When i print kfold :
KFold(n_splits=7, random_state=7, shuffle=False)
What is shuffle ? How did this value get added , as we had only done this :
kfold = model_selection.KFold(n_splits=10, random_state=seed)
Whether or not to shuffle the dataset prior to splitting into folds.
Now i understand , jason thanks for amazing tutorials . Just one suggestion along with the codes give a link for reference in detail about this topics !
Great suggestion, thanks pasha.
Hello jason
This is an amazing blog , Thank you for all the posts .
cv_results = model_selection.cross_val_score(model, X_train, Y_train, cv=kfold, scoring=scoring)
Whats scoring here ? can you explain in detail ” model_selection.cross_val_score ” this line please .
Thanks sita.
Learn more here:
http://scikit-learn.org/stable/modules/generated/sklearn.model_selection.cross_val_score.html#sklearn.model_selection.cross_val_score
Please help me with this error Jason ,
ERROR :
Traceback (most recent call last):
File “/rahman/c-analyze/analyze.py”, line 390, in
cv_results = model_selection.cross_val_score(model, X_train, Y_train, cv=kfold, scoring=scoring)
File “/usr/lib64/python2.7/site-packages/sklearn/model_selection/_validation.py”, line 140, in cross_val_score
for train, test in cv_iter)
File “/usr/lib64/python2.7/site-packages/sklearn/externals/joblib/parallel.py”, line 758, in __call__
while self.dispatch_one_batch(iterator):
File “/usr/lib64/python2.7/site-packages/sklearn/externals/joblib/parallel.py”, line 608, in dispatch_one_batch
self._dispatch(tasks)
File “/usr/lib64/python2.7/site-packages/sklearn/externals/joblib/parallel.py”, line 571, in _dispatch
job = self._backend.apply_async(batch, callback=cb)
File “/usr/lib64/python2.7/site-packages/sklearn/externals/joblib/_parallel_backends.py”, line 109, in apply_async
result = ImmediateResult(func)
File “/usr/lib64/python2.7/site-packages/sklearn/externals/joblib/_parallel_backends.py”, line 326, in __init__
self.results = batch()
File “/usr/lib64/python2.7/site-packages/sklearn/externals/joblib/parallel.py”, line 131, in __call__
return [func(*args, **kwargs) for func, args, kwargs in self.items]
File “/usr/lib64/python2.7/site-packages/sklearn/model_selection/_validation.py”, line 238, in _fit_and_score
estimator.fit(X_train, y_train, **fit_params)
File “/usr/lib64/python2.7/site-packages/sklearn/discriminant_analysis.py”, line 468, in fit
self._solve_svd(X, y)
File “/usr/lib64/python2.7/site-packages/sklearn/discriminant_analysis.py”, line 378, in _solve_svd
fac = 1. / (n_samples – n_classes)
ZeroDivisionError: float division by zero
# Split-out validation dataset
My code :
array = dataset.values
X = array[:,0:4]
if field == “rh”: #No error if i select this col
Y = array[:,0]
elif field == “rm”: #gives the above error
Y = array[:,1]
elif field == “wh”: #gives the above error
Y = array[:,2]
elif field == “wm”: #gives the above error
Y = array[:,3]
Have a look at the data :
index,1column,2 column,3column,….,8column
0,238,240,1103,409,1038,4,67,0
1,41,359,995,467,1317,8,71,0
2,102,616,1168,480,1206,7,59,0
3,0,34,994,181,1115,4,68,0
4,88,1419,1175,413,1060,8,71,0
5,826,10886,1316,6885,2086,263,119,0
6,88,472,1200,652,1047,7,64,0
7,0,322,957,533,1062,11,73,0
8,0,200,1170,421,1038,5,63,0
9,103,1439,1085,1638,1151,29,66,0
10,0,1422,1074,4832,1084,27,74,0
11,1828,754,11030,263845,1209,10,79,0
12,340,1644,11181,175099,4127,13,136,0
13,71,1018,1029,2480,1276,18,66,1
14,0,3077,1116,1696,1129,6,62,0
“”””””
‘”””””
Total 105 data records
But the above error does not occur for 1 column , that is when Y = 1 column,
But the above same error happens when i choose any other column 2 , 3 or 4 .
Perhaps try scaling your data?
Perhaps try another algorithm?
fac = 1. / (n_samples – n_classes)
ZeroDivisionError: float division by zero
What is this error : fac = 1. / (n_samples – n_classes) ?
Where is n_samples and n_classes used ?
What may be the possible reason for this error ?
thank you Dr Jason it is really very helpfully. 🙂
You’re welcome bob, I’m glad to hear that!
Hi Jason
Great starting tutorial to get the whole picture. Thank you:)
I am a newbie to machine learning. Could you please tell why you have specifically chosen these 6 models?
No specific reason, just a demonstration of spot checking a suite of methods on the problem.
Hi Jason, I am new to Python, but found this blog really helpful. I tried executing the code and it return all the result as mention above by you, except few graph.
The scatter matrix graph and the evaluation on 6 algorithm did not open on my machine but its showing result on my colleague machine. I checked all the version and its higher or same as you mentioned in blog.
Can you help if this issue can be resolved on my machine?
Perhaps check the configuration of matplotlib and ensure you can create simple graphs on your machine?
Great tutorial.
How do I approach when the data set is not of any classification type and the number of attributes or just 2 – 1 is input and the other is output
say I have number of processes as input and cpu usage as output..
data set looks like [10, 5] [15, 7] etc…
If the output is real-valued, it would be a regression problem. You would need to use a loss function like MSE.
Many thanks for this — I already got a lot out of this. I feel like a monkey though because I was neither familiar enough with python nor had any clue of ML back alleys yesterday. Today I can see plots on my screen and even if I have no clue what I’m looking at, this is where I wanted to be, so thanks!
A few minor suggestions to make this perhaps even more dummy-proof:
– I’m on Mac and I used python3 because python2 is weirdly set up out of the box and you can’t update easily the libraries needed. I understand you link, rightfully to external installation instructions, so just to say, this stuff works in python3 if you needed further testimony.
– when drawing plots, I started freaking out because the terminal became unresponsive. So if you just made an (unessential) suggestion to run plt.ion() first, linking to, for example: https://matplotlib.org/faq/usage_faq.html#what-is-interactive-mode, it might help dummies like me to not give up too easily. (BTW I find your use command line philosophy and don’t let toolsets get in the way a great one indeed!)
– There seems to be some ‘hack’ involved when defining the dataset, suppose there are no headers and so on… how do you get to load your dataset with an insightful name vector in the first palce (you don’t…) So just a hint of clarification would help here feeling we can trust that we do the right thing in this case because the data is well understood (I mean, this is not really a big deal eh it’s all par for the course but if I didn’t have similar experience in R I’d feel completely lost I think).
I was a bit puzzled by the following sentence in 3.3:
“We can see that all of the numerical values have the same scale (centimeters) and similar ranges between 0 and 8 centimeters.”
Well, just looking at the table, I actually can’t see any of this. There is in fact really nothing telling this to us in the snippet, right? The sentence is a comment based on prior understanding of the dataset. Maybe this could be clarified so clueless readers don’t agonise over whether they are missing some magical power of insight.
– Overall, I could run this and to some extent adapt it quickly to a different dataset until it became relevant what the data was like. I’m stumbling on the data manipulation for 5.1. I suppose it is both because I don’t know python structures and also because I have no clue what is being done in the selection step.
I think in answer to a previous comment you link to doc for the relevant selection function, perhaps it would still be useful to have an extra, ‘for dummies’, detailed explanation of
X = array[:,0:4]
Y = array[:,4]
in the context of the iris dataset. This is what I have to figure out, I think, in order to apply it to say, a 11 column dataset and it would be useful to known what I’m trying to do.
The rest of the difficulties I have are with regards to interpretation of the output and it is fair to say this is outside of the scope of your tutorial which puts dummies like me in a very good position to try to understand while being able to fiddle with a bit of code. All the above comments are extremely minor and really about polishing the readibility for ultimate noobs, they are not really important and your tutorial is a great and efficient resource.
Thanks again!
Pierre
Wonderful feedback pierre, thank you so much!
I’m not able to figure out , what errors does the confusion matrix represents ? and what does each column(precision, recall, f1-score, support) in the classification report signifies ?
And last but not the least thanks a lot Sir for this easy to use and wonderful tutorial. Even words are not enough to express my gratitude, you have made a daunting task for every ML Enthusiast a hell lot easier !!!
You can learn more about the confusion matrix here:
https://machinelearningmastery.com/confusion-matrix-machine-learning/
Thanks a lot Sir. Please suggest some data-sets from UCL repository on which I can practice some small projects…
See here:
https://machinelearningmastery.com/practice-machine-learning-with-small-in-memory-datasets-from-the-uci-machine-learning-repository/
How do you classify problem into different categories example : Iris dataset was a classification problem and pima-indian-diabetes ,a binary problem. How can we figure out which problem belong to which category and which model to apply on that problem?
By careful evaluation of the output variable.
Is this machine learning? what does the machine learn in this example? This is just plain Statistics, used in a weird way…
Yes, it is.
Nominally, statistics is about understanding the data, machine learning about making predictions at the cost of understanding.
your question can be answered like this…
consider the formula for area of triangle 1/2 x base x height. When you learn this formula, you understand it and apply it many times for different triangles. BUT you did not learn anything ABOUT the formula itself. . for instance, how many people care that the formula has 2 variables(base and height) and that there is no CONSTANT(like PI) in the formula and many such things about the formula itself? Applying the formula does not teach anything about the nature of the formula itself
A lot of program execution in computers happen much the same way…data is a thing to be modified, applied or used, but not necessarily understood. When you introduce some techniques to understand data, then necessarily the computer or the ‘Machine’ ‘learns’ that there are characteristics about that data, and that at the least, there exists some relationship amongst data in their dataset. This learning is not explicitly programmed rather inferenced, although confusingly, the algorithms themselves are explicitly programmed to infer the meaning of the dataset. The learning is then transferred to the end cycle of making prediction based on the gained understanding of data.
but like you pointed out, it is still statistics and all it’s domain techniques, but as a statistician do you not ‘learn’ more about data than merely use it, unlike your counterparts who see data more as a commodity to be consumed? Because most computer systems do the latter(consumption) rather than the former(data understanding), a system that understands data(with prediction used as a proof of learning) can be called ‘Machine Learning’.
Thanks for good tutorial Jason.
Only issue I encountered is following error while cross validation score calculation for model KNeighborsClassifier() :
AttributeError: ‘NoneType’ object has no attribute ‘issparse’
Is somebody got same error? How it can be solved?
I have installed following versions of toos:
Python: 2.7.13 |Anaconda custom (64-bit)| (default, Dec 19 2016, 13:29:36) [MSC v.1500 64 bit (AMD64)]
scipy: 0.19.0
numpy: 1.12.1
matplotlib: 2.0.0
pandas: 0.19.2
sklearn: 0.18.1
Thanks,
Alex
Ouch, sorry I have not seen this issue. Perhaps search on stackoverflow?
HI, Jason!
How can i get the xgboost algorithm in pseudo code or in code?
You can read the code here:
https://github.com/dmlc/xgboost
I expect it is deeply confusing to read.
For an overview of gradient boosting, see this post:
https://machinelearningmastery.com/gentle-introduction-gradient-boosting-algorithm-machine-learning/
Sir,I’ve been working on bank_note authentication dataset and after applying the above procedure carefully the results were 100% accuracy(both on trained and validation dataset) using SVM and KNN models. Is 100% accuracy possible or have I done something wrong ?
That sounds great.
If I were to get surprising results, I would be skeptical of my code/models.
Work hard to ensure your system is not fooling you. Challenge surprising results.
Sir, I’ve considered various other aspects like f1-score, recall, support ; but in each case the result is same 100%. How can I make sure that my system is not fooling me ? What other procedure can I apply to check the accuracy of my dataset ?
Get more data and see if the model can make accurate predictions.
Hi, Jason!
I am new to python as well ML. so I am getting the below error while running your code, please help me to code bring-up
File “sample1.py”, line 73, in
predictions = knn.predict(X_validation)
File “/usr/local/lib/python2.7/dist-packages/sklearn/neighbors/classification.py”, line 143, in predict
X = check_array(X, accept_sparse=’csr’)
File “/usr/local/lib/python2.7/dist-packages/sklearn/utils/validation.py”, line 407, in check_array
_assert_all_finite(array)
File “/usr/local/lib/python2.7/dist-packages/sklearn/utils/validation.py”, line 58, in _assert_all_finite
” or a value too large for %r.” % X.dtype)
ValueError: Input contains NaN, infinity or a value too large for dtype(‘float64’).
and my config
Python: 2.7.6 (default, Oct 26 2016, 20:30:19)
[GCC 4.8.4]
scipy: 0.13.3
numpy: 1.8.2
matplotlib: 1.3.1
pandas: 0.13.1
sklearn: 0.18.1
running in Ubuntu Terminal.
You may have a NaN value in your dataset. Check your data file.
Hello. This is really an amazing tutorial. I got down to everything but when selecting the best model i hit a snag. Can you help out?
Traceback (most recent call last):
File “/Users/sahityasehgal/Desktop/py/machinetest.py”, line 77, in
cv_results = model_selection.cross_val_score(model, X_train, Y_train, cv=kfold, scoring=’accuracy’)
File “/Users/sahityasehgal/Library/Python/2.7/lib/python/site-packages/sklearn/model_selection/_validation.py”, line 140, in cross_val_score
for train, test in cv_iter)
File “/Users/sahityasehgal/Library/Python/2.7/lib/python/site-packages/sklearn/externals/joblib/parallel.py”, line 758, in __call__
while self.dispatch_one_batch(iterator):
File “/Users/sahityasehgal/Library/Python/2.7/lib/python/site-packages/sklearn/externals/joblib/parallel.py”, line 608, in dispatch_one_batch
self._dispatch(tasks)
File “/Users/sahityasehgal/Library/Python/2.7/lib/python/site-packages/sklearn/externals/joblib/parallel.py”, line 571, in _dispatch
job = self._backend.apply_async(batch, callback=cb)
File “/Users/sahityasehgal/Library/Python/2.7/lib/python/site-packages/sklearn/externals/joblib/_parallel_backends.py”, line 109, in apply_async
result = ImmediateResult(func)
File “/Users/sahityasehgal/Library/Python/2.7/lib/python/site-packages/sklearn/externals/joblib/_parallel_backends.py”, line 326, in __init__
self.results = batch()
File “/Users/sahityasehgal/Library/Python/2.7/lib/python/site-packages/sklearn/externals/joblib/parallel.py”, line 131, in __call__
return [func(*args, **kwargs) for func, args, kwargs in self.items]
File “/Users/sahityasehgal/Library/Python/2.7/lib/python/site-packages/sklearn/model_selection/_validation.py”, line 238, in _fit_and_score
estimator.fit(X_train, y_train, **fit_params)
File “/Users/sahityasehgal/Library/Python/2.7/lib/python/site-packages/sklearn/linear_model/logistic.py”, line 1173, in fit
order=”C”)
File “/Users/sahityasehgal/Library/Python/2.7/lib/python/site-packages/sklearn/utils/validation.py”, line 526, in check_X_y
y = column_or_1d(y, warn=True)
File “/Users/sahityasehgal/Library/Python/2.7/lib/python/site-packages/sklearn/utils/validation.py”, line 562, in column_or_1d
raise ValueError(“bad input shape {0}”.format(shape))
ValueError: bad input shape (94, 4)
Ouch. Are you able to confirm that you copied all of the code exactly?
Also, are you able to confirm that your sklearn is up to date?
Yes i coped the code exactly as on the site. sklearn: 0.18.1
thoughts?
I’m not sure but I expect it has something to do with your environment.
This tutorial may help with your environment:
https://machinelearningmastery.com/setup-python-environment-machine-learning-deep-learning-anaconda/
Very insightful Jason, thank you for the post!
I was wondering if the models can be saved to/loaded from file, to avoid re-training a model each time we wish to make a prediction.
Thanks,
Rene
Yes, see this post:
https://machinelearningmastery.com/save-load-machine-learning-models-python-scikit-learn/
Mr. Brownlee,
This is, by far, is the most effective applied technology tutorial I have utilized.
You get right to the point and still have readers actually working with python, python libraries, IDE options, and of course machine learning. I am an electromechanical engineer with embedded C experience. Until now, I have been bogged down trying to traipse through python wizards’ idiosyncratic coding styles and verbose machine learning theory knowing there exists a friendlier path.
Thank you for showing me the way!
Rich
Thanks Rich, you made my day! I’m glad it helped.
This was very informative….Thank You !
Actually I was working on a project on twitter analysis using python where I am extracting user interests through their tweets. I was thinking of using naive bayes classifier in textblob python library for training classifier with different type of pre-labeled tweets or different categories like politics,sports etc.
My only concern is that will it be accurate as I tried passing like 10 tweets in training set and based on that I tried classifying my test set. I am getting some false cases and accuracy is around 85.
Good question, I’d suggest try it and see.
Hi Jason,
This was great example. I was looking for something similar on internet all this time,glad I found this link. I wanted to compile a ML code end-to-end and see my basic infra is ready to start with the actual course work. As you said, from here we can learn more about each algorithm in detail. It would be great if you can start a Youtube channel and upload some easy to learn videos as well related to ML, Deep learning and Neural Networks.
Regards,
Kush Singh
Thanks.
Take a look at the rest of my blog and my books. I am dedicated to this mission.
I’ve been working on a dataset which contains [Male,Female,Infant] as entries in first column rest all columns are integers. How can I replace [Male,Female,Infant] with a similar notation like [0,1,2] or something like that ? What is the most efficient way to do it ?
Excellent question.
Use a LabelEncoder:
http://scikit-learn.org/stable/modules/generated/sklearn.preprocessing.LabelEncoder.html
I’m sure I have tutorials on this on my blog, try the blog search.
Sir, while loading dataset we have given the URl but what if we already have one and wants to load it ?
Change the URL to a filename and path.
Hi,
Nice tutorial, thanks!
Just a little precision if someone encounter the same issue than me:
if you get the error “This application failed to start because it could not find or load the Qt platform plugin “windows”
in “”.” when you are trying to see your data visualizations, it’s maybe (like in my case) because you are using PySide rather than PyQT.
In that case, add these lines before the “import matplotlib.pyplot as plt”:
import matplotlib
matplotlib.use(‘Qt4Agg’)
matplotlib.rcParams[‘backend.qt4′]=’PySide’
Hope this will help
Thanks for the tip Vincent.
Fantastic tutorial! Running today I noticed two changes from the tutorial above (undoubtably because time has passed since it was created). New users might find the following observations useful:
#1 – Future Warning
Ran on OS X, Python 3.6.1, in a jupyter notebook, anaconda 4.4.0 installed:
scipy: 0.19.0
numpy: 1.12.1
matplotlib: 2.0.2
pandas: 0.20.1
sklearn: 0.18.1
I replaced this line in the #Load libraries code block:
from pandas.tools.plotting import scatter_matrix
With this:
from pandas.plotting import scatter_matrix
…because a FutureWarning popped up:
/Users/xxx/anaconda/lib/python3.6/site-packages/ipykernel_launcher.py:2: FutureWarning: ‘pandas.tools.plotting.scatter_matrix’ is deprecated, import ‘pandas.plotting.scatter_matrix’ instead.
Note: it does run perfectly even without this fix, this may be more of an issue in the future
#2 – SVM wins!
In the build models section, the results were:
LR: 0.966667 (0.040825)
LDA: 0.975000 (0.038188)
KNN: 0.983333 (0.033333)
CART: 0.966667 (0.040825)
NB: 0.975000 (0.053359)
SVM: 0.991667 (0.025000)
… which means SVM was better here. I added the following code block based on the KNN one:
# Make predictions on validation dataset
svm = SVC()
svm.fit(X_train, Y_train)
predictions = svm.predict(X_validation)
print(accuracy_score(Y_validation, predictions))
print(confusion_matrix(Y_validation, predictions))
print(classification_report(Y_validation, predictions))
which gets these results:
0.933333333333
[[ 7 0 0]
[ 0 10 2]
[ 0 0 11]]
precision recall f1-score support
Iris-setosa 1.00 1.00 1.00 7
Iris-versicolor 1.00 0.83 0.91 12
Iris-virginica 0.85 1.00 0.92 11
avg / total 0.94 0.93 0.93 30
I did also run the unmodified KNN block – # Make predictions on validation dataset – and got the exact results that were in the tutorial.
Excellent tutorial, very clear, and easy to modify 🙂
Thanks for sharing Danielle.
precision recall f1-score support
Iris-setosa 1.00 1.00 1.00 7
Iris-versicolor 1.00 0.83 0.91 12
Iris-virginica 0.85 1.00 0.92 11
how to relate this result with input ? I mean, can i interactively provide the values for sepal-length’, ‘sepal-width’, ‘petal-length’, ‘petal-width and result to get whether it which class ?
Great question.
You can use a LabelEncoder to map the string class labels to integers, and keep the object to reverse the conversion back to strings for predictions.
https://scikit-learn.org/stable/modules/generated/sklearn.preprocessing.LabelEncoder.html
So this intro shows how to set everything up but not the actual interesting bit how to use it?
What do you mean exactly? Putting the model into production? See here:
https://machinelearningmastery.com/deploy-machine-learning-model-to-production/
Excellent tutorial sir, I love your tutorials and I am starting with deep learning with keras.
I would love if you could provide a tutorial for sequence to sequence model using keras and a relevant dataset.
Also I would be obliged if you could point me in some direction towards names entity recognition using seq2seq
I have one here:
https://machinelearningmastery.com/learn-add-numbers-seq2seq-recurrent-neural-networks/
Hi Jason,
Awesome tutorial. I am working on PIMA dataset and while using the following command
# head
print(dataset.head(20))
I am getting NAN. HEPL ME.
Confirm you downloaded the dataset and that the file contains CSV data with nothing extra or corrupted.
Hi Jason,
I downloaded the dataset from UCI which is a CSV file but still I get NAN.
# Load dataset url = “https://archive.ics.uci.edu/ml/machine-learning-databases/pima-indians-diabetes/pima-indians-diabetes.data”
Thanks..
Sorry, I do not see how this could be. Perhaps there is an issue with your environment?
Hello Jason,
Thank you for a great tutorial.
I have noticed something , which I would like to share with you.
I have tried with random_state = 4
“X_train,X_validation,Y_train,Y_validation = model_selection.train_test_split(X,Y, test_size = 0.2, random_state = 4)”
and surprisingly now “LDA” has the best accuracy.
LR: 0.966667 (0.040825)
LDA: 0.991667 (0.025000)
KNN: 0.975000 (0.038188)
CART: 0.958333 (0.055902)
NB: 0.950000 (0.055277)
SVM: 0.983333 (0.033333)
Any thoughts on this?
Machine learning algorithms are stochastic:
https://machinelearningmastery.com/randomness-in-machine-learning/
Hi Jason,
Thanks for your great example, this is really helpful, this end-to-end project is the best way to learn ML, much better than text-book which they only focus on the seperate concepts, not the whole forest, will you please do more example like this and explain in detail next time?
Thanks,
Rui
Thanks.
__init__() got an unexpected keyword argument ‘n_splites’
I am getting this error while running the code upto “print(msg)” commmand.
Can you please help me removing it.
Update your version of sklearn to 0.18 or higher.
This is beautiful tutorial for the starters..
I am a lover of machine learning and want to do some projects and research on it.
I would really need your help and guideline time to time.
Regards,
Fahad
Thanks.
Hi Jason,
Love the article. gave me a good start of understanding machine learning. One thing i would like to ask is what is the predicted outcome? Is it which type or “class” of flower that will happen next? i assume switching things up I could use this same outline as a way of getting a prediction on the other columns involved?
Yes, the prediction is a number that maps to a specific class of flower (string).
Correct, from the class and other measures you could predict width or something.
Hi again Jason,
Diving deeper into this tutorial and analyzing more I find something that peaked an interest maybe you can shed light on. based off the seed of 7 you get a higher accuracy percentage on the KNN algorithm after using kfold, but when showing the information for the LDA algorithm, it has a higher percentage in accuracy_score after predicting on it. what could this mean?
Machine learning algorithms are stochastic.
It is important to develop a robust estimate of the performance of machine learning models on unseen data using repeats. See this post:
https://machinelearningmastery.com/evaluate-skill-deep-learning-models/
Another great read Jason. This whole site is full of great pieces and it gives me a good answer on my question. I want to thank you for your time and effort into making such a great place for all this knowledge.
Thanks, I’m glad it helps Neal. Stick with it!
Hello Jason,
At the beginning of your tutorial you write: “If you are a machine learning beginner and looking to finally get started using Python, this tutorial was designed for you.”
No offense but in this regards, your tutorial is not doing a very good job.
You don’t really go in detail so that we can understand what is been done and why. The explanations are rather weak.
Wrong expectations set i believe.
Cheers,
Thomas
It is a starting point, not a panacea.
Sorry that it’s not a good fit for you.
Hi Jason! I am trying to adapt this for a purely binary dataset, however I’m running into this problem:
# evaluate each model in turn
results = []
name = []
for name, model in models:
kfold = model_selection.KFold(n_splits=10, random_state=seed)
cv_results = model_selection.cross_val_score(model, X_train, Y_train,cv = kfold, scoring=scoring)
results.append(cv_results)
names.append(name)
msg = “%s:%f(%f)”%(name, cv_results.mean(), cv_results.std())
print(msg)
I get the error:
raise ValueError(“Unknown label type: %r” % y_type)
ValueError: Unknown label type: ‘unknown’
Am I missing something, any help would be great!
All necessary indentations are correct, it just pasted incorrectly
You can wrap pasted code in pre tags.
Sorry, the fault is not obvious to me.
Hello Mariah,
Did you ever get a solution to this problem?
Jason..great guide here..THANKS!
Hi. What should i do to make predictions based on my own test set.? Say i need to predict category of flower with data [5.2, 1.8, 1.6, 0.2]. ie i want to change my X_test to that array. And the prediction should be like “setosa”.
What changes should i do.? I tried giving that value directly to predict(). But it crashes.
Correct.
Fit the model on all available data. This is called creating a final model:
https://machinelearningmastery.com/train-final-machine-learning-model/
Then make your prediction on new data where you do not know the answer/outcome.
Does that help?
Yes it helped. Can u show an example code for the same.?
Sure:
Hi Jason, i´m perú and i have to script write in Mac
#Configurar para la red neural
fechantinicio = ‘1970-01-01’
fechantfinal = ‘1974-12-31’
capasinicio = TodasEstaciones.ix[fechantinicio:fechantfinal].as_matrix()[:,[0,2,5]]
capasalida = TodasEstaciones.ix[fechantinicio:fechantfinal].as_matrix()[:,1]
#Construimos la Red Neural
from sknn.mlp import Regressor, Layer
neurones = 8
tasaaprendizaje = 0.0001
numiteraciones = 7000
#Definition of the training for the neural network
redneural = Regressor(
layers=[
Layer(“ExpLin”, units=neurones),
Layer(“ExpLin”, units=neurones), Layer(“Linear”)],
learning_rate=tasaaprendizaje,
n_iter=numiteraciones)
redneural.fit(capasinicio, capasalida)
#Get the prediction for the train set
valortest = ([])
for i in range(capasinicio.shape[0]):
prediccion = redneural.predict(np.array([capasinicio[i,:].tolist()]))
valortest.append(prediccion[0][0])
and then run…
ModuleNotFoundError Traceback (most recent call last)
in ()
1 #Construimos la Red Neural
2
—-> 3 from sknn.mlp import Regressor, Layer
4
5
ModuleNotFoundError: No module named ‘sknn’
i have install python in window 7 and i changed the script so:
#construimos la red neural
import numpy as np
from sklearn.neural_network import MLPRegressor
#definicion del entrenamiento para el trabajo de la red neural
redneural = MLPRegressor(
hidden_layer_sizes=(100,), activation=’relu’, solver=’adam’, alpha=0.001, batch_size=’auto’,
learning_rate=’constant’, learning_rate_init=0.01, power_t=0.5, max_iter=1000, shuffle=True,
random_state=0, tol=0.0001, verbose=False, warm_start=False, momentum=0.9, nesterovs_momentum=True,
early_stopping=False, validation_fraction=0.1, beta_1=0.9, beta_2=0.999, epsilon=1e-08)
redneural.fit(capasinicio,capasalida) and then shift + enter the run never end.
Thanks for your time.
Consider posting to stackoverflow.
Hello Jason, this is a fantastic tutorial! I am using this as a template to experiment with a dataset that has 0 or 1 as a value for each attribute and keep running into this error:
# Load libraries
import numpy
from matplotlib import pyplot
from pandas import read_csv
from pandas import set_option
from pandas.tools.plotting import scatter_matrix
from sklearn.preprocessing import StandardScaler
from sklearn.model_selection import train_test_split
from sklearn.model_selection import KFold
from sklearn.model_selection import cross_val_score
from sklearn.model_selection import GridSearchCV
from sklearn.metrics import classification_report
from sklearn.metrics import confusion_matrix
from sklearn.metrics import accuracy_score
from sklearn.pipeline import Pipeline
from sklearn.linear_model import LogisticRegression
from sklearn.tree import DecisionTreeClassifier
from sklearn.neighbors import KNeighborsClassifier
from sklearn.discriminant_analysis import LinearDiscriminantAnalysis
from sklearn.naive_bayes import GaussianNB
from sklearn.svm import SVC
from sklearn.ensemble import AdaBoostClassifier
from sklearn.ensemble import GradientBoostingClassifier
from sklearn.ensemble import RandomForestClassifier
from sklearn.ensemble import ExtraTreesClassifier
# Load Dataset
filename = ‘ML.csv’
names = [‘Cities’, ‘Entertainment’, ‘RegionalFood’, ‘WestMiss’, ‘NFLTeam’, ‘Coastal’, ‘WarmWinter’, ‘SuperBowl’, ‘Manufacturing’]
data = read_csv(filename, names=names)
print(data.shape)
# types
set_option(‘display.max_rows’, 500)
print(data.dtypes)
# head
set_option(‘display.width’, 100)
print(data.head(20))
# descriptions, change precision to 3 places
set_option(‘precision’, 3)
print(data.describe())
# class distribution
print(data.groupby(‘Cities’).size())
# histograms
data.hist(sharex=False, sharey=False, xlabelsize=1, ylabelsize=1)
pyplot.show()
# correlation matrix
fig = pyplot.figure()
ax = fig.add_subplot(111)
cax = ax.matshow(data.corr(), vmin=-1, vmax=1, interpolation=’none’)
fig.colorbar(cax)
pyplot.show()
# Split-out validation dataset
array = data.values
X = array[:,1:8]
Y = array[:,8]
validation_size = 0.20
seed = 7
X_train, X_validation, Y_train, Y_validation = train_test_split(X, Y,
test_size=validation_size, random_state=seed)
# Test options and evaluation metric
num_folds = 3
seed = 7
scoring = ‘accuracy’
# Spot-Check Algorithms
models = []
models.append((‘CART’, DecisionTreeClassifier()))
models.append((‘NB’, GaussianNB()))
models.append((‘SVM’, SVC()))
results = []
names = []
# evaluate each model in turn
results = []
names = []
for name, model in models:
kfold = KFold(n_splits=3, random_state=seed)
cv_results =cross_val_score(model, X_train, Y_train, cv=kfold, scoring=scoring)
results.append(cv_results)
names.append(name)
msg = “%s: %f (%f)” % (name, cv_results.mean(), cv_results.std())
print(msg)
I get the following error:
File “C:\Users\Giselle\Anaconda3\lib\site-packages\sklearn\utils\multiclass.py”, line 172, in check_classification_targets
raise ValueError(“Unknown label type: %r” % y_type)
ValueError: Unknown label type: ‘unknown’
runfile(‘C:/Users/Giselle/.spyder-py3/temp.py’, wdir=’C:/Users/Giselle/.spyder-py3′)
Check that you are loading your data correctly.
hey jason.
awesome detailed blog man…..i always love your method for explanation ..so clean and easy. Great … i start machine learning with r but now doing with python too.
Regards
Kuldeep
Thanks.
Hey Jason,
Your sample code is amazing to get started with ML.
When I tried to run the code myself I get an
Can you please help me rectify this?
What is the problem?
Jason
Thanks for your help !!!! The Blog is super useful … do you have another place that you recommend to learn more about the topic …. Thanks !!!!
Best
Marco
Thanks.
Yes, search “resources” on the blog.
Hi Jason,
Great tutorial!! very helpful!
I am getting an error executing below piece of code, can you help?
# evaluate each model in turn
results = []
names = []
for name, model in models:
kfold = ms.KFold(n_splits=10, random_state=seed)
cv_results = ms.cross_val_score(model, X_train, Y_train, cv=kfold, scoring=scoring)
results.append(cv_results)
names.append(name)
msg = “%s: %f (%f)” % (name, cv_results.mean(), cv_results.std())
print(msg)
Error that I am getting:
TypeError: get_params() missing 1 required positional argument: ‘self’
Sorry, I have not seen that error before. Perhaps confirm that your environment is installed correctly?
Also confirm that you have all of the code without extra spaces?
Yeah, environment is installed correctly. I made sure that there are no extra spaces in the code. It is still erroring out.
Sorry, I’m running out of ideas.
For anyone with this issue, the problem is a missing parenthesis in the line models.append((‘LR’, LogisticRegression()))
Are you sure?
Great tutorial. Loved it. What’s next?
See here:
https://machinelearningmastery.com/start-here/#python
And for the higher-level goals (e.g. build a portfolio):
https://machinelearningmastery.com/start-here/#getstarted
I get the following results when the test is run against each model.
LR: 0.966667 (0.040825)
LDA: 0.975000 (0.038188)
KNN: 0.983333 (0.033333)
CART: 0.966667 (0.040825)
NB: 0.975000 (0.053359)
SVM: 0.991667 (0.025000)
Looks like SVN is the best and not KNN, what is the reason for this?
Machine learning algorithms are stochastic:
https://machinelearningmastery.com/randomness-in-machine-learning/
Hi Jason, have started to learn Machine learning basics using Keras (with TF/Theano as backend). I am going through examples on this site and other resources with the ultimate goal of implementing Document reading/interpretation on constrained data set, e.g bank statements, proof of residence, standard supporting document etc.
Any pointers ?
Great!
Yes, start here:
https://machinelearningmastery.com/start-here/#getstarted
Thank you Jason for this simple tutorial for beginners.
I just want to know that what is the effect of n-folds (in above example, we used 10-fold) on model. If we change n-fold, the performance of algorithm varies, how does it effect the performance?
kfold=model_selection.Kfold(n_splits=10, random_state=seed)
The number of folds, and the specifics of the algorithm and data, will impact the stability of the estimated skill of the model on the problem.
Given a lot of data, often there is diminishing returns going beyond 10.
If in doubt, test the stability of the score (e.g. variance) by estimating model performance using a suite of different k values in k cross validation.
HI! Jason,
Thanks for this amazing article/tutorial it is really very helpful.
I was working on a predictive model of my own
I seem to be occurring a problem nobody on the forum got 😛 xD
I am sorry but could you help me out or point me in a direction ?
##########################################################################
import pandas as pd
import numpy as np
import matplotlib.pyplot as plt
from sklearn.ensemble import RandomForestClassifier
from sklearn import svm
from sklearn.svm import SVR
from sklearn import linear_model
import csv
from numpy import genfromtxt
import time
import datetime
from sklearn import model_selection
from sklearn.metrics import classification_report
from sklearn.metrics import confusion_matrix
from sklearn.metrics import accuracy_score
from sklearn.linear_model import LogisticRegression
from sklearn.tree import DecisionTreeClassifier
from sklearn.neighbors import KNeighborsClassifier
from sklearn.discriminant_analysis import LinearDiscriminantAnalysis
from sklearn.naive_bayes import GaussianNB
from sklearn.svm import SVC
date = []
usage = []
date = genfromtxt(‘date.csv’)
usage = genfromtxt(‘usage.csv’)
test = genfromtxt(‘test.csv’)
print (len(date))
print (len(usage))
dataframe = pd.DataFrame({
‘Date’: (date),
‘Usage’: (usage)
})
#drop NaN data’s
dataframe = dataframe.dropna()
print (dataframe)
df = dataframe.drop(dataframe.index[[-1,-4]])
array = df.values
X = array[:,0:1]
Y = array[:,1]
validation_size = 0.20
seed = 7
X_train, X_validation, Y_train, Y_validation = model_selection.train_test_split(X, Y, test_size=validation_size, random_state=seed)
seed = 7
scoring = ‘accuracy’
# Spot Check Algorithms
models = []
models.append((‘LR’, LogisticRegression()))
models.append((‘LDA’, LinearDiscriminantAnalysis()))
models.append((‘KNN’, KNeighborsClassifier()))
models.append((‘CART’, DecisionTreeClassifier()))
models.append((‘NB’, GaussianNB()))
models.append((‘SVM’, SVC()))
# evaluate each model in turn
results = []
names = []
for name, model in models:
kfold = model_selection.KFold(n_splits=10, random_state=seed)
cv_results = model_selection.cross_val_score(model, X_train, Y_train, cv=kfold, scoring=scoring)
results.append(cv_results)
names.append(name)
msg = “%s: %f (%f)” % (name, cv_results.mean(), cv_results.std())
print(msg)
# Compare Algorithms
fig = plt.figure()
fig.suptitle(‘Algorithm Comparison’)
ax = fig.add_subplot(111)
plt.boxplot(results)
ax.set_xticklabels(names)
plt.show()
#####################################################################
OutPut :
Date length : 366
Usage Length: 366
the data frame :
Date Usage
1 1.451587e+09 47139.0
2 1.451673e+09 85312.0
3 1.451759e+09 14301.0
4 1.451846e+09 20510.0
5 1.451932e+09 24225.0
6 1.452019e+09 30051.0
7 1.452105e+09 42228.0
8 1.452191e+09 27256.0
9 1.452278e+09 33746.0
10 1.452364e+09 30035.0
11 1.452451e+09 85844.0
12 1.452537e+09 28814.0
13 1.452623e+09 31082.0
14 1.452710e+09 21565.0
15 1.452796e+09 19095.0
16 1.452883e+09 15995.0
17 1.452969e+09 6578.0
18 1.453055e+09 96143.0
19 1.453142e+09 20503.0
20 1.453228e+09 31373.0
21 1.453315e+09 30776.0
22 1.453401e+09 39357.0
23 1.453487e+09 45955.0
24 1.453574e+09 21379.0
25 1.453660e+09 43682.0
26 1.453747e+09 51304.0
27 1.453833e+09 47333.0
28 1.453919e+09 33629.0
29 1.454006e+09 24185.0
30 1.454092e+09 47052.0
.. … …
336 1.480531e+09 74882.0
337 1.480617e+09 100712.0
338 1.480703e+09 45929.0
339 1.480790e+09 84837.0
340 1.480876e+09 85755.0
341 1.480963e+09 47184.0
342 1.481049e+09 62122.0
343 1.481135e+09 38140.0
344 1.481222e+09 46333.0
345 1.481308e+09 99399.0
346 1.481395e+09 101814.0
347 1.481481e+09 34078.0
348 1.481567e+09 45800.0
349 1.481654e+09 63657.0
350 1.481740e+09 33371.0
351 1.481827e+09 34921.0
352 1.481913e+09 33162.0
353 1.481999e+09 96179.0
354 1.482086e+09 27527.0
355 1.482172e+09 42291.0
356 1.482259e+09 112647.0
357 1.482345e+09 19299.0
358 1.482431e+09 52011.0
359 1.482518e+09 37571.0
360 1.482604e+09 78809.0
361 1.482691e+09 31469.0
362 1.482777e+09 69469.0
363 1.482863e+09 42879.0
364 1.482950e+09 31009.0
365 1.483036e+09 130637.0
[365 rows x 2 columns]
LR: 0.000000 (0.000000)
/Users/nelsondsouza/anaconda/lib/python2.7/site-packages/sklearn/discriminant_analysis.py:455:
UserWarning: The priors do not sum to 1. Renormalizing
UserWarning)
Traceback (most recent call last):
File “data_0.py”, line 111, in
cv_results = model_selection.cross_val_score(model, X_train, Y_train, cv=kfold, scoring=scoring)
File “/Users/nelsondsouza/anaconda/lib/python2.7/site-packages/sklearn/model_selection/_validation.py”, line 140, in cross_val_score
for train, test in cv_iter)
File “/Users/nelsondsouza/anaconda/lib/python2.7/site-packages/sklearn/externals/joblib/parallel.py”, line 758, in __call__
while self.dispatch_one_batch(iterator):
File “/Users/nelsondsouza/anaconda/lib/python2.7/site-packages/sklearn/externals/joblib/parallel.py”, line 608, in dispatch_one_batch
self._dispatch(tasks)
File “/Users/nelsondsouza/anaconda/lib/python2.7/site-packages/sklearn/externals/joblib/parallel.py”, line 571, in _dispatch
job = self._backend.apply_async(batch, callback=cb)
File “/Users/nelsondsouza/anaconda/lib/python2.7/site-packages/sklearn/externals/joblib/_parallel_backends.py”, line 109, in apply_async
result = ImmediateResult(func)
File “/Users/nelsondsouza/anaconda/lib/python2.7/site-packages/sklearn/externals/joblib/_parallel_backends.py”, line 326, in __init__
self.results = batch()
File “/Users/nelsondsouza/anaconda/lib/python2.7/site-packages/sklearn/externals/joblib/parallel.py”, line 131, in __call__
return [func(*args, **kwargs) for func, args, kwargs in self.items]
File “/Users/nelsondsouza/anaconda/lib/python2.7/site-packages/sklearn/model_selection/_validation.py”, line 238, in _fit_and_score
estimator.fit(X_train, y_train, **fit_params)
File “/Users/nelsondsouza/anaconda/lib/python2.7/site-packages/sklearn/discriminant_analysis.py”, line 468, in fit
self._solve_svd(X, y)
File “/Users/nelsondsouza/anaconda/lib/python2.7/site-packages/sklearn/discriminant_analysis.py”, line 378, in _solve_svd
fac = 1. / (n_samples – n_classes)
ZeroDivisionError: float division by zero
Sorry, I cannot debug your code. Consider posting to stackoverflow.
ok, Thanks 🙂 Have a nice day!
I just thought I would let you know
my data set has 365 rows and only 2 columns is that a problem ?
Also I had a question, if you could lead me in a correct direction,
If my dataset has a column ‘Dates’ .datetime object how should I go about handling it ?
thanks in advance 🙂
Sounds like a time series forecasting problem. You should treat it differently.
Start here with time series forecasting:
https://machinelearningmastery.com/start-here/#timeseries
Awesome tutorial.. The program ran so smoothly without any errors. And it was easy to understand. Graphs looked fantastic. Although I could not understand each and every functionality. Do you have any reference to understand the very basics of machine learning in Python?
Thanks for you help.
Yes, start right here:
https://machinelearningmastery.com/start-here/#python
Hi Jason,
Very nice tutorial. This helped me a lot.
Is there a way to append the train set with new data so that when ever I want I can add new data into the train model. What I could see creating new train sets.
Please help
Not sure I follow.
Once you choose a model, you can fit a final model on all available data and start using it to make predictions on new data.
You may want to update your model in the future, in which case you can use the same process above with new data.
Does that help?
Thank you Jason!!!
Having done the Coursera ML course by Andrew Ng I wasn’t sure where to go next.
Your clear and well explained example showed me the way!!! Looking forward to reading your other material and spending many many more hours learning and having fun. (And my first foray into Python wasn’t as daunting as I expected thanks to you).
Thanks Dexter, well done on working through the tutorial!
Hi Jason, I am using your tutorial for my own ML model and it’s fantastic! I’m trying to predict make prediction on new data and am using
NB=GaussianNB()
new_prediction = predict.nb(new data)
print(new_prediction)
I am able to successfully get one prediction, how can I get the top 5 classifications for my new data? I have 15 possible classifications and I’d like the predict function to yield the top 5 instead of just the single prediction
Any help would be greatly appreciated, thank you so much!
It sounds like your problem is a multi-class classification problem.
If so, you can predict probabilities and select the top 5 with the highest probability.
For example:
Thanks, how can I match the probabilities to the class, or is there a way to have it return the class name?
Here is the code:
ACN_prediction = NB.predict_proba([[ 0.80, 0.20, 0.70, 0.30, 0.99, 0.01, 0.98, 0.02, 0.95, 0.05, 0.95, 0.05, 1.00, 0]])
print (ACN_prediction)
And the result only displays:
[[ 0. 0. 0. …, 0. 1. 0.]]
Is it just giving me the probabilities I have typed in?
Each class is assigned an integer which is an index in the output array. This is done when you one hot encode the output variable.
Using just the NB.predict([[list of new data]])
I would get the class ‘Flower’
-Sorry for the long winded question, I have been stuck on this for hours, I appreciate your help
If you just want one class label, then you do not need the probabilities and you can use predict() instead.
If I want it to predict n best class labels I need to use predict_proba and manually match the n best probabilities to their class label correct? There is no other way to to yield the top 5 class labels?
Yes. Correct.
Thank you!
I’m glad it helped.
Hello, Jason,
I am using python3 on my mac, and I am also using Jupyter notebooks in order to complete the assignment on this webpage. Unfortunately, when I save the Iris dataset in my Desktop folder, and then run the command # shape
print(dataset.shape), the output is
(193, 5)
As you know, the output should be (150,5) and I am not sure why the dimensions of the dataset are wrong. Also, I tried to use the archive: https://archive.ics.uci.edu/ml/machine-learning-databases/iris/iris.data, but the Jupyter output was the following
—————————————————————————
SSLError Traceback (most recent call last)
/Library/Frameworks/Python.framework/Versions/3.6/lib/python3.6/urllib/request.py in do_open(self, http_class, req, **http_conn_args)
1317 h.request(req.get_method(), req.selector, req.data, headers,
-> 1318 encode_chunked=req.has_header(‘Transfer-encoding’))
1319 except OSError as err: # timeout error
/Library/Frameworks/Python.framework/Versions/3.6/lib/python3.6/http/client.py in request(self, method, url, body, headers, encode_chunked)
1238 “””Send a complete request to the server.”””
-> 1239 self._send_request(method, url, body, headers, encode_chunked)
1240
/Library/Frameworks/Python.framework/Versions/3.6/lib/python3.6/http/client.py in _send_request(self, method, url, body, headers, encode_chunked)
1284 body = _encode(body, ‘body’)
-> 1285 self.endheaders(body, encode_chunked=encode_chunked)
1286
/Library/Frameworks/Python.framework/Versions/3.6/lib/python3.6/http/client.py in endheaders(self, message_body, encode_chunked)
1233 raise CannotSendHeader()
-> 1234 self._send_output(message_body, encode_chunked=encode_chunked)
1235
/Library/Frameworks/Python.framework/Versions/3.6/lib/python3.6/http/client.py in _send_output(self, message_body, encode_chunked)
1025 del self._buffer[:]
-> 1026 self.send(msg)
1027
/Library/Frameworks/Python.framework/Versions/3.6/lib/python3.6/http/client.py in send(self, data)
963 if self.auto_open:
–> 964 self.connect()
965 else:
/Library/Frameworks/Python.framework/Versions/3.6/lib/python3.6/http/client.py in connect(self)
1399 self.sock = self._context.wrap_socket(self.sock,
-> 1400 server_hostname=server_hostname)
1401 if not self._context.check_hostname and self._check_hostname:
How can I get the correct dimensions of the Iris dataset?
Perhaps confirm that you downloaded the right dataset and have copied the code exactly.
Also, try running from the command line instead of the notebook. I find notebooks cause new and challenging faults.
I’ve been eyeballing this tutorial for a while and finally jumped into it! I’d like to thank you for such a clear intro into machine learning! This has been the only tutorial I’ve found so far that actually has you evaluating the data / different models right off that bat.
Thanks Andrew, and well done on working through it!
Hi Jason,
My sincere gratitude for this work you do to help us all out with ML. I have also been working away at this very wonderful field over the last 3 years now ( PhD research – studying gaze patterns and trying to build predictive models of gaze patterns which represent some sort of behavior). In any case, I was reviewing the code you built here and I was just thinking that I don’t tend to declare the test_size explicitly or the random_state either – I just put it directly into the algorithm
so, your code goes:
X_train, X_validation, Y_train, Y_validation = model_selection.train_test_split(X, Y, test_size=validation_size, random_state=seed) – totally spot on by the way,
My small addition/improvement – if you can call it that – would be to simply say
X_train, X_validation, Y_train, Y_validation = model_selection.train_test_split(X, Y, test_size= 0.2, random_state= 7)
# test_size keyword argument surely invokes the split method of the train_test_split module (I think) – meaning that the algorithm automatically assigns 80% to the training set and 20% to the test set
would you agree with this method? My python 3.x installation accepts this method just fine –
Also , I don’t know if anyone else might have suggested this, but it is also worth pointing out that for cross_val (cv) – the fold size can be quite resource intensive and also there are underfitting/overfitting issues to be aware of, when doing cross validation –
Can you sense check these thoughts please?
Many Thanks.
Cheers
Evaluating algorithms is an important topic.
Indeed the number of folds is important and we must ensure that each fold is sufficiently representative of the broader problem.
As for specifying the test size a different way, that’s fine. Use whatever works best on your problem. The key is developing unbiased estimates of model skill on unseen data.
This is the bit where I’m currently stuck – when I type in the command:
X_train, X_validation, Y_train, Y_validation = model_selection.train_test_split(X, Y, test_size=validation_size, random_state=seed)
the shell hangs – or at least it isn’t completing within 20 minutes or so. I’m guessing that shouldn’t be the case on this small dataset?
Are you running from the command line?
More help here:
https://machinelearningmastery.com/faq/single-faq/how-do-i-run-a-script-from-the-command-line
Thank you, Jason Brownlee, the post is very helpful. I was really lost in so many articles, blogs, open source tools. I was not able to understand how to start ML. Your post really helped me to start at least. I installed ANACONDA, ran the classification model successfully.
Next Step – Understand the concept and apply on some real use cases.
Well done Sarbani!
Thanks for this extremely helpful example. I just have a question about your validation method as I was a little confused. It seems to me that you withhold 20% of the data for validation, then perform 10-fold cross-validation on only the 80% training data, then train a new model on entire 80% training data and test with 20% validation data. Is this correct, and if so is it common practice? It seems to me that the best way to get statistics about the best model is to simply use all of the data and perform 10-fold cross-validation. Why do you only perform cross-validation on 80% of the data, then evaluate a new model and only test it with a single validation set?
Great question Ryan!
We hold back a test set so that if we over fit the model via repeated cross validation (e.g. parameter tuning), we still have a final way of checking to see if we have fooled ourselves.
More here:
https://machinelearningmastery.com/difference-test-validation-datasets/
Thanks for that link Jason, it was a great read. I had the exact same question and luckily found this post. I thought that the 20% test set was “wasted” by not using it during cross validation. Now I think the complete opposite. To the point where I have a follow-on question:
Technically speaking, when you visualized the dataset before train-test-splitting it, wouldn’t that count as information leakage, in the strictest sense of the term?
You start by reading in the entire CSV, then visualizing it with plots and as a human think “Hey, that data looks like it’s in such a shape, and sort of looks like it would suit such and such an algorithm.” Maybe the thought is even unconscious. And then that thought could bias your choice of algorithms to evaluate. Which in turn could bias the estimate of the “true” accuracy of the model.
I can phrase this another way. From your linked article, they say you should “lock it [the test set] away until you are completely done with learning”. By “lock it away” I take them to mean you shouldn’t even peek at it as a human at all. No information should leak into your own brain or into any of the training code that you write. That includes even plotting it, right?
Yes, it is leakage – but this is a simple example to get people started.
Perhaps this will help:
https://machinelearningmastery.com/data-preparation-without-data-leakage/
you above mention that scipy. it didn’t availabe in pycharm (windows)..can u suggest another package for machine learning…?
This tutorial will help you set up your environment:
https://machinelearningmastery.com/setup-python-environment-machine-learning-deep-learning-anaconda/
The link to download the “iris.dat” file appears to be broken!
Here is the direct link:
https://archive.ics.uci.edu/ml/machine-learning-databases/iris/iris.data
Thanks. Loved your result-first approach… Next I will use my own data set for a multi class problem. Hoping i would succeed !
A question
Given i will not have all the time to master writing new ML algorithms, I was wondering do i really need to ? I am an average developer from the past,(and new to Python but find it easy). I am thinking i should rather master how to prepare, present and interpret data – i understand domain very well – , and understand which algorithm (and libraries) to use for best results. I am guessing that, even to master applied ML, it will take many real projects !
I am keen in using ML in predicting data quality problems such as outliers that may need correction. any pointers ?
Thanks Ravindra!
No, I recommend using a library, here’s more on the topic:
https://machinelearningmastery.com/dont-implement-machine-learning-algorithms/
My best advice is to first collect a lot of data.
I am getting an error on the line starting with predictions?
# Make predictions on validation dataset
knn = KNeighborsClassifier()
knn.fit(X_train, Y_train)
predictions = knn.predict(X_validation)
print(accuracy_score(Y_validation, predictions))
print(confusion_matrix(Y_validation, predictions))
print(classification_report(Y_validation, predictions))
I am using Python 3, is there something else I need to install
What error?
This tutorial will show you how to setup your environment:
https://machinelearningmastery.com/setup-python-environment-machine-learning-deep-learning-anaconda/
Hey Jason!!!…Thanks for this!!!…Also I appreciate your helping out the people having doubts for, i guess an year!!! . I wish you good luck 🙂
Thanks Ankith, I’m glad the tutorial helped you.
Thx a lot! Very helpfull
You’re welcome.
thank you this was really helpful >> too many indices for array
so I give him the data in 2 dimension instead of 1-D and use this >>> numpy.loadtxt( dataset , delimiter=None , ndmin=2) but he give me this error>>> could not convert string to float ,maybe because there are float and string in the iris file
what’s the solution please I have to split them 🙁
i’m really sorry for the bad english and thank you again <3
Check your data file to makes sure it is a CSV file with no extra data.
can you show me what do mean
my data file is the url you post it here, not an uploaded file
how can I do insure of this?( CSV file with no extra data)
Use the filename or URL to load a file. It is that simple.
Sorry I don’t know where the rest of the previous comment disappeared>>so i a got a question
how could I separate the data such like this
features = dataset[:,0:4]
classification = dataset[:,4]
which is mean in other words when I write print (dataset.shape) I want him to give me :
(150,4) instead of (150,5) I told you that first I try to do this but he told me >> too many indices for array…continue reading at the beginning in the comment above
I’d like to thank you for this concise but very helpful tutorial. I’m new to python and all the the code is clear apart the following part:
# evaluate each model in turn
results = []
names = []
for name, model in models:
kfold = model_selection.KFold(n_splits=10, random_state=seed)
cv_results = model_selection.cross_val_score(model, X_train, Y_train, cv=kfold, scoring=scoring)
results.append(cv_results)
names.append(name)
msg = “%s: %f (%f)” % (name, cv_results.mean(), cv_results.std())
print(msg)
It’s not to clear to me how this ‘for’ cycle works. Specifically what is name and model?
It is evaluating the model using 10 fold cross validation. That means, 10 models are created and each is evaluated and the average score is calculated and stored in the list.
Does that help?
did you mean to write this command?
dataset = pandas.read_csv(url, names = parameters)
I did like you do in this lecture and imported the data file from the link ,But still can not separate the data
What is the problem exactly?
I think what he is trying to say is: he followed the tutorial as required, but once he got to the part where he had to load the iris dataset, he received a traceback from the line “dataset = pandas.read_csv(url, names = parameters)” in the python code provided. The traceback i received from this line was “NameError: name ‘pandas’ is not defined. Currently trying to fix, If i solve it before you get a chance to reply i will make sure to comment back on this tread what the problem was and how i fixed it.
for section 2.2 to fix this error, imported panda along with the script. hopefully this did the trick. I do not understand why pandas needed to be imported again, but, i did it.
# Load dataset
import pandas
url = “https://archive.ics.uci.edu/ml/machine-learning-databases/iris/iris.data”
names = [‘sepal-length’, ‘sepal-width’, ‘petal-length’, ‘petal-width’, ‘class’]
dataset = pandas.read_csv(url, names=names)
print(“its goin”)
Glad to hear it.
It sounds like pandas is not installed.
This tutorial will help you install pandas and generally set-up your environment correctly:
https://machinelearningmastery.com/setup-python-environment-machine-learning-deep-learning-anaconda/
Wow. Great easy to use and understand example. It worked 100% for me. Thanks
Thanks Ernst, I’m glad to hear that. Well done!
Hi Jason,
I found an error like this pls help me out.
# Compare Algorithms
… fig = plt.figure()
>>> fig.suptitle(‘Algorithm Comparison’)
Looks like a typo, change it to fig.subtitle()
But I copied it from your blog post.
Oh, my mistake.
Actually, it appears that _sup_title is correct; ‘subtitle’ is not recognized. (For me, it didn’t work with ‘subtitle’, but worked like a charm with ‘suptitle’ which must stand for something like “supratitle”…
And I would like to create dataset, which is precisely focused on handwritten language recognition using RNN. Would you please share some of your ideas, thoughts and resources.
Perhaps start here:
https://machinelearningmastery.com/handwritten-digit-recognition-using-convolutional-neural-networks-python-keras/
Thank you Jason.
Awesome tutorial! Thanks Jason
Thanks Jeremy.
Hi Jason, in you post 5.1 Create a Validation Dataset. you wrote seed = 7.
What is seed and why did you choose #7?
Why not seed 10 or seed 5?
Andrew from Seattle
Great question.
It does not matter what the value is as long as it is consistent.
See this post for a good explanation:
https://machinelearningmastery.com/randomness-in-machine-learning/
Hi , this article is really nice.. I am executing statements..and those are also working fine..But still i am not getting what i am doing..I mean where is the logic? And what is this validation set means.What actually we are doing here? What is the intention?
More on validation sets here:
https://machinelearningmastery.com/difference-test-validation-datasets/
More on the process of developing a predictive model end to end here:
https://machinelearningmastery.com/start-here/#process
Does that help?
Hi jason,
Getting error in implementing
dataset.plot(kind=’box’, subplots=True, layout=(2, 2), sharex=False, sharey=False)
as:
super(FigureCanvasQT, self).__init__(figure=figure)
TypeError: ‘figure’ is an unknown keyword argument
Please help me.
Might be an error in the way your environment is setup.
See this tutorial to setup your environment:
https://machinelearningmastery.com/setup-python-environment-machine-learning-deep-learning-anaconda/
Hi Jason!
When plotting the multivariate and univariate plots in Jupyter, I found them rather small. Is there a way to increase their size?
I’ve tried using figsize, matplotlib.rcParams nothing seems to be working.Please help me out
Thanks!
Sorry, I don’t use notebooks. I find them slow, hide errors and cause a lot of problems for beginners.
Thank you, Jason.
Where in the model do you specify that you are predicting “class”? Did I miss that somewhere?
You can call model.predict()
Very interesting.
That is my first tutorial on Machine learning.
Thanks!
Dear Jason,
Firstly thank you very much for this wonderful blog.
i was trying this code on my project on a 8 lac rows data set
when tried
array = dataset.values
X = dataset.iloc[:, [0, 18]].values
y = dataset.iloc[:, 19].values
validation_size = 0.20
seed = 7
X_train, X_validation, Y_train, Y_validation = model_selection.train_test_split(X, Y, test_size=validation_size, random_state=seed)
My Terminal gave me an error ” positional indexers are out-of-bounds ”
Summary of y data set is mentioned below
> print(dataset.shape)
> (787353, 18)
Could you pl help me in resolving this error
Check your array slicing!
Hi Jason
Grt work done by u.
I just completed this tutorial on python 2.7.1.but not able to predict the new class label using some new values
Why not?
When doing the
# Load dataset
url = “https://archive.ics.uci.edu/ml/machine-learning-databases/iris/iris.data”
names = [‘sepal-length’, ‘sepal-width’, ‘petal-length’, ‘petal-width’, ‘class’]
dataset = pandas.read_csv(url, names=names)
section, terminal says
NameError: name ‘pandas’ is not defined
Is it that I don’t have pandas installed correctly?
You need to install pandas.
See this tutorial:
https://machinelearningmastery.com/setup-python-environment-machine-learning-deep-learning-anaconda/
hi Jason….first of all thank for such a good tutorial.
my question is: while execution my python interpreter stuck at the following line:
X_train, X_validation, Y_train, Y_validation = model_selection.train_test_split(X, Y, test_size=validation_size, random_state=seed)
and it neither produce any error nor correct output.
plz short it out…Thanks in advance.
I am using python 2.7.13
Perhaps wait a few minutes?
Thank you so much Mr Joson, this tutorial is very helpful and professionally designed.
I also got this to ask, can we get the training time for each classifier produced?
The training vs testing error graph as well?
thank you again for the helping
I’m glad it helped.
Yes, you can develop these learning graphs, learn more here:
http://scikit-learn.org/stable/auto_examples/model_selection/plot_learning_curve.html
HI Jason,
seem this line of code doesn’t work
dataset.plot(kind = ‘box’, subplots = True, layout = (2,2), sharex = False, sharey = False)
plt.show()
It doesn’t show anything. Could you help me?
Thanks you and best regard
Are you able to confirm your environment is installed and working correctly:
https://machinelearningmastery.com/setup-python-environment-machine-learning-deep-learning-anaconda/
Are you running the example as a Python script from the command line?
do you have import libraries piece at the top?
for this line –
import matplotlib.pyplot as plt
Yes.
Traceback (most recent call last):
File “machinelearning1.py”, line 63, in
kfold = model_selection.Kfold(n_splits=10,random_state=seed)
AttributeError: ‘module’ object has no attribute ‘Kfold’
I have no idea about machine learning. just blindly following the tutorial example to just get an idea what is ML.
cn you tell me how am I supposed to correct this error.
I also wish you will be explaining all codes and functions in details step by step in future lessons
Looks like you might need to update your version of sklearn.
See this tutorial:
https://machinelearningmastery.com/setup-python-environment-machine-learning-deep-learning-anaconda/
Hello Jason,
Thank you for your tutorial, it is amazing. Could you possibly do a follow up to this where you show how to package this, and use it? For instance I am not sure how to feed in new values, either manually or dynamically and then how could I store this data in a csv?
Great question.
I have some ideas about putting models into production here that might help as a start:
https://machinelearningmastery.com/deploy-machine-learning-model-to-production/
This is a superbly put tutorial for someone starting out in ML. Your step-by-step explanations allow people to actually understand and gain knowledge. Thank you so much for this and others that you have made.
Thanks Silvio. Well done for working through it!
dataset.hist()
plt.show()
the 5&6 bar shows a different hight on sepal-lenght … did they changed the dataset or anything? Im not concerned, but just curious what could cause such a difference in display/result.
i imported everything properly, except the fact that i did not install theano because im planning to use TF. Can that have an issue on how it deals with data ? should i install it anyway ?
https://imgur.com/a/fC1TD
Also i get different results when running my models… for me SVM is the best.
Could that be related to the visualization displaying something else before ?
–Original–
LR: 0.966667 (0.040825)
LDA: 0.975000 (0.038188)
KNN: 0.983333 (0.033333)
CART: 0.975000 (0.038188)
NB: 0.975000 (0.053359)
SVM: 0.981667 (0.025000)
–Original–
–Result–
LR: 0.966667 (0.040825)
LDA: 0.975000 (0.038188)
KNN: 0.983333 (0.033333)
CART: 0.975000 (0.038188)
NB: 0.975000 (0.053359)
SVM: 0.991667 (0.025000)
–Result–
No, machine learning algorithms are stochastic.
Learn more here:
https://machinelearningmastery.com/randomness-in-machine-learning/
I also got SVM as the best model.
LR: 0.966667 (0.040825)
LDA: 0.975000 (0.038188)
KNN: 0.983333 (0.033333)
CART: 0.966667 (0.040825)
NB: 0.975000 (0.053359)
SVM: 0.991667 (0.025000)
That is odd, I don’t have any ideas.
Could there be any changes to a newer version of the installed libraries ?
NumPy now working differently after they adjusted an algorythm or something like that ?
Maybe all who use the updated versions of all the included tools get this result ;/
Machine learning algorithms are stochastic and generally give different results each time they are run:
https://machinelearningmastery.com/randomness-in-machine-learning/
Same here using python 3.6 (anaconda)
LR: 0.966667 (0.040825)
LDA: 0.975000 (0.038188)
KNN: 0.983333 (0.033333)
CART: 0.966667 (0.040825)
NB: 0.975000 (0.053359)
SVM: 0.991667 (0.025000)
Followed up with:
# Make predictions on validation dataset
svm = SVC()
svm.fit(X_train, Y_train)
predictions = svm.predict(X_validation)
print(accuracy_score(Y_validation, predictions))
print(confusion_matrix(Y_validation, predictions))
print(classification_report(Y_validation, predictions))
Resulting in:
0.933333333333
[[ 7 0 0]
[ 0 10 2]
[ 0 0 11]]
precision recall f1-score support
Iris-setosa 1.00 1.00 1.00 7
Iris-versicolor 1.00 0.83 0.91 12
Iris-virginica 0.85 1.00 0.92 11
avg / total 0.94 0.93 0.93 30
Nice work Dan!
you say they give out different results everytime , but it seems like everyone who is going through the tutorial right now is getting the “new” results.
I tried to fix the random seed to make the example reproducible, but it is only reproducible within the set of libraries and their specific versions used. Even the platform can make a difference.
Hi, I’m new to machine learning. I started studying it for college purposes. Your tutorial really helped me and I was able to make it work with different datasets but now I wonder if there’s a way, for example, to set the output (knn.__METHODNAME__(‘Iris-setosa’)) and the method return generated data according to the parameter (in this case, sepal length and width and petal length and width).
Thanks in advance!
You can make predictions for new observations by calling model.predict(X)
Does that answer your question?
hi sir ,can you help to make an artificial neural network on how i import my train data(weight ,biases)in python programming to classify its category in class 1 to 4 manually and input the sample as the program execute or run sir ,i have 5 neuron to test my Ai.
thanks.
I have an example of coding a network from scratch here that you could use as a template:
https://machinelearningmastery.com/implement-backpropagation-algorithm-scratch-python/
Great tutorial sir 🙂
Im facing a problem in logistic regression with python +numpy +sklearn
How to convert all feature into float or numerical format for classification
Thanks
You can use an integer encoding and a one hot encoding. I have many tutorials on the blog showing how to do this (use the search).
for me the result comes different:
LR: 0.966667 (0.040825)
LDA: 0.975000 (0.038188)
KNN: 0.983333 (0.033333)
CART: 0.975000 (0.038188)
NB: 0.975000 (0.053359)
SVM: 0.991667 (0.025000)
SVM is more accurate than KNN
same results. SVM is more accurate
Hey
Nice guide. I did understand everything you have done but I had a small confusion regarding the seed variable being assigned to 7. I didn’t understand its significance. Can you please tell me why we have considered the variable seed and why has it been assigned to 7 and not some other random number?
It is to make the example reproducible.
You can learn more about the stochastic nature of machine learning algorithms here:
https://machinelearningmastery.com/randomness-in-machine-learning/
please rectify my errors
#load libraries
import pandas as pd
import IPython.display as ipd
import librosa
import librosa.display
import matplotlib.pyplot as plt
from pandas import read_csv
from pandas.plotting import scatter_matrix
from matplotlib import pyplot
from sklearn.model_selection import train_test_split
from sklearn.model_selection import cross_val_score
from sklearn.model_selection import StratifiedKFold
from sklearn.metrics import classification_report
from sklearn.metrics import confusion_matrix
from sklearn.metrics import accuracy_score
from sklearn.linear_model import LogisticRegression
from sklearn.tree import DecisionTreeClassifier
from sklearn.neighbors import KNeighborsClassifier
from sklearn.discriminant_analysis import LinearDiscriminantAnalysis
from sklearn.naive_bayes import GaussianNB
from sklearn.svm import SVC
#load dataset
df=pd.read_csv(r’C:\Users\SRI\Desktop\sharon\Emotion.csv’)
names=[‘tweet_id’,’sentiment’,’content’,’author’]
print(df.head())
print(df.describe())
print(df.info())
print(df.shape)
#class distribution
print(df.groupby(‘tweet_id’).size())
#data visualization
df.plot(kind=’box’,subplots=True,layout=(2,2),sharex=False,sharey=False)
pyplot.show()
#histograms
df.hist()
pyplot.show()
# train and test splitting
#scatter plot matrix
scatter_matrix(df)
pyplot.show()
#split-out validation dataset
array=df.values
X=array[:,0:4]
Y=array[:,3]
X_train,X_validation,Y_train,Y_validation=train_test_split(X,Y,test_size=0.2)
#print(X_train.head(5))
print(X_train.shape)
#print(Y_train.head())
print(Y_train.shape)
#spot check algorithms
models=[]
models.append((‘LR’,LogisticRegression(solver=’liblinear’,multi_class=’ovr’)))
models.append((‘LDA’,LinearDiscriminantAnalysis()))
models.append((‘KNN’,KNeighborsClassifier()))
models.append((‘CART’,DecisionTreeClassifier()))
This is a common question that I answer here:
https://machinelearningmastery.com/faq/single-faq/can-you-read-review-or-debug-my-code
In section 4.2 –> Note the diagonal grouping of some pairs of attributes. This suggests a high correlation and a predictable relationship.
If u could explain how??
Because the variables change together they appear as a line or diagonal line-grouping when plotted in 2D.
File “ns.py”, line 42
cv_results = cross_validation.cross_val_score(model, X_train, Y_train, cv=kfold, scoring=scoring)
^
IndentationError: unexpected indent
using my dataset I found this problem.How I can solve this type of problem please advice.
Make sure you copy the code exactly.
import pandas
from pandas.tools.plotting import scatter_matrix
import matplotlib.pyplot as plt
from sklearn import model_selection
from sklearn.model_selection import train_test_split
from sklearn.model_selection import cross_val_score
from sklearn.model_selection import KFold
from sklearn.metrics import classification_report
from sklearn.metrics import confusion_matrix
from sklearn.metrics import accuracy_score
from sklearn.linear_model import LogisticRegression
from sklearn.tree import DecisionTreeClassifier
from sklearn.neighbors import KNeighborsClassifier
from sklearn.discriminant_analysis import LinearDiscriminantAnalysis
from sklearn.naive_bayes import GaussianNB
from sklearn.svm import SVC
dataset = pandas.read_csv(“/home/nasrin/nslkdd/NSL_KDD-master/KDDTrain+.csv”)
array = dataset.values
X = array[:,0:41]
Y = array[:,41]
validation_size = 0.20
seed = 7
X_train, X_validation, Y_train, Y_validation = cross_validation.train_test_split(X, Y, test_size=validation_size, random_state=seed)
num_folds = 7
num_instances = len(X_train)
seed = 7
scoring = ‘accuracy’
models = []
models.append((‘LR’, LogisticRegression()))
models.append((‘LDA’, LinearDiscriminantAnalysis()))
models.append((‘KNN’, KNeighborsClassifier()))
models.append((‘CART’, DecisionTreeClassifier()))
models.append((‘NB’, GaussianNB()))
models.append((‘SVM’, SVC()))
results = []
names = []
for name, model in models:
kfold = cross_validation.KFold(n=num_instances, n_folds=num_folds, random_state=seed)
cv_results = cross_validation.cross_val_score(model, X_train, Y_train, cv=kfold, scoring= Scoring)
results.append(cv_results)
names.append(name)
msg = “%s: %f (%f)” % (name, cv_results.mean()*100, cv_results.std()*100)
print(msg)
………………………………………………………………
error is
Traceback (most recent call last):
File “ns.py”, line 26, in
X_train, X_validation, Y_train, Y_validation = cross_validation.train_test_split(X, Y, test_size=validation_size, random_state=seed)
NameError: name ‘cross_validation’ is not defined
It looks like you might not have the most recent version of scikit-learn installed.
It’s definitely the best site I’ve searched for machine learning. Thanks for everything!!
I wish you success in your business..
Thank you so much.
Hey, i am getting better results with the SVM algorithm, Why is it so? although we use the same data set.
It is the stochastic nature of machine learning algorithms:
https://machinelearningmastery.com/randomness-in-machine-learning/
Also, there may have been changes to the library.
Thanks Jason! its really beautiful to learn about ML . Thanks for your effort to make it effortless.
Thanks Amit.
Thanks Jason its real great to do this project you open my eyes in the world of machine learning in python.Just have one questions i long does it take to learn algorithms in python?
and
its advisable to learn python libraries for machine learning such as pandas, numply matplotlib and others before start learn different algorithms?
You can make great progress in just a few weeks.
Yes, I recommend starting with Python, you can address a lot of practical problems. Get started here:
https://machinelearningmastery.com/start-here/#python
Does anyone offer Machine Learning tutoring? I need help and am having a hard time finding anyone willing to actually speak and talk through examples.
I do my best on the blog 🙂
Perhaps you can hire someone on upwork?
Hey Its really nice bu i have a question that for other kind of data sets is that procedure remains same..?
It is a good start. Also see this more general procedure:
https://machinelearningmastery.com/start-here/#process
can you explain
X = array[:,0:4]
Y = array[:,4]
We are selecting columns using array slicing in Python using ranges.
X is comprised of columns 0, 1, 2 and 3.
Y is comprised of column 4.
I am not clear with the seed value and its importance.can you expain this
It initializes the random number generator so that you get the same results as I do in the tutorial.
Generally, I recommend learning more about the stochastic nature of machine learning algorithms here:
https://machinelearningmastery.com/randomness-in-machine-learning/
Thanks Jason! its really beautiful to learn about ML using Python . Thanks for your effort to make it effortless. would you please recommend me unsupervised HMM using Python.
Thank you
Thanks. Sorry, I cannot help you with HMMs. I hope to cover the topic in the future.
Why do you split the data into train and validation sets at the very beginning using “train_test_split”? I thought the K-Fold cross validation does that for us in this line:
cv_results = model_selection.cross_val_score(model, X_train, Y_train, cv=kfold, scoring=scoring)
I would assume we want to use the most data possible during model selection so why would we omit 20% of the data from this step?
We do this to double check the final model, learn more here:
https://machinelearningmastery.com/difference-test-validation-datasets/
Learn more about fitting a final model here:
https://machinelearningmastery.com/train-final-machine-learning-model/
Hi Jason,
Thanks for your tutorial, it is really awsome! I want to use machine learning approach for biology problems. I have a question below and hopr you could me give me some suggestions. Thanks in advance.
I have eight DNA sequences which are labeled as eithor “TSS” or “NTSS”. If I want to use your code here to predict whether a DNA sequence is TSS or not, do I need to transfer these sequences into numbers? If yes, do you have any suggestions of how to od that?
ATATATAG TSS
ACATTTAG TSS
ACATATAG TSS
ACTTATAG TSS
CCGTGTGG NTSS
CCGAGTGG NTSS
CCGTGCGG NTSS
CCGTCTGG NTSS
Thanks,
Weizhi
Yes, you will need to encode each char or each block as an integer, and then perhaps as a binary vector.
See this post:
https://machinelearningmastery.com/why-one-hot-encode-data-in-machine-learning/
This step by step tutorial is very interesting.
But I need yellow fever data set CSV file .. to predict yellow fever using machine learning.
Please any on can help me…@ teklegimay@gmail.com
Perhaps you can use google to find a suitable dataset?
go to CHEMBL dataset
Thanks for you help. This is awesome.
I have one issue : How can I rescale the axis ?
I have an error : ValueError: x and y must be the same size.
I have 3 features and 1 class for more than 245 000 data points.
please help.
The error suggests that you must have the same number of input patterns as output labels.
Hi Jason,
You might not aware that your tutorial is arousing motivation to learn ML in engineers who are far away from this domain too. Thanks a ton !
I’m glad to hear it!
Hi Jason,
Nice and precise explanation. But can you please elaborate the problem definition here. Happy to see the step by step approach, still missing the actual problem or task we need to explore.
Below mentioned the basic stupid question.
What result we are expecting from this problem solution.
Biswa
We are trying to predict the species given measurements of iris flowers.
sir i am not geetting what the classification report is ?,wht is the meaning of precision,recall,f1 score and the support ,what it actually tells us,what the table is for? ,and what we understand with the help of the table
Perhaps this article will help:
https://en.wikipedia.org/wiki/Precision_and_recall#Definition_.28classification_context.29
thank you sir
Great article. It’s been a lot of help. I’ve been applying this to other free datasets to practice (e.g. the titanic dataset). One thing I haven’t been able to figure out is how to show which columns are the most predictive. Do you know how to do that?
Thanks,
Micah
Feature selection methods can give you an idea:
https://machinelearningmastery.com/an-introduction-to-feature-selection/
Hi Dr Jason,
I can’t say thank you enough. This step by step tutorial is awesome. I´m so interested to try ML in a real project and this is a good way. I agree with you, academic is a little slow even though we can see more details.
Regards!!
I’m glad to hear it helped Daniel, well done for making it through the tutorial!
Sir,
I really appreciate your post and very thankful to you.
This post is very important for ML beginner like me.
I really loved the content and the way you make complex things simpler.
But I have one doubt, It would be very helpful to me if you help me building my understanding.
Question :
From the section “5.3 Build Models” line number 12
for name, model in models:
Please explain what is ” name, model ” here, its purpose and how it is working, (because I hadn’t seen any FOR loop like this. I had learn python from YouTube videos and have very basic understanding)
P.S. I ran your code and its perfectly working fine.
In that loop, a model is an item from the list, a “model” as the name suggests.
I recommend taking some more time to learn basic python loop structures:
https://wiki.python.org/moin/ForLoop
Thank you, you are awsome
Hello Jason, I am curious about ai and ml.Tons of thanks for your hard work and commitment.I have done installation of Anaconda and checked all the libraries successfully.My ignorance of programming is compelling me to ask this ridiculuous question. But i cant understand that where to upload dataset ? To be more clear i mean i dont understand even that where to write those url and given command to upload dataset ? on Jupiter notebook, or on conda prompt window ??? Please reply for kind of stupid question. Thanking you in anticipation.
The function call pandas.load_csv() will load a CSV data file, either as a filename on your computer or a CSV file on a URL.
Does that help?
Thanks Jason! It’s such a great article! However, i come across problems when applying your code here to my own dataset.
import sys
import scipy
import numpy
import pandas
import sklearn
from sklearn import model_selection
dataset = pandas.read_csv(‘D:\CMPE333\Project\Speed Dating Data_2.csv’, header = 0)
array = dataset.values
X = array[:,0:12]
Y = array[:,12]
validation_size = 0.20
seed = 7
X_train, X_validation, Y_train, Y_validation = model_selection.train_test_spilt(X, Y, test_size=validation_size, random_state=seed)
I got the error:
runfile(‘D:/CMPE333/Project/project.py’, wdir=’D:/CMPE333/Project’)
Traceback (most recent call last):
File “”, line 1, in
runfile(‘D:/CMPE333/Project/project.py’, wdir=’D:/CMPE333/Project’)
File “C:\ProgramData\Anaconda3\lib\site-packages\spyder\utils\site\sitecustomize.py”, line 710, in runfile
execfile(filename, namespace)
File “C:\ProgramData\Anaconda3\lib\site-packages\spyder\utils\site\sitecustomize.py”, line 101, in execfile
exec(compile(f.read(), filename, ‘exec’), namespace)
File “D:/CMPE333/Project/project.py”, line 33, in
X_train, X_validation, Y_train, Y_validation = model_selection.train_test_spilt(X, Y, test_size=validation_size, random_state=seed)
AttributeError: module ‘sklearn.model_selection’ has no attribute ‘train_test_spilt’
The dataset is stored as comma delimited csv file and has been loaded into a dataframe.
Can you tell me where is wrong? Thank you!!!
You might need to update your version of sklearn to 0.18 or higher.
Thanks for replying!
My sklearn version is 0.18.1
It works well when i use your data.
Is there something wrong when i load the data?
Hello Json, Thank you. But one thing didn’t clearly.Can you tell me in above example output what we predict? What we find? We are getting summarized the results as a final accuracy score, but about whos?
We are predicting the iris flower species given measurements of flowers.
Getting error in Class Distribution. If I give sum() instead of size() it works fine. Please suggest resolution.
======================================
# class distribution
print(dataset.groupby(‘class’).size())
======================================
Output
Traceback (most recent call last):
File “C:\\Python\ML\ImportLibs.py”, line 30, in
print(dataset.groupby(‘class’).size())
File “C:\Users\Meghal\AppData\Roaming\Python\Python35\site-packages\pandas\core\base.py”, line 59, in __str__
return self.__unicode__()
File “C:\Users\Meghal\AppData\Roaming\Python\Python35\site-packages\pandas\core\series.py”, line 1060, in __unicode__
width, height = get_terminal_size()
File “C:\Users\Meghal\AppData\Roaming\Python\Python35\site-packages\pandas\io\formats\terminal.py”, line 33, in get_terminal_size
return shutil.get_terminal_size()
File “C:\Users\Meghal\AppData\Local\Programs\Python\Python35-32\lib\shutil.py”, line 1071, in get_terminal_size
size = os.get_terminal_size(sys.__stdout__.fileno())
AttributeError: ‘NoneType’ object has no attribute ‘fileno’
============================================
Perhaps double check you have the latest version of the libraries installed?
Confirm the data was loaded correctly?
Not sure why, but for me, SVM is giving me a higher accuracy in terms of precision, recall, and f1-score, but it ultimately has the same support score as KNN
Might be the stochastic nature of ML algorithms:
https://machinelearningmastery.com/randomness-in-machine-learning/
1.can someone explain compare algorithm graph? 2.why knn is best algorithm 3. why & when use which algorithm?? thnx in advance
Generally, we cannot know what algorithm will be “best” for a given problem. Our job is to use careful experiment to discover what works best for a given prediction problem.
See this post:
https://machinelearningmastery.com/a-data-driven-approach-to-machine-learning/
Jason, you are the best!!
Thanks for putting together all that material in a meaningful way, in a simple language and aesthetic environment.
There are not enough words to say how thankful I am.
Thanks, I’m glad it helped Georgios.
Hey Jason, fantastic tutorial. I have one questions though. Is there a way I could test the system by inputting a flower and the computer identifying it? Thank’s a million!
Yes, you could input the measurements of a new flower by calling model.predict()
Hi Jason, Thanks a lot for the excellent step by step material to give a quick run-through of the methodology.
I am a tenured analytics practitioner and somehow found some time off to learn Python and was looking through the IRIS project itself. I had hypothesised that by adding more ratio variables to the dataset, we should get a better result on the prediction, Your excellent article gives me a ready code to test my hypothesis. I will share my results once I have them. 🙂
Please do!
Here are the k-Fold results: I used additional variables simply as all ratios of the original length variables respectively with no separate effort on dimensionality reduction.
LR: 0.950000 (0.040825)
LDA: 0.991667 (0.025000)
KNN: 0.958333 (0.055902)
CART: 0.950000 (0.066667)
NB: 0.966667 (0.055277)
SVM: 0.966667 (0.040825)
Drill down to the independent validation results for each technique:
Results for LR : 1.0
Results for LDA : 0.933333333333
Results for KNN : 1.0
Results for CART : 0.9
Results for NB : 0.966666666667
Results for SVM : 1.0
Although validation results are better across the board, I think LDA performs much better by this for K-fold method because other models may require a detailed variable selection or dimensionality reduction effort.
I would be glad to hear more from you on this. I am reachable on abhishek.zen@gmail.com.
Great work, thanks for sharing!
Hi Jason,
Thank you for the great tutorial. once we run test and validate the model. How can we deploy the model. Also, how can we make the model predict on new data-set and still continuously learn from the new data.
Thank you,
Great question.
This post has ideas on developing a final model:
https://machinelearningmastery.com/train-final-machine-learning-model/
This post has ideas on deploying a model:
https://machinelearningmastery.com/deploy-machine-learning-model-to-production/
Nice article to start with.
Although I really do not understand what each of model does?
So what should be the next step?
You could learn more about how each model works:
https://machinelearningmastery.com/start-here/#algorithms
Thanks a lot for your tutorial Jason. How should we apply the steps for Twitter data? Because the dataset is text, not number?
Working with text is called natural language processing. You can get started with text here:
https://machinelearningmastery.com/start-here/#nlp
“AxesSubplot’ object has no attribute ‘set_xticklables”
Sorry to hear that, please confirm that you have setup your environment correctly:
https://machinelearningmastery.com/setup-python-environment-machine-learning-deep-learning-anaconda/
Thanks Jason for this well explained post!
I am an aspiring data scientist and currently working on Wallmart’s sales forecasting dataset from kaggle.
If it is possible can you please also share a post about predicting the sales for this dataset?
It will be very helpful because I am not finding such a step by step tutorial in Python.
Thanks for the suggestion.
Perhaps this process will help you work through the problem systematically:
https://machinelearningmastery.com/start-here/#process
Thanks for the amazing guide
can i know how to get the sensitivity and specificity and recall
you had a good Example Confusion Matrix in R with caret
but in the same page i could get the confusion for python but not the elements like
sensitivity and specificity and recall
thank again
Perhaps this will help:
http://scikit-learn.org/stable/modules/classes.html#sklearn-metrics-metrics
Thankyou very much for the great tutorial.
I analyzed every step but one thing it is not clear for me, and maybe it is the most important part of the tutorial 😉
At the end of all our steps I would expect a function or something else to answer Python questions like these:
1. I have a flower with sepal-lenght=5, sepal width=3.5, petal-lenght=1.3 and petal-width=0.3, which class is it?
2. I have an Iris-setosa with sepal-lenght=5, sepal width=3.5, petal-lenght=1.3. What could be the petal-width?
Isn’t this one of the the main objectives of the ML?
OK, I answer by myself, for question one I could use
print(knn.predict([[5.0,3.5,1.3,0.3]]))
to get “[‘Iris-setosa’]”
For question 2 I think that I need to rebuilt the whole model.
Well done!
Yes, you can train a final model on all data and use it to make a prediction.
Here’s more about that:
https://machinelearningmastery.com/train-final-machine-learning-model/
Here’s how to save a model in Python:
https://machinelearningmastery.com/save-load-machine-learning-models-python-scikit-learn/
You can predict on new data using:
This is a brilliant turtorial, thank you. I have a few questions – you split the data in to training and validation, but in this case would it not be classed as training and test?
Also, do you have any posts on tuning hyperparamters such as the learning rate in Logistic Regression? It was my understanding that a validation set would be used for something like this, while holding back the test set until the models been fine-tuned…but now I’m not sure if I’m confused!
Thanks so much.
Yes, it would be training and test, here’s more on the topic:
https://machinelearningmastery.com/difference-test-validation-datasets/
Why on
cv_results = model_selection.cross_val_score(model, X_train, Y_train, cv=kfold, scoring=scoring)
you use only the training part instead of the full set since it’s a cross-validation?
In this case I wanted to hold back a test set to evaluate the final chosen model.
Also, in case I want to use X, Y by themselves. How could I arrange them in a ordered manner so I don’t have totally random results because my classes aren’t the right ones?
Thank you.
Sorry, I don’t follow. Do do you have an example of what you mean?
If you directly use
cv_results = model_selection.cross_val_score(model, X, Y, cv=kfold, scoring=scoring)
With kfold = 3 for example. You will get 3 different groups, each with one type of iris flower because sklearn doesn’t shuffle it by its own and the dataset is arranged by flower-type.
You would have to use something like ShuffleSplit
http://scikit-learn.org/stable/modules/generated/sklearn.model_selection.ShuffleSplit.html
Before doing so.
Did you try this change, does it impact model skill as you suggest?
Yes it does. In 3 fold I was getting under 70% accuracy. Shuffling makes it more evenly distributed (not 3 totally different groups). And I could get 90%_ acc
Also, I figured that I could simply use the parameter “Shuffle=True” in .KFold
Nice!
Hi Jason,
Excellent way of explaining the basics of machine learning.
I assume that in almost all machine learning program if we are able to classify the data accurately then by applying algorithms we can understand much better about data .
classification is the key in supervised and clustering is the key in unsupervised learning is basics for a very good model.
Thanks a Lot.
I’m glad you found it useful.
Thanks for the tutorial, it is very helpful!
You’re welcome, I’m glad to hear that.
I am working on windows 8.1
I am trying to apply the example by using python 2.7.14 anaconda
when arrived on section 4.1:
# box and whisker plots
dataset.plot(kind=’box’, subplots=True, layout=(2,2), sharex=False, sharey=False)
plt.show()
My cmd console shows an error “nameerror : plt name not defined”
To solve this problem i have added the line:
import matplotlib.pyplot as plt
it works
Thank’s
Glad to hear you fixed your issue.
Hey! this is wonderful tutorial.
I goes through all the steps and it’s great.
One thing I want to know that which is best model:-
* Linear Discriminant Analysis (LDA)
with 0.96
* K-Nearest Neighbors (KNN).
with 0.9
It is up to the practitioner to choose the right model based on the complexity of the model and on mean and standard deviation of model skill results.
Here’s a really nit-picky observation: You have two sections labeled 5.3.
Nit-picking aside, this is an excellent starter for ML in Python. I am currently taking the Coursera / Stanford University / Dr. Andrew Ng Machine Learning course and being able to see some of these algorithms that we have been learning about in action is very satisfying. Thank you!
Thanks John, fixed section numbering.
How do you respond to all the comments?
It takes time every single day!
But I created this blog to hang out with people just as obsessed with ML as me, so it’s fun.
You Mentioned that
[ We will use 10-fold cross validation to estimate accuracy.
This will split our dataset into 10 parts, train on 9 and test on 1 and repeat for all combinations of train-test splits. ]
In you code, I understand that you split it in 10 parts, but where is the 9:1 ratio mentioned. Unable to get that
This is how cross-validation works, learn more here:
https://en.wikipedia.org/wiki/Cross-validation_(statistics)
Hi Dr. Jason,
When evaluating we found that KNN presented the best accuracy, KNN: 0.983333 (0.033333). But when the validation set was used in KNN to have the idea of the accuracy, I see that the accuracy now is 0.9 so it decreased, while is was expecting the same accuracy. Can I consider this as over fitting? I can consider that KNN over fitted the train data? Is this difference of accuracy in the same model while training and validating acceptable?
No, this is the stochastic variance of the algorithm. Learn more about this here:
https://machinelearningmastery.com/randomness-in-machine-learning/
Thank you.
I will learn more in the recommended site.
Best Regards.
Jason,
AWESOME ARTICLE, THANK YOU!
I’m glad it helped!
File “ml.py”, line 73, in
cv_results = model_selection.cross_val_score(model, X_train, Y_train, cv=kfold, scoring=scoring)
File “/usr/local/lib/python2.7/dist-packages/sklearn/model_selection/_validation.py”, line 342, in cross_val_score
pre_dispatch=pre_dispatch)
File “/usr/local/lib/python2.7/dist-packages/sklearn/model_selection/_validation.py”, line 206, in cross_validate
for train, test in cv.split(X, y, groups))
File “/usr/local/lib/python2.7/dist-packages/sklearn/externals/joblib/parallel.py”, line 779, in __call__
while self.dispatch_one_batch(iterator):
File “/usr/local/lib/python2.7/dist-packages/sklearn/externals/joblib/parallel.py”, line 625, in dispatch_one_batch
self._dispatch(tasks)
File “/usr/local/lib/python2.7/dist-packages/sklearn/externals/joblib/parallel.py”, line 588, in _dispatch
job = self._backend.apply_async(batch, callback=cb)
File “/usr/local/lib/python2.7/dist-packages/sklearn/externals/joblib/_parallel_backends.py”, line 111, in apply_async
result = ImmediateResult(func)
File “/usr/local/lib/python2.7/dist-packages/sklearn/externals/joblib/_parallel_backends.py”, line 332, in __init__
self.results = batch()
File “/usr/local/lib/python2.7/dist-packages/sklearn/externals/joblib/parallel.py”, line 131, in __call__
return [func(*args, **kwargs) for func, args, kwargs in self.items]
File “/usr/local/lib/python2.7/dist-packages/sklearn/model_selection/_validation.py”, line 458, in _fit_and_score
estimator.fit(X_train, y_train, **fit_params)
File “/usr/local/lib/python2.7/dist-packages/sklearn/linear_model/logistic.py”, line 1217, in fit
check_classification_targets(y)
File “/usr/local/lib/python2.7/dist-packages/sklearn/utils/multiclass.py”, line 172, in check_classification_targets
raise ValueError(“Unknown label type: %r” % y_type)
ValueError: Unknown label type: ‘unknown’
urgent help required
Confirm that you have copied all of the code and that your scipy/numpy/sklearn are all up to date.
Not sure if it’s been mentioned, but this line: “pandas.read_csv(url, names=names)”
did not work for me until I replaced https with http after looking up docs for read_csv
Thanks, Justin.
hey Jason Brownlee,
Thanks for the tutorial
I got an error after I build five models
“urllib.error.URLError: ”
Thanks
Sorry to hear that. Perhaps ensure that your environment is up to date?
Hello, Jason,
I am a beginner in python.
Unfortunately, when I load my dataset (it contains 4 features & 1 class “each with string datatype”), and then run the command
cv_results = model_selection.cross_val_score(model, X_train, Y_train, cv=kfold, scoring=scoring),
I found the following error:
ValueError: could not convert string to float:
Perhaps confirm that your data is all numerical?
Perhaps try converting it to float before using sklearn?
Jason, great tutorial, this is extremely helpful! A couple of questions:
1) I realize that this is just an example, but in general, is this the process that you personally use when you are building production models?
2) What would the next steps be in terms of taking this to the next level? Would you choose the model that you think performs best, and then attempt to tune it to get even better results?
Mostly, this is the process in more detail:
https://machinelearningmastery.com/start-here/#process
Hello,
The tutorial worked like a charm and I had no problem running it. However my need and that of a large number of linguists is different.
As a linguist [and there are many like me throughout the world] we need to identify relationships within a source language or between a source and a target language.
At present I use an automata approach which states
a->b in environment x
This however implies that rules have to be manually written by hand and in the “brave new world” of big data this becomes a huge problem.
I have searched and not located a simple tool which does this job using RNN. The existing tools are extremely complex and adapting them to suit a simple requirement of the type outlined above is practically impossible.
What I need is:
a. A tool which installs itself deploying Python and all accompanying libraries.
b. Asks for input of parallel data
c. generates out rules in the back ground
d. Provides an interface for testing by entering new data and seeing if the output works.
e. It should work on Windows. A large number of such prediction tools are Linux based depriving both Windows and Mac users the facility to deploy them. My Windows10 is hopefully Linux Compatible but I have never tested the shell.
f. Above all ease of use. A large number if not all Linguists are not very familiar with coding.
Do you know of any such tool ? And can such a tool be made available in Open Source. You would have the blessings of a large number of linguists who at present have to do the tedious task of generating out rules by hand and once again generating out new rules every time a sample not considered pops up.
I know the Wishlist above is quite voluminous.Hoping to get some good news
Best regards and thanks,
R. Doctor
Sounds like an interesting problem. I’m not aware of a tool.
Do you have some more information on this problem, e.g. some links to papers or blog posts?
Thanks for awesome tutorial….
I am facing issue in 4.1 section, while installing
dataset.plot(kind=’box’, subplots=True, layout=(2,2), sharex=False, sharey=False)
I am getting this error.
Traceback (most recent call last):
File “”, line 1, in
File “/usr/local/lib/python2.7/dist-packages/pandas/plotting/_core.py”, line 2677, in __call__
sort_columns=sort_columns, **kwds)
File “/usr/local/lib/python2.7/dist-packages/pandas/plotting/_core.py”, line 1902, in plot_frame
**kwds)
File “/usr/local/lib/python2.7/dist-packages/pandas/plotting/_core.py”, line 1729, in _plot
plot_obj.generate()
File “/usr/local/lib/python2.7/dist-packages/pandas/plotting/_core.py”, line 251, in generate
self._setup_subplots()
File “/usr/local/lib/python2.7/dist-packages/pandas/plotting/_core.py”, line 299, in _setup_subplots
layout_type=self._layout_type)
File “/usr/local/lib/python2.7/dist-packages/pandas/plotting/_tools.py”, line 197, in _subplots
fig = plt.figure(**fig_kw)
File “/usr/local/lib/python2.7/dist-packages/matplotlib/pyplot.py”, line 539, in figure
**kwargs)
File “/usr/local/lib/python2.7/dist-packages/matplotlib/backend_bases.py”, line 171, in new_figure_manager
return cls.new_figure_manager_given_figure(num, fig)
File “/usr/local/lib/python2.7/dist-packages/matplotlib/backends/backend_tkagg.py”, line 1049, in new_figure_manager_given_figure
window = Tk.Tk(className=”matplotlib”)
File “/usr/lib/python2.7/lib-tk/Tkinter.py”, line 1818, in __init__
self.tk = _tkinter.create(screenName, baseName, className, interactive, wantobjects, useTk, sync, use)
_tkinter.TclError: no display name and no $DISPLAY environment variable
Sorry to hear that, looks like your Python installation may be broken.
Perhaps this tutorial will sort things out:
https://machinelearningmastery.com/setup-python-environment-machine-learning-deep-learning-anaconda/
Jason, I am learning so much from your work (thanks 🙂
– my model scores are different to ones reported in the post (Section 5.4)? what could be the possible reasons?
(‘algorithm’, ‘accuracy’, ‘mean’, ‘std’)
LR: 0.966667 (0.040825)
LDA: 0.975000 (0.038188)
KNN: 0.983333 (0.033333)
CART: 0.983333 (0.033333)
NB: 0.975000 (0.053359)
SVM: 0.991667 (0.025000)
– What do the bars represent in Algorithm Comparison in Section 5.4? Take LDA for example, the stated accuracy and standard deviation are 0.98 and 0.04. The bar in the chart finishes at about 0.94 and the whisker at about 0.92. Take knn for another example, the stated accuracy and standard deviation are 0.98 and 0.03. However, the bar finishes at 1 and the whisker at 0.92. How do I interpret the bars and whiskers? Is y-axis accuracy?
– how to read the confusion matrix without labels? My guess is row and column (missing) labels represent actual and predicted classes, respectively. However, I am unsure about the order of classes. is there a way to switch on the labels?
I collected and annotated the code in a python script (iris.py), and placed it on the github: https://github.com/dr-riz/iris
The differences may be related to the stochastic nature of the algorithms:
https://machinelearningmastery.com/randomness-in-machine-learning/
You can learn more about box and whisker plots here:
https://en.wikipedia.org/wiki/Box_plot
You can learn more about the confusion matrix here:
https://machinelearningmastery.com/confusion-matrix-machine-learning/
Great annotations, please reference the URL of this blog post and the name of the blog as source.
Thanks for your reply and reminder. Credits and Source,URLs are now noted in README. 🙂
Re LDA example: the stated accuracy and standard deviation are 0.98 and 0.04. Yes, the box plot renders metrics such as minimum, first quartile, median, third quartile, and maximum but *not* necessarily mean. Hence, we don’t see mean and std in the box plot in Section 5.4.
I reproduce this with a simple example.
lda_model = LinearDiscriminantAnalysis()
lda_results = model_selection.cross_val_score(lda_model, X_train, Y_train, cv=10, scoring=’accuracy’)
np.size(lda_results) => 10 elements, 1 for each fold. Shouldn’t it for every test sample? ….separate investigation.
lda_results.max() # => 1
numpy.median(lda_results) # > 1
numpy.percentile(lda_results, 75) # => 1 — 3rd quartile
numpy.percentile(lda_results, 25) # => 0.9423 — 1st quartile: 0.94230769230769229
lda_results.min() # => 0.9091 — this is value whisker we see
lda_results.mean() # => 0.9749 — DONT expect to see in the plot
lda_results.std() # => 0.03849 — DONT expect to see in the plot
fig = plt.figure()
ax = fig.add_subplot(111)
plt.boxplot(lda_results)
ax.set_xticklabels([‘LDA’])
plt.show()
As expected, we don’t see mean and std in the box plot.
Thanks.
Cross validation is creating 10 models and evaluating each on 10 different and unique samples of your dataset.
Nice. Took me a little longer than 10 mins, but works as advertised. (I did everything under python3, no big difference I think.)
What would be really cool here would be a “what is going on here” section at the end. But it’s real nice to have something that actually runs, and be able to poke about with it it a bit.
Thanks Jason. Good stuff.
Well done. Nice suggestion, thanks.
Hello Jason, I wanted to ask you if the seed dataset can be treated like iris, using your tutorial I arrived at 97% accuracy, do you think it can still improve? The dataset site is: https: //archive.ics.uci.edu/ml/datasets/seeds.
Perhaps, though that is an impressive result.
So how would we obtain individual new predictions using our own input data after going through this exercise?
Train a final model:
https://machinelearningmastery.com/train-final-machine-learning-model/
Then call:
I am getting the syntax error pasted below at the start of the for loop to evaluate each model. I have made sure that I am copying and pasting it directly, and tried a few of my own fixes. Any help as to why this is occurring would be great! Thanks in advance!
for name, model in models:
File “”, line 1
for name, model in models:
^
SyntaxError: unexpected EOF while parsing
Ensure that you copy all of the code with the same formatting. White space has meaning in Python.
I put the requirements for this tutorial in a Dockerfile if anyone is interested: https://github.com/UnitasBrooks/docker-machine-learning-python
Thanks Joe.
The algorithms are instantiated with their default parameters. Is this a standard practise for spot checking algorithms?
You can specify some standard or common configurations as part of the checking.
I tried the above tutorial.But i got accuracies differ from the given above for the same dataset.why?also the boxplot for the same is changing each time
Yes, this is a feature not a bug, learn more here:
https://machinelearningmastery.com/randomness-in-machine-learning/
Hi Jason,
I think I downloaded the same dataset as you have here but the sepal-length data seems to have changed a bit. Not to worry though as you can easily follow the exact same steps except you just have to make predictions using SVC ()
LR: 0.966667 (0.040825)
LDA: 0.975000 (0.038188)
KNN: 0.983333 (0.033333)
CART: 0.966667 (0.040825)
NB: 0.975000 (0.053359)
SVM: 0.991667 (0.025000)
0.933333333333
[[ 7 0 0]
[ 0 10 2]
[ 0 0 11]]
precision recall f1-score support
Iris-setosa 1.00 1.00 1.00 7
Iris-versicolor 1.00 0.83 0.91 12
Iris-virginica 0.85 1.00 0.92 11
avg / total 0.94 0.93 0.93 30
It does give a better result which is nice.
Also I was wondering if you explain the confusion matrix anywhere on your website, I find it somewhat confusing 🙂
Yes, here is more on the confusion matrix:
https://machinelearningmastery.com/confusion-matrix-machine-learning/
What we predicted in the output with help of iris dataset
The model predicts the species based on flower measurements.
Hi Jason, watched your videos and you are awesome, can you tell me how to train our own image data database ans split into train and test sets, labels…thank you for listening to me…
I don’t have any videos.
Thank you so much..
You’re welcome.
Hi Jason,
Thanks for this great tutorial. It really helps.
Everything works fine except:
a. In Section 4.1 – HIstogram – the distribution in Sepal Length is quite different from yours. May be that’s due to the random nature of Machine Learning ?
b. In section 5.4 – Box and whisker plot: the plots for LR , LDA and CART are similar but for
KNN, SVM; I could only get a “+” sign at around 0.92 (no box and no whisker shown). For NB, I could only get 1 “+” sign at 0.92 and 1 “+” sign at around “0.83”.
Grateful if you could advise. Thanks.
I am using :
window 10, python 3.5.2 – Anaconda custom (64 bit)
scipy: 1.0.0
numpy: 1.13.3
matplotlib: 1.5.3
pandas: 0.18.1
statsmodels: 0.6.1
sklearn: 0.19.1
theano: 0.9.0.dev-unknown-git
Using TensorFlow backend.
keras: 2.1.2
Well done!
Thanks, but something goes “wrong”. Grateful if you could advise.
In section 5.4 – Box and whisker plot: the plots for LR , LDA and CART are similar to that shown in your web page
but for KNN, SVM; I could only get a “+” sign at around 0.92 (no box and no whisker shown). For NB, I could only get 1 “+” sign at 0.92 and 1 “+” sign at around “0.83”.
Interesting.
thank you so much for valuable blog.
I’m new to Python and ML. your blog is helped me a lot in learning.
in this I’ve not understand how data will train ( X_train , Y_train and )
thanks
Thanks.
Hello Jason,
This is amazing tutorial and it’s really helps me to understand well!!.. Please I want to know, do you have this type of tutorials for “pyspark” ? Can you suggest me any links, books, pdf or any tutorials? Thank you
Not at this stage, sorry.
It has a dependency with pillow library, but it is not mentioned, or did I miss something?
Does it?
Perhaps this is contingent on how you setup your environment?
Dear ,
Maybe you have the .py file of the tutorial? could you send it to me please
It is a part of this book:
https://machinelearningmastery.com/machine-learning-with-python/
Thank you, Jason Brownlee. I did run the entire scripts. It worked simply well on my MacBookPro. You are the best!
I’m glad to hear it, well done Jude!
Hi Jason,
Very nice tutorial.
I am getting error while running models. It is complaining about reshaping the data.
Following is the stacktrace
Traceback (most recent call last):
File “C:\eclipse_workspace\MachineLearning\Iris_Project\src\IrisLoadData.py”, line 86, in
trainData()
File “C:\eclipse_workspace\MachineLearning\Iris_Project\src\IrisLoadData.py”, line 30, in trainData
run_algorithms(X_train, Y_train, seed, scoring)
File “C:\eclipse_workspace\MachineLearning\Iris_Project\src\IrisLoadData.py”, line 79, in run_algorithms
cv_results = model_selection.cross_val_score(model, X_train, Y_train, cv=kfold, scoring=scoring)
File “C:\Python27\lib\site-packages\sklearn\model_selection\_validation.py”, line 342, in cross_val_score
pre_dispatch=pre_dispatch)
File “C:\Python27\lib\site-packages\sklearn\model_selection\_validation.py”, line 206, in cross_validate
for train, test in cv.split(X, y, groups))
File “C:\Python27\lib\site-packages\sklearn\externals\joblib\parallel.py”, line 779, in __call__
while self.dispatch_one_batch(iterator):
File “C:\Python27\lib\site-packages\sklearn\externals\joblib\parallel.py”, line 625, in dispatch_one_batch
self._dispatch(tasks)
File “C:\Python27\lib\site-packages\sklearn\externals\joblib\parallel.py”, line 588, in _dispatch
job = self._backend.apply_async(batch, callback=cb)
File “C:\Python27\lib\site-packages\sklearn\externals\joblib\_parallel_backends.py”, line 111, in apply_async
result = ImmediateResult(func)
File “C:\Python27\lib\site-packages\sklearn\externals\joblib\_parallel_backends.py”, line 332, in __init__
self.results = batch()
File “C:\Python27\lib\site-packages\sklearn\externals\joblib\parallel.py”, line 131, in __call__
return [func(*args, **kwargs) for func, args, kwargs in self.items]
File “C:\Python27\lib\site-packages\sklearn\model_selection\_validation.py”, line 458, in _fit_and_score
estimator.fit(X_train, y_train, **fit_params)
File “C:\Python27\lib\site-packages\sklearn\linear_model\logistic.py”, line 1216, in fit
order=”C”)
File “C:\Python27\lib\site-packages\sklearn\utils\validation.py”, line 573, in check_X_y
ensure_min_features, warn_on_dtype, estimator)
File “C:\Python27\lib\site-packages\sklearn\utils\validation.py”, line 441, in check_array
“if it contains a single sample.”.format(array))
ValueError: Expected 2D array, got 1D array instead:
array=[2.8 3. 3. 3.3 3.1 2.2 2.7 3.2 3.1 3.4 3.8 3. 3.3 2.4 2. 2.8 3.4 2.9
3.5 3.1 2.9 2.6 2.7 4.4 3.2 3.4 4. 2.6 2.5 3. 3. 3.2 2.9 3. 3. 3.8
3.2 3.2 3. 2.6 2.4 3.1 4.2 3. 3.2 3.5 3.8 2.8 2.9 3.7 2.5 3.4 2.8 3.
3.2 3.7 3.3 2.8 2.5 2.8 2.3 3.4 3.9 2.8 3. 3.7 2.7 3.2 3.4 2.8 2.3 3.1
3.1 3.6 3. 2.9 2.8 2.8 3.1 2.9 3. 2.7 3. 2.3 2.8 3.4 3.3 2.5 3.8 3.8
3.4 2.8 3. 3.5 3. 3. 2.2 3.4 3.2 3.2 2.5 2.5 3.3 2.7 2.6 2.9 2.7 3. ].
Reshape your data either using array.reshape(-1, 1) if your data has a single feature or array.reshape(1, -1) if it contains a single sample.
Could you please take a look and help me out?
Perhaps double check your loaded data meets your expectations?
Hi Jason,
Yeah I made some mistake while loading the data. I corrected it.
I have some questions.
What is confusion matrix and support in final result? Can you please tell about these things? For logistic regression/ classification algorithms, we need to calculate weights and we need to provide learning rate for cost function and we need to minimize it right? Is it taken care in python libraries?
Thank you,
Sunil
See this post on the confusion matrix:
https://machinelearningmastery.com/confusion-matrix-machine-learning/
I also got the same error about reshaping the data. I double checked the loading of my data and it’s loading fine. Not sure what the problem is. Any help will be appreciated. Great tutorial Jason!
I believe it’s a warning that you can safely ignore.
This was fun for my first Machine learning project. I was stuck on making pygames since I learned Python
Well done!
Hello,
I have a technical problem please! I have downloaded Anaconda 3.6 for windows in my desktop.However, I am unable to see Terminal window or Anaconda Prompt although I have the anaconda navigator installed. Is there something wrong?
Thank you very much for your advise,
Gopal.
Perhaps this post will help:
https://machinelearningmastery.com/multivariate-time-series-forecasting-lstms-keras/
I just want to say thank you this is very helpful!
You’re welcome, glad to hear that.
Very nice Machine Learning getting started like HelloWorld, Thanks
I’m glad it helped.
i get this error after the line
” cv_results = model_selection.cross_val_score(model, X_train, Y_train, cv=kfold, scoring=scoring) ”
Traceback (most recent call last):
File “”, line 1, in
File “C:\Users\HP\AppData\Local\Programs\Python\Python36-32\lib\site-packages\sklearn\model_selection\_validation.py”, line 335, in cross_val_score
scorer = check_scoring(estimator, scoring=scoring)
File “C:\Users\HP\AppData\Local\Programs\Python\Python36-32\lib\site-packages\sklearn\metrics\scorer.py”, line 274, in check_scoring
“‘fit’ method, %r was passed” % estimator)
TypeError: estimator should be an estimator implementing ‘fit’ method, [(‘LR’, LogisticRegression(C=1.0, class_weight=None, dual=False, fit_intercept=True,
intercept_scaling=1, max_iter=100, multi_class=’ovr’, n_jobs=1,
penalty=’l2′, random_state=None, solver=’liblinear’, tol=0.0001,
verbose=0, warm_start=False)), (‘LDA’, LinearDiscriminantAnalysis(n_components=None, priors=None, shrinkage=None,
solver=’svd’, store_covariance=False, tol=0.0001)), (‘KNN’, KNeighborsClassifier(algorithm=’auto’, leaf_size=30, metric=’minkowski’,
metric_params=None, n_jobs=1, n_neighbors=5, p=2,
weights=’uniform’)), (‘CART’, DecisionTreeClassifier(class_weight=None, criterion=’gini’, max_depth=None,
max_features=None, max_leaf_nodes=None,
min_impurity_decrease=0.0, min_impurity_split=None,
min_samples_leaf=1, min_samples_split=2,
min_weight_fraction_leaf=0.0, presort=False, random_state=None,
splitter=’best’)), (‘NB’, GaussianNB(priors=None)), (‘SVM’, SVC(C=1.0, cache_size=200, class_weight=None, coef0=0.0,
decision_function_shape=’ovr’, degree=3, gamma=’auto’, kernel=’rbf’,
max_iter=-1, probability=False, random_state=None, shrinking=True,
tol=0.001, verbose=False))] was passed
Sorry to hear that, I have not seen this error. Perhaps try updating your libraries?
Hey, I am getting the same error. Have you found a way to work around this?
Sorry, If its a very basic question. I am a newbie in Machine Learning. Was trying to understand the explanation.
I have a question at below code block, where we are splitting the dataset into input (X) and output(Y). What is the use of the output set ? What is its significance ?
# Split-out validation dataset
array = dataset.values
X = array[:,0:4]
Y = array[:,4]
validation_size = 0.20
seed = 7
X_train, X_validation, Y_train, Y_validation = model_selection.train_test_split(X, Y, test_size=validation_size, random_state=seed)
The output is the thing being predicted.
This post might help you understand how algorithms work:
https://machinelearningmastery.com/how-machine-learning-algorithms-work/
Jason, one more more clarification needed on the “output values” . In many articles , I have seen that ML works only on numeric values (even its of different type we need to convert it to numeric). Doesn’t it apply to the “output values” we are using ? Don’t we need to convert them to numeric ?
Generally, yes we do.
Great article for beginners. Thanks you very much. Jason do you have any more articles for more in depth knowledge?
Yes, start here:
https://machinelearningmastery.com/start-here/
Sir,
Through your article i have successfully installed python 2.7 anaconda and every stage i got it successful. Now as i tried to delve into this tutorial i am problems.
I first run a check on versions of libraries as you said and the result is okay:
Python: 2.7.14 |Anaconda custom (64-bit)| (default, Oct 15 2017, 03:34:40) [MSC
v.1500 64 bit (AMD64)]
scipy: 0.19.1
numpy: 1.13.3
matplotlib: 2.1.0
pandas: 0.20.3
sklearn: 0.19.1
The next step which is to import libraries and i did by copy and pasting into a script file running with this command: python script.py and not error shown.
Where i had problem is to load the dataset csv from ML repo.
As i execute the command to load dataset from a script file
i have the following error
—————————————————————————————-
Traceback (most recent call last):
File “script.py”, line 4, in
dataset = pandas.read_csv(url, names=names)
NameError: name ‘pandas’ is not defined
Please what is the issue here?
thanks
Perhaps you have two versions of Python installed accidentally?
I need to build own models. So,what’s the roadmap for that?
Hi Nadeera…Please clarify the goals of your model so that we may better assist you.
Got it now.
If i am correct, the initially supplied output values gives the model an inference that for some given set of inputs, this would be the output ? And finally, based on this my model will be trained and then work on the entirely new inputs provided to the system ?
Sorry, I don’t follow.
Just a minor suggestion which i encountered, pandas.tools.plotting is depricated,
use pandas.plotting instead.
Thanks 😀
Thanks, fixed.
Hello Jason,
I’m always fan of your tutorials. Please, have done any tutorials like this for explaining every algorithm in depth including mathematics behind them, how and what exactly happening in side the algorithm.
Thank you
I have two books that explain how algorithms work:
https://machinelearningmastery.com/products
Hello,
I get this error:
/anaconda3/lib/python3.6/site-packages/sklearn/utils/multiclass.py in check_classification_targets(y)
170 if y_type not in [‘binary’, ‘multiclass’, ‘multiclass-multioutput’,
171 ‘multilabel-indicator’, ‘multilabel-sequences’]:
–> 172 raise ValueError(“Unknown label type: %r” % y_type)
173
174
ValueError: Unknown label type: ‘continuous’
I am using my own dataset. What is wrong here?
Perhaps your dataset is the problem?
Hi Jason,
i’m also using my own dataset, and i get the same error as Martine above:
File “/Users/Hugues/anaconda3/lib/python3.6/site-packages/sklearn/utils/multiclass.py”, line 172, in check_classification_targets
raise ValueError(“Unknown label type: %r” % y_type)
ValueError: Unknown label type: ‘continuous’
I can check my dataset, but what should we be looking for ? I have used that dataset with the LSTM model without any error messages.
thanks
The multiclass.py code that is giving the error is:
if y_type not in [‘binary’, ‘multiclass’, ‘multiclass-multioutput’,
‘multilabel-indicator’, ‘multilabel-sequences’]:
raise ValueError(“Unknown label type: %r” % y_type)
line 172 is the last line
looks like ‘continuous’ is not expected. Where is ‘continuous’ coming from ?
my last column is binary, 0 or 1
googling this error code i find the following solution:
“You are passing floats to a classifier which expects categorical values as the target vector.”
I thought my last column is categorical because it contains only 1 and 0, but i guess i0’m wrong. Is there a way out ?
i changed my last column from 0 and 1 to ‘zero’ and ‘one’
now the error message changes to:
ValueError: Unknown label type: ‘unknown’
I’m getting closer….
Sorry, I have not seen this error before. Perhaps try posting to stackoverflow?
i found the problem now. This part of your code above has to be changed according to the number of columns of our data set:
So the 4 in X and Y needs to be changed. This seems obvious now but i’m new to Python and this is a rather dense language.
thanks a lot, the best output fo rmy data set is KNN with 85%. I will now try to improve on this by cleaning my data.
Why does it need to be changed?
Please change Section 2.1 out of date reference
CURRENT TEXT
from pandas.plotting import scatter_matrix
TO REVISED TEXT
from pandas.tools.plotting import scatter_matrix
as per comments already submitted
thanks
The “pandas.tools.plotting” is outdated.
The latest version of Pandas uses “pandas.plotting”.
Consider updating your version of Pandas to v0.22.0 or higher.
Learn more here:
https://pandas.pydata.org/pandas-docs/stable/visualization.html#scatter-matrix-plot
Hi Jason
Apologies if this has already been asked.
What would be the next step, therefore, if I wanted to apply this prediction to new data? I.e. if we got a new data set with just the measurements, how do we program the use of the predictions we’ve found to estimate the species?
P.s. great blog, really useful!
ah don’t worry, you can just apply knn.predict() to a new array of the sizes right? That’s easy
Correct.
Also see this post on creating a final model:
https://machinelearningmastery.com/train-final-machine-learning-model/
RE: is the validation dataset nugatory given the k-fold validation process
Whilst the idea of separating out a “final independent test data set (30 samples)” away from the k-fold cross validation process seems nice, is it not actually wasting the opportunity to develop and compare the N model types using the larger and therefore more useful data set within the k-fold process ?
In short, the k-fold process seems to already be doing everything that the hold-out sample is purporting to do.
Out another way, surely the hold out data is no more independent than the i(th) hold out data partitioned within i(th) k-kold execution ?
There are many approaches at estimating out of sample model skill. I recommend finding an approach that is robust for your specific problem.
Hello Jason,
This post is a great starting point – I am new to coding (with only basics at hand), python with lot of interest in ML. The post has got me started with it… I was able to run most of the tutorial successfully with few experiments by changing the graphs, seed values, kfolds etc. Few questions though –
1. In one of the answers you have explained how kfold works on February 17, 2017 –
Now in the for loop, where you define kfold for a model at hand, that split is done only once right? I mean e.g. for LR, being first model to evaluate, we split the data of 120 in 10 folds with 12 items in each. Then as explained in the above post – The model is trained on the first 9 folds and evaluated on the records in the 10th. When we go for next set of 9, we are NOT resplitting the 120 items in new 10 sets right?
2. Also, when you say model is trained on first 9 folds – It means that we are looking at the relationships of the 4 numeric values and the class (out of 3 – Iris-setosa, Iris-versicolor, Iris-virginica) which they belong to, right?
3. When the dataset is split between X and Y values (Y being the output/ result of relationships between 4 values in X), where in the code are we actually mentioning this? I mean how/ where does the algorithm gets to know that X are the independent variables and Y is the dependent variable in which we want to classify our data?
Thanks a lot!
Pallavee
No, the same split into folds is reused with a new model fit and evaluated on different sets each time, systematically.
Yes, a fit model really means a learned mapping from inputs to outputs:
https://machinelearningmastery.com/how-machine-learning-algorithms-work/
We specify the inputs and outputs to the model as separate parameters in sklearn.
Hi Jason,
I am getting below errors.
Statement: from pandas.plotting import scatter_matrix
throws error as “No module named plotting”
Statement: from sklearn import model_selection
throws error as “cannot import name model_selection”
Regards
Raghavendra
You will need to update your version of pandas and sklearn to the latest versions.
Hi Jason on my dataset I used kfold but couldn’t find any significant difference. Can you explain why this may happen. Also, does using kfold cross_validation lead to overfitting?
P.S:
with cross_validation without cross_validation
LogisticRegression 0.816 0.816
LinearDiscriminantAnalysis 0.806 0.806
KNeighborsClassifier 0.79 0.79
DecisionTreeClassifier 0.810 0.816
GaussianNB 0.803 0.803
SVC 0.833 0.833
LinearSVC 0.806 0.806
SGDClassifier 0.7525 0.620
RandomForestClassifier 0.833 0.803
Both do the same job of performing k-fold cross validation.
You can overfit when evaluating models with cross validation, although it is less likely on average than using other evaluation methods.
Excellent tutorial Jason, and thanks very much for it.
One noob question here though –
Where do ‘dataset’ and ‘plt’ get associated in the code above? I ask this coz I don’t see any code where we are associating ‘dataset’ and ‘plt’; and yet when we call ‘plt.show()’, the plot that gets drawn has data from the ‘dataset’.
The dataset is loaded:
plt is the pyplot library
A search on the page (control-f) would have helped you discover this for yourself.
Thanks Jason, but that i know.
Let me try to make my question clearer –
From the examples I studied to understand pyplot, the recurring idea is
1. set the range to be plotted along the x-axis [ let’s says that’s e ]
2. provide the corresponding values to be plotted along the y-axis [ let’s say that’s f ]
3. Steps 1 and 2 are accomplished by the call – ‘plt.plot( e, f )’
4. After the call to ‘plot’, the call to ‘show’ is made which will display the plot
ex:
e = np.arange(0.0, 2.0, 0.01)
f = 1 + np.sin(2*np.pi*t)
plt.plot(e, f)
plt.show()
As you can see, the call to ‘plot’ provides the values to ‘plt’ and the call to ‘show’ will cause the plotting and display of the same from ‘plt’.
However, in your example, I don’t see any line which is equivalent to the ‘plot’ call.
So my question is – When and where does ‘plt’ get the values from ‘dataset’ that it uses to draw the plot?
I hope it’s clearer now.
Here, I use pandas to make the calls to matplotlib via the pandas DataFrame (called dataset), then call plt.show().
I installed Anaconda according to your instructions (https://machinelearningmastery.com/setup-python-environment-machine-learning-deep-learning-anaconda/) but as I go to run python and check the versions of libraries I get this:
… import numpy
Traceback (most recent call last):
File “”, line 2, in
ImportError: No module named numpy
How can I get passed this.
It looks like numpy is not installed or you are trying to run code in a different version of Python from anaconda.
Hello Jason,
I have a project in which it should predict the disease by specifying the symptoms.How can I implement this and can you please help me with the attributes of symptoms and all.
I recommend this process:
https://machinelearningmastery.com/start-here/#process
Thank you very much jason… for the great tutorial.
its really great aratical…its help so much to our project..thanks…
I’m glad it helped.
Hi Jason,
Well I got the example running but only after I deleted “scoring=scoring” in code below:
for name, model in models:
kfold = model_selection.KFold(n_splits=10, random_state=seed)
cv_results = model_selection.cross_val_score(model, X_train, Y_train, cv=kfold, scoring=scoring)
results.append(cv_results)
names.append(name)
msg = “%s: %f (%f)” % (name, cv_results.mean(), cv_results.std())
With “scoring=scoring” I received error message something like “scoring not defined”.
Then when I added “scoring=scoring” back I did not received the error and the program runs fine.
What could this be?
Anyhow, great tutorial.
Regards,
Cor
Glad to hear you overcame your issue.
you might have missed a snippet from earlier in the example where “scoring” was assigned.
Hi Jason,
cv_results = model_selection.cross_val_score(model, X_train, Y_train, cv=kfold, scoring=scoring)
After typing that line in my command prompt, it shows this error:
Traceback (most recent call last):
File “”, line 1, in
NameError: name ‘model’ is not defined
I tried copy pasting that line directly offthe tutorial, I still faced the same error. What should I do??
I think you may have missed some lines of code from the tutorial.
I did get this exact error also. Then when I removed “scoring=scoring”, thinking ‘well, maybe the compliler or whatever is smart enough to deal with this’ , the code worked as expected. Then when I reinserted “scoring=scoring”, I did not get the error meassage and the code continued to run as expected.
When I run this code
fig = plt.figure()
fig.suptitle(‘Algorithm Comparison’)
ax = fig.add_subplot(111)
plt.boxplot(results)
ax.set_xticklabels(names)
plt.show()
i get this error
TypeError: cannot perform reduce with flexible type
and i get a blank graph where x_axis and y_axis both are labelled from 0.0-1.0 at every 0.2 interval.
How do I fix it?
Sorry, I have not see this fault, perhaps post to stackoverflow?
what algorithm should i use for weather prediction
As far as I know, modern weather forecasting uses physical models, not machine learning methods.
That being said, if you do want to explore ML methods for weather forecasting, I would recommend this process:
https://machinelearningmastery.com/start-here/#process
from pandas.plotting import scatter_matrix
That did not work until I used
from pandas import scatter_matrix
Maybe this can help someone also.
Interesting, perhaps you need to update your version of Pandas?
Here is the API for “pandas.plotting.scatter_matrix”:
https://pandas.pydata.org/pandas-docs/stable/visualization.html#scatter-matrix-plot
Just started your tutorial. Looks like the best introduction to machine learning. I’m getting the following error while trying to load the iris dataset. Would appreciate your assistance in correcting my problem. Thanks.
============= RESTART: /Users/TinkersHome/Documents/load_data.py =============
>>> dataset = pandas.read_csv(url, names=names)
Traceback (most recent call last):
File “/Library/Frameworks/Python.framework/Versions/3.6/lib/python3.6/urllib/request.py”, line 1318, in do_open
encode_chunked=req.has_header(‘Transfer-encoding’))
File “/Library/Frameworks/Python.framework/Versions/3.6/lib/python3.6/http/client.py”, line 1239, in request
self._send_request(method, url, body, headers, encode_chunked)
File “/Library/Frameworks/Python.framework/Versions/3.6/lib/python3.6/http/client.py”, line 1285, in _send_request
self.endheaders(body, encode_chunked=encode_chunked)
File “/Library/Frameworks/Python.framework/Versions/3.6/lib/python3.6/http/client.py”, line 1234, in endheaders
self._send_output(message_body, encode_chunked=encode_chunked)
File “/Library/Frameworks/Python.framework/Versions/3.6/lib/python3.6/http/client.py”, line 1026, in _send_output
self.send(msg)
File “/Library/Frameworks/Python.framework/Versions/3.6/lib/python3.6/http/client.py”, line 964, in send
self.connect()
File “/Library/Frameworks/Python.framework/Versions/3.6/lib/python3.6/http/client.py”, line 1400, in connect
server_hostname=server_hostname)
File “/Library/Frameworks/Python.framework/Versions/3.6/lib/python3.6/ssl.py”, line 407, in wrap_socket
_context=self, _session=session)
File “/Library/Frameworks/Python.framework/Versions/3.6/lib/python3.6/ssl.py”, line 814, in __init__
self.do_handshake()
File “/Library/Frameworks/Python.framework/Versions/3.6/lib/python3.6/ssl.py”, line 1068, in do_handshake
self._sslobj.do_handshake()
File “/Library/Frameworks/Python.framework/Versions/3.6/lib/python3.6/ssl.py”, line 689, in do_handshake
self._sslobj.do_handshake()
ssl.SSLError: [SSL: CERTIFICATE_VERIFY_FAILED] certificate verify failed (_ssl.c:777)
Sorry, I have not seen this error. Perhaps try searching/posting on stackoverflow for the error message?
Hello experts,
When practise 5.Algorithm, I encountered this error message. Also checked all the installed tools & packages, which are all up-to-date.
Kindly please help me to fix it, thanks very much.
>>> # Spot Check Algorithms
… models = []
>>> models.append((‘LR’, LogisticRegression()))
>>> models.append((‘LDA’, LinearDiscriminantAnalysis()))
>>> models.append((‘KNN’, KNeighborsClassifier()))
>>> models.append((‘CART’, DecisionTreeClassifier()))
>>> models.append((‘NB’, GaussianNB()))
>>> models.append((‘SVM’, SVC()))
>>> # evaluate each model in turn
… results = []
>>> names = []
>>> for name, model in models:
… kfold = model_selection.KFold(n_splits=10, random_state=seed)
File “”, line 2
kfold = model_selection.KFold(n_splits=10, random_state=seed)
^
IndentationError: expected an indented block
>>> cv_results = model_selection.cross_val_score(model, X_train, Y_train, cv=kfold, scoring=scoring)
Traceback (most recent call last):
File “”, line 1, in
NameError: name ‘model’ is not defined
>>> results.append(cv_results)
Traceback (most recent call last):
File “”, line 1, in
NameError: name ‘cv_results’ is not defined
>>> names.append(name)
Traceback (most recent call last):
File “”, line 1, in
NameError: name ‘name’ is not defined
>>> msg = “%s: %f (%f)” % (name, cv_results.mean(), cv_results.std())
Traceback (most recent call last):
File “”, line 1, in
NameError: name ‘name’ is not defined
>>> print(msg)
Traceback (most recent call last):
File “”, line 1, in
NameError: name ‘msg’ is not defined
Ensure that you copy all of the code for the example and that your indenting matches the example in the tutorial.
I will retry. Thank you very much Jason. Cheers!
Hang in there!
Hi Jason,
Great tutorial, thanks!
I got an unique error that no one had posted here – special…
The error is at this line:
cv_results = cross_val_score(model, X_train, y_train, cv=kfold, scoring=’accuracy’)
And it says: ValueError: This solver needs samples of at least 2 classes in the data, but the data contains only one class: 0.0
But my X_train.shape shows (52480L, 25L) and my y_train.shape is (52480L,).
Any ideas please?
Thanks,
Alan
Hi Alan, it means that your data does not have enough examples in each class.
The dataset may be highly imbalanced.
If so, this post might give you some ideas:
https://machinelearningmastery.com/tactics-to-combat-imbalanced-classes-in-your-machine-learning-dataset/
Added the following lines to my load dataset file & now all is well:
import ssl
ssl._create_default_https_context = ssl._create_unverified_context
Nice one!
Hello, Mr Jason!
I’m learning ML and PLN and i have a lot of doubts:
you can recommend some article, blog (and so on) to learn more about this? I have to implement a model switching different classifiers for predict/discriminate a class. The model is described below:
– I have a set S of words;
– Each word W of S is a class for prediction;
Two different of vector of features are used:
1 – The first is a vector which use PMI score between W and n-gram ocurring before W and PMI between W and n-gram placed after W. Then, the vector length is twice length of S (set of words);
2 – Other is a vector of 500 most words (vocabulary) ocurring in a context (variable size) surrounding all words of S. If the word (feature) exists in a sentence for training, the vector puts ‘1’ or ‘0’, otherwise. Frequency of word on document (context/sentence) don’t matter here.
I know that i have to vectorize features and create a array of counts, but i can’t understand even a little about what way i’ve to follow after that steps (roughly explained).
Basically, above informations are the most important.
Finally, i wanna use the different classifiers in a “plugable” way. Its possible?
Thanks in advance.
My best advice for getting started with NLP is here:
https://machinelearningmastery.com/start-here/#nlp
Great tutorial!
In my case, I am POSTing the IRIS data to a Flask web service, but I don’t see how to get that data into a pandas dataframe using any of the “read_csv” or other methods available. I tried to use io.String(csv_variable), then using read_csv on that, but it still doesn’t work.
Suggestions?
Thanks,
Perhaps try posting the question to stackoverflow?
Hi Jason!
First of all, great introduction to cross validation! Your tutorial is comprehensive and I appreciate that you went through everything step-by-step as much as possible.
Just a question regarding section 5.3 Build Models. This was taken from your code directly:
cv_results = model_selection.cross_val_score(model, X_train, Y_train, cv=kfold, scoring=scoring)
As I have looked at other websites on cross validation as well, I am confused on the X and y inputs. Should it be X_train and Y_train or X and Y (original target and data)? Because I looked at sklearn documentation (http://scikit-learn.org/stable/modules/cross_validation.html#cross-validation), it seems that the original target and data were used instead, and they did not perform a train_test_split to obtain X_train and Y_train.
Please clarify. Thank you!
The goal in this part is to evaluate the skill of the model. The data would be the training data, a sample of data from your domain.
Perhaps this post would clear things up for you:
https://machinelearningmastery.com/difference-test-validation-datasets/
What is the main objective of this project?
To teach you something.
The model will learn the relationship between flower measurements and iris flower species. Once fit, it can be used to predict the flower species for new flower measurements.
I believe there are many more pleasurable opportunities ahead for individuals that looked at your site.
Thanks.
for name, model in models:
kfold = model_selection.KFold(n_splits=10, random_state=seed)
cv_results = model_selection.cross_val_score(model, X_train, Y_train, cv=kfold, scoring=scoring)
results.append(cv_results)
names.append(name)
msg = “%s: %f (%f)” % (name, cv_results.mean(), cv_results.std())
print(msg)
I could not run this code, please help me out
Why not? What was the problem?
Great example to see what you can and can’t do with your data.
I ran this with my own sample and well, did not get over 70% accuracy so it looks like my data is just not good 😛
I just had to do some small adjustment since this line is hard-coded:
# Split-out validation dataset
array = dataset.values
X = array[:,0:4]
Y = array[:,4]
validation_size = 0.20
seed = 7
X_train, X_validation, Y_train, Y_validation = model_selection.train_test_split(X, Y, test_size=validation_size, random_state=seed)
I had to change it because my dataset has only 3 independent variables:
# Split-out validation dataset
array = dataset.values
n = dataset.shape[1]-1
X = array[:,0:n]
Y = array[:,n]
validation_size = 0.20
seed = 7
X_train, X_validation, Y_train, Y_validation = model_selection.train_test_split(X, Y, test_size=validation_size, random_state=seed)
I think this should work regardless of the number of attributes in any given dataset(?)
Nice.
i need to build a taxi passenger seeking system using machine learning, i am a beginner. how should i go about it? please suggest some relevant source codes for reference
Perhaps this process will help:
https://machinelearningmastery.com/start-here/#process
Excelnt guide, thank you
What enviroment you need to plot?
Thanks.
What do you mean by environment?
Thanks for the tutorial. When I run the code, the Support Vector Machine got the best score (precision 0.94), while the knn got precision 0.90, as in your example. I am using Python 3. Is the different result caused by the global warming? 🙂
Nice work.
A difference in results is caused by the stochastic nature of the algorithms:
https://machinelearningmastery.com/randomness-in-machine-learning/
I have Python: 2.7.10 (default, May 23 2015, 09:40:32) and the following versions of the libraries:
scipy: 0.15.1
numpy: 1.9.2
matplotlib: 1.4.3
pandas: 0.16.2
sklearn: 0.18.1
I have modified your example considering the following structure for the dataset:
Age Weight Height Metbio RH Tair Trad PMV TSV gender
0 61 61.4 175 2.14 31.98 21.35 20.58 -0.38 0 male
1 39 81.0 178 2.19 46.88 24.25 24.09 0.30 1 male
[…]
All works fine, except for the following part:
I have created a validation dataset considering:
# Split-out validation dataset
array = dataset.values
X = array[:,0:8]
#the line above is interpreted as “all rows for columns 0 through 8”
Y = array[:,9]
#the line above is interpreted as “all rows for column 9”
validation_size = 0.20
# 20% as a validation dataset
seed = 7
#what does this parameter means?
X_train, X_validation, Y_train, Y_validation = model_selection.train_test_split(X, Y, test_size=validation_size, random_state=seed)
Now when I try to built and evaluate the 6 models with this code:
# Spot Check Algorithms
models = []
models.append((‘LR’, LogisticRegression()))
models.append((‘LDA’, LinearDiscriminantAnalysis()))
models.append((‘KNN’, KNeighborsClassifier()))
models.append((‘CART’, DecisionTreeClassifier()))
models.append((‘NB’, GaussianNB()))
models.append((‘SVM’, SVC()))
# evaluate each model in turn
results = []
names = []
for name, model in models:
kfold = model_selection.KFold(n_splits=10, random_state=seed)
cv_results = model_selection.cross_val_score(model, X_train, Y_train, cv=kfold, scoring=scoring)
results.append(cv_results)
names.append(name)
msg = “%s: %f (%f)” % (name, cv_results.mean(), cv_results.std())
print(msg)
It appears this message:
>>> # Spot Check Algorithms
… models = []
>>> models.append((‘LR’, LogisticRegression()))
>>> models.append((‘LDA’, LinearDiscriminantAnalysis()))
>>> models.append((‘KNN’, KNeighborsClassifier()))
>>> models.append((‘CART’, DecisionTreeClassifier()))
>>> models.append((‘NB’, GaussianNB()))
>>> models.append((‘SVM’, SVC()))
>>> # evaluate each model in turn
… results = []
>>> names = []
>>> for name, model in models:
… kfold = model_selection.KFold(n_splits=10, random_state=seed)
File “”, line 2
kfold = model_selection.KFold(n_splits=10, random_state=seed)
^
IndentationError: expected an indented block
>>> cv_results = model_selection.cross_val_score(model, X_train, Y_train, cv=kfold, scoring=scoring)
Traceback (most recent call last):
File “”, line 1, in
NameError: name ‘model’ is not defined
>>> results.append(cv_results)
>>> names.append(name)
Traceback (most recent call last):
File “”, line 1, in
NameError: name ‘name’ is not defined
>>> msg = “%s: %f (%f)” % (name, cv_results.mean(), cv_results.std())
Traceback (most recent call last):
File “”, line 1, in
NameError: name ‘name’ is not defined
>>> print(msg)
Traceback (most recent call last):
File “”, line 1, in
NameError: name ‘msg’ is not defined
>>>
Could you explain how can I solve?
I have tried also anaconda prompt and the following versions:
Python 3.6.1 |Anaconda 4.4.0 (64-bit)| (default, May 11 2017, 13:25:24)
scipy: 0.19.0
numpy: 1.12.1
matplotlib: 2.0.2
pandas: 0.20.1
sklearn: 0.18.1
Same error when I try to build and evaluate the six models considering the script of paragraph 5.3
Versions look ok. Ensure you have all proceeding code for each example.
Looks like a copy-paste error.
Ensure you copy all of the code and maintain the same indenting.
Solved considering this post:
https://machinelearningmastery.com/machine-learning-in-python-step-by-step/#comment-431754
Hi Jason,
Your Instruction were great. I am new to coding and I would like to know if you have codes for fantasy sports. Will the process above work with fantasy sports.
Not at this stage. I have worked on sports datasets using rating systems and had great success:
https://en.wikipedia.org/wiki/Elo_rating_system
how long will it take to run the program? i follow all instruction, and there is no errors, but still running and only get the first graph, and the dataset description? is it take to long to complete run ? note i use windows 7
Seconds. No more than minutes.
so what do you think is the problem?
I have done like this and its just work till # histograms, there problem the pycharm 3 does not show any error.
# Load libraries
import pandas
from pandas.plotting import scatter_matrix
import matplotlib.pyplot as plt
from sklearn import model_selection
from sklearn.metrics import classification_report
from sklearn.metrics import confusion_matrix
from sklearn.metrics import accuracy_score
from sklearn.linear_model import LogisticRegression
from sklearn.tree import DecisionTreeClassifier
from sklearn.neighbors import KNeighborsClassifier
from sklearn.discriminant_analysis import LinearDiscriminantAnalysis
from sklearn.naive_bayes import GaussianNB
from sklearn.svm import SVC
# Load dataset
url = “https://archive.ics.uci.edu/ml/machine-learning-databases/iris/iris.data”
names = [‘sepal-length’, ‘sepal-width’, ‘petal-length’, ‘petal-width’, ‘class’]
dataset = pandas.read_csv(url, names=names)
# shape
print(dataset.shape)
# head
print(dataset.head(20))
# descriptions
print(dataset.describe())
# class distribution
print(dataset.groupby(‘class’).size())
# box and whisker plots
dataset.plot(kind=’box’, subplots=True, layout=(2,2), sharex=False, sharey=False)
plt.show()
# histograms
dataset.hist()
plt.show()
# scatter plot matrix
scatter_matrix(dataset)
plt.show()
# Split-out validation dataset
array = dataset.values
X = array[:,0:4]
Y = array[:,4]
validation_size = 0.20
seed = 7
X_train, X_validation, Y_train, Y_validation = model_selection.train_test_split(X, Y, test_size=validation_size, random_state=seed)
# Test options and evaluation metric
seed = 7
scoring = ‘accuracy’
# Spot Check Algorithms
models = []
models.append((‘LR’, LogisticRegression()))
models.append((‘LDA’, LinearDiscriminantAnalysis()))
models.append((‘KNN’, KNeighborsClassifier()))
models.append((‘CART’, DecisionTreeClassifier()))
models.append((‘NB’, GaussianNB()))
models.append((‘SVM’, SVC()))
# evaluate each model in turn
results = []
names = []
for name, model in models:
kfold = model_selection.KFold(n_splits=10, random_state=seed)
cv_results = model_selection.cross_val_score(model, X_train, Y_train, cv=kfold, scoring=scoring)
results.append(cv_results)
names.append(name)
msg = “%s: %f (%f)” % (name, cv_results.mean(), cv_results.std())
print(msg)
# Compare Algorithms
fig = plt.figure()
fig.suptitle(‘Algorithm Comparison’)
ax = fig.add_subplot(111)
plt.boxplot(results)
ax.set_xticklabels(names)
plt.show()
# Make predictions on validation dataset
knn = KNeighborsClassifier()
knn.fit(X_train, Y_train)
predictions = knn.predict(X_validation)
print(accuracy_score(Y_validation, predictions))
print(confusion_matrix(Y_validation, predictions))
print(classification_report(Y_validation, predictions))
Perhaps try and run from the command line, not an editor. The editor or notebook can hide output messages and error messages.
i have solved the problem, where i should should close the figures and the results will be displayed, I have tried to change the dataset for example to Heart Dataset, where there are 14 attributes and only two classes, for sure there were an errors. Sir, if I use the heart dataset in which part of the project should I do the modifications? thanks in advance I’m just started to learn Python in Machine learning. your help is really appreciated
This process will help you work through your problem systematically:
https://machinelearningmastery.com/start-here/#process
Jason,
Thanks a bunch for the awesome example. Like others I received 0.991667 for SVM.
The problem, however, I am having relates to the last step – getting prediction values. Below you can find my stack trace.
NOTE: I am mac with python 2.7
Any clue?
—–
ValueError Traceback (most recent call last)
in ()
3 knn.fit(X_train, Y_train)
4 predictions = knn.predict(X_validation)
—-> 5 print(accuracy_score(Y_validation, predictions))
6 print(confusion_matrix(Y_validation, predictions))
7 print(classification_report(Y_validation, predictions))
/usr/local/lib/python2.7/site-packages/sklearn/metrics/classification.pyc in accuracy_score(y_true, y_pred, normalize, sample_weight)
174
175 # Compute accuracy for each possible representation
–> 176 y_type, y_true, y_pred = _check_targets(y_true, y_pred)
177 if y_type.startswith(‘multilabel’):
178 differing_labels = count_nonzero(y_true – y_pred, axis=1)
/usr/local/lib/python2.7/site-packages/sklearn/metrics/classification.pyc in _check_targets(y_true, y_pred)
69 y_pred : array or indicator matrix
70 “””
—> 71 check_consistent_length(y_true, y_pred)
72 type_true = type_of_target(y_true)
73 type_pred = type_of_target(y_pred)
/usr/local/lib/python2.7/site-packages/sklearn/utils/validation.pyc in check_consistent_length(*arrays)
202 if len(uniques) > 1:
203 raise ValueError(“Found input variables with inconsistent numbers of”
–> 204 ” samples: %r” % [int(l) for l in lengths])
205
206
ValueError: Found input variables with inconsistent numbers of samples: [4, 30]
—–
I have not seen this error sorry. Perhaps double check that you have copied all of the code?
Found it!!!
Did try to make some changes in the code but forgot to reverted it back 🙁
Thanks a lot. That is an awesome example!
Glad to hear it Daniel.
Hi Jason,
I have a dataset structured as reported here:
https://app.box.com/s/mi97crz44bz2r7f96wy2z6ztf68ohm87
(you can download it here: https://app.box.com/s/c2bxylfe2ggibledjncui05gez13thuo )
It is composed by 9871 rows e 5 columns:
https://app.box.com/s/xasyyqbhtsmov9gqnvg7siop470pgpvg
When I try to describe it only the first and second column are considered:
https://app.box.com/s/9wez8izysrfwivns0sus6ql2ahkq3jc1
Also if I try to plot a scatter matrix, the data of the first and second column are considered:
https://app.box.com/s/41x56gxd5bil0c4e0tz000433phoho2v
Nice work. Note none of your links work.
I have solved the issue and cancelled the folder.
Great!
till step 5.2 its fine for me but from point 5.3 am getting error as below:-
# Spot Check Algorithms
… models = []
>>> models.append((‘LR’, LogisticRegression()))
Traceback (most recent call last):
File “”, line 1, in
NameError: name ‘LogisticRegression’ is not defined
>>> models.append((‘LDA’, LinearDiscriminantAnalysis()))
Traceback (most recent call last):
File “”, line 1, in
NameError: name ‘LinearDiscriminantAnalysis’ is not defined
>>> models.append((‘KNN’, KNeighborsClassifier()))
Traceback (most recent call last):
File “”, line 1, in
NameError: name ‘KNeighborsClassifier’ is not defined
>>> models.append((‘CART’, DecisionTreeClassifier()))
Traceback (most recent call last):
File “”, line 1, in
NameError: name ‘DecisionTreeClassifier’ is not defined
>>> models.append((‘NB’, GaussianNB()))
Traceback (most recent call last):
File “”, line 1, in
NameError: name ‘GaussianNB’ is not defined
>>> models.append((‘SVM’, SVC()))
Traceback (most recent call last):
File “”, line 1, in
NameError: name ‘SVC’ is not defined
>>> # evaluate each model in turn
… results = []
>>> names = []
>>> for name, model in models:
… kfold = model_selection.KFold(n_splits=10, random_state=seed)
File “”, line 2
kfold = model_selection.KFold(n_splits=10, random_state=seed)
^
IndentationError: expected an indented block
>>> cv_results = model_selection.cross_val_score(model, X_train, Y_train, cv=kfold, scoring=scoring)
Traceback (most recent call last):
File “”, line 1, in
NameError: name ‘model_selection’ is not defined
>>> results.append(cv_results)
Traceback (most recent call last):
File “”, line 1, in
NameError: name ‘cv_results’ is not defined
>>> names.append(name)
Traceback (most recent call last):
File “”, line 1, in
NameError: name ‘name’ is not defined
>>> msg = “%s: %f (%f)” % (name, cv_results.mean(), cv_results.std())
Traceback (most recent call last):
File “”, line 1, in
NameError: name ‘name’ is not defined
>>> print(msg)
It looks like you are not preserving the indenting of the code. White space is important in python, the tabs and new lines must be preserved.
ok i’ll try it on ipython may be directly copy paste into command line might have done this and one more thing do i have to define alogo names in square brackets and define the seed values in results square brackets
Below is the code i am trying to run:-
Where can we see the visual representation of variate and univariate plots? I’m only seeing textual representation of the data. Please notify where to type dataset.plot(.. code
My bad,I never used the plt.show() function to visualize my data. I can see the plots very nicely.
Perhaps it would help you to re-read section 4 of the above tutorial?
Hi Jason, I really found your guide useful and easy to follow. I am developing my Master Thesis and I am trying to apply ML to predict electricity prices (therefore numerical class). Which algorithm would you recommend me more (more than one if it is possible)?
As far as I know, classification algorithms are used in those cases where the class is binary like in this example. Why do we compare regression model with other classification models in this example then? Does that make sense? Can regression models be applied for classification purposes and vice versa?
Again thanks for your help and your time.
If you are predicting a quantity, you will want to use regression algorithms. I would recommend testing a suite of methods to see which works best on your specific dataset.
Here is more info on the difference between regression and classification:
https://machinelearningmastery.com/classification-versus-regression-in-machine-learning/
Why is that same dataset gave two different best machine learning models using two different tools, LDA with R and KNN with Python?
What do you mean exactly?
Well explained concept. Kudos to you.
Thanks!
What is “seed” ?
Good question.
The random number generator used in the splitting of data and within some of the algorithms is actually a pseudorandom number generator. We can seed it so that it will generate the same sequence of random numbers each time the code is run. This helps in tutorials so that you can get the same results that I got.
Learn more about this here:
https://machinelearningmastery.com/randomness-in-machine-learning/
Hi Jason,
Thank you for the explanation. please find the below questions
1. I changed file name to iris22==> it gave error OK
2. I removed all data in iris.data ==> it gave the same output.
3. If any changes in the iris.data file does not change the output
Can you please explain.
Mathews
Perhaps confirm that your modified file is still being loaded and used in the code?
Then is that command not required to actually run the code? Only to run it in a specific manner?
Here is information on how to run a script from the command line:
https://machinelearningmastery.com/faq/single-faq/how-do-i-run-a-script-from-the-command-line
Hey Jason,
I trained my data on a linear regression model, now I want to predict the value of label based on the values of indicators that the user inputs. Can this be done?
I’m really not getting it anywhere.
Please help me out
Linear regression is a model for predicting a quantity, not a label.
This post might clear things up for you:
https://machinelearningmastery.com/classification-versus-regression-in-machine-learning/
I just want to say that this was fantastic. Knew the basics of Python and had it installed already, and everything worked without a hitch.
In my case I just wanted to get a sense of what’s involved on a step by step level in machine learning but I’m definitely not a data scientist and only somewhat a developer, so while some of the concepts that came up are not familiar (not yet anyway) the whole thing gave me a good feel for what it would be like. Well done.
Thanks Jeffrey, well done!
cv_results=model_selection.cross_val_score(model,X_train, Y_train, cv=kfold, scoring=scoring)
Traceback (most recent call last):
File “”, line 1, in
NameError: name ‘model’ is not defined
plz help me Sir i’ll b very thankful to you
Ensure you copy the complete code example.
hey Jason,
I currently working on ML projects and I found Gaussian process Regression to be the best choice for my problem.
In the validation phase,I predicted Values with an error of 2 times the RMSE of the model.
Is this a good model? or do I need to retrained the data or maybe look for another algorithm?
Thanks in advance for your reply!
I REFORMULATE MY QUESTION ABOVE
I am currently working on a ML project. I found Gaussian process Regression to be the best choice for my problem.
The validation error is twice higher than the trained model error.
Is this ok? or do I need to retrained the data or maybe look for another algorithm?
Thanks in advance for your reply!
A good model can only be defined by comparing it to simple baseline methods like the Zero Rule method.
Alternately, you can interpret the RMSE using domain expertise because the units are the same as the output variable.
Thanks so much Jason. After finishing this tutorial, what do you think are good next steps and projects to try to work on?
Thanks again – love your site!
Perhaps start working through a suite of standard problems:
https://machinelearningmastery.com/practice-machine-learning-with-small-in-memory-datasets-from-the-uci-machine-learning-repository/
Get good at the process of working through problems. This is the truly valuable skill to cultivate.
Excellent intro tutorial — thank you for sharing it!
Thanks, I’m glad it helped.
Hi Jason can u provide a link which guides the syntax of all model for validation that u have to use in this..
As you have only use KNN for validation but i want to all the other models for learning. as i am a total beginner and little bit bit confused what parameters to use in SVM or Linear Regression etc..
I’m not sure I follow.
Perhaps here would be a good place to start:
https://machinelearningmastery.com/start-here/#process
Great Article!! I would like to know how one could improve the accuracy of an algorithm such as KNN or Logistic regression?
There are many ways, see this post for some ideas:
https://machinelearningmastery.com/machine-learning-performance-improvement-cheat-sheet/
plt.boxplot(results)
Error is showing in this statement while working in jupyter notebook .
TypeError : cannot perform reduce with flexible type
I recommend not using a notebook.
Also, ensure you have all of the code for the example.
I loved the tutorial. great work!!
first I tried it on ubuntu 14.04 LTS, but because of version problems, I had to upgrade to ubuntu 16.04 LTS. I could run the tutorial successfully. Thanks 🙂
I’m glad you got there in the end, well done.
Excellent tutorial Json. I am new to python as well to ML. It worked a like charm. Pls keep up the good work.
Thanks, I’m glad it helped!
Hello Jason,
It is really a great article, I learned a lot.
One question:
How it will be used in production env or for a new examples?
See this post:
https://machinelearningmastery.com/make-predictions-scikit-learn/
Thank you!
So if I want to update data file, should I use all 5 attributes or only 4?
Please give an example.
Thanks,
Ahmed
What do you mean by update the data file?
Hello! Great learning thank you for taking the time to do this. Few questions if you don’t mind answering them i’m very very new to all this including python forgive me.
In 5.1 what is Seed? why is it 7?
Also for the K-fold say you have 5 sets of data [1,2,3,4,5] each with 10 data set size do you do [1(for testing),2,3,4,5] and 2-5 as training until every bin has cycled through as testing set? Like after that it would be [1,2(for testing),3,4,5] and 1,3,4,5 as training until it’s complete?
Also why do you have validation_size = 0.20 if your using K-fold? Isn’t K-fold cross validation already solving it?
Also now that we have the model how can I extract it? So I can use it so i can plug in my own values for the attributes and have the model give me a classification?
Great questions!
Seed is the initialization of the pseudorandom number generator. It generates random numbers used by the algorithm and evaluation of the algorithm. The seed can be anything. Learn more about randomness in ml here:
https://machinelearningmastery.com/randomness-in-machine-learning/
Correct re k-fold cross-validation (CV). We use CV to estimate the skill of the model on new data. We use the validation set to confirm that indeed the estimate is sensible (not biased), that we did not mess up in some major way.
You can make use of the final model to make predictions on new data, here’s how:
https://machinelearningmastery.com/make-predictions-scikit-learn/
Hello Sir…
I’m truly saying from the bottom of my heart your tutorial really helps me a lot especially beginners like me. if you could also provide some more projects like above step-by-step procedures on like Titanic Data Set,Loan Prediction Data Set,Bigmart Sales Data Set and Boston Housing Data Set that would be really really a great helps to beginners like me.
Thanks. Yes. I have a few in my book.
Thank you very much for your interesting explanation
But I have an important question as to how we transform this project into an application in which we can enter data for this plant and the application predicts any type of plant
I would be very thankful for this (how to convert the project into an application that can be used)
The application is also rich with Python with Anconda
Great question. I would recommend start by collecting a large dataset of plant details and their associated species.
Hello Jason,
Excellent tutorial It was such a fun runing the code. Thank you for that tutorial.
Just in case if somebody else will get an error. When I tried to run
from pandas.plotting import scatter_matrix
I get -> ImportError: No module named ‘pandas.plotting’
I tried to update the pandas library -> not working
Solution was:
from pandas.tools.plotting import scatter_matrix
Thanks, well done!
I recommend updating to the latest version of Pandas, you can learn more about this here:
https://machinelearningmastery.com/faq/single-faq/i-think-you-meant-pandas-tools-plotting-scatter_matrix
I’m new in python and machine learning
when i run the code i face an error in this line
cv_results = model_selection.cross_val_score(model, X_train, Y_train, cv=kfold, scoring=scoring)
It makes many errors and the final error given by running is
File “C:\Users\Chathura Herath\PycharmProjects\MoreModels\venv\lib\site-packages\sklearn\utils\validation.py”, line 433, in check_array
array = np.array(array, dtype=dtype, order=order, copy=copy)
ValueError: could not convert string to float: ‘PentalWidth’
please healp me
I’m sorry to hear that, try these steps:
https://machinelearningmastery.com/faq/single-faq/why-does-the-code-in-the-tutorial-not-work-for-me
cycler 0.10.0 0.10.0
kiwisolver 1.0.1 1.0.1
matplotlib 2.2.2 2.2.2
numpy 1.14.2 1.14.2
pandas 0.22.0 0.22.0
pip 9.0.1 10.0.1
pyparsing 2.2.0 2.2.0
python-dateutil 2.7.2 2.7.2
pytz 2018.4 2018.4
scikit-learn 0.19.1 0.19.1
scipy 1.0.1 1.1.0rc1
setuptools 28.8.0 39.0.1
six 1.11.0 1.11.0
sklearn 0.0 0.0
these are the installed packages
So far so good.
I am getting the same output for different active user input using KNN algorithm can you suggest something?
Here are some ideas:
https://machinelearningmastery.com/machine-learning-performance-improvement-cheat-sheet/
this is a great start. works a treat. thank you.
for what its worth to others i installed py using anaconda.
there is an development environment in this called Spyder (python 3.6) which is quite helpful.
Yes, but I generally recommend beginners avoid IDEs and notebooks to keep things simple:
https://machinelearningmastery.com/faq/single-faq/why-dont-use-or-recommend-notebooks
Hi Jason, hope all is well and thank you for all your work, I really appreciate it and it is an inspiration to me…
I hope this has not been asked! So the goal is predicting outcomes on unseen data, what I would like to be able to do is say something like this.
“I predict with 90% accuracy that this rowid in the dataframe will be Iris-virginica.”
But the rowid is not part of the training or test set
How can I tie my prediction to the rowid of the unseen data so I know which rowid I am referring to?
Thanks Jason
The predict() function will take a list of rows and return a list of predictions in the same order. The order links the two.
Learn more about how to make predictions here:
https://machinelearningmastery.com/make-predictions-scikit-learn/
Thank you Jason, awesome! (I’m looking for a DS mentor, interested??!!) 🙂
I answer this question here:
https://machinelearningmastery.com/faq/single-faq/can-you-be-my-mentor-or-coach
i’m not new to machine learning but new to python, lets say the title is a bit misleading…
You skip certain parts to start it all..
I had to draw the line somewhere for a one-off tutorial.
What are the most important topics do you think I missed?
hello
models.append((‘LR’,LogisticRegression()))
models.append((‘LDA’,LinearDiscriminantAnalysis()))
models.append((‘KNN’,KNeighborsClassifier()))
models.append((‘CART’,DecisionTreeClassifier()))
models.append((‘NB’,GaussianNB()))
models.append((‘SVM’,SVC()))
are there more for cosine similarity, euclidean distance, mahalanobis distance?
Do you mean as distance functions on the knn?
Here’s advice on changing the distance function:
http://scikit-learn.org/stable/modules/generated/sklearn.neighbors.KNeighborsClassifier.html
What is a confusion matrix and how do I read it?
You can learn about the confusion matrix here:
https://machinelearningmastery.com/confusion-matrix-machine-learning/
Waw Dr. this is amazing. You made it very easy. Please keep the good work.
Thank you so much! Greetings from the USA!
Thanks.
Hi Jason
Thanks for the work youve done im sure its been a great help for a lot of people.
So i wanted so make sure of something. in step number 5 and 6 which is evaluating an algorithm and making predictions. So step 5 basically dividing 80% of the data to become training data and the 20% to validate the trained model.
What i wanted to ask is when we use the 10-fold cross validation to estimate accuracy of the model, we split up the dataset to 10 part, 9 of which we use to train and 1 part of the dataset to test the model. Now is the dataset were dividing from the training part of the original dataset or in other words 80% of the original dataset?
Another thing is it says that the 10-fold cross validation to spilt tha dataset into 10 parts then train and validate for all combinations of train and test spilts. It means that for 1 combination of train and test data, lets say the first of the ten part of data becomes the test data while the rest becomes the train data, then on another combination of train test data, the second part of the ten part of data becomes the test data etc for all combinations?
Thanks a lot
Zaki
It is a choice. It can be a good idea to hold back a portion of the dataset to validate the final model.
Learn more here:
https://machinelearningmastery.com/difference-test-validation-datasets/
Hi Jason….
Your efforts are really helpful for me.
I am learning the code line by line. What is meant by seed and you mentioned seed=7 during split_out validation set .
seed = 7
X_train, X_validation, Y_train, Y_validation = model_selection.train_test_split(X, Y, test_size=validation_size, random_state=seed)
Why do we use seed. Also why it is hardcoded as 7.
Can you please let me know
This is a common question that I answer here:
https://machinelearningmastery.com/faq/single-faq/what-value-should-i-set-for-the-random-number-seed
Jason, thank you for your post. I am from Rio de Janeiro, Brazil and I am currently finishing my Computer Engineering course on College. We have learned the very basics of machine learning. It would be very useful if you go ahead and show us how to feed these algorithms with real images and show us the result.
I am using Sublime Text as the IDE and Python 2.7 with all the necessary environment. Your tutorial worked fine for me, without any error when building.
Thanks for the suggestion.
hey jason,thanks for post,i completed intro course of machine learning on udacity but didnt able to hand on code that much.without application and practising codes there is no way to learn.please suggest me the project based webiste for practise and anything new i should do as per your concern…
Here are some suggested projects:
https://machinelearningmastery.com/faq/single-faq/what-machine-learning-project-should-i-work-on
I am getting an error:
“TypeError: Couldn’t find foreign struct converter for ‘cairo.Context'”
Perhaps your environment is not installed correctly?
This tutorial might help:
https://machinelearningmastery.com/setup-python-environment-machine-learning-deep-learning-anaconda/
Hi,
What is the function of the instructions above, and how would we implement this into our own programs?
What do you mean exactly?
Hi, I just sarted out in ML and tried to run your code in the Anaconda command line and am getting the following error in the code below. Thanks
#Spot Check Algorithms
… models = []
>>> models.append((‘LR’,LogisticRegression()))
>>> models.append((‘LDA’,LinearDiscriminantAnalysis()))
>>> models.append((‘KNN’,KNeighborsClassifier()))
>>> models.append((‘CART’,DecisionTreeClassifier()))
>>> models.append((‘NB’,GaussianNB()))
>>> models.append((‘SVM’,SVC()))
>>> #evaluate each model in trun
… results = []
>>> names = []
>>> for name, model in models:
… kfold = model_selection.cross_val_score(model, X_train, Y_train, cv=kfold, scoring=scoring)
File “”, line 2
kfold = model_selection.cross_val_score(model, X_train, Y_train, cv=kfold, scoring=scoring)
^
IndentationError: expected an indented block
>>> kfold= model_selection.cross_val_score(model, X_train, Y_train, cv=kfold, scoring=scoring)
Traceback (most recent call last):
File “”, line 1, in
NameError: name ‘model’ is not defined
>>> kfold = model_selection.KFold(n_splits=10,random_state=seed)
>>> cv_results= model_selection.cross_val_score(model, X_train, Y_train, cv=kfold, scoring=scoring)
Traceback (most recent call last):
File “”, line 1, in
NameError: name ‘model’ is not defined
>>> results = []
>>> names = []
>>> for name, model in models:
… kfold = model_selection.KFold(n_splits=10,random_state=seed)
File “”, line 2
kfold = model_selection.KFold(n_splits=10,random_state=seed)
^
IndentationError: expected an indented block
>>> kfold= model_selection.KFold(n_splits=10,random_state=seed)
>>> cv_results= model_selection.cross_val_score(model, X_train, Y_train, cv=kfold, scoring=scoring)
Traceback (most recent call last):
File “”, line 1, in
NameError: name ‘model’ is not defined
It looks like you might not have copied the code with all of the indenting.
This might help:
https://machinelearningmastery.com/faq/single-faq/how-do-i-copy-code-from-a-tutorial
array = dataset.values
NameError: name ‘dataset’ is not defined
Ensure you copy all of the code required.
Hello, Jason, Great, great artcle. Tahnk You 🙂
Thanks!
I will try that, thanks very much!
Hi Jason
I started working on this project. I have encounterd an issue with 5.1
array = dataset.values
it is saying ndarray object of numpy module. I am using latest Anaconda. I have check the installs as you mentioned. All modules are installed and are of higher version.
your help is much appreciated.
Sreenivasa
Did you copy all of the code?
hai jason
this is good publication
I know the ML algorithms theory wise but new to practical sessions. I have not done any thing practically. But by following your tutorial I could install all the libraries.
As I started to implement “your first machine learning step by step”, I did not understand where to type the code.
There is no >>> prompt in anaconda prompt.
Please help me its all new. Should I type every thing in one text editor and then run as
python filename.py
or should i type the code separately
The code goes into a script and is run from the command line.
More on running code from the command line here:
https://machinelearningmastery.com/faq/single-faq/how-do-i-run-a-script-from-the-command-line
Hai Jason
Finally I got it.
It was thrilling
Thank you
Well done!
Great tutoria! Thanks!
My results:
LR: 0.966667 (0.040825)
LDA: 0.975000 (0.038188)
KNN: 0.983333 (0.033333)
CART: 0.966667 (0.040825)
NB: 0.975000 (0.053359)
SVM: 0.991667 (0.025000)
Great work!
Great intro!! Really appreciated. The one part that didn’t work for me was all the plt.show(). I have triple checked my versions. Any idea what I am doing wrong?
Perhaps you are running inside an IDE or notebook instead of from the commandline?
Hi Jason,
Thanks for the post.
i have tried your above approach on Iris data set with seed = 7, i got the same result as expected in this approach. when i tried the below approach with seed (or) random_state=42 , getting the 100 % accuracy, i didn’t understand why changing the seed (or) random_state=42 increased the performance or there is any mistake in my code ?
Please find the belowcode
# Split-out validation dataset
array = dataset.values
X = array[:,0:4]
Y = array[:,4]
validation_size = 0.20
seed = 42
X_train, X_validation, Y_train, Y_validation = model_selection.train_test_split(X, Y, test_size=validation_size, random_state=seed)
# Test options and evaluation metric
seed = 42
scoring = ‘accuracy’
# Spot Check Algorithms
models = []
models.append((‘LR’, LogisticRegression()))
models.append((‘LDA’, LinearDiscriminantAnalysis()))
models.append((‘KNN’, KNeighborsClassifier()))
models.append((‘CART’, DecisionTreeClassifier()))
models.append((‘NB’, GaussianNB()))
models.append((‘SVM’, SVC()))
# evaluate each model in turn
results = []
names = []
for name, model in models:
kfold = model_selection.KFold(n_splits=10, random_state=seed)
cv_results = model_selection.cross_val_score(model, X_train, Y_train, cv=kfold, scoring=scoring)
results.append(cv_results)
names.append(name)
msg = “%s: %f (%f)” % (name, cv_results.mean(), cv_results.std())
print(msg)
Result :
LR: 0.950000 (0.040825)
LDA: 0.975000 (0.038188)
KNN: 0.950000 (0.055277)
CART: 0.950000 (0.055277)
NB: 0.950000 (0.055277)
SVM: 0.958333 (0.041667)
# Make predictions on validation dataset
knn = KNeighborsClassifier()
knn.fit(X_train, Y_train)
#predictions = []
#print(predictions)
predictions = knn.predict(X_validation)
#print(X_validation)
#print(predictions)
print(accuracy_score(Y_validation, predictions))
print(confusion_matrix(Y_validation, predictions))
print(classification_report(Y_validation, predictions))
Result :
1.0
[[10 0 0]
[ 0 9 0]
[ 0 0 11]]
precision recall f1-score support
Iris-setosa 1.00 1.00 1.00 10
Iris-versicolor 1.00 1.00 1.00 9
Iris-virginica 1.00 1.00 1.00 11
avg / total 1.00 1.00 1.00 30
# Make predictions on validation dataset
svc = SVC()
svc.fit(X_train, Y_train)
#predictions = []
#print(predictions)
predictions = svc.predict(X_validation)
#print(X_validation)
#print(predictions)
print(accuracy_score(Y_validation, predictions))
print(confusion_matrix(Y_validation, predictions))
print(classification_report(Y_validation, predictions))
Result :
1.0
[[10 0 0]
[ 0 9 0]
[ 0 0 11]]
precision recall f1-score support
Iris-setosa 1.00 1.00 1.00 10
Iris-versicolor 1.00 1.00 1.00 9
Iris-virginica 1.00 1.00 1.00 11
avg / total 1.00 1.00 1.00 30
You can learn more about the impact of randomness in machine learning here:
https://machinelearningmastery.com/randomness-in-machine-learning/
Hello sir ,
In this tutorial you have showed a basic project which load pre-defined dataset.Can you please tell me how can I create my own dataset and load it here ? And also I have trained data and now how can I input new image so that machine can identify that and print it’s name ?
This post shows you how to load a new dataset:
https://machinelearningmastery.com/load-machine-learning-data-python/
This post shows you how to make a prediction with a new data:
https://machinelearningmastery.com/make-predictions-scikit-learn/
What type of dataset can be used for the linear regression? (can we use all types of dataset)
Numerical data input and numerical data output.
How to select a particular dataset for particular algorithm (knn, linear regression…..)?
This is a common question that I answer here:
https://machinelearningmastery.com/faq/single-faq/what-algorithm-config-should-i-use
Hi, in what part of the code can I put my new data for classification?
This post explains how to make a prediction:
https://machinelearningmastery.com/make-predictions-scikit-learn/
i am a high school passed out and wanted to learn this would i be able to take this and understand these things
Great!
I only came recently across this blog post. Very well written, congratulations. I have a question about the ‘brute force’s approach you used to define the best predictive ML approach. You tried all of them. But due to the very small dataset would you rely on such a small difference? That is within the variance of the model, so I could pick almost any of those. Do you have posted about a dataset ? eventually larger) where trends might be eventually different?
Indeed, with overlapping skill scores, we might have to use statistical hypothesis tests to see if indeed there is a meaningful difference between the skill of the different methods. The student’s t-test would be a good starting point.
Very nice blog to start with. Thanks for the same. I am following most of your emails in my ML journey. Started a week ago.
A small issue in this blog.
from sklearn.neighbors import KNeighborsClassifiers
Traceback (most recent call last):
File “”, line 1, in
from sklearn.neighbors import KNeighborsClassifiers
ImportError: cannot import name ‘KNeighborsClassifiers’
Please suggest .. Rest all I am able to understand
Perhaps ensure that you have the sklearn library installed?
This tutorial can help you to setup your environment:
https://machinelearningmastery.com/setup-python-environment-machine-learning-deep-learning-anaconda/
Awesome stuff! one thing, when you apply the model (KNN) on the validation data, does it create a new mapping function or it uses the one it created during the test phase?
In knn, the training data is used to make a prediction on the test dataset.
Good afternoon sir,
I am have network problem, I downloaded the Iris dataset on my directory, kindly how do i load the dataset to my python IDE?
Thanks,
Maker
I recommend using a text editor, not an IDE.
You can copy the .csv file into the same directory as your .py files.
ty for this m8 🙂 very good toot
Thanks.
This was incredible, thank you so much. A very well structured coding tutorial, so rare.
I’m glad it helped.
Hi,
I am getting this error when I am running the code with my own dataset:
ValueError: Unknown label type: ‘continuous’
my dataset is having 161 instances and 54 attributes.
Please help!
Looks like you need to change your output variable to be an integer or change the problem type from classification to regression.
Having the following error
NameError: name ‘msg’ is not defined
>>> models = []
>>> models.append((‘LR’, LogisticRegression()))
>>> models.append((‘LDA’, LinearDiscriminantAnalysis()))
>>> models.append((‘KNN’, KNeighborsClassifier()))
>>> models.append((‘CART’, DecisionTreeClassifier()))
>>> models.append((‘NB’, GaussianNB()))
>>> models.append((‘SVM’, SVC()))
>>> results = []
>>> names = []
>>> for name, model in models:
… kfold = model_selection.KFold(n_splits=10, random_state=seed)
File “”, line 2
kfold = model_selection.KFold(n_splits=10, random_state=seed)
^
Ensure you copy all of the code in the example and ensure indenting matches the example.
Learn how to copy code from the tutorial here:
https://machinelearningmastery.com/faq/single-faq/how-do-i-copy-code-from-a-tutorial
Thank you Dr.Jason for writing wonderful simple Machine learning project for the beginners. I am getting exactly same results for the accuracy as given in your tutorial. I am finding bit difficulty in interpreting statistical results.
Well done.
What results are you having trouble with?
Hi,
I have been working on binary text classification, so, I used the above code but before predicting the output I converted it into numerical data using
df = handle_non_numerical_data(dataset)
now, Prediction on training,validation data all worked fine, but How to give a new set to predict the class, when I am trying to use the above function it classifies the new dataset differently as in there is no relation between training dataset and this dataset. How to solve this problem ?
What is the function “handle_non_numerical_data()”?
Hello Jason,
I am a newbie, trying to learn Machine learning with little or no help around me. Then I found your blog and its awesome to learn it from here!!!
i want to know 1 thing here why we have separated data and class names in two tables X_train and Y_train? Can’t we keep the data and classes in one single table say X_train only so that the very first row say
5.9,3,5.1,1.8,Iris-virginica
The models learn a mapping from inputs to outputs.
The libraries expect the data to be separated. This is why we separate them.
Assalam-o alaikum!
Very nice tutorial.. Can you give me any idea about simplest implementation of any of Machine Learning algorithms for processing big data? I want the implementation to in Python like you have did above in your tutorial.
Regards
I provide a suite of tutorials that you can use to get started here:
https://machinelearningmastery.com/start-here/#python
I have a few questions:
1) How do I print out the confusion matrix of TP, FP, TN, FN, rather than just the precision, recall, etc?
2) How do I just train on one set of data and test on a separate set of data?
– This would require the ability to save my model. How do I do that programmatically for later run throughs, without the need to re-train?
3) Is there a best way to selectively scale discrete values to 0-1 range, without affecting the boolean values?
4) Is the n_spits always a good way to go? How do I know the best value for that, without doing several run-throughs?
Thanks
Good questions Devin .
I have more on the confusion matrix here, including how to print it:
https://machinelearningmastery.com/confusion-matrix-machine-learning/
You can call:
More here:
https://machinelearningmastery.com/make-predictions-scikit-learn/
You will have to split the data up by column, scale it, then reassemble. Look into using slicing to select and hstack() to combine, more here:
https://machinelearningmastery.com/gentle-introduction-n-dimensional-arrays-python-numpy/
10 splits for CV has been found to be effective on a wide range of problems, more here:
https://machinelearningmastery.com/k-fold-cross-validation/
hii jason
how KNN is better
can you explain on what basis we find the better one algorithm
We can choose an algorithm based on it’s average expected performance when making predictions on unseen data.
Hello Jason,
I am stuck at confusion matrix. looking at the output below, how I know which row represents what class?
[[ 7 0 0]
[ 0 11 1]
[ 0 2 9]]
I was trying to follow below statements, but could not tell which row/ column represent Iris-setosa (/Iris-versicolor/Iris-virginica) looking at above output matrix. Can you help?
Expected down the side: Each row of the matrix corresponds to a predicted class.
Predicted across the top: Each column of the matrix corresponds to an actual class.
I explain more here:
https://machinelearningmastery.com/confusion-matrix-machine-learning/
Thank you.
Hello Doctor,First of all, thank you very much for this tutorial.
I have implemented this code on my own dataset that I have created. It is one class to differentiate between two types of attacks. The dataset contain 267 features and more than 120,000 records. For the experimental, I created randomly a small database of 2000 records and the same feature numbers, The output is as follows:
LR: 0.927639 (0.020943)
LDA: 0.964074 (0.008784)
KNN: 0.763901 (0.045070)
CART: 0.979401 (0.007253)
NB: 0.680964 (0.021898)
SVM: 0.560485 (0.022857)
==============================================
—————SVM————–
0.5464135021097046
[[256 0]
[215 3]]
precision recall f1-score support
Benign 0.54 1.00 0.70 256
malicious 1.00 0.01 0.03 218
avg / total 0.75 0.55 0.39 474
==============================================
———–Decision Tree Classifier (CART) ——————
accuracy_score=:
0.9852320675105485
confusion_matrix=:
[[252 4]
[ 3 215]]
classification_report=:
precision recall f1-score support
Benign 0.99 0.98 0.99 256
malicious 0.98 0.99 0.98 218
avg / total 0.99 0.99 0.99 474
==============================================
—————LinearDiscriminantAnalysis———-
Warning (from warnings module):
File “C:\python36\lib\site-packages\sklearn\discriminant_analysis.py”, line 388
warnings.warn(“Variables are collinear.”)
UserWarning: Variables are collinear.
accuracy_score=:
0.9556962025316456
confusion_matrix=:
[[256 0]
[ 21 197]]
classification_report=:
precision recall f1-score support
Benign 0.92 1.00 0.96 256
malicious 1.00 0.90 0.95 218
avg / total 0.96 0.96 0.96 474
==============================================
.Note that this is the first test of samples of dataset.
Does this look right? does makes sense
If the problem is not linear why the result is less in SVM? while in the CART (0.99)
Any suggestion would be appreciated
Thank you introduction
It is always a good idea to test a suite of methods to see what works best for a given problem. We cannot know a priori.
hi jason
tell me after getting 90% accuracy how i predict the value.please explain in easy how to predict the data with practical
This post explains how to make predictions:
https://machinelearningmastery.com/how-to-make-classification-and-regression-predictions-for-deep-learning-models-in-keras/
Thanks, I like that you’ve mentioned in the end of the tutorial, that we don’t have to know or understand everything in the tutorial.
I like that your lesson are so concise. long tutorial make me lost
my question is where should I go from here so I can understand and apply the machine learning to my goals
Thanks.
A next step would be here:
https://machinelearningmastery.com/start-here/#python
Man!, where are you before few months!
you replay fast, and you are always following up with your students
I lost so much time trying to read over the internet to get started
I wish that I found your tutorials before few months ago
please keep doing what you are doing now
Thanks a lot
Thanks!
Installed sklearn still got ImportError: No module named discriminant_analysis. any suggesssion?
Are you able to confirm that you have the latest version of sklearn installed?
Hi Jason
First of all thanks for helping newbie.
I want to know what are the prerequisite to learn this course as i have no under standing of python.
Perhaps start with Weka instead:
https://machinelearningmastery.com/how-to-run-your-first-classifier-in-weka/
Hi jason!
i have more interested ML . I’m in a beginner stage now .
I have one doubt
ML is, that
“we giving past input and output data , based on that we are expecting machines to give same output as in the past data for out future input”????
Like the following
data set:
input output
AA 1
BB 2
CC 3
in future if i give AA it should return 1.
but tradition programming also doing the same right?
only one thing is different that is unsupervised learning in that machine it self should build a program.
kindly clarify my doubt ..
The model does not memorize, instead it generalizes.
More information here:
https://machinelearningmastery.com/what-is-generalization-in-machine-learning/
Hi
there is no prediction algorithm here ?
how to make the prediction step
how many variable of test data will be used to prediction ?
where is x – and y axis colum
you just build the model gives good accuracy but how to make use of prediction
Regards,
Ganesha
You can learn more about how to make predictions with your final model here:
https://machinelearningmastery.com/faq/single-faq/how-do-i-make-predictions
Thank you for this, this is amazing. Helped beginner like me a lot, easy to follow and practical.
Thanks again.
You’re welcome, I’m glad to hear that.
I am using url =”https://raw.githubusercontent.com/uiuc-cse/data-fa14/gh-pages/data/iris.csv”
since UCI is not working.
All the code is getting executed but plt.hist() is showing error
—————————————————————————
ValueError Traceback (most recent call last)
in ()
1 # histograms
—-> 2 dataset.hist()
3 plt.show()
~\Anaconda3\lib\site-packages\pandas\plotting\_core.py in hist_frame(data, column, by, grid, xlabelsize, xrot, ylabelsize, yrot, ax, sharex, sharey, figsize, layout, bins, **kwds)
2176 fig, axes = _subplots(naxes=naxes, ax=ax, squeeze=False,
2177 sharex=sharex, sharey=sharey, figsize=figsize,
-> 2178 layout=layout)
2179 _axes = _flatten(axes)
2180
~\Anaconda3\lib\site-packages\pandas\plotting\_tools.py in _subplots(naxes, sharex, sharey, squeeze, subplot_kw, ax, layout, layout_type, **fig_kw)
235
236 # Create first subplot separately, so we can share it if requested
–> 237 ax0 = fig.add_subplot(nrows, ncols, 1, **subplot_kw)
238
239 if sharex:
~\Anaconda3\lib\site-packages\matplotlib\figure.py in add_subplot(self, *args, **kwargs)
1072 self._axstack.remove(ax)
1073
-> 1074 a = subplot_class_factory(projection_class)(self, *args, **kwargs)
1075
1076 self._axstack.add(key, a)
~\Anaconda3\lib\site-packages\matplotlib\axes\_subplots.py in __init__(self, fig, *args, **kwargs)
62 raise ValueError(
63 “num must be 1 <= num 64 maxn=rows*cols, num=num))
65 self._subplotspec = GridSpec(rows, cols)[int(num) – 1]
66 # num – 1 for converting from MATLAB to python indexing
ValueError: num must be 1 <= num <= 0, not 1
You can get the dataset here as well:
https://raw.githubusercontent.com/jbrownlee/Datasets/master/iris.csv
Can we access two .pb files in a single model?
Thanks in advance.
What is a .pb file?
sir i got this error
File “C:\Users\Amirul\Anaconda3\lib\urllib\request.py”, line 1320, in do_open
raise URLError(err)
URLError:
please help me
I have some suggestions here:
https://machinelearningmastery.com/faq/single-faq/why-does-the-code-in-the-tutorial-not-work-for-me
I installed everything and am trying to print the dataset, but i am not getting any output.
I have some ideas here:
https://machinelearningmastery.com/faq/single-faq/why-does-the-code-in-the-tutorial-not-work-for-me
Hi
my data set contains 143 colomns, so I change the X Y values for new array. Good.
But in the for loop
my code is breaking at cv_results line. How do I overcome it?
Pls help, thanks!
I have some suggestions here:
https://machinelearningmastery.com/faq/single-faq/why-does-the-code-in-the-tutorial-not-work-for-me
What an awesome! Really easy-to-follow tutorial!
Thanks for advices you gave along the tutorial!
Thanks, I’m glad it helped.
Dear Dr. Brownlee,
You are a true hero, someone who gives their time and energy to helping others.
Bravo!!!
H.G. Lison
I’m glad it helped.
I really like that you solved the same problem using 6 different models, it gives a great basis for my future modeling of real-world problems because it shows me that I can easily compare results in my particular case to pick the best model. I understand that some of them may give dramatically better results depending on the problem and training/validation data. Thanks for sharing this! I’m looking forward to reading more of your posts.
Thanks Ken, I’m glad it helped.
Hi Jason,
thanks for your tutorial. Really helpful. I am a complete beginner. I am seeing two errors checking for the right models. First is an indentationError (couldn’t fix it by deleting spaces). Second is NameError: name ‘model’ is not defined
Please assist. Thanks!
>>> # Spot Check Algorithms
… models = []
>>> models.append((‘LR’, LogisticRegression()))
>>> models.append((‘LDA’, LinearDiscriminantAnalysis()))
>>> models.append((‘KNN’, KNeighborsClassifier()))
>>> models.append((‘CART’, DecisionTreeClassifier()))
>>> models.append((‘NB’, GaussianNB()))
>>> models.append((‘SVM’, SVC()))
>>> # evaluate each model in turn
… results = []
>>> names = []
>>> for name, model in models:
… kfold = model_selection.KFold(n_splits=10, random_state=seed)
File “”, line 2
kfold = model_selection.KFold(n_splits=10, random_state=seed)
^
IndentationError: expected an indented block
>>> cv_results = model_selection.cross_val_score(model, X_train, Y_train, cv=kfold, scoring=scoring)
Traceback (most recent call last):
File “”, line 1, in
NameError: name ‘model’ is not defined
>>> results.append(cv_results)
Traceback (most recent call last):
File “”, line 1, in
NameError: name ‘cv_results’ is not defined
>>> names.append(name)
Traceback (most recent call last):
File “”, line 1, in
NameError: name ‘name’ is not defined
>>> msg = “%s: %f (%f)” % (name, cv_results.mean(), cv_results.std())
Traceback (most recent call last):
File “”, line 1, in
NameError: name ‘name’ is not defined
>>> print(msg)
Be sure to copy all of the code, here’s some help on how:
https://machinelearningmastery.com/faq/single-faq/how-do-i-copy-code-from-a-tutorial
Hi Jason,
Very helpful introduction. Thanks for that!
I’m wondering how I could get the equation for example of the logistic regression.
Could you please guide me in the right direction?
This might help:
https://machinelearningmastery.com/implement-logistic-regression-stochastic-gradient-descent-scratch-python/
Hi Jason
i have a question about algorithm comparison figure, what does that dotted line represents?
also i used the same code but i not getting that dotted line in my figure why this is so?
They are box and whisker plots, you can learn more about them here:
https://en.wikipedia.org/wiki/Box_plot
They may be solid lines in the latest version of matplotlib.
Support Vector Machines seems to be a better option for this particular problem. Sorry for any formatting issues that may occur.
Output:
Nice work!
Is there a way of printing the p-value within the line
msg = “%s: %f (%f)” % (name, cv_results.mean(), cv_results.std())
I explain how to calculate p-values here:
https://machinelearningmastery.com/parametric-statistical-significance-tests-in-python/
# Spot Check Algorithms
models = []
models.append((‘LR’, LogisticRegression()))
models.append((‘LDA’, LinearDiscriminantAnalysis()))
models.append((‘KNN’, KNeighborsClassifier()))
models.append((‘CART’, DecisionTreeClassifier()))
models.append((‘NB’, GaussianNB()))
models.append((‘SVM’, SVC()))
# evaluate each model in turn
results = []
names = []
for name, model in models:
kfold = model_selection.KFold(n_splits=10, random_state=seed)
cv_results = model_selection.cross_val_score(model, X_train, Y_train, cv=kfold, scoring=scoring)
results.append(cv_results)
names.append(name)
msg = “%s: %f (%f)” % (name, cv_results.mean(), cv_results.std())
print(msg)
ValueError Traceback (most recent call last)
in ()
11 for name, model in models:
12 kfold = model_selection.KFold(n_splits=10, random_state=seed)
—> 13 cv_results = model_selection.cross_val_score(model, X_train, Y_train, cv=kfold, scoring=’accuracy’)
14 results.append(cv_results)
15 names.append(name)
ValueError: Unknown label type: ‘unknown’
Ensure you copy the code exactly and preserve indenting. See this:
https://machinelearningmastery.com/faq/single-faq/how-do-i-copy-code-from-a-tutorial
Hallo Jason, do you have any articles on your site showing how to implement early_stopping?
Could you share a link on it?
Kind regards!
Here’s one:
https://machinelearningmastery.com/avoid-overfitting-by-early-stopping-with-xgboost-in-python/
Hello Jason,
I use LDA to predict and the result seems to better than SVC:
0.966666666667
[[ 7 0 0]
[ 0 11 1]
[ 0 0 11]]
precision recall f1-score support
Iris-setosa 1.00 1.00 1.00 7
Iris-versicolor 1.00 0.92 0.96 12
Iris-virginica 0.92 1.00 0.96 11
avg / total 0.97 0.97 0.97 30
even the estimated accuracy score is worse than SVC:
LR: 0.966667 (0.040825)
LDA: 0.975000 (0.038188)
KNN: 0.983333 (0.033333)
CART: 0.975000 (0.038188)
NB: 0.975000 (0.053359)
SVM: 0.991667 (0.025000)
Well done!
Dear Jason
Big thanks for your great posts!! You are contributing greatly in expanding the ML community and knowledge!!
2 questions please for you or anyone in the community.
I ‘ve been using WEKA and now I am also entering in the world of Python scikit.
WEKA gives you the option to include the p-value in the results, but it seems there is nothing around (or I completely missed it) in Python scikit..
Question 1:
– How can we also include the Statistical Significance (with p-value=0.05, for paired t-test ) in the above command line that gave this results list:
LR: 0.966667 (0.040825)
LDA: 0.975000 (0.038188)
KNN: 0.983333 (0.033333)
CART: 0.975000 (0.038188)
NB: 0.975000 (0.053359)
SVM: 0.981667 (0.025000)
It is helpful to know the p-value of the result in order to confidently claim the difference between the accuracy performance of the compared algorithms/models we are comparing.
In other words, what do we have to do to also display in the list of the above results the p-value?
Question 2:
– What if we wanted to calculate the AUC ROC instead of the accuracy?
Should we switch the following
seed = 7
scoring = ‘accuracy’
into just
seed = 7
scoring = ‘auc’ . ?
Many thanks in advance and apologies to you and the rest of the community for my ignorance.
Best regards,
George
You can calculate p-values in Python using the statsmodels library, I give examples here:
https://machinelearningmastery.com/parametric-statistical-significance-tests-in-python/
Hi Jason,
Thanks for this, how quickly could i see the output of the below
>>> # evaluate each model in turn
… results = []
>>> names = []
>>> for name, model in models:
… kfold = model_selection.KFold(n_splits=10, random_state=seed)
… cv_results = model_selection.cross_val_score(model, X_train, Y_train, cv=kfold, scoring=scoring)
… results.append(cv_results)
… names.append(name)
… msg = “%s: %f (%f)” % (name, cv_results.mean(), cv_results.std())
… print(msg)
…
For me it stops here, no errors showing in the entire code.
Are you running from the command line?
Notebooks and IDEs can introduce problems.
LR: 0.908333 (0.078617)
LDA: 0.975000 (0.038188)
KNN: 0.966667 (0.040825)
CART: 0.975000 (0.038188)
NB: 0.975000 (0.053359)
SVM: 0.975000 (0.038188)
Well done.
Hello, the code what you have given in this website i tried it by connecting it with excel file instead of url i got the same outcome offline.:)
I don’t understand, can you elaborate?
I tried this code and i have also tired it in my own way by using excel file as data base instead of url…. Hope you understood me…. Thank you
Sorry, I cannot help you connecting to an excel file.
I recommend saving your data into CSV format before working with it.
Thanks so much for the wonderful website and taking the time to answer questions!
If I understand this correctly, we have built a model that will look at the data and predict the type of flower based on sepal/petal length/width.
Quick question:
After we have our final model for the dataset, how can we see what variables (sepal/petal length/width) are the most significant for prediction?
Thanks again!
Correct.
We often give up this insight (from statistics) in favor of predictive skill with ml methods.
The great post …quickly building the confidence on ML
Thanks!
Hi. I’m trying to use this with a csv with two cols (date, price) but get the error: “could not convert string to float: ‘2014-12-31′”.
Could anyone tell me what I’m doing wrong please?
You can get started with time series problems here:
https://machinelearningmastery.com/start-here/#timeseries
cv_results = model_selection.cross_val_score(model, X_train, Y_train, cv=kfold, scoring=scoring)
Here “model_selection.cross_val_score” calculates the score based on the training data. But score/ accuracy are calculated for the model with respect to validation data. This gives the performance of the model. But herein you have used this method prior to using the validation data. Could you please explain the logic behind. I am new to Machine learning and have gone through the algorithms also. So have come up with this question. Please help!
You can learn more about validation sets here:
https://machinelearningmastery.com/difference-test-validation-datasets/
Hello Jason,
I went through the link you shared. And also through the following one:
https://machinelearningmastery.com/evaluate-performance-machine-learning-algorithms-python-using-resampling/
Please confirm me if my understanding is correct or not which I am sharing underneath–
Estimates of performance for our machine learning algorithm using approach- “K-fold Cross Validation” is done by the following way :
First the original training data set is split into training data and test/validation data.
Then this derived training set is again split into n- number of folds using KFold(). Now with n-1 number of folds(sets of data), algorithm under consideration is trained. Then with the n-th fold(set) of data, algorithm is tested and the accuracy/ score is calculated between {the result obtained with this test data set} and the result obtained for each of {n-1 folds of training data set}. So we obtain n-1 counts of accuracy values for these n-1 folds of data. Finally the mean of this is calculated which gives the net accuracy of the algorithm used.
Please confirm me if my understanding is correct or not.
Sounds good. Except we get k accuracy scores, not k-1.
Thanks a lot Jason!
You may have answered this question before, so please excuse the possible repetitiveness:
As you were exploring the relationships between the features, you noticed some correlations/patterns. Did that allow you to narrow down your choices of algorithms? If so, how?
My overall question: when do you know you can really leverage on the correlative relationships and/or gaussian representations when choosing a model? Is it true that sometimes it’s too expensive (and hence not preferred in the workplace) to run and test six different algorithms when the data can get really big?
Yes, if the data looks gaussian I think about standardizing instead of normalizing. If I see lots of correlation, I think about feature selection methods, etc.
A good starting point is to test many methods and let these intuitions arrive as experience over time. Often these intuitions breakdown in the face of rigorous+systematic testing.
Why do we have included the LABEL column in the learning -> we should have only used
X = array[:,0:3] instead X = array[:,0:4]
Could you please share your opinion here?
No, the label is never included in the input.
Hello my friend.Nice tutorial.I am a little rookie in machine learning and i am struggling to complete the tutorial with this dataset: http://archive.ics.uci.edu/ml/datasets/Wine.
Can you please help me?It is important for me to understand how it works.
Thank you very much for your time and the tutorial.
This process will help you work through your dataset:
https://machinelearningmastery.com/start-here/#process
These tutorials will show you how to use the process with Python:
https://machinelearningmastery.com/start-here/#python
Very nice introduction to get some hands on experience, thanks!
I happy you found it useful Nick!
thanks for useful lessons
in my code the SVM achieved the best accuracy so I want to make a predict by this algorthim
when I am trying to change the code of predction from Knn to SVM the errors shows to me all the time
can you help please
What problem are you having exactly with this change?
how these datasets help to predict?
What do you mean exactly?
A Very good course for beginners to get a feel of how thing really work in ML and how algo can be applied on data. I think this is the best way to start ML journey for anyone. LAter on you can build deep understanding and expertise in python as well as ML Algos. Great work! Jason!.
Thanks, I’m happy that it helped.
This tutorial was superb – thank you!
Thanks, I’m happy that it helped.
Hi,
I’m getting this error when I execute the line
cv_results = model_selection.cross_val_score(model, X_train, Y_train, cv = kfold, scoring = scoring_met)
ValueError: Found input variables with inconsistent numbers of samples: [120, 30]
What am I doing wrong?
I have some suggestions here:
https://machinelearningmastery.com/faq/single-faq/why-does-the-code-in-the-tutorial-not-work-for-me
LR: 0.966667 (0.040825)
LDA: 0.975000 (0.038188)
KNN: 0.983333 (0.033333)
CART: 0.983333 (0.033333)
NB: 0.975000 (0.053359)
SVM: 0.991667 (0.025000)
Above is what I ended up with. made minor modification to script before make prediction step on the validation set
knn = SVC()
Accuracy on the validation set was 90%.
Nice work!
Thanks Jason. Great tutorials to get us on the road walking. Hope to continue benefitting from your wisdom. Hats off sir.
Thanks, I’m happy it helped!
Hi Jason, great article you have there, it’s simple and clear. Congrats.
I’m trying to use this concept to classify a data based on description (texts), but as I understood these functions that you use just accept numbers. DO you have any suggestions in how can I scalonate my texts?
There are many ways to encode and represent text. This field is called natural language processing, you can get started here:
https://machinelearningmastery.com/start-here/#nlp
I am a newbie to ML and not a programmer. This tutorial explained to me all the steps in detail and was easy to understand. It gave me a new level of confidence which I didn’t get after going through so many courses and theory. Thank you so much !
Thanks, I’m happy to hear that!
Good afternoon teacher, after you have finished this project with the iris database, I know that as you said above, not all the steps of a machine learning project were performed, so I would like to know after having done all these tests and validated the model, how would I put it into production and test it on real data?
Perhaps this process will help:
https://machinelearningmastery.com/start-here/#process
I work through the project. I had to type most of the codes to help me understand the what each functions and object meant and it was very intellectual. Thanks. Appreciate!
Well done!
i just found this and i am truly impressed. i was about to write something like this, but instead i will just link to yours! problem solved. well done on breaking it down like that. ran it through and it worked like a charm.
Thanks, I’m happy it helped!
Hi. I have a doubt regarding the seed value.
How to choose seed value? Is this value really affect the result?
Thank you in advance
This is a common question that I answer here:
https://machinelearningmastery.com/faq/single-faq/what-value-should-i-set-for-the-random-number-seed
Hi Jason,
Thank you for this tutorial, it’s very useful and helped me a lot. I was only wondering if I can graphically display the models that come from the algorithms? So for example when making a decision tree, that I actually show it on the screen.
Thanks in advance
You may be able to, I don’t have a tutorial on that topic sorry.
Hii..
Tys given for good tutorial …
Problem how the download dataset on his work.
And give any simple project templet such as example. .
New dataset download and its how to use in python
You can download the dataset here:
https://raw.githubusercontent.com/jbrownlee/Datasets/master/iris.csv
Hi Jason,
I really appreciate this tutorial. It makes machine learning is something fun to do. I’ve tried your code, examined 1-by-1 every syntax you used, and then, the result I got just like the others which is the best model is SVC. After that, I was curious about the other models’ result. So, I repeated the last step for the other models and I compared each other. LDA gave a better accuracy score than SVC. How could this happen? Does this case depend on the value of validation size or something else? I made no change from step 1 until step 5.
Here are the results:
LR: 0.966667 (0.040825)
LDA: 0.975000 (0.038188)
KNN: 0.983333 (0.033333)
CART: 0.966667 (0.040825)
NB: 0.975000 (0.053359)
SVM: 0.991667 (0.025000)
Logistic Regression
0.8
[[ 7 0 0]
[ 0 7 5]
[ 0 1 10]]
precision recall f1-score support
Iris-setosa 1.00 1.00 1.00 7
Iris-versicolor 0.88 0.58 0.70 12
Iris-virginica 0.67 0.91 0.77 11
avg / total 0.83 0.80 0.80 30
Linear Discriminant Analysis
0.9666666666666667
[[ 7 0 0]
[ 0 11 1]
[ 0 0 11]]
precision recall f1-score support
Iris-setosa 1.00 1.00 1.00 7
Iris-versicolor 1.00 0.92 0.96 12
Iris-virginica 0.92 1.00 0.96 11
avg / total 0.97 0.97 0.97 30
K-Neighbors Classifier
0.9
[[ 7 0 0]
[ 0 11 1]
[ 0 2 9]]
precision recall f1-score support
Iris-setosa 1.00 1.00 1.00 7
Iris-versicolor 0.85 0.92 0.88 12
Iris-virginica 0.90 0.82 0.86 11
avg / total 0.90 0.90 0.90 30
Decision Tree Classifier
0.9
[[ 7 0 0]
[ 0 11 1]
[ 0 2 9]]
precision recall f1-score support
Iris-setosa 1.00 1.00 1.00 7
Iris-versicolor 0.85 0.92 0.88 12
Iris-virginica 0.90 0.82 0.86 11
avg / total 0.90 0.90 0.90 30
Gaussian Naive-Bayes
0.8333333333333334
[[7 0 0]
[0 9 3]
[0 2 9]]
precision recall f1-score support
Iris-setosa 1.00 1.00 1.00 7
Iris-versicolor 0.82 0.75 0.78 12
Iris-virginica 0.75 0.82 0.78 11
avg / total 0.84 0.83 0.83 30
Support Vector Machines
0.9333333333333333
[[ 7 0 0]
[ 0 10 2]
[ 0 0 11]]
precision recall f1-score support
Iris-setosa 1.00 1.00 1.00 7
Iris-versicolor 1.00 0.83 0.91 12
Iris-virginica 0.85 1.00 0.92 11
avg / total 0.94 0.93 0.93 30
Nice work!
The difference in the result could be real or statistical noise.
In order to discover if the difference is real, statistical methods are required:
https://machinelearningmastery.com/start-here/#statistical_methods
Hi,
I’m wondering, is it possible to make confusion matrix based on just one attribute out of eg. 65 attributes? If it is possible, how? I’ve search, and used the parameter ‘target’, and resulted in 3×3 confusion matrix instead of 4×4 (the attribute has 4 categories). I wonder how it ended like that, and whether I had code it wrongly. Can you help give me some tips or explain how does this happen.
Thanks.
If you are trying to predict a class with 65 levels, that is challenging.
You can create a confusion matrix of 65×65, but it will be very difficult to read.
Nevertheless, here’s some code you can use:
https://machinelearningmastery.com/confusion-matrix-machine-learning/
Nice work! Very helpful
Thanks. I’m happy it helped.
Hello Jason How are you, your tutorial is so much effective to learn machine learning from scrach for all beginner like me. i have run your code successfully,but i faced problem during working on various dat set csv file, like : “https://www.kaggle.com/new-york-city/nyc-baby-names “.which contains various New York City baby names, including (mother’s) ethnicity information.when i run your code with this data set i got this error “ValueError: could not convert string to float: ‘HAZEL’ ” it is similar to all other data set, i keep the csv file column number to your irish data set column number.keep array same but every time i get same error,Please give me a solution,thanks in advance
I expect the code will require some modification before it can be applied to new problems.
I recommend that you follow this process:
https://machinelearningmastery.com/start-here/#process
Perhaps some of these tutorials will help:
https://machinelearningmastery.com/start-here/#python
Hello Jason, I got all the results right. But I also got three warnings while building the models:
C:\Python27\lib\site-packages\sklearn\linear_model\logistic.py:432: FutureWarning: Default solver will be changed to ‘lbfgs’ in 0.22. Specify a solver to silence this warning. FutureWarning)
C:\Python27\lib\site-packages\sklearn\linear_model\logistic.py:459: FutureWarning: Default multi_class will be changed to ‘auto’ in 0.22. Specify the multi_class option to silence this warning. “this warning.”, FutureWarning)
C:\Python27\lib\site-packages\sklearn\svm\base.py:196: FutureWarning: The default value of gamma will change from ‘auto’ to ‘scale’ in version 0.22 to account better for unscaled features. Set gamma explicitly to ‘auto’ or ‘scale’ to avoid this warning. “avoid this warning.”, FutureWarning)
I did not change anything in the code. Can you please tell me what is the error?
You can ignore the warning for now.
import warnings
warnings.filterwarnings(“ignore”, category=FutureWarning)
Put it in the beginning of code
Nice tip.
Hi Jason,
Thanks for your efforts, undoubtedly it was a good start.
But it’d be really nice if you can please add little more details about the interpretation of the graphs (what and how they’re providing such information) and the statistics (precision, recall, f1-score, support)
And last but not the least, would you please let us know which other tutorials should we follow afterwards? Please provide the links with priorities, one must follow in terms of diving a bit more into it but not yet intelligent enough in prioritising the guidelines /learning process. 🙂
Thanks.
A good place to start for more tutorials and their ordering is right here:
https://machinelearningmastery.com/start-here/#python
Thanks, I’ll check now. 🙂
Absolutely fantastic page… I’m just starting out with ML (with only fairly basic Python skills.. but a lot of programming background) but this is a great way to get going
My only suggestion would be to add a bit more text at the top to explain what we are trying to achieve with the flower data (sorry if I’ve missed it).
I think it’s ‘given the data.. predict what type of Iris each row (or subsequent rows) is’.. but.. I’m not 100% sure
Thanks Tim.
hey!
Can we use it for any other image classification ? like emotions,etc and how can we extract different features in this training like hog, sift or surf features etc..
thank you.
Sure.
Thank you very much for your thorough & helpful tutorial!
I’m glad it helped.
Hi Jaison,
This tutorial was very useful for a beginner like me. I have 2 queries:
1. How to save the trained model to some other file and use it for prediction, so that I need not run this entire code every time I want to do prediction for an input data?
2. How to visualize the training function on any plot of the data set after training? i.e., the curves separating the regions for the 3 classes we are having, on the data set plot.
This post shows how to save a trained final model:
https://machinelearningmastery.com/save-load-machine-learning-models-python-scikit-learn/
I think you mean: how to plot the decision surface?
Sorry, I don’t have an example of this, it’s more of a student exercise for small 2d problems.
I am very new to ML. I thought the field of ML is frustrating. But now, thanks for your result-oriented-step-by-step approach, I kind of like it. Many thanks dear! Keep the good work.
Thanks, I’m happy the tutorials are helping!
iam getting an error saying pandas not defined in loading the data step.please help me out.
Sounds like you need to install Pandas.
Perhaps this tutorial will help:
https://machinelearningmastery.com/setup-python-environment-machine-learning-deep-learning-anaconda/
Thank you. I had to write import statement in the code.
I got it now.
Iam getting an error called name error that dataset is not defined in 5.1
I have some suggestions here:
https://machinelearningmastery.com/faq/single-faq/why-does-the-code-in-the-tutorial-not-work-for-me
hi. thanks for the great tutorial!
one thing i don’t understand though- in section 5.3 your write:
“We get an idea from the plots that some of the classes are partially linearly separable in some dimensions, so we are expecting generally good results.”
could you please elaborate a little bit about that? it seems to me like all groupings of data points on all parameters combinations are very heterogeneous in regards to classes, aren’t they?
I am suggesting that if the classes look linearly separable, that most models will find a way to separate them.
I am applying on my dataset that raises accuracy of about 92% in matlab apps, but here I am trying on both nn and on the examples above, my accuracy is not increasing then that of 40%…
I have some suggestions for improving neural network performance here:
https://machinelearningmastery.com/improve-deep-learning-performance/
Hi Jason!
It’s really helpful. Can you suggest me how to plot the classified samples to show visual classification to a lay man. That see how was the original data and how it is after classifying?
Thanks.
I don’t understand, how would this plot look exactly?
Hi Jason,
Thank you so much for these perfect tutorials. I however have a question regarding the application of the machine learning analysis, and as I am a beginner in this domain I feel like I have some lack of terminology here which makes the search for the answer relatively hard. So I apology in advance if you already answered the question on one of the page of the website and if I just missed it.
I have a dataset made of objects belonging to either class A or class B, and obviously I want the algorithms to determine for each object its class. And this work perfectly so far (90-95% of accuracy with SVM, NB and KNN algorithms). However, I ‘overfed’ on purpose the training set by inputing N parameters to build the prediction models, while usually only a third of this N parameters are known to be relevant for the classification (when classifying these objects by hand, I mean).
I believe – but perhaps I am wrong here – that the ML models will weight each of the input parameters in term of relevance, and I would like now to access to these weights and I want to see if the classification is only made using the parameters known to be relevant or if another parameters left usually aside is also of importance for the classification.
So is there a way to extract the weight of each parameters as set by the prediction model?
Best regards,
An algorithm may or may not make the “weight” of each input available to you.
Instead, you can use methods designed to report the relevance or importance of each input variable. Some of these methods are called feature selection methods and others are called feature importance methods. You can get started here:
https://machinelearningmastery.com/an-introduction-to-feature-selection/
what about the audio dataset?
I hope to cover audio data in the future.
Here is another algorithm called Self-Organizing Maps apply on IRIS dataset, and works very well. The source code and demo have been posted on Github: https://github.com/njali2001/popsom , please feel free to enjoy it.
Thanks for sharing.
I have a question about how to find which algorithm is the best. Although it is a very basic question, I need it to know? In your example
Good question, I answer it here:
https://machinelearningmastery.com/faq/single-faq/what-algorithm-config-should-i-use
I simply have to say, the number of errors following your trail is truly frustrating.
-Dave.
What do you mean exactly Dave? Typos?
Hello Jason,
thank you very much for your input. The logistic regression is binary 1 and 0 .How can it determine 4 types of IRIS.Thank you very much
Good question. It can be used in a one vs all configuration for multi-class classification.
Hii,
when i am going to install scipy library with python 3.4 i got error message “python3.4 does not found registry”.
But i already install python 3.4.So,give me proper solution regarding it.
Perhaps use Python 3.5 or 3.6?
Thanks a lot, Jason. you’ll easy-to-understand tutorial gave me a very very quick intro to ML using Python. And it also pointed me to the advanced use of ML algorithms. Speeded up my work considerably. Thanks a lot!!!
Thanks, I’m glad it helped.
Hi Jason
I tried like what you said but non of them was more 40% accuracy! In addition how can I do regression to find misclassified?
Thanks
I don’t follow sorry, how do you want to use regression for classification exactly?
Great !! This was the first model I trained myself… I’ve recorded a video following the steps you described. Great idea of yours to create a walkthrough
Thanks, well done!
Thanks Jason.
I followed your step-by-step implementation in the tutorial and got similar results and I found it very helpful.
Well done!
sir i just want to know after writing this code spyder where we have to run this code for see its working.
I recommend saving the code to a text file and running from the command line.
I show how here:
https://machinelearningmastery.com/faq/single-faq/how-do-i-run-a-script-from-the-command-line
Hi Jason,
Thanks for this tutorial, please see the results that i had that were similar to yours, but in my case, the boxplot for the Algorithm Comparison did not have the blue dotted lines that you had for KNN, NB and SVM. The code is the same as yours and hence i am puzzled as to why is the boxplot a bit different?
LR: 0.966667 (0.040825)
LDA: 0.975000 (0.038188)
KNN: 0.983333 (0.033333)
CART: 0.975000 (0.038188)
NB: 0.975000 (0.053359)
SVM: 0.991667 (0.025000)
Thanks,
Sunil
Well done!
Differences may be due to the stochastic nature of the algorithms:
https://machinelearningmastery.com/randomness-in-machine-learning/
I just want to thank u for this efforts , Iam new at the track and this tutorial took about 3 days from me to understand most things ;”)
but it really helped me . it is a very good starting point . again thank u very much
God bless you
Well done for making it through!
Hi Jason Brownlee. I am following your tutorials from the last 2 months time to time and I am learning things quite in a nice manner. I have a question why is the result different for selecting the best model when I am printing the results in a separate for loop:
for count in range(len(names)):
msg = “{0}: {1} ({2})”.format(names[count], cv_results[count].mean(), cv_results[count].std())
print(msg)
SVC: 1.0 (0.0)
LR: 0.9166666666666666 (0.0)
KNN: 1.0 (0.0)
CART: 0.8333333333333334 (0.0)
GNB: 1.0 (0.0)
LDA: 1.0 (0.0)
It seems like it rounds it but why not in the other ones?
I would appreciate your response.
Perhaps this will help:
https://machinelearningmastery.com/faq/single-faq/why-do-i-get-different-results-each-time-i-run-the-code
sir, I got an error as –
Type error : “LogisticRegression ” object is not iterable
please help me out to remove this error
I have some suggestions here:
https://machinelearningmastery.com/faq/single-faq/why-does-the-code-in-the-tutorial-not-work-for-me
It has been specified that either theano or tensorflow will be required. pertaining to the fact that tensorflow is cumbersome to install in windows, I successfully installed theano. But installation and verification of keras requires tensorflow as it contains commands with tensorflow module. Trying to install tensorflow gave problems as told. How do I proceed with the setting up of the environment?
Keras can be configured to use Theano instead of TensorFlow:
https://keras.io/backend/#switching-from-one-backend-to-another
nice posts..
Thanks.
I’m new in python.. What exactly we predict in this project with the help of different algorithms?
You are learning how to predict the specifies of iris flower given measurements of the flowers.
Hey Jason – nice tutorial. I wanted to collect your thoughts (apologies if this was addressed earlier in the thread, but the thread is quite long). I’ve run this exercise in both Python and R, as I wanted to compare the algorithms in both languages, and I’ve noticed that the predictive power in R seems to be consistently higher on the test sets (see confusion matrix), even though overall accuracy is lower, with Linear Discriminant Analysis (LDA) consistently the most performant. In Python, the test sets seem to not be predicted as well (see confusion matrix) even though accuracy is generally higher and Support Vector Machines (SVM) consistently more performant in Python. What explains this difference? It surprised me because I considered I might model something in R and then convert the code over to Python, but this somewhat alters those kinds of plans if the model would need to change in the process.
R
Accuracy
Min. 1st Q u. Median Mean 3rd Qu. Max. NA’s
lda 0.9666667 0.9666667 0.9833333 0.9833333 1.0000000 1 0
cart 0.8666667 0.9416667 0.9666667 0.9533333 0.9666667 1 0
knn 0.9333333 0.9666667 0.9666667 0.9733333 0.9916667 1 0
svm 0.9333333 0.9666667 1.0000000 0.9833333 1.0000000 1 0
rf 0.9000000 0.9666667 0.9666667 0.9633333 0.9666667 1 0
Linear Discriminant Analysis
120 samples
4 predictor
3 classes: ‘setosa’, ‘versicolor’, ‘virginica’
No pre-processing
Resampling: Repeated Train/Test Splits Estimated (10 reps, 75%)
Summary of sample sizes: 90, 90, 90, 90, 90, 90, …
Resampling results:
Accuracy Kappa
0.9833333 0.975
onfusion Matrix and Statistics
Reference
Prediction setosa versicolor virginica
setosa 10 0 0
versicolor 0 10 1
virginica 0 0 9
Overall Statistics
Accuracy : 0.9667
95% CI : (0.8278, 0.9992)
No Information Rate : 0.3333
P-Value [Acc > NIR] : 2.963e-13
Kappa : 0.95
Mcnemar’s Test P-Value : NA
Python:
looping through each model and evaluating
LR: 0.983333 (0.033333)
LDA: 0.975000 (0.038188)
KNN: 0.983333 (0.033333)
CART: 0.983333 (0.033333)
NB: 0.975000 (0.053359)
SVM: 0.991667 (0.025000)
Support Vector Machine:
0.9333333333333333
[[ 7 0 0]
[ 0 10 2]
[ 0 0 11]]
precision recall f1-score support
setosa 1.00 1.00 1.00 7
versicolor 1.00 0.83 0.91 12
virginica 0.85 1.00 0.92 11
micro avg 0.93 0.93 0.93 30
macro avg 0.95 0.94 0.94 30
weighted avg 0.94 0.93 0.93 30
Interesting.
It might be differences in a range of things, for example: model evaluation scheme, random number seeds, implementation details, etc.
Hello,
esults=[]
names = []
for name, model in models:
kfold = model_selection.KFold(n_splits=10, random_state=seed)
cv_resuts = model_selection.cross_val_score(model, X_train, Y_train, cv=kfold, scoring=scoring)
results.append(cv_resuts)
names.append(name)
msg = “%s: %f (%f)” %(name, cv_resuts.mean(), cv_resuts().std())
print(msg)
I had this error, msg = “%s: %f (%f)” %(name, cv_resuts.mean(), cv_resuts().std())
TypeError: ‘numpy.ndarray’ object is not callable
what was it?
thanks
Sorry to hear that, I have some suggestions here:
https://machinelearningmastery.com/faq/single-faq/why-does-the-code-in-the-tutorial-not-work-for-me
sir can you help me to run the above code am getting confused to use any other application for it or in python IDLE it self
I explain how to run code from the command line here:
https://machinelearningmastery.com/faq/single-faq/how-do-i-run-a-script-from-the-command-line
I am getting a output showing the error message while checking for best model. Can you help me clarify my doubt?
Traceback (most recent call last):
File “E:\Project\Implementation\sample.py”, line 48, in
cv_results = model_selection.cross_val_score(model, X_train, Y_train, cv=kfold, scoring=scoring)
File “C:\Users\user\AppData\Local\Programs\Python\Python36-32\lib\site-packages\sklearn\model_selection\_validation.py”, line 342, in cross_val_score
pre_dispatch=pre_dispatch)
File “C:\Users\user\AppData\Local\Programs\Python\Python36-32\lib\site-packages\sklearn\model_selection\_validation.py”, line 206, in cross_validate
for train, test in cv.split(X, y, groups))
File “C:\Users\user\AppData\Local\Programs\Python\Python36-32\lib\site-packages\sklearn\externals\joblib\parallel.py”, line 779, in __call__
while self.dispatch_one_batch(iterator):
File “C:\Users\user\AppData\Local\Programs\Python\Python36-32\lib\site-packages\sklearn\externals\joblib\parallel.py”, line 625, in dispatch_one_batch
self._dispatch(tasks)
File “C:\Users\user\AppData\Local\Programs\Python\Python36-32\lib\site-packages\sklearn\externals\joblib\parallel.py”, line 588, in _dispatch
job = self._backend.apply_async(batch, callback=cb)
File “C:\Users\user\AppData\Local\Programs\Python\Python36-32\lib\site-packages\sklearn\externals\joblib\_parallel_backends.py”, line 111, in apply_async
result = ImmediateResult(func)
File “C:\Users\user\AppData\Local\Programs\Python\Python36-32\lib\site-packages\sklearn\externals\joblib\_parallel_backends.py”, line 332, in __init__
self.results = batch()
File “C:\Users\user\AppData\Local\Programs\Python\Python36-32\lib\site-packages\sklearn\externals\joblib\parallel.py”, line 131, in __call__
return [func(*args, **kwargs) for func, args, kwargs in self.items]
File “C:\Users\user\AppData\Local\Programs\Python\Python36-32\lib\site-packages\sklearn\externals\joblib\parallel.py”, line 131, in
return [func(*args, **kwargs) for func, args, kwargs in self.items]
File “C:\Users\user\AppData\Local\Programs\Python\Python36-32\lib\site-packages\sklearn\model_selection\_validation.py”, line 458, in _fit_and_score
estimator.fit(X_train, y_train, **fit_params)
File “C:\Users\user\AppData\Local\Programs\Python\Python36-32\lib\site-packages\sklearn\linear_model\logistic.py”, line 1217, in fit
check_classification_targets(y)
File “C:\Users\user\AppData\Local\Programs\Python\Python36-32\lib\site-packages\sklearn\utils\multiclass.py”, line 172, in check_classification_targets
raise ValueError(“Unknown label type: %r” % y_type)
ValueError: Unknown label type: ‘unknown’
>>>
Sorry to hear that, I have some suggestions here:
https://machinelearningmastery.com/faq/single-faq/why-does-the-code-in-the-tutorial-not-work-for-me
After much failure, I was able to get this to work!
however I had to set the LR model as follows to prevent error due to getting a ‘future warning error’
LogisticRegression(solver=’lbfgs’, multi_class=’auto’, max_iter=1000)
as well as:
SVC(gamma=’auto’)
my results were as follows:
LR: 0.983333 (0.033333)
LDA: 0.975000 (0.038188)
KNN: 0.983333 (0.033333)
CART: 0.983333 (0.033333)
NB: 0.975000 (0.053359)
SVM: 0.991667 (0.025000)
———————————————
0.9333333333333333
[[ 7 0 0]
[ 0 10 2]
[ 0 0 11]]
precision recall f1-score support
Iris-setosa 1.00 1.00 1.00 7
Iris-versicolor 1.00 0.83 0.91 12
Iris-virginica 0.85 1.00 0.92 11
micro avg 0.93 0.93 0.93 30
macro avg 0.95 0.94 0.94 30
weighted avg 0.94 0.93 0.93 30
I am a complete beginner with ML but this at least gave me a place to start. Do you think the changes I made to the parameters or the models could have changed the data to make it less accurate?
again thanks for this tutorial!
Well done!
I believe they were just warnings, not errors. You can safely ignore them.
very nice job done ,can you make on A.I
AI is a large field of study and ML is a subfield of AI, more here:
https://machinelearningmastery.com/faq/single-faq/how-are-ai-and-ml-related
Hey Guys – Need help.
import pandas errors out – raise ImportError(‘dateutil 2.5.0 is the minimum required version’)
Forums talks about lowering version – are they referring to downgrade from version 2.7 of python?
then import sklearn fails – ImportError: No module named sklearn
I was able to install sklearn from this command sudo pip install -U scikit-learn scipy matplotlib
my pip version is 9.0.1. Is that the problem?
I have not seen this error, perhaps try posting on stackoverflow?
Thank you for the instruction. I am learning how to use the method to do my project. I have a dataset with X and Y, X are all 5-min resolution data , Y has both 5-min and 30-min data. Now I need to forecast 30-min data and the probability, which way should I go?
1) aggregate all 5-min X data to 30-min X data by averaging 5-min data in every 30 minute, then use 30-min X data and 30-min Y data to do training and testing, in this way, the probability can be easily forecast. My concern is I have some time sensitive X data. If I use 30-min X data to do forecast, it won’t reflect the variability of X data as accurate as in 5-min resolution. this would lead to inaccurate forecast in Y data.
2) use all 5-min X data and 5-min Y data to do training and testing, and forecast 5-min Y data with the trained model, then average the 5-min Y data into 30-min Y data. But in this way, how can I get the probability for the 30-min Y data, the trained model can only forecast probability for 5-min Y data directly. Is there any way to convert the probability from 5-min resolution to 30-min?
The above tutorial won’t be very useful if you are working with time series data.
You can get started with time series forecasting here:
https://machinelearningmastery.com/start-here/#timeseries
I have advanced material here:
https://machinelearningmastery.com/start-here/#deep_learning_time_series
Sir, you are too good. It took me just hours to learn the basics of machine learning on Python. Thank you so much.
Well done!
Hello
Thanks for your good training.
I have a question from you.
I want to predict the probability value for every 0
That is, how much is it possible to convert from 0 to 1
what do I do
help me.
thanks a lot
You can use model.predict_proba()
I explain more here:
https://machinelearningmastery.com/make-predictions-scikit-learn/
Hello Jason,
Just worked through the tutorial, and I learnt a bunch of things along the way, as well as saw the whole pipeline of classification projects as implemented in industry. But it was all for classification. Do you’ve similar tutorials like this for regression, time series etc.?
Yes, I have many examples, perhaps start here:
https://machinelearningmastery.com/spot-check-regression-machine-learning-algorithms-python-scikit-learn/
hello Jason i bought your book (deep learning with python ) it’s very important. so my question is what’s the best function activation used for multiclassification (Example IRIS) .
The activation function in the output layer should be softmax and the loss function should be categorical cross entropy.
thank ‘s Jason
(base) C:\Users\pedro>python
Python 3.7.1 (default, Dec 10 2018, 22:54:23) [MSC v.1915 64 bit (AMD64)] :: Anaconda, Inc. on win32
Type “help”, “copyright”, “credits” or “license” for more information.
>>> #numpy
… import numpy
>>> print(‘numpy: %s’ % numpy.__version__)
numpy: 1.15.4
>>> #matplotlib
… import matplotlib
>>> print(‘matplotlib: %s’ % matplotlib.__version__)
matplotlib: 3.0.2
>>> #pandas
… import pandas
>>> print(‘pandas: %s’ % pandas.__version__)
pandas: 0.23.4
>>> #statsmodels
… import statsmodels
>>> print(‘statsmodels: %s’ % statsmodels.__version__)
statsmodels: 0.9.0
>>> #scikit_learn
… import sklearn
>>> print(‘sklearn: %s’ % sklearn.__version__)
sklearn: 0.20.1
>>>
Well done!
No bugs. Got it to work in Ubuntu and Windows 10. Thank you!
Well done!
Great article.
Thanks.
Thank you for the tutorial. Amazing work done to get kick started on machine learning. I followed the tutorial and got same cross validation score as yours. But for testing purpose i calculated the prediction score for each of the models and got the result as follows :
LR : 0.8
LDA : 0.9666666666666667
KNN : 0.9
CART : 0.9
NB : 0.8333333333333334
SVM : 0.9333333333333333
Based on the cross validation score if we select KNN but the prediction score of LDA is highest here. Why is that? Can you help me in drawing some conclusion here.
Thanks 🙂
You can expect some variability around the model evaluation, I explain more here:
https://machinelearningmastery.com/randomness-in-machine-learning/
Hello Jason,
Thank you for the tutorials. Really amazing! It was really straight forward.
I didn’t have to change a thing. What next after this.
My results are similar to yours.
LR: 0.966667 (0.040825)
LDA: 0.975000 (0.038188)
KNN: 0.983333 (0.033333)
CART: 0.975000 (0.038188)
NB: 0.975000 (0.053359)
SVM: 0.991667 (0.025000)
Best regards.
Well done!
i am happy to say that i have used your some of your guide, especially the #Spot Check Algorithms to perfection.
Thanks, I’m glad it helped!
how do you manage to fix the warning error? i also have that error in my different code.
Perhaps ensure that your libraries are up to date?
What warnings?
Multiple error like this
/home/user/.local/lib/python3.5/site-packages/sklearn/utils/validation.py:761: DataConversionWarning: A column-vector y was passed when a 1d array was expected. Please change the shape of y to (n_samples, ), for example using ravel().
y = column_or_1d(y, warn=True)
/home/user/.local/lib/python3.5/site-packages/sklearn/utils/validation.py:761: DataConversionWarning: A column-vector y was passed when a 1d array was expected. Please change the shape of y to (n_samples, ), for example using ravel().
y = column_or_1d(y, warn=True)
/home/user/.local/lib/python3.5/site-packages/sklearn/utils/validation.py:761: DataConversionWarning: A column-vector y was passed when a 1d array was expected. Please change the shape of y to (n_samples, ), for example using ravel().
y = column_or_1d(y, warn=True)
/home/user/.local/lib/python3.5/site-packages/sklearn/utils/validation.py:761: DataConversionWarning: A column-vector y was passed when a 1d array was expected. Please change the shape of y to (n_samples, ), for example using ravel().
y = column_or_1d(y, warn=True)
main.py:122: DataConversionWarning: A column-vector y was passed when a 1d array was expected. Please change the shape of y to (n_samples, ), for example using ravel().
knn.fit(X_train, Y_train)
KNN: 0.957953 (0.006179)
CART: 0.987552 (0.003800)
NB: 0.916668 (0.006903)
SVM: 0.658934 (0.055898)
LR: 1.000000 (0.000000)
LDA: 0.977768 (0.005342)
KNN: 0.957953 (0.006179)
CART: 0.988441 (0.004228)
NB: 0.916668 (0.006903)
SVM: 0.658934 (0.055898)
0.9649390243902439
[[973 35]
[ 34 926]]
precision recall f1-score support
L 0.97 0.97 0.97 1008
W 0.96 0.96 0.96 960
micro avg 0.96 0.96 0.96 1968
macro avg 0.96 0.96 0.96 1968
weighted avg 0.96 0.96 0.96 1968
although it print the desire output. but i hate that error. how can i fix?
libraries version
Python: 3.5.1 (default, Jul 5 2018, 13:06:10)
[GCC 5.4.0 20160609]
scipy: 1.2.1
numpy: 1.16.1
matplotlib: 3.0.2
pandas: 0.24.1
sklearn: 0.20.2
You cha fix your errors by reshaping your data to be 2d arrays.
More on reshaping numpy arrays here:
https://machinelearningmastery.com/index-slice-reshape-numpy-arrays-machine-learning-python/
Dear Jason,
Thanks for the useful and interesting materials.
I have a question please: you said in 5.4 Select Best Model “In this case, we can see that it looks like Logistic Regression (LR) has the largest estimated accuracy score.”
In fact LR has the lowest mean. do you mean low mean = high accuracy? but we could have high mean with high accuracy. Could you please make it clear? thank you.
It was a typo given a recent update to the post. I have fixed it.
Hi,
I guess SVN has the highest accuracy not KNN, or I am wrong.
please see the results:
LR: 0.966667 (0.040825)
LDA: 0.975000 (0.038188)
KNN: 0.983333 (0.033333)
CART: 0.975000 (0.038188)
NB: 0.975000 (0.053359)
SVM: 0.991667 (0.025000)
Thanks
Yes, I have updated the text accordingly. Thanks!
hello jason, how to you manage the warning error before you update this code? i experiencing same error
I will have a post about how to fix warning soon.
Until then, I recommend reading the warning message text and the API for the function – they will tell you how to fix the warnings.
How can we get the Model function which we have created in this section ? means structure of the model in the forms of variables
We typically do not get the equation for machine learning models as it is often intractable.
Though you’ve mentioned my results may vary… from top till bottom, I got the exact same result as your screenshots… bang… Thanks for the article… though a longer path to go still, one step at a time. Thanks.
I’m glad to hear that!
Hi Jason,
I got the same results, but I don’t understand why you mention “K-Nearest Neighbors (KNN) has the largest estimated accuracy score.” According to the list, SVM presents a higher score
LR: 0.966667 (0.040825)
LDA: 0.975000 (0.038188)
KNN: 0.983333 (0.033333)
CART: 0.975000 (0.038188)
NB: 0.975000 (0.053359)
SVM: 0.991667 (0.025000)
why?
I describe SVM as getting the best result.
Thank you, Jason. This is an excellent resource, as are your other posts.
Thanks, I’m glad it helped!
can we use two machine learning algorithm simultaneously like Clustering (K-means) with Naive Bayes?
Sure.
Can you please help me to understand. First you make standard test_train_spit and next you make cross validation. Shouldn’t we do either this or that? You use cross validation only to select best model but you do predictions on initially created train,test datasets (80%,20%).
We can overfit during cross validation model selection. It is helpful to have a final dataset to help confirm the chosen model/models are skillful on unseen data.
This is just a suggestion, you can model the problem any way you wish.
cannot import name ‘cross_validation’ from ‘sklearn’ (C:\ProgramData\Anaconda3\lib\site-packages\sklearn\__init__.py)
I’m getting error for this line …how can i fix this??
You must ensure that your version of scikit-learn is up to date, e.g. 0.18 or higher.
Just to make sure. I was given a task: Use leave-one-out cross-validation to determine the correct model and report the results in terms of average performance across cross-validation samples.
First I split dataset to Train/Test samples.
Then I use leave one out cross val (on train sample) to determine best model.
After that I predict values using cross_val_score on test sample only or on whole dataset?
That is one approach.
Instead, I would recommend split into train/test, use k-fold cv on train for model selection, then fit a final model on all train and evaluate on test to get an unbiased idea of how good the model might be. Then fit a new final model on all data and start using it to make predictions on real unseen data.
Does that help?
Yes, thank you! It makes perfect sense. What about GridSearchCV? On what sample should I run it (test, train, whole?)
The training set.
Fantastic – thank you for the tutorial – got mine working first time – now reading back through it to understand more. Many Thanks Jason.
Thanks, well done!
Dear Jason,
Thanks for the useful and interesting materials.But, how to handle the Outliers.
Is there any best practices to do so? Should it be handle before we split the data?
Great question, a good place to start is here:
https://machinelearningmastery.com/how-to-identify-outliers-in-your-data/
Here is a very simple and effective method that you can use:
https://machinelearningmastery.com/how-to-use-statistics-to-identify-outliers-in-data/
Hello sir, I hope this meets you well. Thank you very much for this tutorial.
Right now, I’m trying to use this lesson to assist me in my own predictions.
I am using a lung cancer dataset that has attributes of 2 or 1 which gives a yes or no output for the chances of lung cancer.
I’ve been getting some errors from the statistical summary downwards, please how do I go about this.
Secondly, if I am able to successfully make predictions at the end after taking the necessary steps you suggest, how do I implement this prediction in my web application.
Perhaps some of these tutorials will help:
https://machinelearningmastery.com/start-here/#python
I have some advice about developing a final model here:
https://machinelearningmastery.com/train-final-machine-learning-model/
And about putting it into production:
https://machinelearningmastery.com/deploy-machine-learning-model-to-production/
Thank you, I tried it and It worked perfectly!
I read your post on how to save and load a model with sci-kit learn to make predictions but I don’t quite get it…. After saving this model using pickle, how do I enter new inputs to get a prediction from this model??
Please I need clarification
Hi! this is really awesome first project! and the blog as a whole is amazing and very useful!
Thanks a lot!
in the sklearn docs I found an option for ordinary KFold() function StratifiedKFold().
This is basically the same with only difference it returns stratified folds. The folds are made with preserving the percentage of samples for each class. I think this is especially useful with very unbalanced classes ditribution
Nice work, yes, it is a good idea to use the stratified version if the classes are imbalanced.
hello the project is really helpful
i wanted to know how to load the data from the stored csv file in my system??
and how to use something else rather than panda??
as i am working with air quality data to categorized air pollution trends and predict the early predictions for the air quality please rply sir
If you are working with time series, I recommend starting here:
https://machinelearningmastery.com/start-here/#timeseries
This will help you:
https://machinelearningmastery.com/load-machine-learning-data-python/
hey i tried doing things as you have suggested but the file that i have to fetch is something like this https://github.com/yukti23/Data_Predictions/blob/master/test.csv
please help how to fetch this
What problem are you having exactly?
this is the error
File “”, line 3
filename = ‘test.csv’ as csv file
^
SyntaxError: invalid syntax
I have some suggestions here:
https://machinelearningmastery.com/faq/single-faq/why-does-the-code-in-the-tutorial-not-work-for-me
using yours dataset and implementing things the way you implemented that is working correctly but further when i m implementing for my own dataset the error comes
What errors?
hi sir,
I am facing error in the step of “cv_results = model_selection.cross_val_score(model, X_train, Y_train, cv=kfold, scoring=scoring)”
will you please resolve.I am unable to understand this.
error named is :
C:\Users\HPPC\Anaconda3\lib\site-packages\sklearn\model_selection\_validation.py:542: FutureWarning: From version 0.22, errors during fit will result in a cross validation score of NaN by default. Use error_score=’raise’ if you want an exception raised or error_score=np.nan to adopt the behavior from version 0.22.
FutureWarning)
—————————————————————————
ValueError Traceback (most recent call last)
in
12 for name, model in models:
13 kfold = model_selection.KFold(n_splits=10, random_state=seed)
—> 14 cv_results = model_selection.cross_val_score(model, X_train, Y_train, cv=kfold, scoring=scoring)
15 results.append(cv_results)
16 names.append(name)
~\Anaconda3\lib\site-packages\sklearn\model_selection\_validation.py in cross_val_score(estimator, X, y, groups, scoring, cv, n_jobs, verbose, fit_params, pre_dispatch, error_score)
400 fit_params=fit_params,
401 pre_dispatch=pre_dispatch,
–> 402 error_score=error_score)
403 return cv_results[‘test_score’]
404
~\Anaconda3\lib\site-packages\sklearn\model_selection\_validation.py in cross_validate(estimator, X, y, groups, scoring, cv, n_jobs, verbose, fit_params, pre_dispatch, return_train_score, return_estimator, error_score)
238 return_times=True, return_estimator=return_estimator,
239 error_score=error_score)
–> 240 for train, test in cv.split(X, y, groups))
241
242 zipped_scores = list(zip(*scores))
~\Anaconda3\lib\site-packages\sklearn\externals\joblib\parallel.py in __call__(self, iterable)
915 # remaining jobs.
916 self._iterating = False
–> 917 if self.dispatch_one_batch(iterator):
918 self._iterating = self._original_iterator is not None
919
~\Anaconda3\lib\site-packages\sklearn\externals\joblib\parallel.py in dispatch_one_batch(self, iterator)
757 return False
758 else:
–> 759 self._dispatch(tasks)
760 return True
761
~\Anaconda3\lib\site-packages\sklearn\externals\joblib\parallel.py in _dispatch(self, batch)
714 with self._lock:
715 job_idx = len(self._jobs)
–> 716 job = self._backend.apply_async(batch, callback=cb)
717 # A job can complete so quickly than its callback is
718 # called before we get here, causing self._jobs to
~\Anaconda3\lib\site-packages\sklearn\externals\joblib\_parallel_backends.py in apply_async(self, func, callback)
180 def apply_async(self, func, callback=None):
181 “””Schedule a func to be run”””
–> 182 result = ImmediateResult(func)
183 if callback:
184 callback(result)
~\Anaconda3\lib\site-packages\sklearn\externals\joblib\_parallel_backends.py in __init__(self, batch)
547 # Don’t delay the application, to avoid keeping the input
548 # arguments in memory
–> 549 self.results = batch()
550
551 def get(self):
~\Anaconda3\lib\site-packages\sklearn\externals\joblib\parallel.py in __call__(self)
223 with parallel_backend(self._backend, n_jobs=self._n_jobs):
224 return [func(*args, **kwargs)
–> 225 for func, args, kwargs in self.items]
226
227 def __len__(self):
~\Anaconda3\lib\site-packages\sklearn\externals\joblib\parallel.py in (.0)
223 with parallel_backend(self._backend, n_jobs=self._n_jobs):
224 return [func(*args, **kwargs)
–> 225 for func, args, kwargs in self.items]
226
227 def __len__(self):
~\Anaconda3\lib\site-packages\sklearn\model_selection\_validation.py in _fit_and_score(estimator, X, y, scorer, train, test, verbose, parameters, fit_params, return_train_score, return_parameters, return_n_test_samples, return_times, return_estimator, error_score)
526 estimator.fit(X_train, **fit_params)
527 else:
–> 528 estimator.fit(X_train, y_train, **fit_params)
529
530 except Exception as e:
~\Anaconda3\lib\site-packages\sklearn\linear_model\logistic.py in fit(self, X, y, sample_weight)
1284 X, y = check_X_y(X, y, accept_sparse=’csr’, dtype=_dtype, order=”C”,
1285 accept_large_sparse=solver != ‘liblinear’)
-> 1286 check_classification_targets(y)
1287 self.classes_ = np.unique(y)
1288 n_samples, n_features = X.shape
~\Anaconda3\lib\site-packages\sklearn\utils\multiclass.py in check_classification_targets(y)
169 if y_type not in [‘binary’, ‘multiclass’, ‘multiclass-multioutput’,
170 ‘multilabel-indicator’, ‘multilabel-sequences’]:
–> 171 raise ValueError(“Unknown label type: %r” % y_type)
172
173
ValueError: Unknown label type: ‘continuous’
I have some suggestions here:
https://machinelearningmastery.com/faq/single-faq/why-does-the-code-in-the-tutorial-not-work-for-me
Hi,
Great tutorial, every thing works fine until I actually try buildig the model
I get an error
line 79, in
cv_results = model.selection.cross_val_score(model, X_train, Y_train, cv=kfold, scoring=scoring)
AttributeError: ‘LogisticRegression’ object has no attribute ‘selection’
I
I think there is a typo in your code, perhaps double check the tutorial. e.g. model.selection should be model_selection.
Hi thank you for this tutorial. Do you have any links dealing with the problem of missing values
Yes, you can get started with missing data here:
https://machinelearningmastery.com/faq/single-faq/how-do-i-handle-missing-data
very nicely done, Jason! I used Jupyter notebook and had no issues replicating your findings using similar package versions. All the errors I encountered were my own typos.
a few questions:
1. SVM seems to have performed better; is there a reason you chose to show validation for KNN instead? (my validation of SVM shows 93% accuracy.)
2. Is the reason you call knn.fit() on the training data again because model parameters don’t persist beyond appending results to the list?
Well done!
Not really, just an example.
Fit will create an efficient representation of the training data.
Thanks so much Jason! This (along with your “How to Setup a Python Environment) were incredibly straightforward and easy to follow. The only minor confusion was that you need to run all the code within one file, but I was able to figure that out from the comments (might be worth noting up top though). I’ve never done a coding tutorial that worked so cleanly 🙂
I am very excited to have just completed my first ML project.
Thank you!
Thanks, great suggestion Alex!
More on running a script from the command line here:
https://machinelearningmastery.com/faq/single-faq/how-do-i-run-a-script-from-the-command-line
Very good tutorial Jason, thank you very much!
I’m trying to apply ML to a project using what I learned here, currently in the phase of reshaping my model training data and could use some help with a problem.
Currently, all the values of my attributes are either a negative integer or “Not available” and I want the model to be trained to take into account when an attribute value is “Not available” because for a same Class I have rows with a value on that attribute and rows with “Not available” in that attribute. You have any tips on how to go about that?
Not available sounds like missing data.
This will help:
https://machinelearningmastery.com/faq/single-faq/how-do-i-handle-missing-data
please i have a error at this code line:
dataset.plot(kind=’box’, subplots=True, layout=(2,2), sharex=False, sharey=False)
it bring “”” this TypeError: Empty ‘DataFrame’ : no numeric data to plot “””
Sorry to hear that, perhaps this will help:
https://machinelearningmastery.com/faq/single-faq/why-does-the-code-in-the-tutorial-not-work-for-me
How to increase accuracy of predictive model.
Great question, I have some suggestions here:
https://machinelearningmastery.com/machine-learning-performance-improvement-cheat-sheet/
Build an application / web-page / mobile app which will perform the following tasks:
The program will take the following input: Weather (for example sunny, rainy etc), Season (e.g., summer, winter), Geographic Scene (e.g., hilly terrain, open field, crowded market etc) and other inputs which can be thought of by the students themselves. Given the input the program will generate a virtual reality scene. The generated virtual scene can be used for training ML algorithms to detect objects in varying environmental conditions.
can you give me suggestion in above problem??
Perhaps talk to your teacher if you having issues with your school assignment?
I believe a GAN would be required.
First ever example which worked without error/issues in first attempt..
Just want to add my +1
Well done!
Hi Jason,
thanks for your tutorial.
I don’t understand why the predictions are not made with the model previously constructed models[2] but with a new fit. Would it be possible to use the previous one?
Yes, you can make a prediction.
Here’s an example:
https://machinelearningmastery.com/how-to-make-classification-and-regression-predictions-for-deep-learning-models-in-keras/
Hi Jason,
i went to the tutorial.It is very helpful beginner. But i have a query regarding target variable how we will select class if it is not given in the data set.
If you don’t have a class, perhaps you want to predict a quantity? This is called regression.
More here:
https://machinelearningmastery.com/faq/single-faq/what-is-the-difference-between-classification-and-regression
Hey, I’m having problems with step 2.1 Import libraries. I have checked and my environment should be correct. it is printing out this code so far:
Python: 3.7.3 (default, Mar 27 2019, 16:54:48)
[Clang 4.0.1 (tags/RELEASE_401/final)]
scipy: 1.2.1
numpy: 1.16.2
matplotlib: 3.0.3
pandas: 0.24.2
statsmodels: 0.9.0
sklearn: 0.20.3
theano: 1.0.3
tensorflow: 1.13.1
Using TensorFlow backend.
keras: 2.2.4
Looks great, problem are you having exactly?
When I run the code:
# Load libraries
import pandas
from pandas.tools.plotting import scatter_matrix
import matplotlib.pyplot as plt
from sklearn import model_selection
from sklearn.metrics import classification_report
from sklearn.metrics import confusion_matrix
from sklearn.metrics import accuracy_score
from sklearn.linear_model import LogisticRegression
from sklearn.tree import DecisionTreeClassifier
from sklearn.neighbors import KNeighborsClassifier
from sklearn.discriminant_analysis import LinearDiscriminantAnalysis
from sklearn.naive_bayes import GaussianNB
from sklearn.svm import SVC
in pycharm it turns grey and wont run
I recommend running code from the command line:
https://machinelearningmastery.com/faq/single-faq/how-do-i-run-a-script-from-the-command-line
I can run everything up to the:
dataset.plot(kind=’box’, subplots=True, layout=(2,2), sharex=False, sharey=False)
plt.show()
Then the error i get is:
This application failed to start because it could not find or load the Qt platform plugin “cocoa”
in “”.
Reinstalling the application may fix this problem.
Perhaps try following this tutorial to setup your workstation:
https://machinelearningmastery.com/setup-python-environment-machine-learning-deep-learning-anaconda/
Hllo Sir
Your information was so important for me for my project but sir i want a classified image as an output.
Please tell me the solution for this.
You can get started here:
https://machinelearningmastery.com/start-here/#dlfcv
Hi,
I got the result of print(msg) as
LR: 0.966667 (0.040825)
LDA: 0.975000 (0.038188)
KNN: 0.983333 (0.033333)
CART: 0.983333 (0.033333)
NB: 0.975000 (0.053359)
SVM: 0.991667 (0.025000)
Where KNN and CART has the same result. I followed your project step by step. Why is my answer different?
Well done!
Good question, I answer it here:
https://machinelearningmastery.com/faq/single-faq/why-do-i-get-different-results-each-time-i-run-the-code
Thanks. I ran it again and got
LR: 0.966667 (0.040825)
LDA: 0.975000 (0.038188)
KNN: 0.983333 (0.033333)
CART: 0.975000 (0.038188)
NB: 0.975000 (0.053359)
SVM: 0.991667 (0.025000)
Nice work.
# Load dataset
url = “https://raw.githubusercontent.com/jbrownlee/Datasets/master/iris.csv”
names = [‘sepal-length’, ‘sepal-width’, ‘petal-length’, ‘petal-width’, ‘class’]
dataset = pandas.read_csv(url, names=names)
/Users/qiqi/PycharmProjects/ml/venv/bin/python /Users/qiqi/PycharmProjects/ml/ml53.py
Traceback (most recent call last):
File “/Users/qiqi/PycharmProjects/ml/ml53.py”, line 5, in
dataset = pandas.read_csv(url, names=names)
NameError: name ‘pandas’ is not defined
Process finished with exit code 1
Excuse me, I met the following error. And pandas are not in the last step. Thank you very much!
It suggests that pandas is not installed.
You can follow this tutorial to setup your development environment:
https://machinelearningmastery.com/setup-python-environment-machine-learning-deep-learning-anaconda/
Yes, I am following the instruction.
As a matter of fact, in the last step it showed that scipy: 1.2.1 numpy: 1.16.3
matplotlib: 3.0.3 pandas: 0.24.2 sklearn: 0.20.3.
I am curious about what is the problem. I saw someone met this question either but the answer does work for me. And I installed it on mac and am using Pycharm CE version. I will check it. Even if I used import pandas, it didn’t work. Thank you very much!
I recommend running code from the command line:
https://machinelearningmastery.com/faq/single-faq/how-do-i-run-a-script-from-the-command-line
Hello Dr.Jason,
I am using Pycharm IDE and in this particualr line :
cv_results= model_selection.cross_val_score(model, x_train, y_train, cv=kfold, scoring=scoring)
C:\Users\Lenovo\PycharmProjects\Sample_Project\venv\lib\site-packages\sklearn\model_selection\_validation.py:542: FutureWarning: From version 0.22, errors during fit will result in a cross validation score of NaN by default. Use error_score=’raise’ if you want an exception raised or error_score=np.nan to adopt the behavior from version 0.22.
FutureWarning)
Traceback (most recent call last):
File “C:/Users/Lenovo/PycharmProjects/Sample_Project/readingdatasets/Irisdataset.py”, line 63, in
cv_results= model_selection.cross_val_score(model, x_train, y_train, cv=kfold, scoring=scoring)
File “C:\Users\Lenovo\PycharmProjects\Sample_Project\venv\lib\site-packages\sklearn\model_selection\_validation.py”, line 402, in cross_val_score
error_score=error_score)
File “C:\Users\Lenovo\PycharmProjects\Sample_Project\venv\lib\site-packages\sklearn\model_selection\_validation.py”, line 240, in cross_validate
for train, test in cv.split(X, y, groups))
File “C:\Users\Lenovo\PycharmProjects\Sample_Project\venv\lib\site-packages\sklearn\externals\joblib\parallel.py”, line 917, in __call__
if self.dispatch_one_batch(iterator):
File “C:\Users\Lenovo\PycharmProjects\Sample_Project\venv\lib\site-packages\sklearn\externals\joblib\parallel.py”, line 759, in dispatch_one_batch
self._dispatch(tasks)
File “C:\Users\Lenovo\PycharmProjects\Sample_Project\venv\lib\site-packages\sklearn\externals\joblib\parallel.py”, line 716, in _dispatch
job = self._backend.apply_async(batch, callback=cb)
File “C:\Users\Lenovo\PycharmProjects\Sample_Project\venv\lib\site-packages\sklearn\externals\joblib\_parallel_backends.py”, line 182, in apply_async
result = ImmediateResult(func)
File “C:\Users\Lenovo\PycharmProjects\Sample_Project\venv\lib\site-packages\sklearn\externals\joblib\_parallel_backends.py”, line 549, in __init__
self.results = batch()
File “C:\Users\Lenovo\PycharmProjects\Sample_Project\venv\lib\site-packages\sklearn\externals\joblib\parallel.py”, line 225, in __call__
for func, args, kwargs in self.items]
File “C:\Users\Lenovo\PycharmProjects\Sample_Project\venv\lib\site-packages\sklearn\externals\joblib\parallel.py”, line 225, in
for func, args, kwargs in self.items]
File “C:\Users\Lenovo\PycharmProjects\Sample_Project\venv\lib\site-packages\sklearn\model_selection\_validation.py”, line 528, in _fit_and_score
estimator.fit(X_train, y_train, **fit_params)
File “C:\Users\Lenovo\PycharmProjects\Sample_Project\venv\lib\site-packages\sklearn\linear_model\logistic.py”, line 1289, in fit
check_classification_targets(y)
File “C:\Users\Lenovo\PycharmProjects\Sample_Project\venv\lib\site-packages\sklearn\utils\multiclass.py”, line 171, in check_classification_targets
raise ValueError(“Unknown label type: %r” % y_type)
ValueError: Unknown label type: ‘unknown’
Please help here
I have some suggestions here:
https://machinelearningmastery.com/faq/single-faq/why-does-the-code-in-the-tutorial-not-work-for-me
Hello Dr.Jason,
i use anaconda terminal on a windows 8.1 64 bit, python 3.7.3 64 bit
when import scipy i get this error :
(base) C:\Users\roberto>python
Python 3.7.3 (default, Mar 27 2019, 17:13:21) [MSC v.1915 64 bit (AMD64)] :: Anaconda, Inc. on win32
Type “help”, “copyright”, “credits” or “license” for more information.
>>> import scipy
Traceback (most recent call last):
File “”, line 1, in
File “C:\Users\roberto\Anaconda3\lib\site-packages\scipy\__init__.py”, line 62, in
from numpy import show_config as show_numpy_config
File “C:\Users\roberto\AppData\Roaming\Python\Python37\site-packages\numpy\__init__.py”, line 142, in
from . import core
File “C:\Users\roberto\AppData\Roaming\Python\Python37\site-packages\numpy\core\__init__.py”, line 23, in
WinDLL(os.path.abspath(filename))
File “C:\Users\roberto\Anaconda3\lib\ctypes\__init__.py”, line 356, in __init__
self._handle = _dlopen(self._name, mode)
OSError: [WinError 193] %1 non è un’applicazione di Win32 valida
>>>
—————————————————————————————————————–
but if i use python 3.7.3 32bit it’s all ok and i get all results as on your tutorial,
what’s happens? and what i have do to use anaconda terminal 64bit ?
Thank you very much!
(base) C:\Users\roberto>anaconda32
3.7.3 (v3.7.3:ef4ec6ed12, Mar 25 2019, 21:26:53) [MSC v.1916 32 bit (Intel)]
(base) C:\Users\roberto>python packVersXml.py
scipy: 1.2.1
numpy: 1.16.2
matplotlib: 3.0.3
pandas: 0.24.2
statsmodels: 0.9.0
sklearn: 0.20.3
(150, 5)
sepal-length sepal-width petal-length petal-width class
0 5.1 3.5 1.4 0.2 Iris-setosa
1 4.9 3.0 1.4 0.2 Iris-setosa
2 4.7 3.2 1.3 0.2 Iris-setosa
3 4.6 3.1 1.5 0.2 Iris-setosa
4 5.0 3.6 1.4 0.2 Iris-setosa
5 5.4 3.9 1.7 0.4 Iris-setosa
6 4.6 3.4 1.4 0.3 Iris-setosa
7 5.0 3.4 1.5 0.2 Iris-setosa
8 4.4 2.9 1.4 0.2 Iris-setosa
9 4.9 3.1 1.5 0.1 Iris-setosa
10 5.4 3.7 1.5 0.2 Iris-setosa
11 4.8 3.4 1.6 0.2 Iris-setosa
12 4.8 3.0 1.4 0.1 Iris-setosa
13 4.3 3.0 1.1 0.1 Iris-setosa
14 5.8 4.0 1.2 0.2 Iris-setosa
15 5.7 4.4 1.5 0.4 Iris-setosa
16 5.4 3.9 1.3 0.4 Iris-setosa
17 5.1 3.5 1.4 0.3 Iris-setosa
18 5.7 3.8 1.7 0.3 Iris-setosa
19 5.1 3.8 1.5 0.3 Iris-setosa
sepal-length sepal-width petal-length petal-width
count 150.000000 150.000000 150.000000 150.000000
mean 5.843333 3.054000 3.758667 1.198667
std 0.828066 0.433594 1.764420 0.763161
min 4.300000 2.000000 1.000000 0.100000
25% 5.100000 2.800000 1.600000 0.300000
50% 5.800000 3.000000 4.350000 1.300000
75% 6.400000 3.300000 5.100000 1.800000
max 7.900000 4.400000 6.900000 2.500000
class
Iris-setosa 50
Iris-versicolor 50
Iris-virginica 50
I recommend saving the script in a .py file and running it.
See this:
https://machinelearningmastery.com/faq/single-faq/how-do-i-run-a-script-from-the-command-line
Hi, Jason,
When I walked the step 4 of plt.show()
NameError: name ‘plt’ is not defined.
Should I install plt or what’s the potential error?
Thank you so much!
Perhaps you skipped some lines of code?
Thank you, Dr.Jason , my code worked and got my output,
Thanks for the help .
I just added one line line to my code ie.
y = y.astype(‘int’) and my code worked perfectly fine after that
Glad to hear it.
I don’t understand how to see the visualizations portion. I’m getting an output of the numeric values but cant see the graphs.
Try running the code from the command line:
https://machinelearningmastery.com/faq/single-faq/how-do-i-run-a-script-from-the-command-line
Does the DecisionTreeClasiifier() do pruning? If not, how to prune the tree? And is there any way to view the output hypothesis?
Yes it does, learn more here:
https://scikit-learn.org/stable/modules/generated/sklearn.tree.DecisionTreeClassifier.html
After executing the code of validation dataset we are not getting the graph of Box and Whisker Plot Comparing Machine Learning Algorithms on the Iris Flowers Dataset….We are getting nameError: name ‘model_selection’ is not defined…please give solution…
The error suggests you need to update your version of the sklearn library.
hello!
thank you for the tutorial. it was great to follow it along.
yes, i got the results in the end, indeed, but how to i input data to get a prediction for the trained model?
You can use model.predict().
I explain more here:
https://machinelearningmastery.com/make-predictions-scikit-learn/
Hi Jason. Great tutorial. I have a small question.
Under section “6. Make Predictions” you say “KNN algorithm is very simple and was an accurate model based on our tests”. How did you come to this conclusion ?
Previously, we established that SVM is most accurate as its value is 0.99. So why and how KNN is accurate here?
You can choose any model you wish, I chose knn because it did well and is not complex.
Hi Jason,
Thank you for this post 🙂
I have a question.
Every time I run the ‘for’ loop of section 5.3. the mean accuracy score and standard deviation for the Decision Tree Classifier changes.
This is not observed for any other model, but only for the Decision Tree model.
What could be the reason for this?
(I understand that the other models’ scores remain same because we are using the ‘seed’)
Best Regards.
Good question, this is common, I explain more here:
https://machinelearningmastery.com/faq/single-faq/why-do-i-get-different-results-each-time-i-run-the-code
Thanks for the link, Jason!
I have some questions –
Does the seed value to the parameter ‘random_state’ need to be same for the ‘train_test_split()’ function and the ‘KFold()’ function.
You have used 7 here for both. Is that just a coincidence?
Am I correct in understanding that the ‘seed’ value to ‘random_state’ puts a lock over the random shuffling and uses the same data splits which it used for the first time?
Also, what is the life of this state (random_state)?
Does it persist in memory or is this restricted to runs in that particular ‘session’ ?
Best Regards.
Also, are we evaluating the algorithms with both mean and standard deviation?
I understand that it is standard practice to include both as it gives you a correct idea of the variation in the data values. But in this case, does variation really matter?
If we add a 3rd column, “Coefficient of Variation”, should we deduce that the model with the least varied scores is the best performer or should we stick to the mean accuracy?
Best Regards.
Ideally we would pick a model that best serves a project goals/stakeholders. This might be a model that is more stable (lower variance).
The random state is just for the session, the run.
In modern tutorials, I don’t recommend fixing the random seed:
https://machinelearningmastery.com/faq/single-faq/why-do-i-get-different-results-each-time-i-run-the-code
Thank you very much for such an amazing tutotrial
You’re welcome, I’m glad it helped.
Hi Jason,
For improving my results using feature selection, I am referring to the correlation matrix and selecting mainly those features which have a relatively strong positive correlation with the target variable ‘quality’. Should the variables which show strong negative correlation be excluded or included in this case? Can you explain more on how to use the correlation matrix to arrive at decisions related to feature selection? Thanks for this helpful post BTW!
– Jerome
A strong positive or negative correlation may be useful.
This might help:
https://machinelearningmastery.com/how-to-calculate-nonparametric-rank-correlation-in-python/
Hi Jason,
Thanks for providing the reference to the correlation article you shared. But I am not very clear on some basic questions –
Q.1. – How do I use negative correlation?
If you can provide your comments on how negative correlation can be useful in this particular example (wine dataset), it will help me draw analogies and work out other problems using similar understanding.
Q.2. – Is the call on which features to include/exclude initially made by looking at the correlation matrix values? What is the process you personally follow when you have features negatively correlated with your target variable?
Do we only look at the magnitude of correlation when making these decisions?
Thanks in advance Jason.
Sign does not matter.
A strong negative or positive correlation between inputs may be a sign of redundant. Between inputs and outputs may be a sign of predictive features.
thanks Dr. Jason
You’re welcome.
hi have you ever worked with ecg classification system in physionet? i have trouble loading the dataset to work with. should i load them in csv file?
Sorry, I have not heard of “physionet”.
—————————————————————————
NameError Traceback (most recent call last)
in
2 # box and whisker plots
3 dataset.plot(kind=’box’, subplots=True, layout=(2,2), sharex=False, sharey=False)
—-> 4 plt.show()
NameError: name ‘plt’ is not defined
i face this problem in line 4.1 4.1 Univariate Plots
i have directly copied the code but unfortunately it keep showing this code.
Please help me out
Looks like you might have missed the matlotlib import statement.
Hi Jason,
This tutorial was really helpful to get started. But when i think of it, How should we select the apt classifier/estimator for a project?
In real world use cases, I assume that, there might be large amount of data . So training a classifier will take large amount of time. So, is it possible to train multiple estimators and pick-out the best one as we did here, considering time and space complexity?
Or how is it done in real use cases with millions of data?
Yes, test a suite of methods and select one that meets the objectives of the project (performance, complexity, etc.).
Often we want the simplest model (reliable) that preforms the best (skill).
I tried it for the first time, it worked but for the second time when i run this :
# Spot Check Algorithms
models = []
models.append((‘LR’, LogisticRegression()))
models.append((‘LDA’, LinearDiscriminantAnalysis()))
models.append((‘KNN’, KNeighborsClassifier()))
models.append((‘CART’, DecisionTreeClassifier()))
models.append((‘NB’, GaussianNB()))
models.append((‘SVM’, SVC()))
# evaluate each model in turn
results = []
names = []
for name, model in models:
kfold = cross_validation.KFold(n=num_instances, n_folds=num_folds, random_state=seed)
cv_results = cross_validation.cross_val_score(model, X_train, Y_train, cv=kfold, scoring=scoring)
results.append(cv_results)
names.append(name)
msg = “%s: %f (%f)” % (name, cv_results.mean(), cv_results.std())
print(msg)
I have this error
NameError Traceback (most recent call last)
in
11 names = []
12 for name, model in models:
—> 13 kfold = cross_validation.KFold(n=num_instances, n_folds=num_folds, random_state=seed)
14 cv_results = cross_validation.cross_val_score(model, X_train, Y_train, cv=kfold, scoring=scoring)
15 results.append(cv_results)
NameError: name ‘cross_validation’ is not defined
Looks like you might have forgotten the import statements?
No in the beginning i put this and i run it
import pandas
from pandas.plotting import scatter_matrix
import matplotlib.pyplot as plt
from sklearn import model_selection
from sklearn.model_selection import train_test_split
from sklearn.model_selection import cross_val_score
from sklearn.metrics import classification_report
from sklearn.metrics import confusion_matrix
from sklearn.metrics import accuracy_score
from sklearn.linear_model import LogisticRegression
from sklearn.tree import DecisionTreeClassifier
from sklearn.neighbors import KNeighborsClassifier
from sklearn.discriminant_analysis import LinearDiscriminantAnalysis
from sklearn.naive_bayes import GaussianNB
from sklearn.svm import SVC
hi sir!
it’s great to see such kind of post from you. I have applied this iris data in MATLAB and I get the same kind of result. sir i have some other dataset and the code is running properly but i a not able to plot its result. Your help will be highly appreciated
waiting for your kind response
Sorry, I don’t have tutorials in matlab, I cannot give you good off the cuff advice.
hi jason,
i tried a lot to solve indented block error….but I am stuck at it..pls help!
This will show you how to copy and paste the code and preserve the indenting:
https://machinelearningmastery.com/faq/single-faq/how-do-i-copy-code-from-a-tutorial
hi jason,
>>> # Spot Check Algorithms
… models = []
>>> models.append((‘LR’, LogisticRegression(solver=’liblinear’, multi_class=’ovr’)))
>>> models.append((‘LDA’, LinearDiscriminantAnalysis()))
>>> models.append((‘KNN’, KNeighborsClassifier()))
>>> models.append((‘CART’, DecisionTreeClassifier()))
>>> models.append((‘NB’, GaussianNB()))
>>> models.append((‘SVM’, SVC(gamma=’auto’)))
>>> # evaluate each model in turn
… results = []
>>> names = []
>>> for name, model in models:
… kfold = model_selection.KFold(n_splits=10, random_state=seed)
File “”, line 2
kfold = model_selection.KFold(n_splits=10, random_state=seed)
^
IndentationError: expected an indented block
>>> cv_results = model_selection.cross_val_score(model, X_train, Y_train, cv=kfold, scoring=scoring)
Traceback (most recent call last):
File “”, line 1, in
NameError: name ‘model’ is not defined
>>> results.append(cv_results)
Traceback (most recent call last):
File “”, line 1, in
NameError: name ‘cv_results’ is not defined
>>> names.append(name)
Traceback (most recent call last):
File “”, line 1, in
NameError: name ‘name’ is not defined
>>> msg = “%s: %f (%f)” % (name, cv_results.mean(), cv_results.std())
Traceback (most recent call last):
File “”, line 1, in
NameError: name ‘name’ is not defined
>>> print(msg)
Traceback (most recent call last):
File “”, line 1, in
NameError: name ‘msg’ is not defined
tried a lot to solve this ….but I am stuck.
This will show you how to safely copy code and preserve the indenting:
https://machinelearningmastery.com/faq/single-faq/how-do-i-copy-code-from-a-tutorial
thanks a lot….i did it…!!!
precision recall f1-score support
Iris-setosa 1.00 1.00 1.00 7
Iris-versicolor 0.85 0.92 0.88 12
Iris-virginica 0.90 0.82 0.86 11
micro avg 0.90 0.90 0.90 30
macro avg 0.92 0.91 0.91 30
weighted avg 0.90 0.90 0.90 30
Well done!
hi i am trying detecting myocardial infarction on physionet data with this link :
https://blog.orikami.nl/diagnosing-myocardial-infarction-using-long-short-term-memory-networks-lstms-cedf5770a257
but after some records processed it gives me the following error:
Using TensorFlow backend.
0%| | 0/549 [00:00<?, ?it/s]
0%| | 2/549 [00:00<00:55, 9.86it/s]
1%| | 3/549 [00:00<01:06, 8.17it/s]
1%| | 4/549 [00:00<01:14, 7.29it/s]
1%| | 5/549 [00:00<01:27, 6.19it/s]
1%|1 | 6/549 [00:01<01:42, 5.32it/s]
1%|1 | 7/549 [00:01<01:39, 5.46it/s]
1%|1 | 8/549 [00:01<01:37, 5.57it/s]
2%|1 | 9/549 [00:01<01:45, 5.10it/s]
2%|1 | 10/549 [00:01<01:44, 5.17it/s]
2%|2 | 11/549 [00:02<01:53, 4.76it/s]
2%|2 | 12/549 [00:02<01:49, 4.92it/s]
2%|2 | 13/549 [00:02<02:03, 4.32it/s]
3%|2 | 14/549 [00:02<02:01, 4.40it/s]
3%|2 | 15/549 [00:02<01:59, 4.45it/s]
3%|2 | 16/549 [00:03<02:26, 3.65it/s]
3%|3 | 17/549 [00:03<02:29, 3.56it/s]
3%|3 | 18/549 [00:04<02:49, 3.14it/s]
3%|3 | 19/549 [00:04<02:35, 3.41it/s]
4%|3 | 20/549 [00:04<02:28, 3.57it/s]
4%|3 | 21/549 [00:04<02:51, 3.07it/s]
4%|4 | 22/549 [00:05<02:44, 3.20it/s]
4%|4 | 23/549 [00:05<02:54, 3.02it/s]
4%|4 | 24/549 [00:06<03:15, 2.69it/s]
5%|4 | 25/549 [00:06<03:27, 2.52it/s]
5%|4 | 26/549 [00:07<04:07, 2.11it/s]
5%|4 | 27/549 [00:07<03:54, 2.23it/s]
5%|5 | 28/549 [00:08<04:04, 2.13it/s]
5%|5 | 29/549 [00:08<03:41, 2.35it/s]
5%|5 | 30/549 [00:08<03:16, 2.65it/s]
6%|5 | 31/549 [00:09<04:08, 2.08it/s]
6%|5 | 32/549 [00:09<03:58, 2.16it/s]
6%|6 | 33/549 [00:10<04:16, 2.01it/s]
6%|6 | 34/549 [00:10<03:56, 2.17it/s]
6%|6 | 35/549 [00:11<03:52, 2.21it/s]
7%|6 | 36/549 [00:11<04:42, 1.81it/s]
7%|6 | 37/549 [00:12<04:41, 1.82it/s]
7%|6 | 38/549 [00:13<05:06, 1.67it/s]
7%|7 | 39/549 [00:13<04:45, 1.78it/s]
7%|7 | 40/549 [00:14<04:47, 1.77it/s]Traceback (most recent call last):
File "C:\Program Files\Python\Python37\diagnosingusinglstm.py", line 35, in
record = io.rdrecord(record_name=os.path.join(‘ptbdb’, record_name))
File “C:\Program Files\Python\Python37\lib\site-packages\wfdb\io\record.py”, line 1232, in rdrecord
ignore_skew)
File “C:\Program Files\Python\Python37\lib\site-packages\wfdb\io\_signal.py”, line 876, in _rd_segment
smooth_frames)[:, r_w_channel[fn]]
File “C:\Program Files\Python\Python37\lib\site-packages\wfdb\io\_signal.py”, line 992, in _rd_dat_signals
signal = sig_data.reshape(-1, n_sig)
ValueError: cannot reshape array of size 868190 into shape (12)
I have some suggestions here that might help:
https://machinelearningmastery.com/faq/single-faq/can-you-read-review-or-debug-my-code
hi i investigate the problem and it seems that data i am using has varying length therefore it throws this exception. how can i fix it to get rid of this reshape error: ValueError: cannot reshape array of size 868190 into shape (12)?
Perhaps work with less data as a first step?
Here is my Code it is giving some errors.Please help me to sort it out. I have tried same this code in my own dataset.
# Python version
import sys
print(‘Python: {}’.format(sys.version))
# scipy
import scipy
print(‘scipy: {}’.format(scipy.__version__))
# numpy
import numpy
print(‘numpy: {}’.format(numpy.__version__))
# matplotlib
import matplotlib
print(‘matplotlib: {}’.format(matplotlib.__version__))
# pandas
import pandas
print(‘pandas: {}’.format(pandas.__version__))
# scikit-learn
import sklearn
print(‘sklearn: {}’.format(sklearn.__version__))
# Load libraries
import pandas
from pandas.plotting import scatter_matrix
import matplotlib.pyplot as plt
from sklearn import model_selection
from sklearn.metrics import classification_report
from sklearn.metrics import confusion_matrix
from sklearn.metrics import accuracy_score
from sklearn.linear_model import LogisticRegression
from sklearn.tree import DecisionTreeClassifier
from sklearn.neighbors import KNeighborsClassifier
from sklearn.discriminant_analysis import LinearDiscriminantAnalysis
from sklearn.naive_bayes import GaussianNB
from sklearn.svm import SVC
# Load dataset
url = r”C:\Users\Khadeej\.spyder-py3\DataScience\pc.csv”
names = [‘age’,’sex’,’cp’,’trestbps’,’chol’,’fbs’,’restecg’,’thalach’,’exang’,’oldpeak’,’slope’,’ca’,’thal’,’heartpred’]
dataset = pandas.read_csv(url, names=names)
# shape
print(dataset.shape)
# head
print(dataset.head(20))
# descriptions
print(dataset.describe())
# class distribution
print(dataset.groupby(‘class’).size())
# box and whisker plots
dataset.plot(kind=’box’, subplots=True, layout=(2,2), sharex=False, sharey=False)
plt.show()
# histograms
dataset.hist()
plt.show()
# scatter plot matrix
scatter_matrix(dataset)
plt.show()
# Split-out validation dataset
array = dataset.values
X = array[:,0:4]
Y = array[:,4]
validation_size = 0.20
seed = 7
X_train, X_validation, Y_train, Y_validation = model_selection.train_test_split(X, Y, test_size=validation_size, random_state=seed)
# Test options and evaluation metric
seed = 7
scoring = ‘accuracy’
# Spot Check Algorithms
models = []
models.append((‘LR’, LogisticRegression(solver=’liblinear’, multi_class=’ovr’)))
models.append((‘LDA’, LinearDiscriminantAnalysis()))
models.append((‘KNN’, KNeighborsClassifier()))
models.append((‘CART’, DecisionTreeClassifier()))
models.append((‘NB’, GaussianNB()))
models.append((‘SVM’, SVC(gamma=’auto’)))
# evaluate each model in turn
results = []
names = []
for name, model in models:
kfold = model_selection.KFold(n_splits=10, random_state=seed)
cv_results = model_selection.cross_val_score(model, X_train, Y_train, cv=kfold, scoring=scoring)
results.append(cv_results)
names.append(name)
msg = “%s: %f (%f)” % (name, cv_results.mean(), cv_results.std())
print(msg)
# Compare Algorithms
fig = plt.figure()
fig.suptitle(‘Algorithm Comparison’)
ax = fig.add_subplot(111)
plt.boxplot(results)
ax.set_xticklabels(names)
plt.show()
# Make predictions on validation dataset
knn = KNeighborsClassifier()
knn.fit(X_train, Y_train)
predictions = knn.predict(X_validation)
print(accuracy_score(Y_validation, predictions))
print(confusion_matrix(Y_validation, predictions))
print(classification_report(Y_validation, predictions))
This is a common question that I answer here:
https://machinelearningmastery.com/faq/single-faq/can-you-read-review-or-debug-my-code
Hi, I have problem with this line:
import sklearn
It has output: „ImportError: No module named ‘sklearn’“
But I tried almost everything (reinstalling, installing version for Python 3 only, …), but nothing helps.
Thank for your advice.
Now it works. I work on Python 3.5, and it requires 3.7 version.
Well done Peter!
I recommend this tutorial:
https://machinelearningmastery.com/setup-python-environment-machine-learning-deep-learning-anaconda/
hiii……..
the tutorial poin very useful…its pretty good
i have to project on ..IPL WINNER PREDICTION
what data should I load?
Thanks.
Perhaps start here:
https://machinelearningmastery.com/faq/single-faq/where-can-i-get-a-dataset-on-___
in section 3.1 im getting unable to initialize device PRN, and thoughts?
thanks!
I have not seen that before, sorry.
Perhaps confirm that your libraries are installed correctly:
https://machinelearningmastery.com/setup-python-environment-machine-learning-deep-learning-anaconda/
models = []
models.append((‘LR’, LogisticRegression(solver=’liblinear’, multi_class=’ovr’)))
models.append((‘LDA’, LinearDiscriminantAnalysis()))
models.append((‘KNN’, KNeighborsClassifier()))
models.append((‘CART’, DecisionTreeClassifier()))
models.append((‘NB’, GaussianNB()))
models.append((‘SVM’, SVC(gamma=’auto’)))
# evaluate each model in turn
results = []
names = []
for name, model in models:
kfold = model_selection.KFold(n_splits=10, random_state=seed)
cv_results = model_selection.cross_val_score(model, X_train, Y_train, cv=kfold, scoring=scoring)
results.append(cv_results)
names.append(name)
msg = “%s: %f (%f)” % (name, cv_results.mean(), cv_results.std())
print(msg)
WHEN I RUN THIS, I GET
ValueError: Unknown label type: ‘unknown’
I’m sorry to hear that, I have some suggestions here that might help:
https://machinelearningmastery.com/faq/single-faq/why-does-the-code-in-the-tutorial-not-work-for-me
to illustrate the structure of the data, I added color to the scatter matrix:
Well done Rob!
Thank you so much. it’s my first time with Python.
LR: 0.966667 (0.040825)
LDR: 0.975000 (0.038188)
KNN: 0.983333 (0.033333)
CART: 0.975000 (0.038188)
NB: 0.975000 (0.053359)
SVM: 0.991667 (0.025000)
Well done!
why tensorflow is not installing in python 3.7?
Perhaps this will help:
https://machinelearningmastery.com/setup-python-environment-machine-learning-deep-learning-anaconda/
‘’The confusion matrix provides an indication of the three errors made. ‘’
Where are the three errors?
Prediction errors.
The report does not indicate what specific instances these were, only the nature of the errors.
You could manually make a prediction for each example and inspect those that had an error to learn more about them.
Hello Jason,
models.append((‘LR’, LogisticRegression(solver=’liblinear’, multi_class=’ovr’)
Can you explain what are solver and mult_class for?
They were set to overcome warnings after the API changed:
https://machinelearningmastery.com/how-to-fix-futurewarning-messages-in-scikit-learn/
More on their meaning here:
https://scikit-learn.org/stable/modules/generated/sklearn.linear_model.LogisticRegression.html
Hello Jason,
Another question about StandardScaler? why does X_train need fit and transform and X_test only need transform?
from sklearn.preprocessing import StandardScaler
sc=StandardScaler()
X_train_std=sc.fit_transform(X_train)
X_validation_std=sc.transform(X_test)
The coefficients are calculated on the training set then applied to the train and test sets.
Hello Jason,
I guess that fit_transform does fit and transform, the Scaler sc is set after fitting like other regression model, X_test and X_train actually are processed in the same way.
Yes.
Great tutorials
Thanks!
how do you get the visualizations to appear etc.
dataset.plot(kind=’box’, subplots=True, layout(2,2), sharex=False, sharey=False)
plt.show()
#histograms
dataset.hist()
plt.show()
and I get this error.
ile “/Users/akashchandra/Desktop/Python and ML/python course/iris.py”, line 32
dataset.plot(kind=’box’, subplots=True, layout(2,2), sharex=False, sharey=False)
^
SyntaxError: positional argument follows keyword argument
[Finished in 1.6s with exit code 1]
Sorry to hear that you are having trouble, I have some suggestions here:
https://machinelearningmastery.com/faq/single-faq/why-does-the-code-in-the-tutorial-not-work-for-me
Dear Mr. Jason Brownlee,
First and foremost thanks for this wonderful, awesome post.
Just worked seamlessly in the very first attempt, being struggling with other tutorials
which really never works in the first try.
Please do keep up your sincere efforts.
Thanks and Regards
Thanks, I’m happy it worked for you!
Hello Jason. I am new to Machine learning and currently working on how to use evolutionary algorithm to learn optimum weights for feed forward neural network. Please how do I go about this. What is the strategy for coding it and obtaining result
Sorry, I don’t have a tutorial on this topic, I hope to cover it in the future.
sir i am a beginner and want to make robot on ml can you suggest some idea on it.
Sorry, I don’t know about robots.
Hi Jason,
I wanted to know one question regarding the training of the model. If my data is having the same trend can my model also predict the data on different offset? or I have to train my model for all the offset?
Best regards,
Not sure I follow, do you mean time series and a trend in the series?
Hi Jason,
First, thanks very much for this tutorial. it is easy to follow and well explained. Could please shed some light on how to interpret the Algorithm comparison chart? KNN accuracy_score, confusion_matrix, and classification_report? Finally, based on the knn results how one might draw conclusions?
Many thanks
Perhaps focus just on accuracy, and start off by choosing a model that has the highest average accuracy.
Hi Dr. Brownlee,
This was my first ML tutorial in python. Thank you for writing such a simple and easy to follow tutorial. I followed every step and my results were as follows:
LR: 0.966667 (0.040825)
LDA: 0.975000 (0.038188)
KNN: 0.983333 (0.033333)
CART: 0.966667 (0.040825)
NB: 0.975000 (0.053359)
SVM: 0.991667 (0.025000)
If one wanted to use a different model, where can we find tutorials on the code or are the models already built into the sklearn? Which book would you recommend for beginners in ML without any Statistics background knowledge?
Thanks again for the excellent tutorial.
Well done!
Yes, a good place to explore different models in sklearn us here:
https://machinelearningmastery.com/start-here/#python
Hai sir , how can i start the machine learning projects
You can use an existing project as a template.
Also, this process will help:
https://machinelearningmastery.com/start-here/#process
hi i want to do a mini project on weather forecasting. Can you help me to find out what all functions and models can be prepared out from it..
Perhaps this process will help:
https://machinelearningmastery.com/start-here/#process
Hi Jason,
I have learned machine learning by your clear tutorials like this one.
tell you the truth I am trying to visualize a dataset’s distribution, but I do not know how to plot the samples belongs to 2 different class sing two different colors as you did plot all the samples with one color, blue.
U have tested some other links, but they do not work.
please let me know about it
Best
Maryam
Perhaps this will help:
https://machinelearningmastery.com/data-visualization-methods-in-python/
Dear Jason,
I have read it, but all the illustrated figures in the given link are provided with one color, blue. I applied this command and it works for me.
import seaborn as sns
sns.pairplot(hepatit_pca2,
hue = ‘Target’, diag_kind = ‘kde’,
plot_kws = { ‘edgecolor’: ‘k’},
size = 6);
Thanks for your note.
Hello, can you please advise on an example with 2 input files :
1. training input file
2. test file
so have code of M learning that knows to predict result (like if transaction is a fraud) in missing result column at test file based on what it learned in the training file
That sounds like a great project.
What problem are you having exactly?
Need advice how to output on screen entire csv columns and rows (like if opened with Excel)
What do you mean exactly?
You can output the data and predictions using the print() function, does that help?
For example how can I put on screen the validation data cut from rest in
# Split-out validation dataset
array = dataset.values
X = array[:,0:4]
Y = array[:,4]
validation_size = 0.20
seed = 7
X_train, X_validation, Y_train, Y_validation = model_selection.train_test_split(X, Y, test_size=validation_size, random_state=seed)
What do you mean put on screen?
Do you mean print to screen? If so, you can use the print() function.
Hello,
I’m following your tutorial but using different dataset that includes dates, entry id, temp, humid, moisture etc so when give this dataset to the model it gives me error that couldn’t convert string to float and secondly, the graphs I’m trying to plot is not plotting idk why. Kindly help me.
Thanks in advance.
Perhaps some one or more of the columns contains strings.
If they categorical, they must be encoded to a number, such as with an integer encoding or a one hot encoding. More details here:
https://machinelearningmastery.com/faq/single-faq/how-to-handle-categorical-data-with-string-values
Thanks Jason, I am trying find algorithm where the test phase code takes the data also from (another) csv and not slicing from train data (so simulating “real scenario” testing several packs of data). Can you please refer me to such?
Perhaps this post will help you to understand how load a CSV:
https://machinelearningmastery.com/load-machine-learning-data-python/
And this for slicing an array:
https://machinelearningmastery.com/index-slice-reshape-numpy-arrays-machine-learning-python/
python code for a tv cable providr has 170 customers over 8km radis.the service provider wishes to restrict his service over 2 km radius w& retain maximum customers as possible .the remaining cutomers will be transefed to other service provide.i want idea about this problem plz can anybody hlp me plz.
I recommend following this process:
https://machinelearningmastery.com/start-here/#process
Hi
I have Create a machine learning keras model and I want to deploy it to Ios application.
how should I Convert keras model to coreml.
Thank you.
That sounds like a great project.
Sorry, I don’t know about iOS.
Thanks to this example. Please advise for example that I can actually change the algorithm so have kind of improvement programmer can test
You can modify the algorithm by changing the number of layers, nodes in a layer or the learning algorithm.
Its actually helpful thank you very much!… I want to know how can the recall , precision and f1 score of each model can be represented in a bar diagram instead of box plots for comparison?
You can use matplotlib and call bar()
https://matplotlib.org/3.1.1/api/_as_gen/matplotlib.pyplot.bar.html
Dr. Jason, you have a unique website! Because…
– Your Python code examples work – that’s my highest compliment to anyone because this scenario seems to have become a great rarity these days!
– Your information is vey useful, and is absolutely the best way to get started with ML.
– You take the time to respond to all the emails.
– You know what it takes to teach this subject, and share it clearly.
You are so correct about this being the best way to teach ML. After wasting my money on a stack of ML books, I found your website. So, now, instead of trying to read and understand those books, they’ve just become a reference library that I seldom turn to – because I come to this website first! (And based on all learned from this site, I did just buy one more book – YOURS!
Congratulations on a job extremely well done!!!
Thanks for your support Greg, I really appreciate it!
thanks it worked first time using anaconda, background in pure statistics many years ago, trying to get into ML
Well done Peter!
Hello, please I’m a student. I have a project that I’m about to start on building a classification system for malware with machine learning using python but i don’t know where to start. Please i need your counsel on this.
Perhaps start with this process:
https://machinelearningmastery.com/start-here/#process
Does it make sense, when evaluating models, to divide mean by sd, given that I (supposedly) want a high mean and a low std? These are the results:
LR: 0.966667 (0.040825) 23.678401
LDA: 0.975000 (0.038188) 25.531493
KNN: 0.983333 (0.033333) 29.500000
CART: 0.983333 (0.033333) 29.500000
NB: 0.975000 (0.053359) 18.272330
SVM: 0.991667 (0.025000) 39.666667
Which clearly shows SVM is superior.
Probably not, the samples are small and are technically not iid.
Hey Jason, first of all want to congratulate you man for all this effort and willing to help. Look, I`m don’t have a programming background and I am almost finishing Shaw’s “Learning Python the Hard Way”. My objective in the mid term is to dive into image/pattern recognition through OpenCV (not exactly face but human body behavior captured from pictures). Do you think your guide could help me, or could you give me in a few words about what should be my “path” to master it? The point is, from a complete beginner, machine learning, deep learning, AI is very messy. Just want to hear from you. Thanks and greetings from Brazil!
Thanks!
Great question, a great starting point is here:
https://machinelearningmastery.com/start-here/#getstarted
I have more on self-study here that I think will help:
https://machinelearningmastery.com/faq/single-faq/how-do-i-self-study-machine-learning
Thanks for these types of help of programmer ..can give me suggestion for object recognization project ……………………
Perhaps start with some of the tutorials here:
https://machinelearningmastery.com/start-here/#dlfcv
any help pls
ImportError: cannot import name ‘RandomizedLogisticRegression’ from ‘sklearn.linear_model’ (C:\Users\Kefyalew\Anaconda2\envs\FakenewsEnv\lib\site-packages\sklearn\linear_model\__init__.py)
It looks like you are using a different model from the tutorial: RandomizedLogisticRegression
I have some suggestions here that might help:
https://machinelearningmastery.com/faq/single-faq/why-does-the-code-in-the-tutorial-not-work-for-me
Hi,
I managed to go through the whole example but I found it easier to use Spyder! I got exactly the same output and numbers as in your findings.
Next step; going deeper and learning the syntax and the algos then moving into deep learning example…
Thank you Jason!
Well done!
if i want to learn machine learning, what should i do, im beginer
Here:
https://machinelearningmastery.com/start-here/#getstarted
def add(x, y):
return x + y
def do_twice(func, x, y):
return func(func(x,y), func(x,y))
a = 5
b = 10
print(do_twice(add, a,b))
what the output of this code? if I use C# language
Perhaps post on stackoverflow?
Hello, thank you so much sir for this beginner lesson its really been helpfull, however i found this an error ”from pandas.plotting import scatter_matrix” since pandas have been imported already ‘from pandas import scatter_matrix’ should do .
You must update your version of scikit-learn, see here for instructions:
https://machinelearningmastery.com/setup-python-environment-machine-learning-deep-learning-anaconda/
Great stuff.
Thank you.
A little suggestion (if I did not miss it :P), please if you could also include the link to the next tutorial from you that you think we should follow to move on.
Great suggestion, thanks!
You can find more tutorials here:
https://machinelearningmastery.com/start-here/#python
Hi Jason!
Thanks for your Tutorial Machine Learning!
Actually, I’m a beginner in both Python and Machine learning,; however, I could run this tutorial very well!
Thanks!
I follow next tutorial …
Best RGDs,
Houshyar
Well done!
Anyway, can you introduce me any Tutorial for Reinforcement Learning?
Thanks to you in advance.
Best rgds,
Houshyar
I hope to cover it in the future.
Hi Jason,
Great tutorial and really given me a zeal for ML!
I have fallen into one error which I can’t seem to de-bug myself.
When executing the code at “cv_results = cross_validation.cross_val_score(model, X_train, Y_train, cv=kfold, scoring=scoring)”
I get an error traceback ” input variables with inconsistent numbers of samples: [120, 30]”
I followed the tutorial to the letter and I am pretty familiar with Python using it for my PhD, but any ideas why this error occurs?
Thanks!
I have some suggestions here:
https://machinelearningmastery.com/faq/single-faq/why-does-the-code-in-the-tutorial-not-work-for-me
Thank you for the tutorial. I am just wondering i have Anaconda 1.9.7, using Jupyter and somehow matplotlib is not recognized
To fix this i did:
import sys
!conda install –yes –prefix {sys.prefix} matplotlib
import matplotlib.pyplot as plt
print(‘matplotlib: {}’.format(matplotlib.__version__))
Not getting an error when doing this.
But when I want to visualize, I still get an error that Matplotlib is required.
Any thoughts?
I recommend running code from the command line, like this:
https://machinelearningmastery.com/faq/single-faq/how-do-i-run-a-script-from-the-command-line
I do not recommend using notebooks, they cause problems for everyone and have for many years in my experience:
https://machinelearningmastery.com/faq/single-faq/why-dont-use-or-recommend-notebooks
If we’re trying to classify the ‘class’ variable, why do we include ‘class’ as both ‘x’ and ‘y’? Shouldn’t we split the data like this?
array = dataset.values
X = array[:,0:3] ## predictors, not including ‘class’
Y = array[:,4] ## just ‘class’
We don’t, try inspecting the data to confirm.
You can learn more about how array slicing works here:
https://machinelearningmastery.com/index-slice-reshape-numpy-arrays-machine-learning-python/
This is awesome! Rightly ranked high on google search 🙂 I’m working through this tutorial to predict accuracy and repeatability of a linear machine movement that requires sub 10 micron accuracy. I guess the classification would be the type of mechanicals used.
Thanks.
This might help you determine whether your problem is regression or classification:
https://machinelearningmastery.com/faq/single-faq/what-is-the-difference-between-classification-and-regression
Hi, thanks for the great tutorial. For my it seems to cut off too early though, because I don’t know how put this model into use for the next dataset, which is kinda the whole point. Anyways, really appreciate the effort for making me set up the environment now.
Good point, I will update it.
The model is fit, then you use it to make predictions. Perhaps this will help:
https://machinelearningmastery.com/make-predictions-scikit-learn/
hay dear
i want ask u some question and any other who have interest for my question
qu 1: how i can use data mining, machine learning and deep learning concepts in one thesis
They are all just fluffy names for the same general algorithms.
Hi Jason,
In step 5.4 you are describing SVM model has the largest estimated accuracy score, but KNN is the one which you made as your final model, is there any specific reason for that or it has been selected just for the sake of this example and simplicity?
Simplicity. I will update it to be clearer.
i was following the tutorial step by step. In the following line, what is model supposed to mean? we have not defined “model” anywhere before this line.
cv_results = cross_val_score(model, X_train, Y_train, cv=kfold, scoring=’accuracy’)
The model is fit and evaluated within the cross validation procedure.
Hi Jason,
“It looks like perhaps two of the input variables have a Gaussian distribution. This is useful to note as we can use algorithms that can exploit this assumption.”
Quoting the above text from your article, how can I exclude an algorithm for classifying data with a non-Gaussian distribution.
Kindly enlighten me on this
Thank You.
I don’t follow sorry. What do you mean by “exclude an algorithm”?
If you have Gaussian inputs, then you can use methods like logistic regression and LDA directly and probably do quite well.
If you have Gaussian-like inputs, you can use a power transform and standardization to make them Gaussian, probably.
If you don’t have Gaussian inputs, you should probably put attention on methods that don’t make this assumption, like a bunch of nonlinear algorithms.
Hi Jason,
Thank u. I always learn something from your posts :).
My question is related to “presenting results” as you mentioned. or interpreting results.
Why boxplot for SVM is “weird”? and different from the rest?
How to interpret the values of confusion-matrix and classification_report in this specific context?
Thanks!
The SVM is odd because the distribution of results is squashed – e.g. it did well.
Confusion matrix shows what types of errors were made:
https://machinelearningmastery.com/confusion-matrix-machine-learning/
precision/recall/F1, etc. are more about the positive class. Perhaps not as useful on this problem because it is a multiclass prediction.
Have you written/thought of writing a ML module/Bot to reply to most of your questions / comments ? 🙂
No, sorry.
Dear Jason,
Thank you very much for all the posts, works and clear explanations.
I’m following the complete example above, but i’m getting this error:
# evaluate each model in turn
results = []
names = []
for name, model in models:
skf= StratifiedKFold(n_splits=10, shuffle=False, random_state=None)
skf.get_n_splits(X, y)
cv_results = cross_val_score(model, x_train, y_train, cv=skf, scoring=’accuracy’)
results.append(cv_results)
names.append(name)
print(‘%s: %f (%f)’ % (name, cv_results.mean(), cv_results.std()))
File “”, line 5
skf= StratifiedKFold(n_splits=10, shuffle=False, random_state=None)
^
IndentationError: expected an indented block
Thanks.
Looks like you did not copy the indentation, perhaps this will help:
https://machinelearningmastery.com/faq/single-faq/how-do-i-copy-code-from-a-tutorial
Dear Dr Jason,
In section 5.1, there was the splitting of the data into a training and validation sets for X and y.
Suppose we fit a model using k-nearest neighbours
Then we make a prediction on the x_validation
Questions please:
Is there a multivariate method of superimposing of y_pred and y_validation for the X variables?
In Section 4.1 we have multivariate scatter plots. Is there a way of multivariate scatter plots with different coloured points within each scatterplot to indicate by colour the specific iris species . For example plot sepal length v petal length, and show say yellow=versicolor, red=setosa, blue=virginica. Do the same for sepal length v sepal width with same colour scheme.
Thank you,
Anthony of Sydney
Yes, good question.
I refer to this as “a scatter plot with points colored by class” and I have tons of examples on the blog, at least for simple 2-variable datastes. Try a blog search.
For multiple pairwise scatter plots, you can use something like this, assuming your data is loaded as a dataframe df.
Hi Jason,
Nice way of starting with python.. However when i was trying to build models as you mentioned above, encountered the below error
for name, model in models:
… kfold = StratifiedKFold(n_splits=10, random_state=1)
File “”, line 2
kfold = StratifiedKFold(n_splits=10, random_state=1)
^
IndentationError: expected an indented block
>>> cv_results = cross_val_score(model, X_train, Y_train, cv=kfold, scoring=’accuracy’)
Traceback (most recent call last):
File “”, line 1, in
NameError: name ‘model’ is not defined
>>> results.append(cv_results)
Traceback (most recent call last):
File “”, line 1, in
NameError: name ‘cv_results’ is not defined
>>> names.append(name)
Traceback (most recent call last):
File “”, line 1, in
NameError: name ‘name’ is not defined
>>> print(‘%s: %f (%f)’ % (name, cv_results.mean(), cv_results.std()))
Traceback (most recent call last):
File “”, line 1, in
NameError: name ‘name’ is not defined
>>> # Compare Algorithms
… pyplot.boxplot(results, labels=names)
Traceback (most recent call last):
File “”, line 2, in
File “C:\Users\p.khaneja\AppData\Local\Continuum\anaconda3\lib\site-packages\matplotlib\pyplot.py”, line 2479, in boxplot
is not None else {}))
File “C:\Users\p.khaneja\AppData\Local\Continuum\anaconda3\lib\site-packages\matplotlib\cbook\deprecation.py”, line 307, in wrapper
return func(*args, **kwargs)
File “C:\Users\p.khaneja\AppData\Local\Continuum\anaconda3\lib\site-packages\matplotlib\__init__.py”, line 1601, in inner
return func(ax, *map(sanitize_sequence, args), **kwargs)
File “C:\Users\p.khaneja\AppData\Local\Continuum\anaconda3\lib\site-packages\matplotlib\axes\_axes.py”, line 3670, in boxplot
labels=labels, autorange=autorange)
File “C:\Users\p.khaneja\AppData\Local\Continuum\anaconda3\lib\site-packages\matplotlib\cbook\__init__.py”, line 1251, in boxplot_stats
raise ValueError(“Dimensions of labels and X must be compatible”)
ValueError: Dimensions of labels and X must be compatible
>>> pyplot.title(‘Algorithm Comparison’)
Text(0.5, 1.0, ‘Algorithm Comparison’)
>>> pyplot.show()
Copy the code and preserve the indenting, then save to a file and run it as follows:
https://machinelearningmastery.com/faq/single-faq/how-do-i-run-a-script-from-the-command-line
I looped the prediction on different models. LR prediction was worse than the estimate while most other models have improved the accuracy.
Nice work.
Hi Jason, I went through the example without any problem but I am trying to understand the precision, recall, f1-score, support. Similarly accuracy, macro avg, weighted avg.
Would it be possible for you to explain them a bit or point me to documentation.
Yes, I hope to have more posts on this soon.
Until then, this might help:
https://scikit-learn.org/stable/modules/generated/sklearn.metrics.f1_score.html
And more generally:
https://en.wikipedia.org/wiki/Precision_and_recall
Fantastic, thank you Jason! This is extremely helpful for someone such as myself trying to learn some beginning steps on how to use ML.
Great work, everything was very clear and easy to follow.
Thanks, I’m happy it helped!
hello sir,
how can I give the new data for a prediction I’m trying but don’t work that code.error is displayed
so what will I do sir
model = SVC(gamma=’auto’)
model.fit(X_train, Y_train)
a=[[4.3,3.0,1.1,0.1]]
b=numpy.array(a)
predictions = model.predict(b)
print(accuracy_score(Y_validation, predictions))
ValueError Traceback (most recent call last)
in
6 predictions = model.predict(b)
7 # Evaluate predictions
—-> 8 print(accuracy_score(Y_validation, predictions))
9 print(confusion_matrix(Y_validation, predictions))
10 print(classification_report(Y_validation, predictions))
~\Anaconda3\lib\site-packages\sklearn\metrics\classification.py in accuracy_score(y_true, y_pred, normalize, sample_weight)
174
175 # Compute accuracy for each possible representation
–> 176 y_type, y_true, y_pred = _check_targets(y_true, y_pred)
177 check_consistent_length(y_true, y_pred, sample_weight)
178 if y_type.startswith(‘multilabel’):
~\Anaconda3\lib\site-packages\sklearn\metrics\classification.py in _check_targets(y_true, y_pred)
69 y_pred : array or indicator matrix
70 “””
—> 71 check_consistent_length(y_true, y_pred)
72 type_true = type_of_target(y_true)
73 type_pred = type_of_target(y_pred)
~\Anaconda3\lib\site-packages\sklearn\utils\validation.py in check_consistent_length(*arrays)
233 if len(uniques) > 1:
234 raise ValueError(“Found input variables with inconsistent numbers of”
–> 235 ” samples: %r” % [int(l) for l in lengths])
236
237
ValueError: Found input variables with inconsistent numbers of samples: [30, 1]
I give an example in the above tutorial, e.g. call predict()
You can also see more examples here:
https://machinelearningmastery.com/make-predictions-scikit-learn/
thank you, sir
I’m got the output . well done, thank you…..
Nice work!
So happy I finished that tutorial. I’ve been wanting to learn ML for a long time. This is just the beginning ;D
Well done!
Should be lower case y here. rt?
# Split-out validation dataset
array = dataset.values
X = array[:,0:4]
y = array[:,4]
X_train, X_validation, Y_train, Y_validation = train_test_split(X, y, test_size=0.20, random_state=1)
Yes.
thanks you…first time doing in a lot of doubtful what is the meaning of the codes being used..
LR: 0.960897 (0.052113)
LDA: 0.973974 (0.040110)
KNN: 0.957191 (0.043263)
CART: 0.957191 (0.043263)
NB: 0.948858 (0.056322)
SVM: 0.983974 (0.032083)
Well done!
2.2 Load dataset I get an error
Traceback (most recent call last):
File “C:/Users/Computer/AppData/Local/Programs/Python/Python38-32/Scripts/plot.py”, line 4, in
dataset = read_csv(url, names=names)
builtins.NameError: name ‘read_csv’ is not defined
what do i do?
It looks like you might have missed some lines of code – like the line to import that function.
Perhaps copy the code block at the end of that section that has all the code together?
can i use other dataset with same code or the code built about the dataset?
thanks for the great tutorial
Sure.
Hello from Dallas, Texas.
I can’t thank you enough for this great guide and an amazing website.
In section 5.1 code, Jupyter got mad and told me there is no such thing as y so I changed (lowercase) y to (uppercase) Y.
Hi Kourosh.
Thanks, fixed!
Jason – Hello from rainy San Francisco, California. Thanks for putting this together. Great feeling to be able to scratch the surface a little bit.
I am working with the 0.22 release of sklearn and got this message:
kfold = StratifiedKFold(n_splits=10, random_state=1)
C:\Users\kochh\AppData\Roaming\Python\Python37\site-packages\sklearn\model_selection\_split.py:296: FutureWarning: Setting a random_state has no effect since shuffle is False. This will raise an error in 0.24. You should leave random_state to its default (None), or set shuffle=True.
So I ran a non-randomized version via
kfold = StratifiedKFold(n_splits=10)
which yielded
LR: 0.950000 (0.055277)
LDA: 0.975000 (0.038188)
KNN: 0.958333 (0.041667)
CART: 0.941667 (0.075000)
NB: 0.950000 (0.055277)
SVM: 0.983333 (0.033333)
and a randomized one via
kfold = StratifiedKFold(n_splits=10,random_state=1,shuffle=True)
which got me
LR: 0.941667 (0.065085)
LDA: 0.975000 (0.038188)
KNN: 0.958333 (0.041667)
CART: 0.941667 (0.053359)
NB: 0.950000 (0.055277)
SVM: 0.983333 (0.033333)
so LR wins by a nice margin.
A small note… if you go through it sequentially, in section 5.2, you are calling cross_val_score() with ‘model’ as the first argument, but that hasn’t been defined in any of the sections above. I assume most people will realize this quickly and move on.
Again, thanks for getting me started. I will definitely take you up on the email course-offer, but would be happy to spend some money if you have material for purchase.
Thanks for the feedback!
I have updated the examples to remove the warnings.
Yes, you can see the full catalog of books and bundles here:
https://machinelearningmastery.com/products/
NM my wrong interpretation of the results. SVM wins. Of course. Duh.
Hi Jason,
This is awesome and very encouraging piece of explanation for the new ML novice.
My result :
LR: 0.960897 (0.052113)
LDA: 0.973974 (0.040110)
KNN: 0.957191 (0.043263)
CART: 0.966282 (0.041725)
NB: 0.948858 (0.056322)
SVM: 0.983974 (0.032083)
Thank you very much
Well done!
I cant finish the tutorial.I got stuck on the test harness part.
Sorry to hear that, what happened?
while I try to execute this
…
model = …
# Test options and evaluation metric
kfold = StratifiedKFold(n_splits=10, random_state=1, shuffle=True)
cv_results = cross_val_score(model, X_train, Y_train, cv=kfold, scoring=’accuracy’)
I get the following error.
TypeError: estimator should be an estimator implementing ‘fit’ method, Ellipsis was passed
does it have anything to do with my sklearn?because the version I am using is a bit older.
That is a code snippet. Try coping the complete code example at the end of that section.
yeah thanks.
here are my results
LR: 0.960897 (0.052113)
LDA: 0.973974 (0.040110)
KNN: 0.957191 (0.043263)
CART: 0.956282 (0.062981)
NB: 0.948858 (0.056322)
SVM: 0.983974 (0.032083)
but I have 2 questions:
1.the test harness part that was throwing me errors is not included on the complete example right?why is that and what exactly does that section do?
2.there is a training step in machine learning before making predictions right?I got confused.or are we using already trained models?and how about fitting the model on the training step,what does that mean?
Perhaps re-read the text before the snippet to understand the context.
We are training and evaluating multiple models multiple times and summarizing the results.
E.g. we are using k-fold cross-validation.
LR: 0.950000 (0.055277)
LDA: 0.975000 (0.038188)
KNN: 0.958333 (0.041667)
CART: 0.958333 (0.041667)
NB: 0.950000 (0.055277)
SVM: 0.983333 (0.033333)
Well done!
sir can i get code for prediction of diabities stages analysis using large datasets
Perhaps, but not from this website.
ValueError: Dimensions of labels and X must be compatible
can you help me fix this error
This may help:
https://machinelearningmastery.com/faq/single-faq/why-does-the-code-in-the-tutorial-not-work-for-me
Thanks a lot for your great effort
I followed all scripts step by step use Anaconda Jupiter platform and got the same results except the ” 5.2 Test Harness ” step:
//////////////////////////////////////////////////////////////////////////
…
model = …
# Test options and evaluation metric
kfold = StratifiedKFold(n_splits=10, random_state=1, shuffle=True)
cv_results = cross_val_score(model, X_train, Y_train, cv=kfold, scoring=’accuracy’)
/////////////////////////////////////////////////////
I got the following error:
————————————————————————— TypeError Traceback (most recent call last) in 48 # Test options and evaluation metric 49 kfold = StratifiedKFold(n_splits=10, random_state=1, shuffle=True) —> 50 cv_results = cross_val_score(model, X_train, Y_train, cv=kfold, scoring=’accuracy’) 51 52 # Spot Check Algorithms ~\Anaconda3\lib\site-packages\sklearn\model_selection\_validation.py in cross_val_score(estimator, X, y, groups, scoring, cv, n_jobs, verbose, fit_params, pre_dispatch, error_score) 382 “”” 383 # To ensure multimetric format is not supported –> 384 scorer = check_scoring(estimator, scoring=scoring) 385 386 cv_results = cross_validate(estimator=estimator, X=X, y=y, groups=groups, ~\Anaconda3\lib\site-packages\sklearn\metrics\scorer.py in check_scoring(estimator, scoring, allow_none) 268 if not hasattr(estimator, ‘fit’): 269 raise TypeError(“estimator should be an estimator implementing ” –> 270 “‘fit’ method, %r was passed” % estimator) 271 if isinstance(scoring, str): 272 return get_scorer(scoring) TypeError: estimator should be an estimator implementing ‘fit’ method, Ellipsis was passed
That is just an example code snippet.
Copy the code from section: 5.5 Complete Example
Hi Jason,
My code will not execute the following line…
cv_results = cross_val_score(model, X_train, Y_train, cv=kfold, scoring=’accuracy’)
and i get the following error…
estimator should be an estimator implementing ‘fit’ method, Ellipsis was passed
any help is greatly appreciated. Thanks
Yes, that line is an example only. Do not copy it or try to run it.
Copy the code example at the end of that section as I mentioned.
…
model = …
# Test options and evaluation metric
kfold = StratifiedKFold(n_splits=10, random_state=1, shuffle=True)
cv_results = cross_val_score(model, X_train, Y_train, cv=kfold, scoring=’accuracy’)
it’s showing error while I am trying to run this block of code but that didn’t affect my output I think, my outputs are
LR: 0.960897 (0.052113)
LDA: 0.973974 (0.040110)
KNN: 0.957191 (0.043263)
CART: 0.956282 (0.062981)
NB: 0.948858 (0.056322)
SVM: 0.983974 (0.032083)
please clear my doubts
That block of code is just an example – to be skipped.
Hi Jason,
Your ebooks are very useful!
I was wondering if you offer any deep learning certification, or can recommend other certifications ?
Thanks.
Thanks!
Regarding certificates and certifications:
https://machinelearningmastery.com/faq/single-faq/do-i-get-a-certificate-of-completion
Jason, I’m the very beginner in all of this. Please, help with solving the issue below. Thanks.
“/Users/YuriDanilov/PycharmProjects/Week 6/venv/bin/python” “/Users/YuriDanilov/PycharmProjects/Week 6/ML НовыйПроект.py”
Python: 3.6.4 (v3.6.4:d48ecebad5, Dec 18 2017, 21:07:28)
[GCC 4.2.1 (Apple Inc. build 5666) (dot 3)]
scipy: 1.3.1
numpy: 1.17.3
matplotlib: 3.1.1
pandas: 0.25.2
sklearn: 0.21.3
Traceback (most recent call last):
File “/Users/YuriDanilov/PycharmProjects/Week 6/ML НовыйПроект.py”, line 16, in
dataset = read_csv(url, names=names)
NameError: name ‘read_csv’ is not defined
Process finished with exit code 1
Perhaps try running from the command line:
https://machinelearningmastery.com/faq/single-faq/how-do-i-run-a-script-from-the-command-line
Hi, Jason.
It seems that I managed the previous issue, however, there is another one. Please, advise:
“/Users/YuriDanilov/PycharmProjects/Week 6/venv/bin/python” “/Users/YuriDanilov/PycharmProjects/Week 6/ML НовыйПроект.py”
Traceback (most recent call last):
File “/Library/Frameworks/Python.framework/Versions/3.6/lib/python3.6/urllib/request.py”, line 1318, in do_open
encode_chunked=req.has_header(‘Transfer-encoding’))
File “/Library/Frameworks/Python.framework/Versions/3.6/lib/python3.6/http/client.py”, line 1239, in request
self._send_request(method, url, body, headers, encode_chunked)
File “/Library/Frameworks/Python.framework/Versions/3.6/lib/python3.6/http/client.py”, line 1285, in _send_request
self.endheaders(body, encode_chunked=encode_chunked)
File “/Library/Frameworks/Python.framework/Versions/3.6/lib/python3.6/http/client.py”, line 1234, in endheaders
self._send_output(message_body, encode_chunked=encode_chunked)
File “/Library/Frameworks/Python.framework/Versions/3.6/lib/python3.6/http/client.py”, line 1026, in _send_output
self.send(msg)
File “/Library/Frameworks/Python.framework/Versions/3.6/lib/python3.6/http/client.py”, line 964, in send
self.connect()
File “/Library/Frameworks/Python.framework/Versions/3.6/lib/python3.6/http/client.py”, line 1400, in connect
server_hostname=server_hostname)
File “/Library/Frameworks/Python.framework/Versions/3.6/lib/python3.6/ssl.py”, line 407, in wrap_socket
_context=self, _session=session)
File “/Library/Frameworks/Python.framework/Versions/3.6/lib/python3.6/ssl.py”, line 814, in __init__
self.do_handshake()
File “/Library/Frameworks/Python.framework/Versions/3.6/lib/python3.6/ssl.py”, line 1068, in do_handshake
self._sslobj.do_handshake()
File “/Library/Frameworks/Python.framework/Versions/3.6/lib/python3.6/ssl.py”, line 689, in do_handshake
self._sslobj.do_handshake()
ssl.SSLError: [SSL: CERTIFICATE_VERIFY_FAILED] certificate verify failed (_ssl.c:777)
During handling of the above exception, another exception occurred:
Traceback (most recent call last):
File “/Users/YuriDanilov/PycharmProjects/Week 6/ML НовыйПроект.py”, line 33, in
dataset = read_csv(url, names=names)
File “/Users/YuriDanilov/PycharmProjects/Week 6/venv/lib/python3.6/site-packages/pandas/io/parsers.py”, line 685, in parser_f
return _read(filepath_or_buffer, kwds)
File “/Users/YuriDanilov/PycharmProjects/Week 6/venv/lib/python3.6/site-packages/pandas/io/parsers.py”, line 440, in _read
filepath_or_buffer, encoding, compression
File “/Users/YuriDanilov/PycharmProjects/Week 6/venv/lib/python3.6/site-packages/pandas/io/common.py”, line 196, in get_filepath_or_buffer
req = urlopen(filepath_or_buffer)
File “/Library/Frameworks/Python.framework/Versions/3.6/lib/python3.6/urllib/request.py”, line 223, in urlopen
return opener.open(url, data, timeout)
File “/Library/Frameworks/Python.framework/Versions/3.6/lib/python3.6/urllib/request.py”, line 526, in open
response = self._open(req, data)
File “/Library/Frameworks/Python.framework/Versions/3.6/lib/python3.6/urllib/request.py”, line 544, in _open
‘_open’, req)
File “/Library/Frameworks/Python.framework/Versions/3.6/lib/python3.6/urllib/request.py”, line 504, in _call_chain
result = func(*args)
File “/Library/Frameworks/Python.framework/Versions/3.6/lib/python3.6/urllib/request.py”, line 1361, in https_open
context=self._context, check_hostname=self._check_hostname)
File “/Library/Frameworks/Python.framework/Versions/3.6/lib/python3.6/urllib/request.py”, line 1320, in do_open
raise URLError(err)
urllib.error.URLError:
Process finished with exit code 1
Perhaps try downloading the data file to your workstation, place in the same directory as your code file, and change the code to load your local file rather than the URL.
Hi, Jason.
Done as recommended. I copied data from web to Excel and save it as CSV file. Please, have a look. Something is wrong with data formatting in source file, isn’t it? Please, advise.
“/Users/YuriDanilov/PycharmProjects/Week 6/venv/bin/python” “/Users/YuriDanilov/PycharmProjects/Week 6/ML НовыйПроект.py”
Load the dataset:
————————-
Shape:
(150, 5)
Head:
sepal-length sepal-width … petal-width class
0 5.1;3.5;1.4;0.2;Iris-setosa;; NaN … NaN NaN
1 4.9;3.0;1.4;0.2;Iris-setosa;; NaN … NaN NaN
2 4.7;3.2;1.3;0.2;Iris-setosa;; NaN … NaN NaN
3 4.6;3.1;1.5;0.2;Iris-setosa;; NaN … NaN NaN
4 5.0;3.6;1.4;0.2;Iris-setosa;; NaN … NaN NaN
5 5.4;3.9;1.7;0.4;Iris-setosa;; NaN … NaN NaN
6 4.6;3.4;1.4;0.3;Iris-setosa;; NaN … NaN NaN
7 5.0;3.4;1.5;0.2;Iris-setosa;; NaN … NaN NaN
8 4.4;2.9;1.4;0.2;Iris-setosa;; NaN … NaN NaN
9 4.9;3.1;1.5;0.1;Iris-setosa;; NaN … NaN NaN
10 5.4;3.7;1.5;0.2;Iris-setosa;; NaN … NaN NaN
11 4.8;3.4;1.6;0.2;Iris-setosa;; NaN … NaN NaN
12 4.8;3.0;1.4;0.1;Iris-setosa;; NaN … NaN NaN
13 4.3;3.0;1.1;0.1;Iris-setosa;; NaN … NaN NaN
14 5.8;4.0;1.2;0.2;Iris-setosa;; NaN … NaN NaN
15 5.7;4.4;1.5;0.4;Iris-setosa;; NaN … NaN NaN
16 5.4;3.9;1.3;0.4;Iris-setosa;; NaN … NaN NaN
17 5.1;3.5;1.4;0.3;Iris-setosa;; NaN … NaN NaN
18 5.7;3.8;1.7;0.3;Iris-setosa;; NaN … NaN NaN
19 5.1;3.8;1.5;0.3;Iris-setosa;; NaN … NaN NaN
[20 rows x 5 columns]
Description:
sepal-width petal-length petal-width class
count 0.0 0.0 0.0 0.0
mean NaN NaN NaN NaN
std NaN NaN NaN NaN
min NaN NaN NaN NaN
25% NaN NaN NaN NaN
50% NaN NaN NaN NaN
75% NaN NaN NaN NaN
max NaN NaN NaN NaN
Class distribution:
Series([], dtype: int64)
Data visualization: Box and Whisker plots
Data visualization: Histograms
Data visualization: Scatter plot matrix
Traceback (most recent call last):
File “/Users/YuriDanilov/PycharmProjects/Week 6/ML НовыйПроект.py”, line 36, in
scatter_matrix(dataset)
File “/Users/YuriDanilov/PycharmProjects/Week 6/venv/lib/python3.6/site-packages/pandas/plotting/_misc.py”, line 139, in scatter_matrix
**kwds
File “/Users/YuriDanilov/PycharmProjects/Week 6/venv/lib/python3.6/site-packages/pandas/plotting/_matplotlib/misc.py”, line 48, in scatter_matrix
rmin_, rmax_ = np.min(values), np.max(values)
File “”, line 6, in amin
File “/Users/YuriDanilov/PycharmProjects/Week 6/venv/lib/python3.6/site-packages/numpy/core/fromnumeric.py”, line 2746, in amin
keepdims=keepdims, initial=initial, where=where)
File “/Users/YuriDanilov/PycharmProjects/Week 6/venv/lib/python3.6/site-packages/numpy/core/fromnumeric.py”, line 90, in _wrapreduction
return ufunc.reduce(obj, axis, dtype, out, **passkwargs)
ValueError: zero-size array to reduction operation minimum which has no identity
Process finished with exit code 1
Looks like you have nan values for some reason.
Perhaps download this version of the dataset directly:
https://raw.githubusercontent.com/jbrownlee/Datasets/master/iris.csv
Oh, sorry, Jason, I copied the data to Numbers as far as I work on MacOS. It seems that I solved this issue as well. However, there is a question: I’ve found out that iris.csv from web was copied to Numbers in MacOS with “;” between figures and two “;;” at the end of each line. Replacing “;” to “,” by hands solved the issues with data display, however, how to avoid it next time? Please, advise.
You can load the file and specify “;” instead of “,” as the separator, see this:
https://machinelearningmastery.com/load-machine-learning-data-python/
Hi jason,
i was traing model using ‘petal_length’ and ‘petal_width’ only and i got accuracy of about 95%
than i trained the model again with all featues which also resulted in accuracy of 95%
afterwards i tried ‘sepal_length’ and ‘sepal_width’ only, now accuracy is 78%.
So, my questions are:
1. “Can I safely assume that ‘sepal_length’ and ‘sepal_width’ are of no use”?
2. “can i remove them as to make my model less complex’ ?
I have Used ‘GaussianNB’.
Here is my code snippet:
##### Using only ‘petal_length’ and ‘petal_width’
X = data[[‘petal_length’,’petal_width’]]
Y = data[‘class’]
kfold = StratifiedKFold(n_splits = 10, random_state=42, shuffle=True )
GNB = GaussianNB()
cv_result = cross_val_score(GNB,X,Y,cv = kfold,scoring=’accuracy’)
cv_result.mean()
##### accuracy is 95.33333333334
Model selection is a judgement call.
If 95% accuracy can be reliably achieved on a hold out test set and it is “good enough” for you for the problem domain.
This was exactly what I was looking for to get started with hands on with an AI project after going through the theory.
Thank you very much for this.
You’re welcome, I’m happy it helpes!
You are simply Awsome Jason ! Thanks ..it took me around 1.5 year for daring to face first ML program..but the way you written and explained is deserves a big round of applause . 🙂
Thanks, well done for getting there!
LR: 0.950000 (0.055277)
LDA: 0.975000 (0.038188)
KNN: 0.958333 (0.041667)
CART: 0.941667 (0.075000)
NB: 0.950000 (0.055277)
SVM: 0.983333 (0.033333)
Well done!
Thanks you so much for your post.
It’s very useful to me.
You’re welcome, I’m happy to hear that.
LR: 0.955909 (0.044337)
LDA: 0.975641 (0.037246)
KNN: 0.950524 (0.040563)
CART: 0.951166 (0.052812)
NB: 0.951166 (0.052812)
SVM: 0.983333 (0.033333)
Well done!
Thank you so much on this beautiful post. First of a kind, really. I have followed and everything works perfectly:
LR: 0.951807 (0.052427)
LDA: 0.976923 (0.035251)
KNN: 0.951807 (0.052427)
CART: 0.953205 (0.061888)
NB: 0.952448 (0.062375)
SVM: 0.984615 (0.030769)
I have some other question regarding this. I have XYZ data on which I have represented various world object like pylons, conductors, trees, buildings and etc. Can I use XYZ data in order to extract the previous objects using something similar to your example above?
Thanks again.
Well done!
Perhaps. I’m not sure I follow. Maybe this will help:
https://machinelearningmastery.com/how-to-define-your-machine-learning-problem/
What are some really interesting machine learning projects for beginners?
Can you introduce a machine learning project complete with Python code?
Yes, I have hundreds, start here:
https://machinelearningmastery.com/start-here/
Hi I’m going to get into machine learning and Deep Landing but I have no background in algorithmic thinking or programming like Python. But I only know the Python programming language syntax. I was wondering if you could guide me on what to do from beginner to advanced in order to learn machine learning? If the training is project-oriented it is very good. I’m going to do a simple project to fit in my resume as I learn machine learning.
I found this video. Can you give me a thought on this tutorial to start here or not?
https://www.youtube.com/watch?v=_uQrJ0TkZlc&t=5954s
Perhaps start with Python here:
https://machinelearningmastery.com/faq/single-faq/how-do-i-get-started-with-python-programming
worked right out of the box using Anaconda3! you are an amazing human being. I’d like to continue with the way you teach machine learning. I’m intimidated though because my knowledge in programming is average, I have c, c++, visual basic, php, javascript – the old stuffs – background so I can easily follow. I have done a lot of projects and did afterwork for some projects not initially done by me.So I THINK I can follow.
What I’m scared of is the fact that this involves a lot of science and understanding algorithms which is a difficult subject let alone calculus and probability & statistics and my memory is defective,
I’d like to try and thank you for your contribution to this world it means enormously to many many people the world over.
Well done!
Na, it is just another set of tools you can use during programming. Not magic.
Start here:
https://machinelearningmastery.com/start-here/#getstarted
hi jason
thnx for your wonderful post
i’m wondering how to use gamification in machine learning
Sorry, that’s not something I know anything about.
LR: 0.955909 (0.044337)
LDA: 0.975641 (0.037246)
KNN: 0.950524 (0.040563)
CART: 0.966550 (0.041087)
NB: 0.951166 (0.052812)
SVM: 0.983333 (0.033333)
This tutorial is awesome. It encourages me to learn more about Machine Learning. That is the result I got in my step by step practice.
Well done!
great tutorial for beginners.. thank you.
LR: 0.941667 (0.065085)
LDA: 0.975000 (0.038188)
KNN: 0.958333 (0.041667)
CART: 0.941667 (0.053359)
NB: 0.950000 (0.055277)
SVM: 0.983333 (0.033333)
but when i run the predictions using LDA. i get accuracy of 100%
1.0
[[11 0 0]
[ 0 13 0]
[ 0 0 6]]
precision recall f1-score support
Iris-setosa 1.00 1.00 1.00 11
Iris-versicolor 1.00 1.00 1.00 13
Iris-virginica 1.00 1.00 1.00 6
accuracy 1.00 30
macro avg 1.00 1.00 1.00 30
weighted avg 1.00 1.00 1.00 30
Thanks.
Well done! This can happen some times, it may be misleading.
I want to do my research on diabetic ratinopathy using machine learning with python please help me out how can I start my research work . I have only 2 months to complete my work
Perhaps follow this process to work through your project:
https://machinelearningmastery.com/start-here/#process
Hi Jason,
What would you recommend for Nominal dataset, so far I can see that you used Label Encoding for Ordinal and that’s completely fine because there is a relationship among each category in variable.
However, my dataset is purely categorical-nominal and I used one-hot encoding for all of them, which gave me 200+ columns, what would you recommend for that?
I used a feature selection (chi2 and forest-based) to reduce features as well as PCA for dimensionality. What else I can do?
m’ I correct that there are many limitations regarding nominal data.
Could you tell me what I could do or I could not for this data type?
If possible, use Ordinal encoding for ordinal vars, one hot encoding for categorical.
Only reduce/transform if it lifts the skill of the model.
Try consolidating categories.
Try expanding categories.
Get creative, etc.
Hello,
I am trying with my data your example and the compiler produces the following error :
ValueError: Supported target types are: (‘binary’, ‘multiclass’). Got ‘uknown’ instead
what I am doing wrong???I’ve changed the random_state but it happened nothing
Perhaps check that your data was loaded correctly or as you expect?
Thanks for the tutorial, but how am I continuing from here, I have the model I need to use (SVM) he is accurate in 96 presents. And whats next, how am I going to continue working on the model.
You can use it to make predictions on new data. E.g. fit on all data, make predictions, use predictions.
Perhaps I don’t understand the question?
Well, I would like to create a machine learning model to recognize the color of traffic lights, right now I’m using image processing to count the number of yellow, red and blue pixels, getting the max number out of them which is the color of the traffic light, and it works very well.
My question is how can I start programming and write code to build the model?
Start with the tutorials here:
https://machinelearningmastery.com/start-here/#dlfcv
Thank you very much for this tutoriel and sorry for my english.
I have some questions:
when i learned confusion matrix, the last one is applied on a model which predict categorical variable with two values ( yes or no). But in this case the variable have three values, now i dont know how to interpret it. I don’t know which case is false positive, false negative
Also i’m beginner in machine learning and i have some weakness in statistic, so could you please give me a way to go?
You’re welcome!
This will help with the confusion matrix:
https://machinelearningmastery.com/confusion-matrix-machine-learning/
This will help with statistics:
https://machinelearningmastery.com/start-here/#statistical_methods
LR: 0.951807 (0.052427)
LDA: 0.976923 (0.035251)
KNN: 0.951807 (0.052427)
CART: 0.953205 (0.061888)
NB: 0.952448 (0.062375)
SVM: 0.984615 (0.030769)
Well done!
Thank you Jason for the wonderful tutorial. Here are my results:
LR: 0.951807 (0.052427)
LDA: 0.976923 (0.035251)
KNN: 0.951807 (0.052427)
CART: 0.945513 (0.060355)
NB: 0.952448 (0.062375)
SVM: 0.984615 (0.030769)
Well done!
Hi Jason,
Thank you for this incredible tutorial.
I am new to machine learning, and coding in general. I am using a dataset that has column data with completely different meanings/scales for each observation. Does this matter? I see that the example data has is all in cm.
Example:
column 1 column 2 . column 3
12 45 53
13 44 54
12 44 54
if each number represents a different variable ( 12 = male, 13 = female) (45 = tall, 44 = short) do I have to find a way to standardize each observation?
I am using LDA
Yes, in some cases it will be a good idea to scale data with different measures. In the case of LDA, probably standardize the data is a good move, e.g. as part of a pipeline when using k-fold cross validation.
My results from building models (as of 02/24/2020):
LR: 0.951807 (0.052427)
LDA: 0.976923 (0.035251)
KNN: 0.951807 (0.052427)
CART: 0.953205 (0.061888)
NB: 0.952448 (0.062375)
SVM: 0.984615 (0.030769)
Thanks,
Ram
Well done!
Thank you for this wonderful, very helpful instructional material! I gained great insight in how python can be used in ML.
My environment:
1. iMac (27-inch, Late 2013)
2. Mac OSHigh Sierra 10.13.6
3. Anaconda 3.7
4. Jupiter Notebook
Thanks again!
Well done!
My question is how do I actually predict about image. I got a dataset of traffic lights with stats about the appearance of each color 0-5 (ranges of red) 6-11 (ranges of green) 12- 15(ranges of yellow)
This is my code:
from sklearn.metrics import confusion_matrix
from sklearn.metrics import accuracy_score
from sklearn.ensemble import RandomForestClassifier
from sklearn.model_selection import train_test_split
from sklearn.metrics import classification_report
import pandas as pd
df = pd.read_csv(‘/mnt/hgfs/SHARED/traffic_lights.csv’)
colormap = [‘RED’,’RED’,’RED’,’RED’,’RED’,’RED’,’GREEN’,’GREEN’,’GREEN’,’GREEN’,’GREEN’,’GREEN’,’YELLOW’,’YELLOW’,’YELLOW’,’YELLOW’]
df[‘color’] = df.apply(lambda r: colormap[r[‘y’]],axis=1)
df[‘is_RED’] = df.color==’RED’
df[‘is_YELLOW’] = df.color==’YELLOW’
df[‘is_GREEN’] = df.color==’GREEN’
df = df.drop(columns=[‘y’,’images’,’color’])
drop_columns_map = {
‘RED’ : [‘is_YELLOW’,’is_GREEN’],
‘YELLOW’ : [‘is_RED’,’is_GREEN’],
‘GREEN’ : [‘is_YELLOW’,’is_RED’],
}
for color in [‘RED’,’YELLOW’,’GREEN’]:
X = df.drop(columns=drop_columns_map[color])
y = df[f”is_{color}”]
X_train, X_validation, Y_train, Y_validation = train_test_split(X, y, test_size=0.20, random_state=1)
model = RandomForestClassifier(max_depth=2, random_state=0)
model.fit(X_train, Y_train)
predictions = model.predict(X_validation)
print(color)
print(accuracy_score(Y_validation, predictions))
print(confusion_matrix(Y_validation, predictions))
print(classification_report(Y_validation, predictions))
OUTPUT:
RED
1.0
[[88 0]
[ 0 32]]
precision recall f1-score support
False 1.00 1.00 1.00 88
True 1.00 1.00 1.00 32
accuracy 1.00 120
macro avg 1.00 1.00 1.00 120
weighted avg 1.00 1.00 1.00 120
YELLOW
1.0
[[73 0]
[ 0 47]]
precision recall f1-score support
False 1.00 1.00 1.00 73
True 1.00 1.00 1.00 47
accuracy 1.00 120
macro avg 1.00 1.00 1.00 120
weighted avg 1.00 1.00 1.00 120
GREEN
1.0
[[79 0]
[ 0 41]]
precision recall f1-score support
False 1.00 1.00 1.00 79
True 1.00 1.00 1.00 41
accuracy 1.00 120
macro avg 1.00 1.00 1.00 120
weighted avg 1.00 1.00 1.00 120
So my question is how I use this model (which is based on your model) to get results about given picture of traffic light
See these tutorials when working with images:
https://machinelearningmastery.com/start-here/#dlfcv
I did. Nice Tutorial. Thanks.
I have a question: How to interpreter the box and whisker plots and the histogram plots?. Thanks
Box and whisker help you to see the middle mass of data and the outliers.
Histograms help you to see the probability distribution.
hi.
i have a question.u said before that we have to convert data to a list after that we convert the list to an array.in the example up we find : array=dataset.values.
we did not use the numpy array in this case?
and what does this line of code means?
We retrieve the numpy array from the pandas dataframe.
so there is a relationship between numpy and pandas array?
but when i tried array=numpy.array(dataset) i got errors and i thinked that it was the same code.could u explain it for me please.
and thnx for the reply.
Pandas does not have an array, it has a dataframe. A pandas dataframe wraps or can be converted into a numpy array (ndarray).
To get a numpy array from a dataframe call the .values attribute.
Very interesting & encouraging article.
I have a question. How could I view the training sample & Validation sample?
Thanks.
What do you mean view? You can print or save them to file:
https://machinelearningmastery.com/how-to-save-a-numpy-array-to-file-for-machine-learning/
Thanks for this step by step example. This is the first one that makes sense and is easy to follow.
My question is how do you understand the results of a model? What is determine to be a good model? I am learning to use SparkSQL/databricks and the have different fuNctions with different results MSE and MAE.
gsc = GridSearchCV(
estimator=SVR(kernel=’rbf’),
param_grid={
‘C’: [0.1, 1, 100, 1000],
‘epsilon’: [0.0001, 0.0005, 0.001, 0.005, 0.01, 0.05, 0.1, 0.5, 1, 5, 10],
‘gamma’: [0.0001, 0.001, 0.005, 0.1, 1, 3, 5]
},
cv=5, scoring=’neg_mean_squared_error’, verbose=0, n_jobs=-1)
Thanks in advance
Diane
Thanks!
Typically a model is chosen that is both relatively simple and performs well compared to other models on a hold out dataset and the results are stable over multiple evaluations.
LR: 0.941667 (0.065085)
LDA: 0.975000 (0.038188)
KNN: 0.958333 (0.041667)
CART: 0.941667 (0.053359)
NB: 0.950000 (0.055277)
SVM: 0.983333 (0.033333)
Well done!
Thank you Jason for this tuto. My results :
LR: 0.941667 (0.065085)
LDA: 0.975000 (0.038188)
KNN: 0.958333 (0.041667)
CART: 0.941667 (0.053359)
NB: 0.950000 (0.055277)
SVM: 0.983333 (0.033333)
Now, I want to use KDD dataset (train and Test) using SVM to predict network Intrusion. But how to train a final model and make prediction. Thanks
# Load dataset
url = “C:/Users/artap/Documents/Python/KDDTrain20Percent.csv”
names = [‘duration’, ‘protocol_type’, ‘service’, ‘flag’, ‘src_bytes’, ‘dst_bytes’, ‘land’, ‘wrong_fragment’, ‘urgent’, ‘hot’, ‘num_failed_logins’, ‘logged_in’, ‘num_compromised’, ‘root_shell’, ‘su_attempted’, ‘num_root’, ‘num_file_creations’, ‘num_shells’, ‘num_access_files’, ‘num_outbound_cmds’, ‘is_host_login’, ‘is_guest_login’, ‘count’, ‘srv_count’, ‘serror_rate’, ‘srv_serror_rate’, ‘rerror_rate’, ‘srv_rerror_rate’, ‘same_srv_rate’, ‘diff_srv_rate’, ‘srv_diff_host_rate’, ‘dst_host_count’, ‘dst_host_srv_count’, ‘dst_host_same_srv_rate’, ‘dst_host_diff_srv_rate’, ‘dst_host_same_src_port_rate’, ‘dst_host_srv_diff_host_rate’, ‘dst_host_serror_rate’, ‘dst_host_srv_serror_rate’, ‘dst_host_rerror_rate’, ‘dst_host_srv_rerror_rate’, ‘class’, ‘report’]
dataset = read_csv(url, names=names)
Well done!
LR: 0.950000 (0.055277)
LDA: 0.975000 (0.038188)
KNN: 0.958333 (0.041667)
CART: 0.941667 (0.075000)
NB: 0.950000 (0.055277)
SVM: 0.983333 (0.033333)
Well done.
Hey Jason,
great work and really helpful ,however i need to know about the ” Hyperparameter Tunnig”.
when to use it and what would be the steps regarding the same followed by the type of dataset used.
thanks if you would reply.
Thanks.
Always use it if you have time.
Us a grid or a random search:
Thank you Jason! This was really helpful. Do you have guidance or a recommendation regarding the size of the test data set relative to the validation data set? In this example we used 20%, is there some rule of thumb for test group sizes?
Also what exactly is this bit doing? does it have something to do with the number of variables in the algorithm?
X = array[:,0:4]
y = array[:,4]
Again thanks for this tutorial, it really is helpful and I hope you continue to do this. Hands down the best/easiest tutorial I’ve found.
I’m happy to hear that.
It needs to be large enough to be representative of the problem. This may be different for each dataset.
This might help:
https://machinelearningmastery.com/much-training-data-required-machine-learning/
I have got the following results:
LR: 0.941667 (0.065085)
LDA: 0.975000 (0.038188)
KNN: 0.958333 (0.041667)
CART: 0.950000 (0.040825)
NB: 0.950000 (0.055277)
SVM: 0.983333 (0.033333)
Well done!
Hi, Jason Brownlee,
Thank you so much for this wonderful tutorial and website in general.
It provides clear, comprehensive and application-oriented learning.
Regards.
You’re welcome!
Great work , really helpful instructional material! I gained great insight in how python can be used in ML.,Thank you Jason!
You’re welcome.
Nice one Jason, here my (a total beginner in ML) results 🙂
LR: 0.941667 (0.065085)
LDA: 0.975000 (0.038188)
KNN: 0.958333 (0.041667)
CART: 0.950000 (0.040825)
NB: 0.950000 (0.055277)
SVM: 0.983333 (0.033333)
Well done!
(base) [samy@localhost Python]$ sudo yum install python3-numpy
[sudo] password for samy:
Loaded plugins: changelog, fastestmirror, langpacks
Loading mirror speeds from cached hostfile
* base: linux.mirrors.es.net
* centos-sclo-rh: linux.mirrors.es.net
* centos-sclo-sclo: linux.mirrors.es.net
* elrepo: mirror.pit.teraswitch.com
* epel: sjc.edge.kernel.org
* extras: centos-distro.1gservers.com
* updates: mirror.hostduplex.com
Package python36-numpy-1.12.1-3.el7.x86_64 already installed and latest version
Nothing to do
I already installed but if I check with this
(base) [samy@localhost Python]$ python36-numpy –version
bash: python36-numpy: command not found…
(base) [samy@localhost Python]$ numpy –version
bash: numpy: command not found…
import scipy
print(‘scipy: {}’.format(scipy.__version__))
# numpy
import numpy
print(‘numpy: {}’.format(numpy.__version__))
# matplotlib
import matplotlib
print(‘matplotlib: {}’.format(matplotlib.__version__))
# pandas
import pandas
print(‘pandas: {}’.format(pandas.__version__))
# scikit-learn
import sklearn
print(‘sklearn: {}’.format(sklearn.__version__))scipy
this also not working
This will help:
https://machinelearningmastery.com/faq/single-faq/how-do-i-run-a-script-from-the-command-line
How much time can it take to build the models.. Cause my mac is like stuck forever..
it is not giving me an output from ancient times now..
It really depends on the size of the dataset and complexity of the model.
Most the tutorial examples should train in seconds to minutes.
Hello Jason,
Thanks for this post and your work.
Below the results I get:
LR: 0.941667 (0.065085)
LDA: 0.975000 (0.038188)
KNN: 0.958333 (0.041667)
CART: 0.950000 (0.040825)
NB: 0.950000 (0.055277)
SVM: 0.983333 (0.033333)
Kind regards,
Dominique
Well done!
Nice tutorial @Jason
so how to implement it in a real application like a web app or mobile app so that the user can load data and see the result?
You can integrate the model into your application directly.
hi, thks for step by step ML introdcution. I’m new to learn ML. Are there only 6 supervised model to use in Python for prediction. If not, what other model can be used.
Btw, how will we know supervised model not suitable to use but need to consider other algorithm such as NLP, DL,..etc
There are many more than 6, regarding choosing the best method for a dataset, this will help:
https://machinelearningmastery.com/faq/single-faq/what-algorithm-config-should-i-use
Helllo there!
This tutorial was very useful for me to get into ML. Recently, I completed Andrew Ng course of ML and was stuck what to do next. This post helped me get through it so smoothly. So, jason I have two questions for you:
1.What should I do next to get my hand dirty in the field of ML?
2.This question is related to iris project , I tried to implement the LDA model to find the
predictions but it popped some errors as follows:
—————————————————————————
TypeError Traceback (most recent call last)
in
1 model = LinearDiscriminantAnalysis
—-> 2 model.fit(X_train, Y_train)
3 predictions = model.predict(X_validation)
TypeError: fit() missing 1 required positional argument: ‘y’
I m newbie in python and still learning, Please guide me through this.
Good question, practice on small standard datasets:
https://machinelearningmastery.com/start-here/#getstarted
Perhaps check the content of your Y_train variable?
LR: 0.941667 (0.065085)
LDA: 0.975000 (0.038188)
KNN: 0.958333 (0.041667)
CART: 0.933333 (0.050000)
NB: 0.950000 (0.055277)
SVM: 0.983333 (0.033333)
Well done!
Jason,
Thank you for this introduction to ML using Python.
As requested, here are my results (MacBook Pro 2018).
Python: 3.8.2 (v3.8.2:7b3ab5921f, Feb 24 2020, 17:52:18)
[Clang 6.0 (clang-600.0.57)]
scipy: 1.4.1
numpy: 1.18.3
matplotlib: 3.2.1
pandas: 1.0.3
sklearn: 0.22.2.post1
LR: 0.941667 (0.065085)
LDA: 0.975000 (0.038188)
KNN: 0.958333 (0.041667)
CART: 0.958333 (0.041667)
NB: 0.950000 (0.055277)
SVM: 0.983333 (0.033333)
Regards from a 50y old C developer in Telecoms 🙂
Well done!
Hello Jason:
I am really enjoying your tutorial, thanks for offering this training.
While stepping thru your tutorial, I am also experimenting by changing the code to see what I get and why I get. Anyway, here is an example of my experiment (assigning of X and y before train_test_split() call):
Instead of slicing the dataset DF for assign to X and y:
X = array[:,0:4]
y = array[:,4]
I experimented followings:
# Experiment A: Split-out validation dataset (feature columns assigned to a set ‘{}’)
feature_col_names = {‘sepal-length’, ‘sepal-width’, ‘petal-length’, ‘petal-width’}
class_col_name = ‘class’
X = dataset[feature_col_names].values
y = dataset[class_col_name].values
# Experiment B: Split-out validation dataset (feature columns assigned to a list ‘[]’)
feature_col_names = [‘sepal-length’, ‘sepal-width’, ‘petal-length’, ‘petal-width’]
class_col_name = ‘class’
X = dataset[feature_col_names].values
y = dataset[class_col_name].values
In either of the steps (your slicing method and my experiments) gives the same result of spotcheck:
LR: 0.941667 (0.065085)
LDA: 0.975000 (0.038188)
KNN: 0.958333 (0.041667)
CART: 0.950000 (0.040825)
NB: 0.950000 (0.055277)
SVM: 0.983333 (0.033333)
My questions are:
1. Is there any advantage of using your slicing method in assigning X and y ?
2. Is there any issue of using column names variable (as I did above)
3. Which one is more accurate, column variable as a ‘list’ [] or ‘set’ {}?
You’re welcome.
Well done!
What would the alternative to slicing be to select columns on arrays?
https://machinelearningmastery.com/index-slice-reshape-numpy-arrays-machine-learning-python/
You are operating on pandas DataFrames instead of arrays. You can use dataframes as inputs to sklearn, I rather not though.
They are equally accurate.
Hello Jason:
Thanks for your reply. As I read, you preferred Array over DataFrame.
Is there any particular advantage of using array over dataframe ?
I would like to know, because I prefer Pandas dataframe.
Hmmm, perhaps numpy arrays are simpler.
My result of the test:
LR: 0.941667 (0.065085)
LDA: 0.975000 (0.038188)
KNN: 0.958333 (0.041667)
CART: 0.958333 (0.041667)
NB: 0.950000 (0.055277)
SVM: 0.983333 (0.033333)
Well done!
LR: 0.941667 (0.065085)
LDA: 0.975000 (0.038188)
KNN: 0.958333 (0.041667)
CART: 0.950000 (0.040825)
NB: 0.950000 (0.055277)
SVM: 0.983333 (0.033333)
Well done!
FitFailedWarning)
/home/zigbee/.local/lib/python3.7/site-packages/sklearn/model_selection/_validation.py:536: FitFailedWarning: Estimator fit failed. The score on this train-test partition for these parameters will be set to nan. Details:
ValueError: could not convert string to float: ‘Some-college’
FitFailedWarning)
im using this tutorial on Adult dataset and facing problem with end print statement error come couldnot convert string to float please help Mr jason
Perhaps this will help, it shows how to work on the adult dataset:
https://machinelearningmastery.com/imbalanced-classification-with-the-adult-income-dataset/
Thanks for this first-project for ML, it was quite useful. Interestingly the LDA ended up as strongest after k-fold validation, with the SVM a lot lower than Dr. Jason’s value (maybe a statistical artifact considering the large standard deviation):
LR: 0.95 (0.05527707983925667)
LDA: 0.975 (0.03818813079129868)
KNN: 0.9583333333333334 (0.05590169943749474)
CART: 0.9583333333333333 (0.05590169943749474)
NB: 0.9499999999999998 (0.055277079839256664)
SVM: 0.9666666666666666 (0.055277079839256664)
One question, when you perform
model = SVC(gamma=’auto’)
model.fit(X_training, y_training)
predictions = model.predict(X_validation)
doesn’t this create and train a new SVC machine on the whole data set? meaning it would give different results than if the machine was trained part-by-part through cross-validation. Is there a way to return the machine after being trained specifically on k-folding?
Thanks.
Well done!
Correct. Yes, we have already estimated how well the model will perform on average when making new predictions. That was the whole point of doing the cross-validation.
LR: 0.941667 (0.065085)
LDA: 0.975000 (0.038188)
KNN: 0.958333 (0.041667)
CART: 0.941667 (0.053359)
NB: 0.950000 (0.055277)
SVM: 0.983333 (0.033333)
Well done!
Thank you so much for the privilege of participating in this project. I have a few questions.
1) Out of all the models we used, it seemed to me that we have used SVM for making our prediction. How can we make predictions with the other model?
2) For instance, if I am to do a forecast of prediction of let’s say wind power with varying weather conditions, can this method we have used be applied to it?
3) Can you please give a clearer explanation of the prediction results?
Thanks.
You can make predictions with any model, this will show you how:
https://machinelearningmastery.com/make-predictions-scikit-learn/
Dear Jason,
Thank you so much for this tutorial. I love your teaching method.
You got a new subscriber.
Here are my results.
—– EVALUATION RESULTS —–
LR: 0.941667 (0.065085)
LDA: 0.975000 (0.038188)
KNN: 0.958333 (0.041667)
CART: 0.933333 (0.050000)
NB: 0.950000 (0.055277)
SVM: 0.983333 (0.033333)
—– PREDICTIONS —–
0.9666666666666667
[[11 0 0]
[ 0 12 1]
[ 0 0 6]]
precision recall f1-score support
Iris-setosa 1.00 1.00 1.00 11
Iris-versicolor 1.00 0.92 0.96 13
Iris-virginica 0.86 1.00 0.92 6
accuracy 0.97 30
macro avg 0.95 0.97 0.96 30
weighted avg 0.97 0.97 0.97 30
Sincerely,
Ace
You’re welcome.
Well done!
—– EVALUATION RESULTS —–
LR: 0.958333 (0.076830)
LDA: 0.991667 (0.025000)
KNN: 0.975000 (0.038188)
CART: 0.933333 (0.062361)
NB: 0.941667 (0.053359)
SVM: 0.966667 (0.040825)
—– PREDICTIONS —–
LR
0.9333333333333333
[[16 0 0]
[ 0 4 1]
[ 0 1 8]]
precision recall f1-score support
Iris-setosa 1.00 1.00 1.00 16
Iris-versicolor 0.80 0.80 0.80 5
Iris-virginica 0.89 0.89 0.89 9
accuracy 0.93 30
macro avg 0.90 0.90 0.90 30
weighted avg 0.93 0.93 0.93 30
————————
LDA
0.9333333333333333
[[16 0 0]
[ 0 4 1]
[ 0 1 8]]
precision recall f1-score support
Iris-setosa 1.00 1.00 1.00 16
Iris-versicolor 0.80 0.80 0.80 5
Iris-virginica 0.89 0.89 0.89 9
accuracy 0.93 30
macro avg 0.90 0.90 0.90 30
weighted avg 0.93 0.93 0.93 30
————————
KNN
0.9666666666666667
[[16 0 0]
[ 0 4 1]
[ 0 0 9]]
precision recall f1-score support
Iris-setosa 1.00 1.00 1.00 16
Iris-versicolor 1.00 0.80 0.89 5
Iris-virginica 0.90 1.00 0.95 9
accuracy 0.97 30
macro avg 0.97 0.93 0.95 30
weighted avg 0.97 0.97 0.97 30
————————
CART
0.9666666666666667
[[16 0 0]
[ 0 4 1]
[ 0 0 9]]
precision recall f1-score support
Iris-setosa 1.00 1.00 1.00 16
Iris-versicolor 1.00 0.80 0.89 5
Iris-virginica 0.90 1.00 0.95 9
accuracy 0.97 30
macro avg 0.97 0.93 0.95 30
weighted avg 0.97 0.97 0.97 30
————————
NB
0.9666666666666667
[[16 0 0]
[ 0 5 0]
[ 0 1 8]]
precision recall f1-score support
Iris-setosa 1.00 1.00 1.00 16
Iris-versicolor 0.83 1.00 0.91 5
Iris-virginica 1.00 0.89 0.94 9
accuracy 0.97 30
macro avg 0.94 0.96 0.95 30
weighted avg 0.97 0.97 0.97 30
————————
SVM
0.9666666666666667
[[16 0 0]
[ 0 4 1]
[ 0 0 9]]
precision recall f1-score support
Iris-setosa 1.00 1.00 1.00 16
Iris-versicolor 1.00 0.80 0.89 5
Iris-virginica 0.90 1.00 0.95 9
accuracy 0.97 30
macro avg 0.97 0.93 0.95 30
weighted avg 0.97 0.97 0.97 30
————————
Well done!
Jason Brownlee, you got me started gently, thanks a lot.
Here are my outcomes:
# Spot Check Algorithms
LR: 0.951807 (0.052427)
LDA: 0.976923 (0.035251)
KNN: 0.951807 (0.052427)
CART: 0.953205 (0.061888)
NB: 0.952448 (0.062375)
SVM: 0.984615 (0.030769)
# Evaluate predictions(SVM)
0.9666666666666667
[[11 0 0]
[ 0 12 1]
[ 0 0 6]]
precision recall f1-score support
Iris-setosa 1.00 1.00 1.00 11
Iris-versicolor 1.00 0.92 0.96 13
Iris-virginica 0.86 1.00 0.92 6
accuracy 0.97 30
macro avg 0.95 0.97 0.96 30
weighted avg 0.97 0.97 0.97 30
Well done!
Hello Jason, I am a machine learning beginner, I can’t load the dataset, Here is the message I got after trying to load:
NameError: name ‘read_csv’ is not defined.
Kindly assist please.
Thank you
I’m sorry to hear that, I think you may have skipped some lines of code. Try copying the whole example at the end of that section.
How to implement the model. I mean If I give the input of the values it should say the name. How can I do that?
Perhaps adapt the above tutorial for your own dataset.
Actually I mean, Suppose I want to give new data say 1.4,2.4,3 . How can I make to predict and give output which kind of flower it is?
The example at the end shows how to make a prediction for new data.
Also, see this:
https://machinelearningmastery.com/make-predictions-scikit-learn/
How can I approach to build a ML model to forecast percent free space available on a drive for a particular server and drive.
Feature variables (X) – servername, drive, date/time
Output variables (Y) – precetfree
Do you have any suggestions on how I can get srtarted?
Probably model it as a time series forecasting problem:
https://machinelearningmastery.com/start-here/#timeseries
This will help you think about it:
https://machinelearningmastery.com/time-series-forecasting-supervised-learning/
Thanks for all the work, your approach is making getting into machine learning really efficient for me. I want to take advantage of the technology for practical uses even though I don’t have much time to spare in learning all about it, so I really appreciate it.
The reason I write is because the 5.5 complete example runs for me but raises this error:
“FutureWarning: Setting a random_state has no effect since shuffle is False. This will raise an error in 0.24. You should leave random_state to its default (None), or set shuffle=True.”
Solved it by changing the first line of the for loop to :
kfold = StratifiedKFold(n_splits=10, random_state=1, shuffle=True)
Hope it is useful.
Regards,
Jorge
You’re welcome.
Thanks, updated!
LR: 0.941667 (0.065085)
LDA: 0.975000 (0.038188)
KNN: 0.958333 (0.041667)
CART: 0.958333 (0.041667)
NB: 0.950000 (0.055277)
SVM: 0.983333 (0.033333)
Well done!
Perfect Jason ! Very Clear and Very clean code . Thanks happy Learning
Thanks.
My Results:
LR: 0.941667 (0.065085)
LDA: 0.975000 (0.038188)
KNN: 0.958333 (0.041667)
CART: 0.950000 (0.055277)
NB: 0.950000 (0.055277)
SVM: 0.983333 (0.033333)
Well done!
Dear Jason,
Your tutorial is awesome and i understand it…
But i try to run with my own dataset. It stated out this warning..What does it mean and how i can solve it?
C:\Users\user\anaconda3\lib\site-packages\sklearn\model_selection\_split.py:667: UserWarning: The least populated class in y has only 1 members, which is less than n_splits=10.
% (min_groups, self.n_splits)), UserWarning)
tq
Thanks!
It suggests your dataset does not have enough examples in each class to use cross-validation. Perhaps you can get more data for your prediction task?
LR: 0.941667 (0.065085)
LDA: 0.975000 (0.038188)
KNN: 0.958333 (0.041667)
CART: 0.941667 (0.053359)
NB: 0.950000 (0.055277)
SVM: 0.983333 (0.033333)
Well done!
Hi Jason – I would like to appreciate your effort to put forth a comparable hello world program in machine language. This indeed give us an idea on how to go about for ML programs, different stages before we finally test the algorithm.
My theory was put to test and was able to quickly understand the complete workflow. I was able to understand the utility of univariate and multi-variable plot in principal. To be honest, i was able to to understand the “in-principal” use of each section which was otherwise non-relating for me. I being a master of connecting dots, it helps me learn when i am able to connect the dots.
thanks a lot Jason.
Well done, you’re very welcome!
working through your example and wanted to post my data
LR: 0.955909 (0.044337)
LDA: 0.975641 (0.037246)
KNN: 0.950524 (0.040563)
CART: 0.966550 (0.041087)
NB: 0.951166 (0.052812)
SVM: 0.983333 (0.033333)
Well done!
LR: 0.941667 (0.065085)
LDA: 0.975000 (0.038188)
KNN: 0.958333 (0.041667)
CART: 0.941667 (0.053359)
NB: 0.950000 (0.055277)
SVM: 0.983333 (0.033333)
Well done!
LR: 0.941667 (0.065085)
LDA: 0.975000 (0.038188)
KNN: 0.958333 (0.041667)
CART: 0.958333 (0.041667)
NB: 0.950000 (0.055277)
SVM: 0.983333 (0.033333)
Sir,I have a bit confusion regarding random_state.Why we fix it to 1?
Thank you so much!
Well done!
Good question, see this:
https://machinelearningmastery.com/faq/single-faq/what-value-should-i-set-for-the-random-number-seed
Thank you so much!
You’re welcome!
LR: 0.941667 (0.065085)
LDA: 0.975000 (0.038188)
KNN: 0.958333 (0.041667)
CART: 0.950000 (0.040825)
NB: 0.950000 (0.055277)
SVM: 0.983333 (0.033333)
Well done!
Hello Jason
Great article, thank you for that. The only question i have is if there is a way to download the data set after we make predictions? for example, we upload the csv with these numeric attributes, with an empty column (eg ‘category’) and in return we get that column populated
You’re welcome.
Yes, call model.predict() with new input to get the category for the input, learn more here:
https://machinelearningmastery.com/make-predictions-scikit-learn/
Hi, I am new to machine learning. I have given a set of nighttime satellite images and few CSV files, I need to create a machine learning model. Could you please tell me what would be the role of images, what should I extract from them?
Perhaps this process will help as a guide through your project:
https://machinelearningmastery.com/start-here/#process
Also, these tutorials on how to work with images:
https://machinelearningmastery.com/start-here/#dlfcv
Hi
Thank your valuable training. My question is what would be the results? I mean can we have any correlation as out put? or what kind of figure( plot) would be the outputs?
Thanks a lot
You can report the performance of the model as classification accuracy.
This is the expected behaviour of the model when making predictions on new data, e.g. how accurate it is expected to be on average.
LR: 0.958333 (0.055902)
LDA: 0.983333 (0.033333)
KNN: 0.958333 (0.055902)
CART: 0.950000 (0.055277)
NB: 0.966667 (0.055277)
SVM: 0.966667 (0.055277)
Well done!
Hi, when making univariate and multivariate diagrams there are only 3 pairs of data sets, this also appears when viewing data in python. Any ideas why? thanks
Yes, no need to view a variable vs itself.
Thanks for the help I’ve sorted it now and can now view all four columns of data.
I’m happy to hear that.
Very well explained
Thank you!
R: 0.941667 (0.065085)
LDA: 0.975000 (0.038188)
KNN: 0.958333 (0.041667)
CART: 0.950000 (0.040825)
NB: 0.950000 (0.055277)
SVM: 0.983333 (0.033333)
Well done.
Hi Jason thanks for the post!
very professional, courteous
and very services!
Sorry for the question .. I’m beginner in ML.
I did not understand what problem we were trying to solve and what the final table was
means.
I would appreciate your response,
thank you!
In this problem we are trying to predict the species of flower given measurements of the flower.
LR: 0.941667 (0.065085)
LDA: 0.975000 (0.038188)
KNN: 0.958333 (0.041667)
CART: 0.941667 (0.053359)
NB: 0.950000 (0.055277)
SVM: 0.983333 (0.033333)
Well done!
Great Tutorial. Thank you!!
Thanks!
Okay, this is an excellent tutorial. The level of thoroughness is just right, it’s explained so that I can follow everything and understand, without getting boring.
Well, except this. You write
“The confusion matrix provides an indication of the three errors made.”
For the life of me, I can only find one error in the confusion matrix, a virginica predicted to be a versicolor. With 30 elements in the validation set, one error also gives me a 97% accuracy rate. Is this just a typo, or am I missing something?
Agreed, one error. The text is for an older version of the tutorial. Fixed. Thanks!
Hello Jason,
Great tutorial,
I have a question not related to this post,
I have a dataset with repeated measures(correlation is present) and mix variables(numeric and categorical) and my target is binary (yes,no).
What machine learning model would you suggest (for example what classifier)?
Also can i run a unsupervised model in this situation?
Thanks for helping with great posts.
This framework will help you determine if your problem is supervised learning:
https://machinelearningmastery.com/how-to-define-your-machine-learning-problem/
This will help you choose an algorithm:
https://machinelearningmastery.com/faq/single-faq/what-algorithm-config-should-i-use
Hi Jason,
Thanks a lot, this was super helpful.
You’re welcome.
Hi Jason.
I tried to import the following libraries in command line, but it was showing the error “from is not recognized as an internal or external command, operable program or batch file”. What should be done, can I write code in Jupyter Notebook?
from pandas import read_csv
from pandas.plotting import scatter_matrix
from matplotlib import pyplot
from sklearn.model_selection import train_test_split
from sklearn.model_selection import cross_val_score
from sklearn.model_selection import StratifiedKFold
from sklearn.metrics import classification_report
from sklearn.metrics import confusion_matrix
from sklearn.metrics import accuracy_score
from sklearn.linear_model import LogisticRegression
from sklearn.tree import DecisionTreeClassifier
from sklearn.neighbors import KNeighborsClassifier
from sklearn.discriminant_analysis import LinearDiscriminantAnalysis
from sklearn.naive_bayes import GaussianNB
from sklearn.svm import SVC
Thanks in advance
This will help:
https://machinelearningmastery.com/faq/single-faq/how-do-i-run-a-script-from-the-command-line
Dear Jason,
I follow this first tutorial and apply my recent discovery to Jupyter Notebook with a template for taking the paper format of IEEE.
And the result in PDF is so cool. I need a little bit more drilling with the concepts in ML, but mixed with automated reasoning with PySwip I think It will be a cool work.
What is PySwip?
Can I get help with step 2
What problem are you having exactly?
I am not able to build the models(step 5.3).
It shows indentation error and name not defined.
Please give a solution.
This will show you how to copy the code without losing the white space:
https://machinelearningmastery.com/faq/single-faq/how-do-i-copy-code-from-a-tutorial
I already did all that. I tried it again too, but still the same error. What shall I do?
Perhaps try indenting the code manually in your text editor.
Also see these tips:
https://machinelearningmastery.com/faq/single-faq/why-does-the-code-in-the-tutorial-not-work-for-me
Hi Jason,
Would it be correct to say that while doing train_test_split, adding the parameter ‘stratify=y’ is a better/recommended way to go?
I tried with and without stratify and got perfect predictions (accuracy=1) when stratified, but am not sure if that is just coincidental for this data set or is always recommended?
Thanks
Yes, highly recommended.
See this:
https://machinelearningmastery.com/cross-validation-for-imbalanced-classification/
i got these answers
LR: 0.951807 (0.052427)
LDA: 0.976923 (0.035251)
KNN: 0.951807 (0.052427)
CART: 0.945513 (0.060355)
NB: 0.952448 (0.062375)
SVM: 0.984615 (0.030769)
Well done!
The model works fine in my python shell.But i am not able to compile it by pyinstaller into an executable.
Perhaps there is a problem with your installer?
LR: 0.941667 (0.065085)
LDA: 0.975000 (0.038188)
KNN: 0.958333 (0.041667)
CART: 0.950000 (0.055277)
NB: 0.950000 (0.055277)
SVM: 0.983333 (0.033333)
good example and a quick confidence boost
Well done!
LR: 0.941667 (0.065085)
LDA: 0.975000 (0.038188)
KNN: 0.958333 (0.041667)
CART: 0.950000 (0.040825)
NB: 0.950000 (0.055277)
SVM: 0.983333 (0.033333)
Well done!
Oh wow.. You made the whole damn thing look so easy. Thanks for this and of course the entire website and courses!
My results..
LR: 0.951807 (0.052427)
LDA: 0.976923 (0.035251)
KNN: 0.951807 (0.052427)
CART: 0.945513 (0.060355)
NB: 0.952448 (0.062375)
SVM: 0.984615 (0.030769)
Thanks! You’re very welcome.
LR: 0.955909 (0.044337)
LDA: 0.975641 (0.037246)
KNN: 0.950524 (0.040563)
CART: 0.966550 (0.041087)
NB: 0.951166 (0.052812)
SVM: 0.983333 (0.033333)
Well done!
Thanks for your kind guidance Mr.,
Your explanation really helpful for me to practice on python. It’s very kind of you to show us how to do what in the codes.
It’s hard for me to say, but as someone new to these, i find it’s hard for me to understand ‘what the code is actually do’ in one go. I think that for me to better understand what this step-by-step tutorial is actually do, I need the flowchart diagram.I’m sorry,could you maybe provide it please.
Thank you for the suggestion, perhaps in the future.
Which part is confusing?
Hello Jason – Out of my interest I am learning ML with Python. I don’t have a development background(So not sure if this is a good start) and been in QA for almost 10 yrs. I was looking for a place to start and somehow landed here. I tried the example and it was interesting so I am going to continue with the rest. I do have a question on
kfold = StratifiedKFold(n_splits=10, shuffle= True, random_state= 1)
cross_val_score(model , X_train , Y_train, cv= kfold ,scoring=’accuracy’)
This evaluates the Model and gives scores for 10 splits of the entire dataset. Is there a way I can see what are those 10 splits or is this like a black box and we only get the score for each set?
Good question.
Yes, you can enumerate each split manually to see what is involved. This tutorial gives an example you can use as a starting point:
https://machinelearningmastery.com/k-fold-cross-validation/
Thanks Jason, Now I can see the list.
One question though , In the defintion of split this is what has been written
“Generate indices to split data into training and test set.” What does this mean?
Also if I use train_test_split , I declare train & test percentage but in case of split() , how does it decide what % of data will be treated for train and for test. Is it like data_sample_count / kfold_split ?
Row indexes in the data array, e.g. select which rows to use for training and which to use for testing.
For k-fold it uses one fold as the hold out, and is repeated for each fold. if you have 200 rows and k=10, then 200/10 = 20 rows are used in each fold. More here:
https://machinelearningmastery.com/k-fold-cross-validation/
Thanks Jason , All clear now . Where to head next?
Great.
Here:
https://machinelearningmastery.com/start-here/#python
I got these:
LR: 0.960897 (0.052113)
LDA: 0.973974 (0.040110)
KNN: 0.957191 (0.043263)
CART: 0.957191 (0.043263)
NB: 0.948858 (0.056322)
SVM: 0.983974 (0.032083)
Well done!
Hi, In section 2.2 I found that I need to write:
datasets = pandas.read_csv(url, names=names)
instead of what you used/wrote which is;
datasets = read_csv(url, names=names)
I’m on python 3.7 is that why there is this difference? or some other reason do you suspect?
I think you might have skipped some lines of code. Perhaps double check.
Hi. According to your project, SVM perfoms well than the other algorithms. Then how to show them in a plot like classification plot for svm.
Sorry, I don’t understand. What plot do you want to create exactly?
https://scikit-learn.org/0.18/auto_examples/svm/plot_iris.html
In the above link, they have plotted svm classification plot for iris dataset. Accordingly, how to plot any classification plot (like svm,knn,lda,decision tree etc) for our own dataset. Thankyou for your response.
Thanks for sharing.
How could we create a plot for the model evaluation results and compare the spread and the mean accuracy of each model?
can you show the plot for model evaluation results for your algorithm?
Perhaps a box and whisker plot of the accuracy:
Thankyou sir.
You’re welcome.
Hi Mr. Brownlee,
I have a question in “Compare Algorithms” step, in this line below:
cv_results = cross_val_score(model, X_train, Y_train, cv=kfold, scoring=’accuracy’)
Why the input of cross_val_score function is X_train and Y_train rather than X and y, like this:
cv_results = cross_val_score(model, X, y, cv=kfold, scoring=’accuracy’)
I mean why don’t we use cross_val_score on the dataset rather than the train set ?
Because when I use this function on the dataset, the highest score is LDA not SVM.
LR: 0.953333 (0.042687)
LDA: 0.980000 (0.030551) (highest)
KNN: 0.966667 (0.033333)
CART: 0.946667 (0.065320)
NB: 0.960000 (0.044222)
SVM: 0.973333 (0.032660)
Then I use LDA to make predictions and the result of accuracy score is 1.0
1.0
[[11 0 0]
[ 0 13 0]
[ 0 0 6]]
precision recall f1-score support
Iris-setosa 1.00 1.00 1.00 11
Iris-versicolor 1.00 1.00 1.00 13
Iris-virginica 1.00 1.00 1.00 6
accuracy 1.00 30
macro avg 1.00 1.00 1.00 30
weighted avg 1.00 1.00 1.00 30
Is it too good to be true? Is it correct to use X and y? Thank you sir.
Yes, you can cross-validation on the whole dataset if you like.
If you have enough data, I like to hold back a small portion as a final sanity check to make sure I’m not fooling myself.
Thank you so much. It’s really helpful !
You’re welcome.
Hi Jason,
What a post!
Very helpful. Thank you
Thanks!
Thanks for this interesting tutorial. I am having an error when evaluating the LDA model:
FitFailedWarning: Estimator fit failed. The score on this train-test partition for these parameters will be set to nan.
output>> LDA: nan (nan)
all other models did alright:
LR: 0.941667 (0.065085)
KNN: 0.958333 (0.041667)
CART: 0.950000 (0.055277)
NB: 0.950000 (0.055277)
SVM: 0.983333 (0.033333)
Intersting, perhaps you need to update your version of R/libs, or perhaps the API has changed?
%.3f
LR: 0.950 (0.055)
LDA: 0.983 (0.033)
KNN: 0.958 (0.056)
CART: 0.950 (0.085)
NB: 0.967 (0.076)
SVM: 0.983 (0.033)
Add CatboostClassifier
CB: 0.975 (0.038)
Well done!
LR: 0.941667 (0.065085)
LDA: 0.975000 (0.038188)
KNN: 0.958333 (0.041667)
CART: 0.958333 (0.041667)
NB: 0.950000 (0.055277)
SVM: 0.983333 (0.033333)
Well done!
Hello Jason,
I read your tutorial and I came to know about ML. I want to ask a question. How to improve a particular algorithm so that percentage of accuracy increases by using an improved algorithm? For example, you used SVM as the final model. How to improve it so that accuracy increases?
Thank you.
Good question, try tuning the model hyperparameters of the SVM algorithm, some ideas here:
https://machinelearningmastery.com/hyperparameters-for-classification-machine-learning-algorithms/
Hello Jason,
Thank you for your guidance and I will go through it. However, I also want to ask is how to make our own algorithms from scratch that could give an expected accuracy level just like the algorithms mentioned in your post? Do you have any reference to how to devise our own algorithms?
Thank you.
These tutorials will show you how to code algorithms from scratch:
https://machinelearningmastery.com/start-here/#code_algorithms
Super – this just pasted a section at a time into a Jupyter Notebook, installed via Anaconda so all the modules were pre-installed, and ran first time
Well done!
have you simple complate project i see
Thanks.
Hi Jason,
I’m new to Machine learning and this is my first model.
I even added printing of accuracy by validating it as its done in the last for this example,
Looking at it accuracy is 1 for LDA and KNN, but currently in the example and from the below, mean value is more for SVM, so which should be used and can you explain why?
LR: Mean:0.941667 STD: (0.065085), : Accuracy: 0.833333
LDA: Mean:0.975000 STD: (0.038188), : Accuracy: 1.000000
KNN: Mean:0.958333 STD: (0.041667), : Accuracy: 1.000000
CART: Mean:0.950000 STD: (0.040825), : Accuracy: 0.966667
NB: Mean:0.950000 STD: (0.055277), : Accuracy: 0.966667
SVM: Mean:0.983333 STD: (0.033333), : Accuracy: 0.966667
Thanks in Advance
Well done!
Typically we choose the “simplest model” with the “best performance”. There is always tension between these two concerns and often “better performance” wins.
Thank you Jason for all the comprehensive posts, I learned a lot, I have read almost all of your posts. Actually, I am in the middle of a machine learning practice and really need your professional hits to resolve the faced challenge.
The problem: I have a list of clients and the model should predict whether they would reorder any specific product or not.
The point is I have historical information of conditions for each time of ordering of these products for every single client.
Some products are in common and some not for these clients and number of orders and historical data of orders for each client is imbalanced i.e. some clients have 20 products in the list and some have 5, I have more than 10000 historical records of some customer and less than 5000 for some others.
I want to make a model to predict each product reordering based on each client’s behavior and condition (client behavior and condition=historical data). Which model is better and How can I high light products and client ID to the model?
Thanks in advance!
You’re welcome.
I recommend testing a suite of different framings of the problem, different data preparations, different models, and model configuration in order to discover what works well for your specific dataset.
This will help you to get started:
https://machinelearningmastery.com/faq/single-faq/what-algorithm-config-should-i-use
Great tutorial, was a good start for this amazing topic
Well done on your progress!
Excellent tutorial I will start as fast as I can with the upcoming lessons.
Thanks.
This tutorial was very great and very appriciative.
Thanks.
great tutorial! God bless you!
Thanks!
hi Dr Brownlee
I’m just getting into this space and Python. I finished your tutorial using vi and the command line (python 3.9).
Here’s some data I generated when doing Split-out validation and a Spot Check of the algorithms:
$ python3 step5.py
LR: 0.941667 (0.065085)
LDA: 0.975000 (0.038188)
KNN: 0.958333 (0.041667)
CART: 0.950000 (0.040825)
NB: 0.950000 (0.055277)
SVM: 0.983333 (0.033333)
Now, I have a question about working with PyCharm IDE.
I ran the code first shown in Step 2, loading the data.
When trying to load the dataset I’m getting an SSL error executing:
dataset = read_csv(url, names=names)
Note: url is defined as “https://raw.githubusercontent.com/jbrownlee/Datasets/master/iris.csv”
urllib.error.URLError:
So, something is missing in my PyCharm project environment. Any idea what this can be?
Art
Nice work!
I don’t recommend using an IDE, you can learn more here:
https://machinelearningmastery.com/faq/single-faq/why-dont-use-or-recommend-notebooks
Thanks for the advice. Now I gotta learn what all the steps in this tutorial did!
Algorithmic comparisons, validations, predictions (probably the most interesting subject) etc.
The IDE is convenient but not necessary; I should follow your advice.
Now, the thing I should decide is next step(s) to answer the above questions. You seem to have posted more tutorials but also published a book. More advice here would be appreciated.
Art
Perhaps work through these free tutorials in order to learn what you did:
https://machinelearningmastery.com/start-here/#python
Jason, thanks very much. I think I finally found a path to pick up the fundamentals of ML!
Art
You’re welcome, well done!
Excellent tutorial, completed it with the same results as stated here.
Thanks. Well done!
Hi,
First of all big thanks for this excellent tutorial. it helped me a lot to get starting with machine learning techniques.
I’m just stuck in the creation of a validation dataset, in this line
X_train, X_validation, Y_train, Y_validation = train_test_split(X, y, test_size=0.20, random_state=1)
it shows me that the train_test_split variable is not defined in the code. and to be honest I don’t really understand what this line is supposed to do.
can you please help me to finish this tutorial?
You’re welcome, well done on your progress!
The line splits a dataset into a training portion and a test portion.
You can learn more here:
https://machinelearningmastery.com/train-test-split-for-evaluating-machine-learning-algorithms/
Is anyone else having trouble with 2.2 Loading the iris dataset?
Try as I might, nothing shows up with the below entry
# Load dataset
url = “https://raw.githubusercontent.com/jbrownlee/Datasets/master/iris.csv”
names = [‘sepal-length’, ‘sepal-width’, ‘petal-length’, ‘petal-width’, ‘class’]
dataset = read_csv(url, names=names)
Nothing should show up from those lines of code as they simply load the data.
Perhaps try the complete example at the end of the section.
LR: 0.941667 (0.065085)
LDA: 0.975000 (0.038188)
KNN: 0.958333 (0.041667)
CART: 0.958333 (0.041667)
NB: 0.950000 (0.055277)
SVM: 0.983333 (0.033333)
Well done!
I believe I’m following this right, and oddly enough I get an error warning with nan results for LDA.
LR: 0.941667 (0.065085)
LDA: nan (nan)
KNN: 0.958333 (0.041667)
CART: 0.958333 (0.041667)
NB: 0.950000 (0.055277)
SVM: 0.983333 (0.033333)
Using scikit-learn 0.24.1
Interesting, perhaps try running the example a few times?
Perhaps check other library versions?
Perhaps some of these tips will help:
https://machinelearningmastery.com/faq/single-faq/why-does-the-code-in-the-tutorial-not-work-for-me
Dear, Its literally very interesting and useful for beginners keep it up. Stay blessed
Thanks!
LR: 0.941667 (0.065085)
LDA: 0.975000 (0.038188)
KNN: 0.958333 (0.041667)
CART: 0.941667 (0.053359)
NB: 0.950000 (0.055277)
SVM: 0.983333 (0.033333)
Great work!
Hi Mr jason, please could you tell me what is the function of this code and what is mean if the result is .9 (i mean the training csore function)
print(‘Training set score: {:.4f}’.format(model.score(X_train, y_train)))
It reports the performance (classification accuracy) of the model on the training set with 4 decimal places.
that’s right but if the result is 0.9 so is it mean that 0.1 of data can’t train well or what?
Yes, we do not get models capable of 100% accuracy, you can learn more here:
https://machinelearningmastery.com/faq/single-faq/why-cant-i-get-100-accuracy-or-zero-error-with-my-model
thanks for sharing the link. another question please, how can I know from my result the overfitting and underfitting?
if the training score is .9 and the testing score .95 is it mean overfitting?
You’re welcome.
Good question, focus on the out of sample/test set performance. Overfitting/underfiting is a diagnostic you can do for poorly performing models in some cases. Like neural nets. Ignore for now/model selection. Also see this:
https://machinelearningmastery.com/overfitting-machine-learning-models/
Hi, first, congrats on the tutorial! It really helped me to understand better how to apply ML through Python!!! However, as I’m new in this field, I have two questions, and if you could answer me, I’d be so grateful. First, I’d like to print the predictions. Then, I’d like to evaluate the algorithms through the Area Under the Curve. How can I do these two things? Can you help me?
Thanks!
By print, you mean save to file, then print on a printer? If so, this will help:
https://machinelearningmastery.com/how-to-save-a-numpy-array-to-file-for-machine-learning/
This will help you with area under roc curves:
https://machinelearningmastery.com/roc-curves-and-precision-recall-curves-for-classification-in-python/
Thanks a lot!!!
Hi! I have included the Random Forest Algorithm in the code above. However, when I tried to implement the ROC analysis as decribed in (https://machinelearningmastery.com/roc-curves-and-precision-recall-curves-for-classification-in-python/) the function “model.predict_proba” did not work with that algorithm. How can I fix it? Can you help me? Thanks in advance.
Sorry to hear that, perhaps you can summarize the problem you had?
Hi! I’m sorry by my last message. My real problem at this moment is:
I tried to calculate the AUC for the models in the code above plus the inclusion of RFC. To do this I used the code below:
resultsauc = [ ]
namesauc = [ ]
for name, model in models:
probs = model.predict_proba(X_validation)
probs = probs[:, 1]
auc_results = roc_auc_score(Y_validation, probs)
resultsauc.append(auc_results)
namesauc.append(name)
print(name, auc_results)
However, Python send me the following message:
Traceback (most recent call last):
File “C:\Users\Acer\OneDrive\Working on\Machine_Learning\05.ML&Python\MachineLearning.py”, line 156, in
probs = model.predict_proba(X_validation)
File “C:\Users\Acer\AppData\Local\Programs\Python\Python38-32\lib\site-packages\sklearn\linear_model\_logistic.py”, line 1463, in predict_proba
check_is_fitted(self)
File “C:\Users\Acer\AppData\Local\Programs\Python\Python38-32\lib\site-packages\sklearn\utils\validation.py”, line 63, in inner_f
return f(*args, **kwargs)
File “C:\Users\Acer\AppData\Local\Programs\Python\Python38-32\lib\site-packages\sklearn\utils\validation.py”, line 1041, in check_is_fitted
raise NotFittedError(msg % {‘name’: type(estimator).__name__})
sklearn.exceptions.NotFittedError: This LogisticRegression instance is not fitted yet. Call ‘fit’ with appropriate arguments before using this estimator.
Can you give me some advice? Thanks in advance!
The error may suggest that your model was not fit on the training data before you called predict.
LR: 0.941667 (0.065085)
LDA: 0.975000 (0.038188)
KNN: 0.958333 (0.041667)
CART: 0.958333 (0.041667)
NB: 0.950000 (0.055277)
SVM: 0.983333 (0.033333)
Great work!
LR: 0.941667 (0.065085)
LDA: 0.975000 (0.038188)
KNN: 0.958333 (0.041667)
CART: 0.958333 (0.041667)
NB: 0.950000 (0.055277)
SVM: 0.983333 (0.033333)
my results uwu
Well done!
LR: 0.941667 (0.065085)
LDA: 0.975000 (0.038188)
KNN: 0.958333 (0.041667)
CART: 0.950000 (0.055277)
NB: 0.950000 (0.055277)
SVM: 0.983333 (0.033333)
Well done!
How can I read the box whisker figures ?
Good question, this will help:
https://en.wikipedia.org/wiki/Box_plot
Hi. When I use your Python code with another dataset, I get as error that the target type is not binary and not multiclass, but continuous. So the target type must be binary or multiclass but my dataset is continuous. What can I change so that I can use your python code with my dataset without an error?
I would be very happy about a feedback. 🙂
Perhaps you are working with a regression problem instead?
This may help:
https://machinelearningmastery.com/lasso-regression-with-python/
That is my error:
File “/opt/anaconda3/lib/python3.7/site-packages/sklearn/model_selection/_split.py”, line 641, in _make_test_folds
allowed_target_types, type_of_target_y))
ValueError: Supported target types are: (‘binary’, ‘multiclass’). Got ‘continuous’ instead.
Yes, you must use a regression algorithm like linear regression.
Really amazing post I have ever seen about ML. I am a new bee, thank you for sharing such a wonderful post with examples and step by step explanation. Will continue to follow your post, well done.
Thanks, I’m happy it helps!
LR: 0.941667 (0.065085)
LDA: 0.975000 (0.038188)
KNN: 0.958333 (0.041667)
CART: 0.950000 (0.040825)
NB: 0.950000 (0.055277)
SVM: 0.983333 (0.033333)
0.9666666666666667
[[11 0 0]
[ 0 12 1]
[ 0 0 6]]
precision recall f1-score support
Iris-setosa 1.00 1.00 1.00 11
Iris-versicolor 1.00 0.92 0.96 13
Iris-virginica 0.86 1.00 0.92 6
accuracy 0.97 30
macro avg 0.95 0.97 0.96 30
weighted avg 0.97 0.97 0.97 30
Well done!
Thank you
You’re welcome!
Hi, I was just wondering how I could actively apply this. For example, with this model, is it possible to somehow integrate it into some code so that I can key in the parameters, and it gives the identity of the flower? Thank you.
Yes, you could save the model and use it in an application that takes flower measurements and estimates the species.
LR: 0.941667 (0.065085)
LDA: 0.975000 (0.038188)
KNN: 0.958333 (0.041667)
CART: 0.950000 (0.040825)
NB: 0.950000 (0.055277)
SVM: 0.983333 (0.033333)
Well done!
Hi Jason. Thanks for the tutorial. I found it easy to follow and everything worked first time.
I do have a couple of questions for you. As this is the first ever ML program I’ve created I don’t fully understand what’s happening. Can you please tell me in the simplest of terms what exactly the machine is learning? Am I correct in thinking that it takes the data from the set then uses the petal/sepal data to predict what species of Iris this data belongs too?
You’re welcome!
We are predicting flower species based on flower measurements. We are using some historically collected data, tested some models to see what is good at making this prediction, then selected a model to make predictions on some data.
Got it. Thanks very much!
You’re welcome.
What is the dependent variable in this experiment?
The dependent variable is the species of flower (e.g. class label).
LR: 0.941667 (0.065085)
LDA: 0.975000 (0.038188)
KNN: 0.958333 (0.041667)
CART: 0.958333 (0.041667)
NB: 0.950000 (0.055277)
SVM: 0.983333 (0.033333)
Well done!
can we apply the same code to a different dataset?
Yes!
Hi. Thank you for the above tutorial. really helpful. Now I need help with a school project here. I want to build an ANN traffic control system that predicts the number of cars approaching a roundabout and indicate the right traffic light. Any help or pointing to where I can begin or tutorials available will be much appreciated
Perhaps this will help as a starting point:
https://machinelearningmastery.com/start-here/#process
Dear Jason,
Thanks for this tutorial. I think that I may be misunderstanding how the split function works. You have this string in the code: X = array[:,0:4] and y = array[:,4]
I am assuming that X is the input, i.e. the various lengths. I am not clear as to y column 4 is also included in the input. I assume column 4 is the the out (which i am taking to indicate the iris class) as this is what is passed to y.
Secondly, is it possible to amend the code to deal with multiple outputs? I have 3 outputs. I know that I could run the code in turn for each output but I suspect that my outputs are correlated and any derived relationship has map the 3 outputs to the 3 inputs in one step.
Thank you in advance
It is called an array slice and is correct, you can learn more here:
https://machinelearningmastery.com/index-slice-reshape-numpy-arrays-machine-learning-python/
checkout:
https://github.com/niektuytel/Machine_Learning/tree/main
Thanks for sharing.
HI Jason ,
I have tried the example on Jupiter i am getting the below scores:
LR: 0.941667 (0.065085)
LDA: 0.975000 (0.038188)
KNN: 0.958333 (0.041667)
CART: 0.941667 (0.053359)
NB: 0.950000 (0.055277)
SVM: 0.983333 (0.033333)
and my library versions are :
Python: 3.8.5 (default, Sep 3 2020, 21:29:08) [MSC v.1916 64 bit (AMD64)]
Scipy :1.5.2
print :1.19.2
Matplotlib : 3.3.2
Pandas : 1.1.3
scikit-learn : 0.23.2
Well done!
LR: 0.941667 (0.065085)
LDA: 0.975000 (0.038188)
KNN: 0.958333 (0.041667)
CART: 0.950000 (0.040825)
NB: 0.950000 (0.055277)
SVM: 0.983333 (0.033333
Python: 3.9.6 (tags/v3.9.6:db3ff76, Jun 28 2021, 15:26:21) [MSC v.1929 64 bit (AMD64)]
scipy: 1.7.0
numpy: 1.21.1
matplotlib: 3.4.2
pandas: 1.3.0
sklearn: 0.24.2
Well done!
LR: 0.941667 (0.065085)
LDA: 0.975000 (0.038188)
KNN: 0.958333 (0.041667)
CART: 0.941667 (0.053359)
NB: 0.950000 (0.055277)
SVM: 0.983333 (0.033333)
Thanks for the great tutorial!
Well done!
Very usefull material. Superb
Thanks!
Hello,
I am new to Machine Learning and i have tried your model/codes on my dataset but am having below errors. Can you help?
Traceback (most recent call last):
File “C:\Users\Public\Documents\Sheena\venv\lib\site-packages\joblib\parallel.py”, line 820, in dispatch_one_batch
tasks = self._ready_batches.get(block=False)
File “C:\Program Files\WindowsApps\PythonSoftwareFoundation.Python.3.9_3.9.1776.0_x64__qbz5n2kfra8p0\lib\queue.py”, line 168, in get
raise Empty
_queue.Empty
During handling of the above exception, another exception occurred:
Traceback (most recent call last):
File “C:\Users\Public\Documents\Sheena\ML Testing.py”, line 40, in
cv_results = cross_val_score(model, X_train, Y_train, cv=kfold, scoring=’accuracy’)
File “C:\Users\Public\Documents\Sheena\venv\lib\site-packages\sklearn\utils\validation.py”, line 63, in inner_f
return f(*args, **kwargs)
File “C:\Users\Public\Documents\Sheena\venv\lib\site-packages\sklearn\model_selection\_validation.py”, line 445, in cross_val_score
cv_results = cross_validate(estimator=estimator, X=X, y=y, groups=groups,
File “C:\Users\Public\Documents\Sheena\venv\lib\site-packages\sklearn\utils\validation.py”, line 63, in inner_f
return f(*args, **kwargs)
File “C:\Users\Public\Documents\Sheena\venv\lib\site-packages\sklearn\model_selection\_validation.py”, line 250, in cross_validate
results = parallel(
File “C:\Users\Public\Documents\Sheena\venv\lib\site-packages\joblib\parallel.py”, line 1041, in __call__
if self.dispatch_one_batch(iterator):
File “C:\Users\Public\Documents\Sheena\venv\lib\site-packages\joblib\parallel.py”, line 831, in dispatch_one_batch
islice = list(itertools.islice(iterator, big_batch_size))
File “C:\Users\Public\Documents\Sheena\venv\lib\site-packages\sklearn\model_selection\_validation.py”, line 250, in
results = parallel(
File “C:\Users\Public\Documents\Sheena\venv\lib\site-packages\sklearn\model_selection\_split.py”, line 332, in split
for train, test in super().split(X, y, groups):
File “C:\Users\Public\Documents\Sheena\venv\lib\site-packages\sklearn\model_selection\_split.py”, line 80, in split
for test_index in self._iter_test_masks(X, y, groups):
File “C:\Users\Public\Documents\Sheena\venv\lib\site-packages\sklearn\model_selection\_split.py”, line 693, in _iter_test_masks
test_folds = self._make_test_folds(X, y)
File “C:\Users\Public\Documents\Sheena\venv\lib\site-packages\sklearn\model_selection\_split.py”, line 645, in _make_test_folds
raise ValueError(
ValueError: Supported target types are: (‘binary’, ‘multiclass’). Got ‘unknown’ instead.
Process finished with exit code 1
I believe probably your “model” variable is created with some parameters wrong. May be you look in that direction. Can’t tell much from this given information.
LR: 0.941667 (0.065085)
LDA: 0.975000 (0.038188)
KNN: 0.958333 (0.041667)
CART: 0.941667 (0.038188)
NB: 0.950000 (0.055277)
SVM: 0.983333 (0.033333)
hi jason, i was wondering, is it not necesarry to convert the target value (iris sentosa etc) into numerical data? as far as i know python can only run numerical data not string data. sorry if my question is stupid i just started learning machine learning. thank you in advance!
Depends on your model. Decision tree can give you string data as output, but neural network needs to be numerical and then you interpret the numerical data into other strings.
i see, thanks a lot!
Hi
I hope you are doing well.
First of all, hats off for this article.
2nd, Please guide me how I can define or communicate my model result to my management or you can say a LAYMAN? For example, I follow all of your steps and my results are
LR: 0.941667 (0.065085)
LDA: 0.975000 (0.038188)
KNN: 0.958333 (0.041667)
CART: 0.958333 (0.041667)
NB: 0.950000 (0.055277)
SVM: 0.983333 (0.033333)
So, How can I define these results to a layman?
I shall be very thankful to you.
Best Regards
That’s something you have to think about. Machine learning should not be the entire story. Interpretation is a human job.
Thanks for the reply. I’m totally new to Data Science and self studying it. For last 4 days, I m doing research on this “how to interpret a MAE, MEan and Std to a layman” but couldn’t find anything good.
I don’t think I can give you any good explanation at this level. This is a good book for real beginners that I believe you will find some insight: https://amzn.com/0062731025
in this line-> “for name, model in models”
how could it detect which part is name in which part is model? isnt models a list type variable?
sorry if my question is dumb, thanks in advance
That’s a Python syntax. The “models” is a list of the form [(name,model), (name,model), …]
Hence the for line you quoted will take each name-model pair in each iteration.
ooh okay i see it now. thank you so much!
very cool article for beginners! I had fun reading about the ..mean, median etc
LR: 0.941667 (0.065085)
LDA: 0.975000 (0.038188)
KNN: 0.958333 (0.041667)
CART: 0.950000 (0.040825)
NB: 0.950000 (0.055277)
SVM: 0.983333 (0.033333)
my results.! very similar to what others and whats posted in the article
Great job! Thanks for sharing.
Thanks a lot for the tutorial and explanation!
my results:
LR: 0.941667 (0.065085)
LDA: 0.975000 (0.038188)
KNN: 0.958333 (0.041667)
CART: 0.941667 (0.053359)
NB: 0.950000 (0.055277)
SVM: 0.983333 (0.033333)
My results seem quite different than everyone else’s:
LR: 0.691667 (0.083749)
LDA: 0.791667 (0.100347)
KNN: 0.750000 (0.111803)
CART: 0.675000 (0.108333)
NB: 0.800000 (0.130171)
SVM: 0.775000 (0.105738)
any idea why these results are quite different than what most people saw?
Your number is a bit low. But did you tried multiple times with different random seed? If you still see a low number for different run, there should be something wrong with your data or your models.
found my problem… i was mucking with the previous array slice, and had left it saying:
X = array[:,0:2]
changing it back to
X = array[:,0:4]
fixed the problem
LR: 0.941667 (0.075000)
LDA: 0.975000 (0.038188)
KNN: 0.933333 (0.050000)
CART: 0.916667 (0.074536)
NB: 0.941667 (0.083749)
SVM: 0.950000 (0.040825)
Thanks for the tutorial. Would you please explain the total numbers in confusion matrix don’t match the total number of instances which is 150?
Thanks
Hi Samia…The following is a great resource for understanding confusion matrix details:
https://machinelearningmastery.com/confusion-matrix-machine-learning/
Thank you so much! I love the information you provide here, I love the way in which you provide it. The scope is at the sweet spot to satisfy my curiosity but not overwhelm me.
I love the images and plots that accompany the informaiton and make your post much more accessible!
This post and your attitude is empowering me to retake on this very deep and vast subject. Have a blessed day!
my results:
LR: 0.941667 (0.065085)
LDA: 0.975000 (0.038188)
KNN: 0.958333 (0.041667)
CART: 0.950000 (0.055277)
NB: 0.950000 (0.055277)
SVM: 0.983333 (0.033333)
Thank you for the feedback and kind words Sal! Keep up the great work!
Thanks for taking your time to write this excellent piece for free. I happened to to have bumped on this well after versions had changed. The version you used or anything near that can no longer be downloaded. Any hope of rewriting using newer one as some lines seems not work any more?
Hi Samuel…Thank you for your feedback! Please let me know what portions are not working for you so that we can identify possible solutions
Hey James!
Thank you so much for explaining everything in detail. I actually have quote a few doubts:
1. Why and when should we clean the dataset?
2. Is there any method in allotting the ratios of train-test-validation dataset (instead of us allotting the ratios)?
3. Will the results vary if we give different ratios for train-test-validation with different models? If yes, how?
Hi Mee…Thank you for the feedback!
1. The following may be beneficial to understand recommended practice regarding data preparation:
https://machinelearningmastery.com/data-preparation-for-machine-learning-7-day-mini-course/
2 and 3: The following resource may help clarify:
https://machinelearningmastery.com/training-validation-test-split-and-cross-validation-done-right/
Well done! Thank you very much.
I Have this
LR: 0.941667 (0.065085)
LDA: 0.975000 (0.038188)
KNN: 0.958333 (0.041667)
CART: 0.950000 (0.040825)
NB: 0.950000 (0.055277)
SVM: 0.983333 (0.033333)
Well done Thank you very much
# Split-out validation dataset
import numpy as np
from sklearn.model_selection import train_test_split
array = df.values
X = array[:,1:60]
y = array[:,60]
X_train, X_validation, Y_train, Y_validation = train_test_split(X, y, test_size=0.20, random_state=1)
# Spot Check Algorithms
from pandas import read_csv
from matplotlib import pyplot
from sklearn.model_selection import train_test_split
from sklearn.model_selection import cross_val_score
from sklearn.model_selection import StratifiedKFold
from sklearn.linear_model import LogisticRegression
from sklearn.tree import DecisionTreeClassifier
from sklearn.neighbors import KNeighborsClassifier
from sklearn.discriminant_analysis import LinearDiscriminantAnalysis
from sklearn.naive_bayes import GaussianNB
from sklearn.svm import SVC
models = []
models.append((‘LR’, LogisticRegression(solver=’liblinear’, multi_class=’ovr’)))
models.append((‘LDA’, LinearDiscriminantAnalysis()))
models.append((‘KNN’, KNeighborsClassifier()))
models.append((‘CART’, DecisionTreeClassifier()))
models.append((‘NB’, GaussianNB()))
models.append((‘SVM’, SVC(gamma=’auto’)))
# evaluate each model in turn
results = []
names = []
for name, model in models:
kfold=StratifiedKFold(n_splits=10,random_state=1,shuffle=True)
cv_results=cross_val_score(model, X_train, Y_train, cv=kfold, scoring=’accuracy’ )
results.append(cv_results)
names.append(name)
print(‘%s: %f (%f)’ % (name, cv_results.mean(), cv_results.std()))
I’m getting this Error:
ValueError: Supported target types are: (‘binary’, ‘multiclass’). Got ‘unknown’ instead
Seams the problem is this row :cv_results=cross_val_score(model, X_train, Y_train, cv=kfold, scoring=’accuracy’ )
Can you help me ?
Hi Daniel…Thanks for asking.
I’m eager to help, but I just don’t have the capacity to debug code for you.
I am happy to make some suggestions:
Consider aggressively cutting the code back to the minimum required. This will help you isolate the problem and focus on it.
Consider cutting the problem back to just one or a few simple examples.
Consider finding other similar code examples that do work and slowly modify them to meet your needs. This might expose your misstep.
Consider posting your question and code to StackOverflow.
These are my results:
LR: 0.941667 (0.065085)
LDA: 0.975000 (0.038188)
KNN: 0.958333 (0.041667)
CART: 0.941667 (0.053359)
NB: 0.950000 (0.055277)
SVM: 0.983333 (0.033333)
Thank you for the feedback Prince! Keep up the great work!
Hi Jason,
Thanks for this tutorial.
I have just one question, please:
In the section where we evaluate some algorithms, you wrote:
cv_results = cross_val_score(model, X_train, Y_train, cv=kfold, scoring=’accuracy’)
Why you considered the training set only (X_train, Y_train) and not the WHOLE data set?
Hi Jaber…The example is intended to determine the training accuracy, however you should also evaluate the testing and validating accuracy.
Thanks James for the claification
Hello @ James Carmichael .
Good afternoon. Please I am new to ML. In fact, this is my first project on ML.
I don’t know how to start the project and what is needed to build the ML.
My Project Task: Task 2: Image classification for a refund department (spotlight: Batch processing)
please, I need guidelines on how to go about the project.
Looking forward to hearing from you
KInd regards,
Esther
Hi ljeoma…the following may be of interest:
https://machinelearningmastery.com/multi-label-classification-with-deep-learning/
Is there something wrong with the code in 5.1 Create a Validation Dataset? The last number of X = array[:,0:4] should be 3, not 4. I am not really sure by the way.
Hi Mark…Have you executed the code? If so, please share any inconsistencies you find.
Hello! So I’m doing this project and am trying to integrate some machine learning into it.
I want to recreate a physics equation (using data generated by the equation itself or through experimentation) with unsupervised machine learning. Using the code above, are there functions that allow me to generate an equation or possibly view relationships between variables?
Thanks a lot by the way. Your articles are the best that I have seen online teaching machine learning, and you’re such a great teacher!
Hi Alson…That sounds like a very interesting application! We do not currently have content specific that objective, however I would recommend the following location as a great starting point for all of the content we have developed.
I’m sorry, but did you mean to send a link?
thanks a lot for sharing such a nice tutorial, it helps a lot in starting, i have query, I would like to see the confusion matrix for each fold, could you please advise in this regard.
Hi omehi…You may find the following of interest:
https://machinelearningmastery.com/confusion-matrix-machine-learning/
Can you post a model for very basic case like two numbers
odd ,odd = addition
odd , even = subtraction
even , odd = multiplication
even , even = division
Hi Ram…The following resource is a great starting point for performing basic mathematical operations in Python.
https://www.w3resource.com/python-exercises/math/
Don’t see the code snippets for some reason.
Hi A…Please clarify how you are viewing the tutorial so that we may better assist you.
hi james , how can i use many dataset.csv in one machine for training
Hi Oussama…The following resource may be helpful in terms of importing multiple CSV files into dataframes:
https://www.geeksforgeeks.org/read-multiple-csv-files-into-separate-dataframes-in-python/
Hello, James. I was just wondering how this is considered as machine learning because I have a very vague understanding of what machine learning is. Can you specifically tell me where the machine learning part is. Thank you very much for the tutorial.
Hi Jom…”Machine learning” is broad field. The following may add clarity:
https://machinelearningmastery.com/what-is-machine-learning/
Machine Learning or ML is the study of systems that can learn from experience (e.g. data that describes the past). You can learn more about the definition of machine learning in this post:
What is Machine Learning?
Predictive Modeling is a subfield of machine learning that is what most people mean when they talk about machine learning. It has to do with developing models from data with the goal of making predictions on new data. You can learn more about predictive modeling in this post:
Gentle Introduction to Predictive Modeling
Artificial Intelligence or AI is a subfield of computer science that focuses on developing intelligent systems, where intelligence is comprised of all types of aspects such as learning, memory, goals, and much more.
Machine Learning is a subfield of Artificial Intelligence.
Nvm, I think I see it, but please still tell me where the machine learning part is because I might be wrong. Btw, how does cross_val_score work? Thanks
Hi Jom…You may find the following resource of interest:
https://machinelearningmastery.com/training-validation-test-split-and-cross-validation-done-right/
My Results
LR: 0.941667 (0.065085)
LDA: 0.975000 (0.038188)
KNN: 0.958333 (0.041667)
CART: 0.958333 (0.041667)
NB: 0.950000 (0.055277)
SVM: 0.983333 (0.033333)
Thank you for the feedback! Keep up the great work!
Is there any chance I can use Jupyter Notebook instead of Anaconda or do I have to use Anaconda?
Hi Chris…While we do not recommend any particular Python platform, many have provided feedback that the majority of the code listings we provide in our content will work quite well in Jupyter Notebook, Anaconda, or Google Colab. Please proceed with what works best for you.
Hi Jason,
This is amazing! Thank you so much for sharing!
How can i see the data from the CSV along with the algorithm’s prediction? I would like to see which one’s the model got wrong.
Thanks again!
Hi Gautam…You are very welcome! The following resource may be of interest to you:
https://www.kaggle.com/questions-and-answers/285909
Thank you so much for sharing!
You are very welcome Kaveri! We appreciate your support and feedback!
This is exactly what I was looking for! A way to quickly get my hands dirty with this stuff, even if I don’t understand everything going on in the background.
After I did the tutorial as instructed, I went back to the beginning to try to understand more of what was going on. Eventually I was looking up each algorithm presented here and their parameters. While I didn’t quite understand what all the parameters of the algorithms did, I fiddled with several of them, trying to refine each model as much as I could.
I ended up getting the LDA (solver = ‘eigen’, shrinkage = 0.2) predicting as well as the SVM (0.983333) on the CV. To my surprise and joy, that model ended up predicting the validation data perfectly!
Anyway, it was a fun way to start this journey and I look forward to learning a lot more.
Thank you Dan for your feedback and support! We greatly appreciate it.
Very descriptive article for beginners, thank you very much. Do you have any other article like this that shows how to give the real life user inputs and how the output is given. It will be very helpful if the same IRIS project is used.
Hi Yahya…You are very welcome! The following location is a great starting point for your machine-learning journey!
https://machinelearningmastery.com/start-here/
Hello,
in 5.4 select the best model, in the results only SVM appears and when comparing the algorithms only SVM appears.
How can I solve this?
Thank you.
Hi Romi…The following resource may add clarity:
https://machinelearningmastery.com/evaluate-performance-deep-learning-models-keras/
Great!Thank you!
You are very welcome Li Heng! Thank you for your support!
Great intro and it was very nice to run into this tutorial to get me started. Lol i’ll have to go over it a few times to grok everything but thank you so much for this. These are my results:
Results of each model…..
LR: (0.9416666666666667, 0.06508541396588878)
LDA: (0.975, 0.03818813079129868)
KNN: (0.9583333333333333, 0.04166666666666669)
CART: (0.9583333333333333, 0.041666666666666685)
NB: (0.95, 0.05527707983925667)
SVM: (0.9833333333333332, 0.03333333333333335)
Evaluations after our predictions
0.9666666666666667
[[11 0 0]
[ 0 12 1]
[ 0 0 6]]
precision recall f1-score support
Iris-setosa 1.00 1.00 1.00 11
Iris-versicolor 1.00 0.92 0.96 13
Iris-virginica 0.86 1.00 0.92 6
accuracy 0.97 30
macro avg 0.95 0.97 0.96 30
weighted avg 0.97 0.97 0.97 30
I am starting at square 0, and after clearing a first few hurdles, I was not even able to install the libraries at all… (as a newb), I didn’t see where I even GO to import this:
Hi Yasanthi…Two options may be of interest.
Google Colab requires no local installation:
https://machinelearningmastery.com/google-colab-for-machine-learning-projects/
Anaconda Distribution:
https://machinelearningmastery.com/setup-python-environment-machine-learning-deep-learning-anaconda/
Here are my results,
LR: 0.941667 (0.065085)
LDA: 0.975000 (0.038188)
KNN: 0.958333 (0.041667)
CART: 0.950000 (0.040825)
NB: 0.950000 (0.055277)
SVM: 0.983333 (0.033333)
Thank you Sai for your feedback! Let us know if we can answer any questions as you work through your projects!
This is my result:
LR: 0.941667 (0.065085)
LDA: 0.975000 (0.038188)
KNN: 0.958333 (0.041667)
CART: 0.958333 (0.041667)
NB: 0.950000 (0.055277)
SVM: 0.983333 (0.033333)
Thank you for your feedback Farsheed! Keep up the great work!
LR: 0.941667 (0.065085)
LDA: 0.975000 (0.038188)
KNN: 0.958333 (0.041667)
CART: 0.941667 (0.053359)
NB: 0.950000 (0.055277)
SVM: 0.983333 (0.033333)
Keep up the great work Robert! Let us know if you have any questions as you work through the tutorials!
Hi Jason,
Thank you for introducing this tutorial for beginners like me. I really appreciate it. I have just started so looking forward to learning.
Here are my results: –
LR: 0.941667 (0.065085)
LDA: 0.975000 (0.038188)
KNN: 0.958333 (0.041667)
CART: 0.950000 (0.040825)
NB: 0.950000 (0.055277)
SVM: 0.983333 (0.033333)
Hi Jason,
Thank you very much for such a detailed tutorial on Machine Learning. I really appreciate your effort to help beginners like me. I am looking forward to learning more about it.
Here are my results: –
LR: 0.941667 (0.065085)
LDA: 0.975000 (0.038188)
KNN: 0.958333 (0.041667)
CART: 0.950000 (0.040825)
NB: 0.950000 (0.055277)
SVM: 0.983333 (0.033333)
You are very welcome Sunita! We appreciate the feedback!
LR: 0.941667 (0.065085)
LDA: 0.975000 (0.038188)
KNN: 0.958333 (0.041667)
CART: 0.950000 (0.040825)
NB: 0.950000 (0.055277)
SVM: 0.983333 (0.033333)
Thanks for the walkthrough, I got stuck unnecessarily because my editor autocorrect the StratifiedKFold to StratifiedGroupKFold but that’s just a me problem
Thank you for your feedback Akili! Let us know if we can help with any questions as you continue to work through our tutorials!
How does this change if your data is not all in the same units or uses text? for example, i have a csv file, each row contains a description of an animal and in the column next to it i have the animal that the descriptions belong to. i want to be given new rows of descriptions and have the model predict what animal the description belongs to.
Hi JV…In general it seems you are interested in a model that performs multiclass classification:
https://machinelearningmastery.com/multi-class-classification-tutorial-keras-deep-learning-library/
I did enjoy this proect and I can easily follow on whats going on but there is a part where I do have to review the code a little more. Here are my results. I have a request, I would like to modified the project and put it on my github. I don’t own the code, so that is why I am asking. I am hoping this will help show my understanding of machine learning.
LR: 0.941667 (0.065085)
LDA: 0.975000 (0.038188)
KNN: 0.958333 (0.041667)
CART: 0.950000 (0.055277)
NB: 0.950000 (0.055277)
SVM: 0.983333 (0.033333)
Hi Casey…Sounds great! Let us know if we can help answer any questions.
LR : 99.17
LDA : 97.50
KNN : 98.33
CART : 97.50
GNB : 97.50
SVM : 98.33
Thank you for your feedback Abs! Keep up the great work!
Here, still learning. Thanks for share your knowledge
LR: 0.941667 (0.065085)
LDA: 0.975000 (0.038188)
KNN: 0.958333 (0.041667)
CART: 0.950000 (0.055277)
NB: 0.950000 (0.055277)
SVM: 0.983333 (0.033333)
You are very welcome Fran! Keep up the great work and let us know if you have any questions!
When I spot check Models I am getting now results.
Below Code gives no results.
# Spot Check Algorithms
models = []
models.append((‘LR’, LogisticRegression()))
models.append((‘LDA’, LinearDiscriminantAnalysis()))
models.append((‘KNN’, KNeighborsClassifier()))
models.append((‘CART’, DecisionTreeClassifier()))
models.append((‘NB’, GaussianNB()))
models.append((‘SVM’, SVC()))
# evaluate each model in turn
Hi…The issue you’re facing could be due to the use of “smart quotes” (
‘and’) around the model names instead of standard single quotes ('). Python does not recognize smart quotes, which might be causing the issue.Here is the corrected code:
python
# Spot Check Algorithms
models = []
models.append(('LR', LogisticRegression()))
models.append(('LDA', LinearDiscriminantAnalysis()))
models.append(('KNN', KNeighborsClassifier()))
models.append(('CART', DecisionTreeClassifier()))
models.append(('NB', GaussianNB()))
models.append(('SVM', SVC()))
# evaluate each model in turn
Make sure you’re also using the appropriate imports for these models. Here’s a full example including the imports and evaluation:
python# Import necessary libraries
from sklearn.model_selection import KFold, cross_val_score
from sklearn.linear_model import LogisticRegression
from sklearn.discriminant_analysis import LinearDiscriminantAnalysis
from sklearn.neighbors import KNeighborsClassifier
from sklearn.tree import DecisionTreeClassifier
from sklearn.naive_bayes import GaussianNB
from sklearn.svm import SVC
from sklearn.datasets import make_classification
# Generate some sample data
X, y = make_classification(n_samples=100, n_features=4, random_state=1)
# Spot Check Algorithms
models = []
models.append(('LR', LogisticRegression()))
models.append(('LDA', LinearDiscriminantAnalysis()))
models.append(('KNN', KNeighborsClassifier()))
models.append(('CART', DecisionTreeClassifier()))
models.append(('NB', GaussianNB()))
models.append(('SVM', SVC()))
# Evaluate each model
results = []
names = []
for name, model in models:
kfold = KFold(n_splits=10, random_state=1, shuffle=True)
cv_results = cross_val_score(model, X, y, cv=kfold, scoring='accuracy')
results.append(cv_results)
names.append(name)
print(f"{name}: {cv_results.mean():.3f} ({cv_results.std():.3f})")
This code will run a 10-fold cross-validation for each model and print out the mean accuracy and standard deviation for each.
Let me know if this helps or if you encounter any further issues!
I am still facing the same issue. No results.
array = data.values
X = array[:,0:4] # features first 4 row
y = array[: 4] # targets last column
X_train, X_validation, Y_train, Y_validation = train_test_split(X, y, test_size=0.20, random_state=1)
#You now have training data in the X_train and Y_train for preparing models
# and a X_validation and Y_validation sets that we can use later.
# ValueError: Found input variables with inconsistent numbers of samples: [150, 4]
hi jason can you tell me why I’m getting this ValueError?
Hi Rachit…The **ValueError** occurs because the number of samples in \( X \) (features) and \( y \) (targets) are inconsistent. Let me break this down step by step to explain what went wrong in your code and how to fix it.
### Problem in the Code
1. **Array slicing issue for
y**:python
y = array[: 4]
– This line is incorrect because you are trying to slice the first **4 rows** of the dataset for \( y \), instead of selecting the **last column**.
– As a result, \( y \) becomes an array of shape \((4, n)\), with only the first 4 rows of the dataset, rather than a 1D array (or 2D column) corresponding to the target column of the dataset.
2. **Mismatch in sample sizes**:
– \( X \) has 150 rows (assuming your dataset has 150 samples).
– \( y \) only has 4 rows due to incorrect slicing.
When you try to split the data into training and validation sets using
train_test_split, it raises an error because \( X \) and \( y \) must have the same number of rows (samples).—
### Correct Approach
You need to properly slice \( y \) to ensure it corresponds to the last column of the dataset. Here’s how you can fix it:
python# Assuming the target is the last column
X = array[:, 0:4] # Features: all rows, first 4 columns
y = array[:, 4] # Target: all rows, last column
# Perform train-test split
X_train, X_validation, Y_train, Y_validation = train_test_split(X, y, test_size=0.20, random_state=1)
### Explanation of Fixes
1. **Proper slicing for features (
X)**:– \( X \) includes all rows and the first 4 columns (features).
2. **Proper slicing for targets (
y)**:– \( y \) includes all rows and only the last column (target).
3. **Consistent sample sizes**:
– Now both \( X \) and \( y \) have the same number of rows (samples), which avoids the
ValueError.—
### Additional Notes
– Ensure that your dataset has the expected structure:
– \( X \) is typically a 2D array of shape \((n_{\text{samples}}, n_{\text{features}})\).
– \( y \) should be a 1D array (or 2D column vector) of shape \((n_{\text{samples}},)\) or \((n_{\text{samples}}, 1)\).
– If the target column is not the last one, adjust the slicing accordingly:
python

  y = array[:, column_index]  # Use the correct column index for the target
LR: 0.941667 (0.065085)
LDA: 0.975000 (0.038188)
KNN: 0.958333 (0.041667)
CART: 0.950000 (0.040825)
NB: 0.950000 (0.055277)
SVM: 0.983333 (0.033333)
LR: 0.941667 (0.065085)
LDA: 0.975000 (0.038188)
KNN: 0.958333 (0.041667)
CART: 0.950000 (0.055277)
NB: 0.950000 (0.055277)
SVM: 0.983333 (0.033333)
0.9666666666666667
[[11 0 0]
[ 0 12 1]
[ 0 0 6]]
precision recall f1-score support
Iris-setosa 1.00 1.00 1.00 11
Iris-versicolor 1.00 0.92 0.96 13
Iris-virginica 0.86 1.00 0.92 6
accuracy 0.97 30
macro avg 0.95 0.97 0.96 30
weighted avg 0.97 0.97 0.97 30
Thank you for your feedback!
Hi James,
I went through the tutorial.
What is the data provided for prediction and how to interpret the prediction.
Hi Srinivasan…This resource will get you started on actual projects! https://machinelearningmastery.com/7-machine-learning-projects-beginners/
Hello,
Matplotlib pyPlot depends on the Pyqt5 package so please make a note of this to the students.
solution: pip install PyQt5==5.15.10
Hi Jan…Thank you for your feedback!
I did it in Jupyter Notebook!
I was so worried about this jargoon term they call MACHINE LEARNING! Now I’m equipped with the right mindset to continue this process. I will save this page, because I’ll come back here when I have become.
Selection of the Best Model
LR: 0.941667 (0.065085)
LDA: 0.975000 (0.038188)
KNN: 0.958333 (0.041667)
CART: 0.958333 (0.041667)
NB: 0.950000 (0.055277)
SVM: 0.983333 (0.033333) > This is the best model with a 98.33% accuracy
Thank you Prof!
Thank you for the great news Isambe! Keep us posted on your progress!
I looked at the code as it was given by our honours lecture for applied data science module here in the University of South Africa (UNISA), wow man this has boosted my hopes of being competent and mastering data science because looking at the job prospects here in south africa I think i might end up doing data science as a side thing will holding on another Job,since its Job opportunities are hard to get into and am already 32 years
Hence I will do data science for passion and hope to contribute to the growth of the field and become its pioneer
Hi Jonathan…Thank you for your feedback and support!
Hello Jason, thank you for your detailed explanation. I got a deprecated function warning for the LogisticRegression function. The interpreter suggested I replace it with:
sklearn.multiclass.OneVsRestClassifier
“FutureWarning: ‘multi_class’ was deprecated in version 1.5 and will be removed in 1.7. Use OneVsRestClassifier(LogisticRegression(..)) instead. Leave it to its default value to avoid this warning.”
I did this by adding the following model definition:
“from sklearn.multiclass import OneVsRestClassifier”
and changing the LR model append to:
“models.append((‘LR’, OneVsRestClassifier(LogisticRegression(solver=’liblinear’))))”
Minor quibble with the boxplot, labels is being deprecated and changed to “tick_labels”.
“plt.boxplot(results,tick_labels=names)”
I used the Anaconda Navigator 2.7.0 and Spyder 3.13.9 for my development. Worked when Visual Studio 2026 wouldn’t compile the SciPy due to an incompatibility with intel OneAPI Fortran compiler.
My values:
LR: 0.941667 (0.065085)
LDA: 0.975000 (0.038188)
KNN: 0.958333 (0.041667)
CART: 0.941667 (0.053359)
NB: 0.950000 (0.055277)
SVM: 0.983333 (0.033333)
0.9666666666666667
[[11 0 0]
[ 0 12 1]
[ 0 0 6]]
precision recall f1-score support
Iris-setosa 1.00 1.00 1.00 11
Iris-versicolor 1.00 0.92 0.96 13
Iris-virginica 0.86 1.00 0.92 6
accuracy 0.97 30
macro avg 0.95 0.97 0.96 30
weighted avg 0.97 0.97 0.97 30