Correlation is a measure of the association between two variables.
It is easy to calculate and interpret when both variables have a well understood Gaussian distribution. When we do not know the distribution of the variables, we must use nonparametric rank correlation methods.
In this tutorial, you will discover rank correlation methods for quantifying the association between variables with a non-Gaussian distribution.
After completing this tutorial, you will know:
How rank correlation methods work and the methods are that are available.
How to calculate and interpret the Spearman’s rank correlation coefficient in Python.
How to calculate and interpret the Kendall’s rank correlation coefficient in Python.
Kick-start your project with my new book Statistics for Machine Learning, including step-by-step tutorials and the Python source code files for all examples.
Let’s get started.
Tutorial Overview
This tutorial is divided into 4 parts; they are:
Rank Correlation
Test Dataset
Spearman’s Rank Correlation
Kendall’s Rank Correlation
Rank Correlation
Correlation refers to the association between the observed values of two variables.
The variables may have a positive association, meaning that as the values for one variable increase, so do the values of the other variable. The association may also be negative, meaning that as the values of one variable increase, the values of the others decrease. Finally, the association may be neutral, meaning that the variables are not associated.
Correlation quantifies this association, often as a measure between the values -1 to 1 for perfectly negatively correlated and perfectly positively correlated. The calculated correlation is referred to as the “correlation coefficient.” This correlation coefficient can then be interpreted to describe the measures.
See the table below to help with interpretation the correlation coefficient.
Table of Correlation Coefficient Values and Their Interpretation Taken from “Nonparametric Statistics for Non-Statisticians: A Step-by-Step Approach”.
The correlation between two variables that each have a Gaussian distribution can be calculated using standard methods such as the Pearson’s correlation. This procedure cannot be used for data that does not have a Gaussian distribution. Instead, rank correlation methods must be used.
Rank correlation refers to methods that quantify the association between variables using the ordinal relationship between the values rather than the specific values. Ordinal data is data that has label values and has an order or rank relationship; for example: ‘low‘, ‘medium‘, and ‘high‘.
Rank correlation can be calculated for real-valued variables. This is done by first converting the values for each variable into rank data. This is where the values are ordered and assigned an integer rank value. Rank correlation coefficients can then be calculated in order to quantify the association between the two ranked variables.
Because no distribution for the values is assumed, rank correlation methods are referred to as distribution-free correlation or nonparametric correlation. Interestingly, rank correlation measures are often used as the basis for other statistical hypothesis tests, such as determining whether two samples were likely drawn from the same (or different) population distributions.
Rank correlation methods are often named after the researcher or researchers that developed the method. Four examples of rank correlation methods are as follows:
Spearman’s Rank Correlation.
Kendall’s Rank Correlation.
Goodman and Kruskal’s Rank Correlation.
Somers’ Rank Correlation.
In the following sections, we will take a closer look at two of the more common rank correlation methods: Spearman’s and Kendall’s.
Test Dataset
Before we demonstrate rank correlation methods, we must first define a test problem.
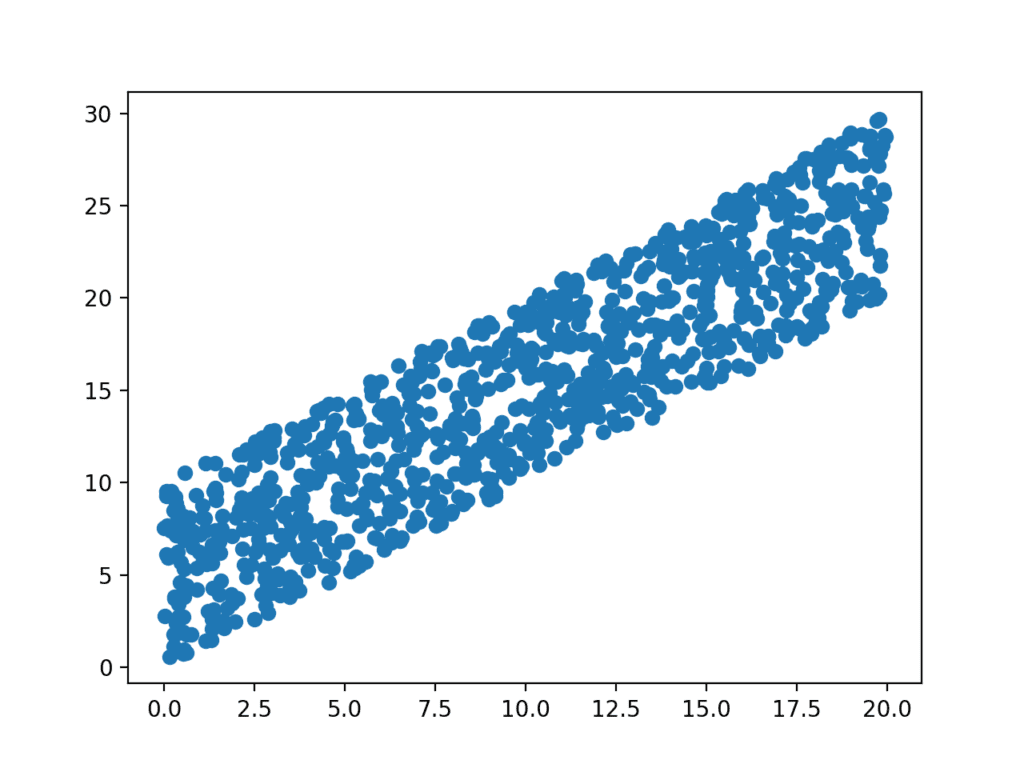
In this section, we will define a simple two-variable dataset where each variable is drawn from a uniform distribution (e.g. non-Gaussian) and the values of the second variable depend on the values of the first value.
Specifically, a sample of 1,000 random floating point values are drawn from a uniform distribution and scaled to the range 0 to 20. A second sample of 1,000 random floating point values are drawn from a uniform distribution between 0 and 10 and added to values in the first sample to create an association.
1
2
3
# prepare data
data1=rand(1000)*20
data2=data1+(rand(1000)*10)
The complete example is listed below.
1
2
3
4
5
6
7
8
9
10
11
12
# generate related variables
from numpy.random import rand
from numpy.random import seed
from matplotlib import pyplot
# seed random number generator
seed(1)
# prepare data
data1=rand(1000)*20
data2=data1+(rand(1000)*10)
# plot
pyplot.scatter(data1,data2)
pyplot.show()
Running the example generates the data sample and graphs the points on a scatter plot.
We can clearly see that each variable has a uniform distribution and the positive association between the variables is visible by the diagonal grouping of the points from the bottom left to the top right of the plot.
Scatter Plot of Associated Variables Drawn From a Uniform Distribution
It may also be called Spearman’s correlation coefficient and is denoted by the lowercase greek letter rho (p). As such, it may be referred to as Spearman’s rho.
This statistical method quantifies the degree to which ranked variables are associated by a monotonic function, meaning an increasing or decreasing relationship. As a statistical hypothesis test, the method assumes that the samples are uncorrelated (fail to reject H0).
The Spearman rank-order correlation is a statistical procedure that is designed to measure the relationship between two variables on an ordinal scale of measurement.
The intuition for the Spearman’s rank correlation is that it calculates a Pearson’s correlation (e.g. a parametric measure of correlation) using the rank values instead of the real values. Where the Pearson’s correlation is the calculation of the covariance (or expected difference of observations from the mean) between the two variables normalized by the variance or spread of both variables.
The function takes two real-valued samples as arguments and returns both the correlation coefficient in the range between -1 and 1 and the p-value for interpreting the significance of the coefficient.
1
2
# calculate spearman's correlation
coef,p=spearmanr(data1,data2)
We can demonstrate the Spearman’s rank correlation on the test dataset. We know that there is a strong association between the variables in the dataset and we would expect the Spearman’s test to find this association.
The complete example is listed below.
1
2
3
4
5
6
7
8
9
10
11
12
13
14
15
16
17
18
# calculate the spearman's correlation between two variables
print('Samples are uncorrelated (fail to reject H0) p=%.3f'%p)
else:
print('Samples are correlated (reject H0) p=%.3f'%p)
Running the example calculates the Spearman’s correlation coefficient between the two variables in the test dataset.
The statistical test reports a strong positive correlation with a value of 0.9. The p-value is close to zero, which means that the likelihood of observing the data given that the samples are uncorrelated is very unlikely (e.g. 95% confidence) and that we can reject the null hypothesis that the samples are uncorrelated.
1
2
Spearmans correlation coefficient: 0.900
Samples are correlated (reject H0) p=0.000
Need help with Statistics for Machine Learning?
Take my free 7-day email crash course now (with sample code).
Click to sign-up and also get a free PDF Ebook version of the course.
It is also called Kendall’s correlation coefficient, and the coefficient is often referred to by the lowercase Greek letter tau (t). In turn, the test may be called Kendall’s tau.
The intuition for the test is that it calculates a normalized score for the number of matching or concordant rankings between the two samples. As such, the test is also referred to as Kendall’s concordance test.
The Kendall’s rank correlation coefficient can be calculated in Python using the kendalltau() SciPy function. The test takes the two data samples as arguments and returns the correlation coefficient and the p-value. As a statistical hypothesis test, the method assumes (H0) that there is no association between the two samples.
1
2
# calculate kendall's correlation
coef,p=kendalltau(data1,data2)
We can demonstrate the calculation on the test dataset, where we do expect a significant positive association to be reported.
The complete example is listed below.
1
2
3
4
5
6
7
8
9
10
11
12
13
14
15
16
17
18
# calculate the kendall's correlation between two variables
print('Samples are uncorrelated (fail to reject H0) p=%.3f'%p)
else:
print('Samples are correlated (reject H0) p=%.3f'%p)
Running the example calculates the Kendall’s correlation coefficient as 0.7, which is highly correlated.
The p-value is close to zero (and printed as zero), as with the Spearman’s test, meaning that we can confidently reject the null hypothesis that the samples are uncorrelated.
1
2
Kendall correlation coefficient: 0.709
Samples are correlated (reject H0) p=0.000
Extensions
This section lists some ideas for extending the tutorial that you may wish to explore.
List three examples where calculating a nonparametric correlation coefficient might be useful during a machine learning project.
Update each example to calculate the correlation between uncorrelated data samples drawn from a non-Gaussian distribution.
Load a standard machine learning dataset and calculate the pairwise nonparametric correlation between all variables.
If you explore any of these extensions, I’d love to know.
Further Reading
This section provides more resources on the topic if you are looking to go deeper.
jason – i’ve cleaned, prepared, processed and normalized my dataset (for a regression problem) and am interested in moving on to more formal feature selection techniques, and plan on the following:
my question is if i want to run the pearson correlation as another point of reference, is it advisable to standardize the dataset after it’s been normalized? or is this even necessary? am i thinking too much?
as always, your helpful advice and quick response is greatly appreciated.
Hi Jason Brownlee.
Thank you for helping through this blog.
I have a dataset of 50-rows and 21-columns.
The 50 rows indicate observations, first 20 columns (let say f1,f2,..f20 ) belong features and the last column is a class (having only 0’s and 1’s).
Can I use this ranking correlation between feature (for instance f1) column and the class column to specify that feature is best for classification?
Thank you for the prompt response.
My intention is:
There are many existing features for binary classification ( in my domain work (signal)). If I produce a new feature, how can I show or prove that my new feature is best or not than the existing features.
I notice people using Pearson’s sample correlation rather haphazardly so I’ve been interested in clarifying it’s use. The wikipedia article claims that in a parametric setting (i.e. for bivariate normal) it has great properties — it’s the MLE, hence asymptotically consistent and efficient, and also asymptotically unbiased — but as long as the sample size is large it’s still asymptotically unbiased. Furthermore if the variables are iid it’s consistent.
I took your comment at the beginning of the article to mean that we need other estimators if we’re in a nonparametric setting. But assuming the content of the wiki article is accurate, it seems like Pearson’s sample correlation can still be a useful measure of association even in this setting. I’m somewhat new to this but iid seems like a relatively weak assumption (or at least, one that we’re often using it implicitly in practice) and our sample sizes are usually large enough. So we can get unbiasedness and consistency without any parametric assumptions.
Maybe these properties are sometimes aren’t good enough. Are there other issues with Pearson’s correlation that we should be aware of? The wikipedia article also indicated it’s an issue when the distributions are heavy-tailed. Can you please clarify?
Thanks very useful.. i found good correlation with spearman, now i am wondering how i fit a distribution(statistical) model to my data in python? Have you come across that? Thanks
Thanks Jason,, keep the good working! i have a data set where each data point (row) has four different attributes A,B,C and D. I tested all correlation mentioned here and i only found a positive relation between B and D. Would you help me by fitting distribution models to my data set, so i can re-sample from the distribution for simulation purposes. i would appreciate and acknowledge the help.
Thanks Jason,, just a quick question, i tried Gaussian kde from scipy package ref: https://docs.scipy.org/doc/scipy/reference/generated/scipy.stats.gaussian_kde.html,, but once i tried to resample using kernel.resample() ,, i got values not in my original data set(e.g., negative values), although all values in my original set are positives >= 0. How can i only resample values that within the range (min,max) of my original set. Thanks
Hi, jason brownlee.
The materials that you provide are excellent.
We know through your posts how to use them easily, even if you know something.
Thank you so much.
I have a small doubt in correlations.
if we have five groups of data, let say A1, A2, A3, A4, and A5
The correlation between A1 and A2 is C12
The correlation between A1 and A3 is C13
The correlation between A1 and A4 is C14
The correlation between A1 and A5 is C15
How to combine all these correlations (C12, C13, C14, and C15 ) values for conveying that A1 is highly correlated with other group elements.
You have explained the Spear man’s and Kendall’s Rank methods based on that data set that is normally distributed (that is parametric) but actually these two are used on Non Parametric (Non Gaussian Distributions) mostly rather than on Normally distributed data. am I right? Please correct me if i am wrong or miss anything. Because already we use Pearson’s Correlation Coefficient for Normally Distributed data.
Thanks a lot for your articles which are very helpful. I have a couple of questions about implementing Spearman’s correlation for feature selection. I have a data set with lots of non-Gaussian numeric variables and try to predict a numeric target. So I think Spearman is appropriate for this case. But do I need to somehow transform the numeric independent variables into ranking data before using Spearman? Or does Spearman algorithm internally take care of that? If the former, how do I transform the numeric data to rank data in Python?
Also, for non-Gaussian numeric independent variables, instead of using Spearman, do you think it’s appropriate if I apply log and scaling on the data and then use Pearson?


Hello Jason!
I’m starting to make some projects using machine learning and i have a doubt.
Can I use these ranking correlations to select atributes for a machine learning project?
What is the best for this use?
Thanks! Your blog is helping me a lot to get improved at the machine learning area!
Yes, try it.
There are many ways to select features for ML, try a few and go with the method that results in a model with the best performance.
There is no best, instead, there are many different methods to try for your problem.
Thank you!
Hi Jason!
i got really lots of information from your articales.
do you have examples or articles about reinforcement?
Not at this stage, perhaps in the future.
Hi Jason,
Your articles about machine learning and data Science is helping me improve on my data coding skills and data Science generally.
Many thanks
Yusuf
I’m glad to hear that.
Hey Jason,
Keep up the good work man.
I love ’em your blogs.
It helps me a lot.
Thanks,
Yaser
Thanks.
Hi Jason,
Your articles are very is helpful and written in lucid manner. Many thanks for sharing your knowledge.
Shirshendu Roy
Thanks.
jason – i’ve cleaned, prepared, processed and normalized my dataset (for a regression problem) and am interested in moving on to more formal feature selection techniques, and plan on the following:
w/o standardization:
– regular correlation matrix w/ VIF scores
– LASSO
– nonparametric rank correlation
my question is if i want to run the pearson correlation as another point of reference, is it advisable to standardize the dataset after it’s been normalized? or is this even necessary? am i thinking too much?
as always, your helpful advice and quick response is greatly appreciated.
i get different correlation value for spearsman in python and excel, whats the reason?
Perhaps differences in the implementation of the test?
Hi Jason Brownlee.
Thank you for helping through this blog.
I have a dataset of 50-rows and 21-columns.
The 50 rows indicate observations, first 20 columns (let say f1,f2,..f20 ) belong features and the last column is a class (having only 0’s and 1’s).
Can I use this ranking correlation between feature (for instance f1) column and the class column to specify that feature is best for classification?
If the input variables are categorical, you can use a chi-squared test to find input variables that are relevant to the output variable.
Generally, feature selection methods can give you an idea of what might be useful, but not the “best” features, I explain more here:
https://machinelearningmastery.com/faq/single-faq/what-feature-selection-method-should-i-use
Thank you for the prompt response.
My intention is:
There are many existing features for binary classification ( in my domain work (signal)). If I produce a new feature, how can I show or prove that my new feature is best or not than the existing features.
Fit a model with and without the new feature and compare the results of the models.
If the model built with the new feature outperforms the model built without the feature, then the feature adds value/skill.
Hi Jason,
Thanks for another helpful article.
I notice people using Pearson’s sample correlation rather haphazardly so I’ve been interested in clarifying it’s use. The wikipedia article claims that in a parametric setting (i.e. for bivariate normal) it has great properties — it’s the MLE, hence asymptotically consistent and efficient, and also asymptotically unbiased — but as long as the sample size is large it’s still asymptotically unbiased. Furthermore if the variables are iid it’s consistent.
I took your comment at the beginning of the article to mean that we need other estimators if we’re in a nonparametric setting. But assuming the content of the wiki article is accurate, it seems like Pearson’s sample correlation can still be a useful measure of association even in this setting. I’m somewhat new to this but iid seems like a relatively weak assumption (or at least, one that we’re often using it implicitly in practice) and our sample sizes are usually large enough. So we can get unbiasedness and consistency without any parametric assumptions.
Maybe these properties are sometimes aren’t good enough. Are there other issues with Pearson’s correlation that we should be aware of? The wikipedia article also indicated it’s an issue when the distributions are heavy-tailed. Can you please clarify?
Many thanks.
Yes, the distribution of one variable or the other is non-gaussian (completely or to some degree), then a weaker rank-based method can be used:
https://machinelearningmastery.com/how-to-calculate-nonparametric-rank-correlation-in-python/
Thanks for the speedy reply. That link is to this page, though.
Oops, read the comment, not the context. Sorry.
Statement stands though. Rank based methods is where we go once expectations of the parametric methods are broken.
No worries! Thanks for your time and attention.
Thanks very useful.. i found good correlation with spearman, now i am wondering how i fit a distribution(statistical) model to my data in python? Have you come across that? Thanks
Yes, if it is not a standard distribution, you can use density estimation methods like a mixture of Gaussians or kernel density.
I hope to have some posts on this topic soon.
Thanks Jason,, keep the good working! i have a data set where each data point (row) has four different attributes A,B,C and D. I tested all correlation mentioned here and i only found a positive relation between B and D. Would you help me by fitting distribution models to my data set, so i can re-sample from the distribution for simulation purposes. i would appreciate and acknowledge the help.
Perhaps explore using a kernel density estimator?
Thanks Jason,, just a quick question, i tried Gaussian kde from scipy package ref: https://docs.scipy.org/doc/scipy/reference/generated/scipy.stats.gaussian_kde.html,, but once i tried to resample using kernel.resample() ,, i got values not in my original data set(e.g., negative values), although all values in my original set are positives >= 0. How can i only resample values that within the range (min,max) of my original set. Thanks
Perhaps try the sklearn implementation, it is very easy to use:
https://scikit-learn.org/stable/modules/density.html
Hi, jason brownlee.
The materials that you provide are excellent.
We know through your posts how to use them easily, even if you know something.
Thank you so much.
I have a small doubt in correlations.
if we have five groups of data, let say A1, A2, A3, A4, and A5
The correlation between A1 and A2 is C12
The correlation between A1 and A3 is C13
The correlation between A1 and A4 is C14
The correlation between A1 and A5 is C15
How to combine all these correlations (C12, C13, C14, and C15 ) values for conveying that A1 is highly correlated with other group elements.
Thanks.
You can sum pair-wise correlations. The variable with the largest sum is most correlated.
Hi Jason,
Thanks a lot for the post. I have a dataset with a nominal variables unsupervised. Can I use these methods to my dataset.
Thanks a lot.
I believe so, perhaps try it?
Hi Jason,
You have explained the Spear man’s and Kendall’s Rank methods based on that data set that is normally distributed (that is parametric) but actually these two are used on Non Parametric (Non Gaussian Distributions) mostly rather than on Normally distributed data. am I right? Please correct me if i am wrong or miss anything. Because already we use Pearson’s Correlation Coefficient for Normally Distributed data.
Thanks
They are rank correlation methods for when data is not normal.
Hi Jason,
Thanks a lot for your articles which are very helpful. I have a couple of questions about implementing Spearman’s correlation for feature selection. I have a data set with lots of non-Gaussian numeric variables and try to predict a numeric target. So I think Spearman is appropriate for this case. But do I need to somehow transform the numeric independent variables into ranking data before using Spearman? Or does Spearman algorithm internally take care of that? If the former, how do I transform the numeric data to rank data in Python?
Also, for non-Gaussian numeric independent variables, instead of using Spearman, do you think it’s appropriate if I apply log and scaling on the data and then use Pearson?
Thanks!
Bach
This might be helpful instead for statistical methods for feature selection:
https://machinelearningmastery.com/feature-selection-with-real-and-categorical-data/