Classification predictive modeling typically involves predicting a class label.
Nevertheless, many machine learning algorithms are capable of predicting a probability or scoring of class membership, and this must be interpreted before it can be mapped to a crisp class label. This is achieved by using a threshold, such as 0.5, where all values equal or greater than the threshold are mapped to one class and all other values are mapped to another class.
For those classification problems that have a severe class imbalance, the default threshold can result in poor performance. As such, a simple and straightforward approach to improving the performance of a classifier that predicts probabilities on an imbalanced classification problem is to tune the threshold used to map probabilities to class labels.
In some cases, such as when using ROC Curves and Precision-Recall Curves, the best or optimal threshold for the classifier can be calculated directly. In other cases, it is possible to use a grid search to tune the threshold and locate the optimal value.
In this tutorial, you will discover how to tune the optimal threshold when converting probabilities to crisp class labels for imbalanced classification.
After completing this tutorial, you will know:
- The default threshold for interpreting probabilities to class labels is 0.5, and tuning this hyperparameter is called threshold moving.
- How to calculate the optimal threshold for the ROC Curve and Precision-Recall Curve directly.
- How to manually search threshold values for a chosen model and model evaluation metric.
Kick-start your project with my new book Imbalanced Classification with Python, including step-by-step tutorials and the Python source code files for all examples.
Let’s get started.
- Update Feb/2020: Fixed typo in Specificity equation.
- Update Jan/2021: Updated links for API documentation.

A Gentle Introduction to Threshold-Moving for Imbalanced Classification
Photo by Bruna cs, some rights reserved.
Tutorial Overview
This tutorial is divided into five parts; they are:
- Converting Probabilities to Class Labels
- Threshold-Moving for Imbalanced Classification
- Optimal Threshold for ROC Curve
- Optimal Threshold for Precision-Recall Curve
- Optimal Threshold Tuning
Converting Probabilities to Class Labels
Many machine learning algorithms are capable of predicting a probability or a scoring of class membership.
This is useful generally as it provides a measure of the certainty or uncertainty of a prediction. It also provides additional granularity over just predicting the class label that can be interpreted.
Some classification tasks require a crisp class label prediction. This means that even though a probability or scoring of class membership is predicted, it must be converted into a crisp class label.
The decision for converting a predicted probability or scoring into a class label is governed by a parameter referred to as the “decision threshold,” “discrimination threshold,” or simply the “threshold.” The default value for the threshold is 0.5 for normalized predicted probabilities or scores in the range between 0 or 1.
For example, on a binary classification problem with class labels 0 and 1, normalized predicted probabilities and a threshold of 0.5, then values less than the threshold of 0.5 are assigned to class 0 and values greater than or equal to 0.5 are assigned to class 1.
- Prediction < 0.5 = Class 0
- Prediction >= 0.5 = Class 1
The problem is that the default threshold may not represent an optimal interpretation of the predicted probabilities.
This might be the case for a number of reasons, such as:
- The predicted probabilities are not calibrated, e.g. those predicted by an SVM or decision tree.
- The metric used to train the model is different from the metric used to evaluate a final model.
- The class distribution is severely skewed.
- The cost of one type of misclassification is more important than another type of misclassification.
Worse still, some or all of these reasons may occur at the same time, such as the use of a neural network model with uncalibrated predicted probabilities on an imbalanced classification problem.
As such, there is often the need to change the default decision threshold when interpreting the predictions of a model.
… almost all classifiers generate positive or negative predictions by applying a threshold to a score. The choice of this threshold will have an impact in the trade-offs of positive and negative errors.
— Page 53, Learning from Imbalanced Data Sets, 2018.
Want to Get Started With Imbalance Classification?
Take my free 7-day email crash course now (with sample code).
Click to sign-up and also get a free PDF Ebook version of the course.
Threshold-Moving for Imbalanced Classification
There are many techniques that may be used to address an imbalanced classification problem, such as resampling the training dataset and developing customized version of machine learning algorithms.
Nevertheless, perhaps the simplest approach to handle a severe class imbalance is to change the decision threshold. Although simple and very effective, this technique is often overlooked by practitioners and research academics alike as was noted by Foster Provost in his 2000 article titled “Machine Learning from Imbalanced Data Sets.”
The bottom line is that when studying problems with imbalanced data, using the classifiers produced by standard machine learning algorithms without adjusting the output threshold may well be a critical mistake.
— Machine Learning from Imbalanced Data Sets 101, 2000.
There are many reasons to choose an alternative to the default decision threshold.
For example, you may use ROC curves to analyze the predicted probabilities of a model and ROC AUC scores to compare and select a model, although you require crisp class labels from your model. How do you choose the threshold on the ROC Curve that results in the best balance between the true positive rate and the false positive rate?
Alternately, you may use precision-recall curves to analyze the predicted probabilities of a model, precision-recall AUC to compare and select models, and require crisp class labels as predictions. How do you choose the threshold on the Precision-Recall Curve that results in the best balance between precision and recall?
You may use a probability-based metric to train, evaluate, and compare models like log loss (cross-entropy) but require crisp class labels to be predicted. How do you choose the optimal threshold from predicted probabilities more generally?
Finally, you may have different costs associated with false positive and false negative misclassification, a so-called cost matrix, but wish to use and evaluate cost-insensitive models and later evaluate their predictions use a cost-sensitive measure. How do you choose a threshold that finds the best trade-off for predictions using the cost matrix?
Popular way of training a cost-sensitive classifier without a known cost matrix is to put emphasis on modifying the classification outputs when predictions are being made on new data. This is usually done by setting a threshold on the positive class, below which the negative one is being predicted. The value of this threshold is optimized using a validation set and thus the cost matrix can be learned from training data.
— Page 67, Learning from Imbalanced Data Sets, 2018.
The answer to these questions is to search a range of threshold values in order to find the best threshold. In some cases, the optimal threshold can be calculated directly.
Tuning or shifting the decision threshold in order to accommodate the broader requirements of the classification problem is generally referred to as “threshold-moving,” “threshold-tuning,” or simply “thresholding.”
It has been stated that trying other methods, such as sampling, without trying by simply setting the threshold may be misleading. The threshold-moving method uses the original training set to train [a model] and then moves the decision threshold such that the minority class examples are easier to be predicted correctly.
— Pages 72, Imbalanced Learning: Foundations, Algorithms, and Applications, 2013.
The process involves first fitting the model on a training dataset and making predictions on a test dataset. The predictions are in the form of normalized probabilities or scores that are transformed into normalized probabilities. Different threshold values are then tried and the resulting crisp labels are evaluated using a chosen evaluation metric. The threshold that achieves the best evaluation metric is then adopted for the model when making predictions on new data in the future.
We can summarize this procedure below.
- 1. Fit Model on the Training Dataset.
- 2. Predict Probabilities on the Test Dataset.
- 3. For each threshold in Thresholds:
- 3a. Convert probabilities to Class Labels using the threshold.
- 3b. Evaluate Class Labels.
- 3c. If Score is Better than Best Score.
- 3ci. Adopt Threshold.
- 4. Use Adopted Threshold When Making Class Predictions on New Data.
Although simple, there are a few different approaches to implementing threshold-moving depending on your circumstance. We will take a look at some of the most common examples in the following sections.
Optimal Threshold for ROC Curve
A ROC curve is a diagnostic plot that evaluates a set of probability predictions made by a model on a test dataset.
A set of different thresholds are used to interpret the true positive rate and the false positive rate of the predictions on the positive (minority) class, and the scores are plotted in a line of increasing thresholds to create a curve.
The false-positive rate is plotted on the x-axis and the true positive rate is plotted on the y-axis and the plot is referred to as the Receiver Operating Characteristic curve, or ROC curve. A diagonal line on the plot from the bottom-left to top-right indicates the “curve” for a no-skill classifier (predicts the majority class in all cases), and a point in the top left of the plot indicates a model with perfect skill.
The curve is useful to understand the trade-off in the true-positive rate and false-positive rate for different thresholds. The area under the ROC Curve, so-called ROC AUC, provides a single number to summarize the performance of a model in terms of its ROC Curve with a value between 0.5 (no-skill) and 1.0 (perfect skill).
The ROC Curve is a useful diagnostic tool for understanding the trade-off for different thresholds and the ROC AUC provides a useful number for comparing models based on their general capabilities.
If crisp class labels are required from a model under such an analysis, then an optimal threshold is required. This would be a threshold on the curve that is closest to the top-left of the plot.
Thankfully, there are principled ways of locating this point.
First, let’s fit a model and calculate a ROC Curve.
We can use the make_classification() function to create a synthetic binary classification problem with 10,000 examples (rows), 99 percent of which belong to the majority class and 1 percent belong to the minority class.
|
1 2 3 4 |
... # generate dataset X, y = make_classification(n_samples=10000, n_features=2, n_redundant=0, n_clusters_per_class=1, weights=[0.99], flip_y=0, random_state=4) |
We can then split the dataset using the train_test_split() function and use half for the training set and half for the test set.
|
1 2 3 |
... # split into train/test sets trainX, testX, trainy, testy = train_test_split(X, y, test_size=0.5, random_state=2, stratify=y) |
We can then fit a LogisticRegression model and use it to make probability predictions on the test set and keep only the probability predictions for the minority class.
|
1 2 3 4 5 6 7 8 |
... # fit a model model = LogisticRegression(solver='lbfgs') model.fit(trainX, trainy) # predict probabilities lr_probs = model.predict_proba(testX) # keep probabilities for the positive outcome only lr_probs = lr_probs[:, 1] |
We can then use the roc_auc_score() function to calculate the true-positive rate and false-positive rate for the predictions using a set of thresholds that can then be used to create a ROC Curve plot.
|
1 2 3 |
... # calculate scores lr_auc = roc_auc_score(testy, lr_probs) |
We can tie this all together, defining the dataset, fitting the model, and creating the ROC Curve plot. The complete example is listed below.
|
1 2 3 4 5 6 7 8 9 10 11 12 13 14 15 16 17 18 19 20 21 22 23 24 25 26 27 28 29 |
# roc curve for logistic regression model from sklearn.datasets import make_classification from sklearn.linear_model import LogisticRegression from sklearn.model_selection import train_test_split from sklearn.metrics import roc_curve from matplotlib import pyplot # generate dataset X, y = make_classification(n_samples=10000, n_features=2, n_redundant=0, n_clusters_per_class=1, weights=[0.99], flip_y=0, random_state=4) # split into train/test sets trainX, testX, trainy, testy = train_test_split(X, y, test_size=0.5, random_state=2, stratify=y) # fit a model model = LogisticRegression(solver='lbfgs') model.fit(trainX, trainy) # predict probabilities yhat = model.predict_proba(testX) # keep probabilities for the positive outcome only yhat = yhat[:, 1] # calculate roc curves fpr, tpr, thresholds = roc_curve(testy, yhat) # plot the roc curve for the model pyplot.plot([0,1], [0,1], linestyle='--', label='No Skill') pyplot.plot(fpr, tpr, marker='.', label='Logistic') # axis labels pyplot.xlabel('False Positive Rate') pyplot.ylabel('True Positive Rate') pyplot.legend() # show the plot pyplot.show() |
Running the example fits a logistic regression model on the training dataset then evaluates it using a range of thresholds on the test set, creating the ROC Curve
We can see that there are a number of points or thresholds close to the top-left of the plot.
Which is the threshold that is optimal?
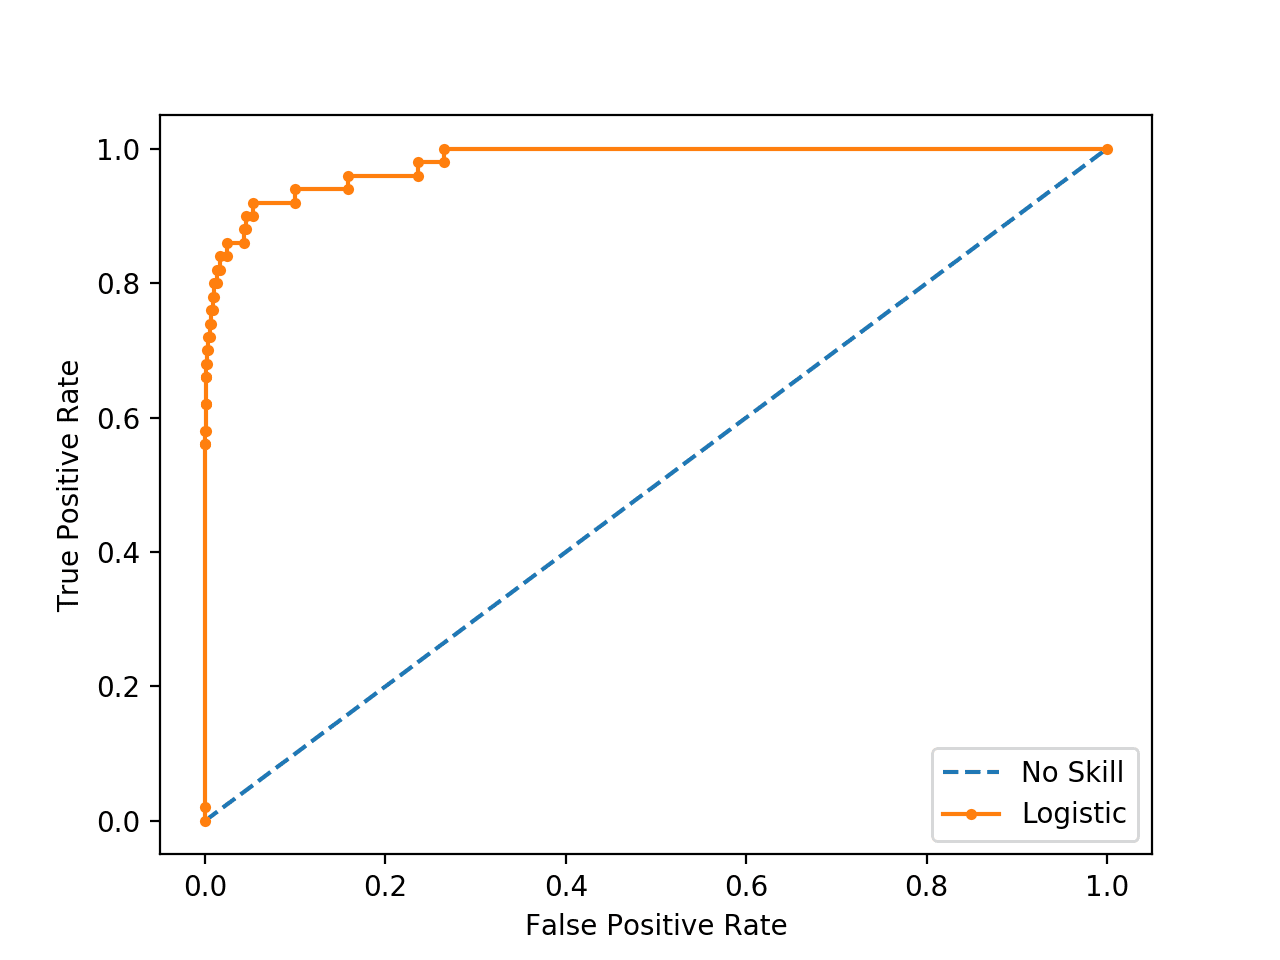
ROC Curve Line Plot for Logistic Regression Model for Imbalanced Classification
There are many ways we could locate the threshold with the optimal balance between false positive and true positive rates.
Firstly, the true positive rate is called the Sensitivity. The inverse of the false-positive rate is called the Specificity.
- Sensitivity = TruePositive / (TruePositive + FalseNegative)
- Specificity = TrueNegative / (FalsePositive + TrueNegative)
Where:
- Sensitivity = True Positive Rate
- Specificity = 1 – False Positive Rate
The Geometric Mean or G-Mean is a metric for imbalanced classification that, if optimized, will seek a balance between the sensitivity and the specificity.
- G-Mean = sqrt(Sensitivity * Specificity)
One approach would be to test the model with each threshold returned from the call roc_auc_score() and select the threshold with the largest G-Mean value.
Given that we have already calculated the Sensitivity (TPR) and the complement to the Specificity when we calculated the ROC Curve, we can calculate the G-Mean for each threshold directly.
|
1 2 3 |
... # calculate the g-mean for each threshold gmeans = sqrt(tpr * (1-fpr)) |
Once calculated, we can locate the index for the largest G-mean score and use that index to determine which threshold value to use.
|
1 2 3 4 |
... # locate the index of the largest g-mean ix = argmax(gmeans) print('Best Threshold=%f, G-Mean=%.3f' % (thresholds[ix], gmeans[ix])) |
We can also re-draw the ROC Curve and highlight this point.
The complete example is listed below.
|
1 2 3 4 5 6 7 8 9 10 11 12 13 14 15 16 17 18 19 20 21 22 23 24 25 26 27 28 29 30 31 32 33 34 35 36 37 |
# roc curve for logistic regression model with optimal threshold from numpy import sqrt from numpy import argmax from sklearn.datasets import make_classification from sklearn.linear_model import LogisticRegression from sklearn.model_selection import train_test_split from sklearn.metrics import roc_curve from matplotlib import pyplot # generate dataset X, y = make_classification(n_samples=10000, n_features=2, n_redundant=0, n_clusters_per_class=1, weights=[0.99], flip_y=0, random_state=4) # split into train/test sets trainX, testX, trainy, testy = train_test_split(X, y, test_size=0.5, random_state=2, stratify=y) # fit a model model = LogisticRegression(solver='lbfgs') model.fit(trainX, trainy) # predict probabilities yhat = model.predict_proba(testX) # keep probabilities for the positive outcome only yhat = yhat[:, 1] # calculate roc curves fpr, tpr, thresholds = roc_curve(testy, yhat) # calculate the g-mean for each threshold gmeans = sqrt(tpr * (1-fpr)) # locate the index of the largest g-mean ix = argmax(gmeans) print('Best Threshold=%f, G-Mean=%.3f' % (thresholds[ix], gmeans[ix])) # plot the roc curve for the model pyplot.plot([0,1], [0,1], linestyle='--', label='No Skill') pyplot.plot(fpr, tpr, marker='.', label='Logistic') pyplot.scatter(fpr[ix], tpr[ix], marker='o', color='black', label='Best') # axis labels pyplot.xlabel('False Positive Rate') pyplot.ylabel('True Positive Rate') pyplot.legend() # show the plot pyplot.show() |
Running the example first locates the optimal threshold and reports this threshold and the G-Mean score.
Note: Your results may vary given the stochastic nature of the algorithm or evaluation procedure, or differences in numerical precision. Consider running the example a few times and compare the average outcome.
In this case, we can see that the optimal threshold is about 0.016153.
|
1 |
Best Threshold=0.016153, G-Mean=0.933 |
The threshold is then used to locate the true and false positive rates, then this point is drawn on the ROC Curve.
We can see that the point for the optimal threshold is a large black dot and it appears to be closest to the top-left of the plot.
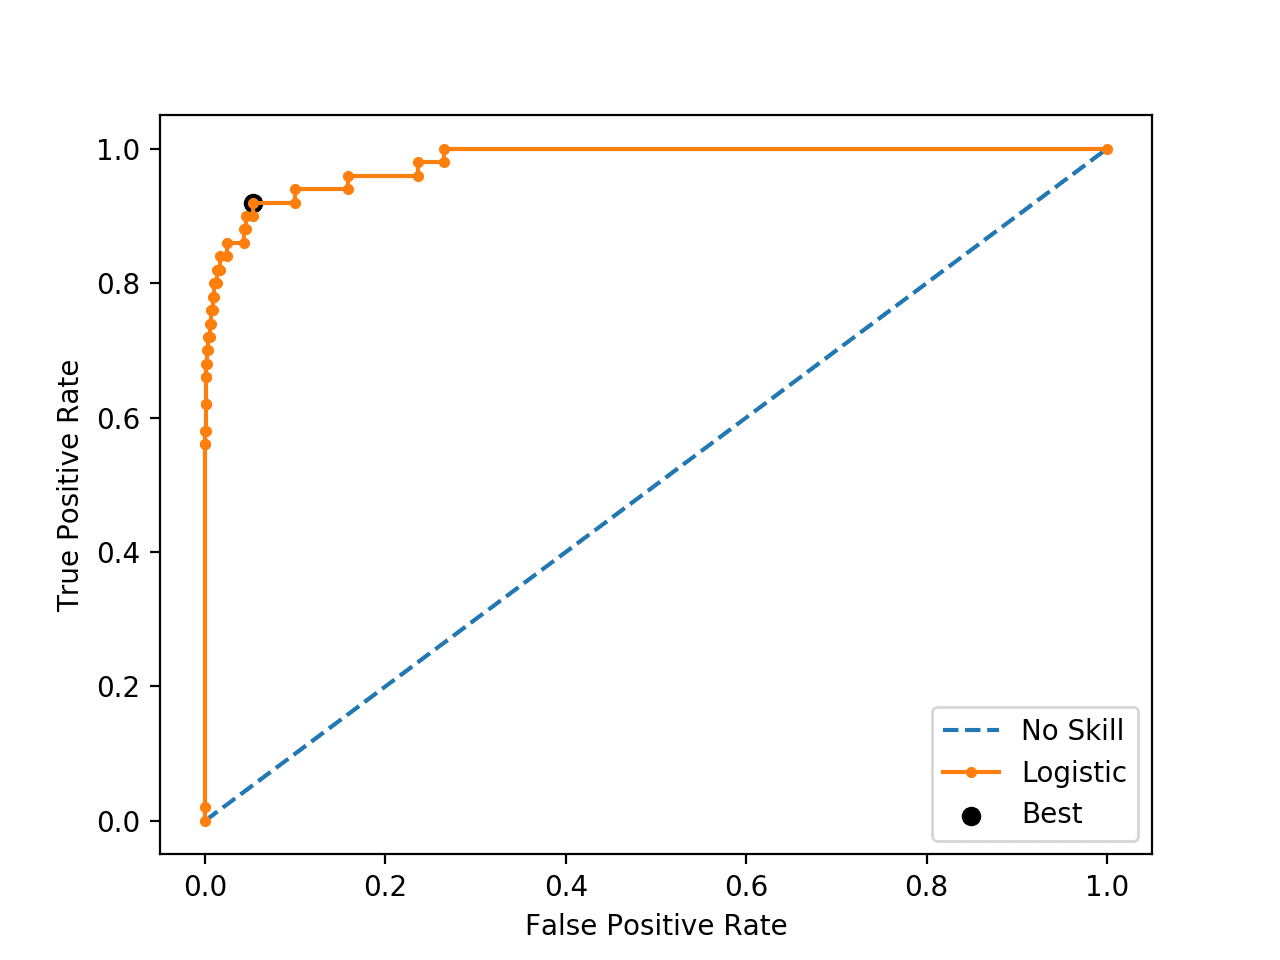
ROC Curve Line Plot for Logistic Regression Model for Imbalanced Classification With the Optimal Threshold
It turns out there is a much faster way to get the same result, called the Youden’s J statistic.
The statistic is calculated as:
- J = Sensitivity + Specificity – 1
Given that we have Sensitivity (TPR) and the complement of the specificity (FPR), we can calculate it as:
- J = Sensitivity + (1 – FalsePositiveRate) – 1
Which we can restate as:
- J = TruePositiveRate – FalsePositiveRate
We can then choose the threshold with the largest J statistic value. For example:
|
1 2 3 4 5 6 7 8 |
... # calculate roc curves fpr, tpr, thresholds = roc_curve(testy, yhat) # get the best threshold J = tpr - fpr ix = argmax(J) best_thresh = thresholds[ix] print('Best Threshold=%f' % (best_thresh)) |
Plugging this in, the complete example is listed below.
|
1 2 3 4 5 6 7 8 9 10 11 12 13 14 15 16 17 18 19 20 21 22 23 24 25 |
# roc curve for logistic regression model with optimal threshold from numpy import argmax from sklearn.datasets import make_classification from sklearn.linear_model import LogisticRegression from sklearn.model_selection import train_test_split from sklearn.metrics import roc_curve # generate dataset X, y = make_classification(n_samples=10000, n_features=2, n_redundant=0, n_clusters_per_class=1, weights=[0.99], flip_y=0, random_state=4) # split into train/test sets trainX, testX, trainy, testy = train_test_split(X, y, test_size=0.5, random_state=2, stratify=y) # fit a model model = LogisticRegression(solver='lbfgs') model.fit(trainX, trainy) # predict probabilities yhat = model.predict_proba(testX) # keep probabilities for the positive outcome only yhat = yhat[:, 1] # calculate roc curves fpr, tpr, thresholds = roc_curve(testy, yhat) # get the best threshold J = tpr - fpr ix = argmax(J) best_thresh = thresholds[ix] print('Best Threshold=%f' % (best_thresh)) |
We can see that this simpler approach calculates the optimal statistic directly.
|
1 |
Best Threshold=0.016153 |
Optimal Threshold for Precision-Recall Curve
Unlike the ROC Curve, a precision-recall curve focuses on the performance of a classifier on the positive (minority class) only.
Precision is the ratio of the number of true positives divided by the sum of the true positives and false positives. It describes how good a model is at predicting the positive class. Recall is calculated as the ratio of the number of true positives divided by the sum of the true positives and the false negatives. Recall is the same as sensitivity.
A precision-recall curve is calculated by creating crisp class labels for probability predictions across a set of thresholds and calculating the precision and recall for each threshold. A line plot is created for the thresholds in ascending order with recall on the x-axis and precision on the y-axis.
A no-skill model is represented by a horizontal line with a precision that is the ratio of positive examples in the dataset (e.g. TP / (TP + TN)), or 0.01 on our synthetic dataset. perfect skill classifier has full precision and recall with a dot in the top-right corner.
We can use the same model and dataset from the previous section and evaluate the probability predictions for a logistic regression model using a precision-recall curve. The precision_recall_curve() function can be used to calculate the curve, returning the precision and recall scores for each threshold as well as the thresholds used.
|
1 2 3 |
... # calculate pr-curve precision, recall, thresholds = precision_recall_curve(testy, yhat) |
Tying this together, the complete example of calculating a precision-recall curve for a logistic regression on an imbalanced classification problem is listed below.
|
1 2 3 4 5 6 7 8 9 10 11 12 13 14 15 16 17 18 19 20 21 22 23 24 25 26 27 28 29 30 |
# pr curve for logistic regression model from sklearn.datasets import make_classification from sklearn.linear_model import LogisticRegression from sklearn.model_selection import train_test_split from sklearn.metrics import precision_recall_curve from matplotlib import pyplot # generate dataset X, y = make_classification(n_samples=10000, n_features=2, n_redundant=0, n_clusters_per_class=1, weights=[0.99], flip_y=0, random_state=4) # split into train/test sets trainX, testX, trainy, testy = train_test_split(X, y, test_size=0.5, random_state=2, stratify=y) # fit a model model = LogisticRegression(solver='lbfgs') model.fit(trainX, trainy) # predict probabilities yhat = model.predict_proba(testX) # keep probabilities for the positive outcome only yhat = yhat[:, 1] # calculate pr-curve precision, recall, thresholds = precision_recall_curve(testy, yhat) # plot the roc curve for the model no_skill = len(testy[testy==1]) / len(testy) pyplot.plot([0,1], [no_skill,no_skill], linestyle='--', label='No Skill') pyplot.plot(recall, precision, marker='.', label='Logistic') # axis labels pyplot.xlabel('Recall') pyplot.ylabel('Precision') pyplot.legend() # show the plot pyplot.show() |
Running the example calculates the precision and recall for each threshold and creates a precision-recall plot showing that the model has some skill across a range of thresholds on this dataset.
If we required crisp class labels from this model, which threshold would achieve the best result?
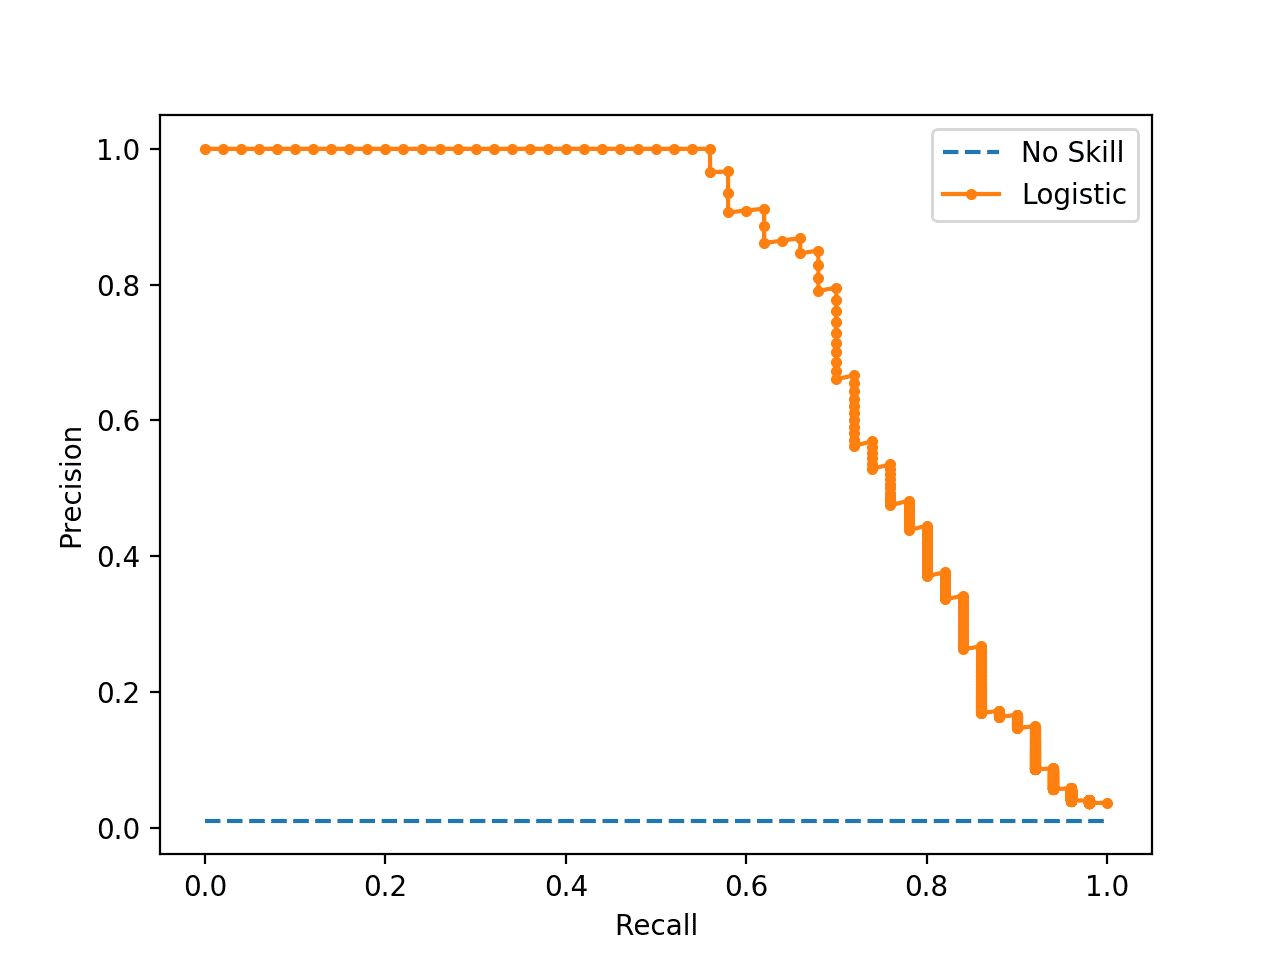
Precision-Recall Curve Line Plot for Logistic Regression Model for Imbalanced Classification
If we are interested in a threshold that results in the best balance of precision and recall, then this is the same as optimizing the F-measure that summarizes the harmonic mean of both measures.
- F-Measure = (2 * Precision * Recall) / (Precision + Recall)
As in the previous section, the naive approach to finding the optimal threshold would be to calculate the F-measure for each threshold. We can achieve the same effect by converting the precision and recall measures to F-measure directly; for example:
|
1 2 3 4 5 6 |
... # convert to f score fscore = (2 * precision * recall) / (precision + recall) # locate the index of the largest f score ix = argmax(fscore) print('Best Threshold=%f, F-Score=%.3f' % (thresholds[ix], fscore[ix])) |
We can then plot the point on the precision-recall curve.
The complete example is listed below.
|
1 2 3 4 5 6 7 8 9 10 11 12 13 14 15 16 17 18 19 20 21 22 23 24 25 26 27 28 29 30 31 32 33 34 35 36 37 |
# optimal threshold for precision-recall curve with logistic regression model from numpy import argmax from sklearn.datasets import make_classification from sklearn.linear_model import LogisticRegression from sklearn.model_selection import train_test_split from sklearn.metrics import precision_recall_curve from matplotlib import pyplot # generate dataset X, y = make_classification(n_samples=10000, n_features=2, n_redundant=0, n_clusters_per_class=1, weights=[0.99], flip_y=0, random_state=4) # split into train/test sets trainX, testX, trainy, testy = train_test_split(X, y, test_size=0.5, random_state=2, stratify=y) # fit a model model = LogisticRegression(solver='lbfgs') model.fit(trainX, trainy) # predict probabilities yhat = model.predict_proba(testX) # keep probabilities for the positive outcome only yhat = yhat[:, 1] # calculate roc curves precision, recall, thresholds = precision_recall_curve(testy, yhat) # convert to f score fscore = (2 * precision * recall) / (precision + recall) # locate the index of the largest f score ix = argmax(fscore) print('Best Threshold=%f, F-Score=%.3f' % (thresholds[ix], fscore[ix])) # plot the roc curve for the model no_skill = len(testy[testy==1]) / len(testy) pyplot.plot([0,1], [no_skill,no_skill], linestyle='--', label='No Skill') pyplot.plot(recall, precision, marker='.', label='Logistic') pyplot.scatter(recall[ix], precision[ix], marker='o', color='black', label='Best') # axis labels pyplot.xlabel('Recall') pyplot.ylabel('Precision') pyplot.legend() # show the plot pyplot.show() |
Running the example first calculates the F-measure for each threshold, then locates the score and threshold with the largest value.
Note: Your results may vary given the stochastic nature of the algorithm or evaluation procedure, or differences in numerical precision. Consider running the example a few times and compare the average outcome.
In this case, we can see that the best F-measure was 0.756 achieved with a threshold of about 0.25.
|
1 |
Best Threshold=0.256036, F-Score=0.756 |
The precision-recall curve is plotted, and this time the threshold with the optimal F-measure is plotted with a larger black dot.
This threshold could then be used when making probability predictions in the future that must be converted from probabilities to crisp class labels.
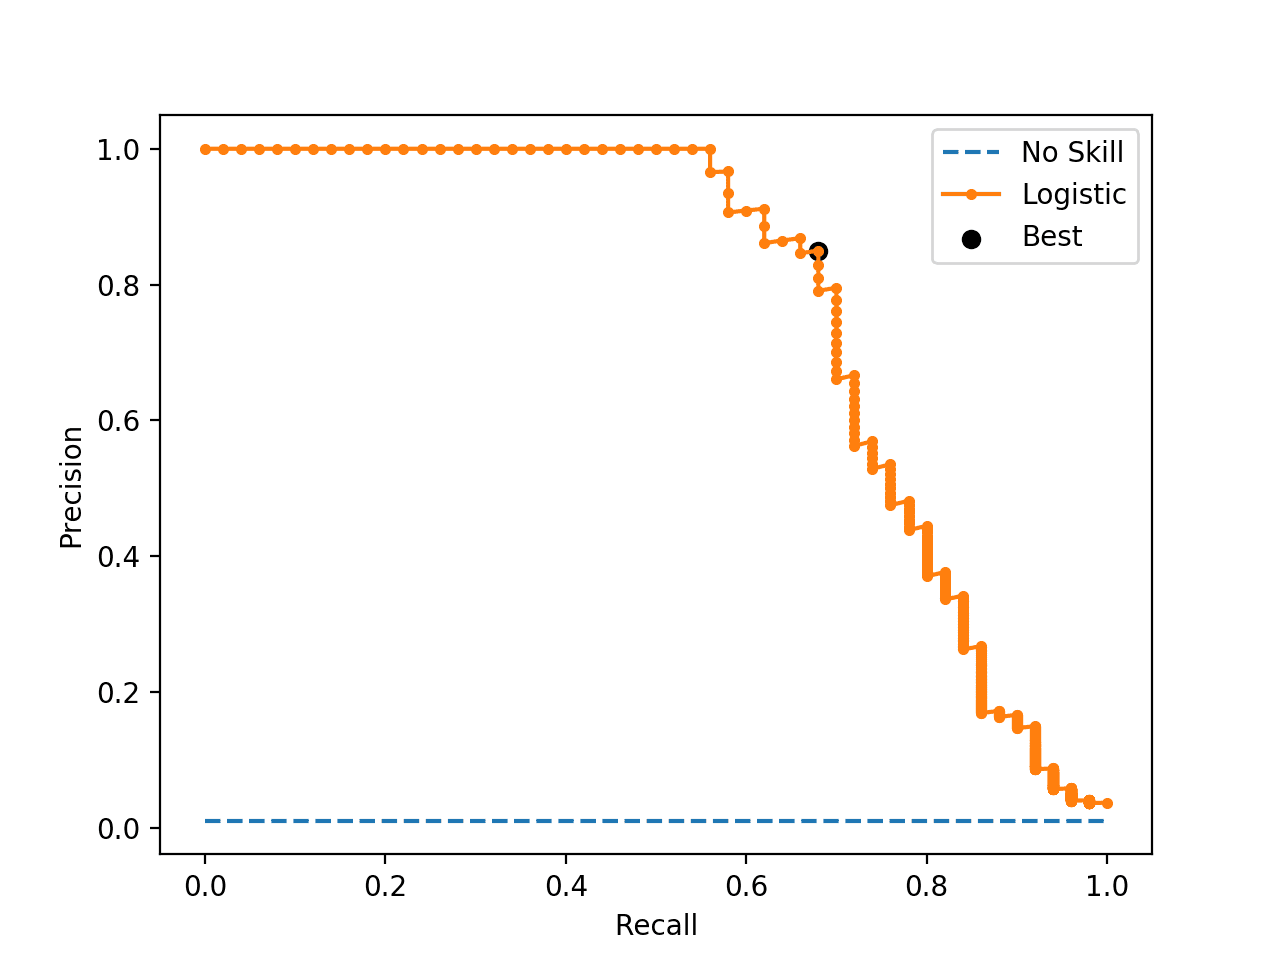
Precision-Recall Curve Line Plot for Logistic Regression Model With Optimal Threshold
Optimal Threshold Tuning
Sometimes, we simply have a model and we wish to know the best threshold directly.
In this case, we can define a set of thresholds and then evaluate predicted probabilities under each in order to find and select the optimal threshold.
We can demonstrate this with a worked example.
First, we can fit a logistic regression model on our synthetic classification problem, then predict class labels and evaluate them using the F-Measure, which is the harmonic mean of precision and recall.
This will use the default threshold of 0.5 when interpreting the probabilities predicted by the logistic regression model.
The complete example is listed below.
|
1 2 3 4 5 6 7 8 9 10 11 12 13 14 15 16 17 18 |
# logistic regression for imbalanced classification from sklearn.datasets import make_classification from sklearn.linear_model import LogisticRegression from sklearn.model_selection import train_test_split from sklearn.metrics import f1_score # generate dataset X, y = make_classification(n_samples=10000, n_features=2, n_redundant=0, n_clusters_per_class=1, weights=[0.99], flip_y=0, random_state=4) # split into train/test sets trainX, testX, trainy, testy = train_test_split(X, y, test_size=0.5, random_state=2, stratify=y) # fit a model model = LogisticRegression(solver='lbfgs') model.fit(trainX, trainy) # predict labels yhat = model.predict(testX) # evaluate the model score = f1_score(testy, yhat) print('F-Score: %.5f' % score) |
Note: Your results may vary given the stochastic nature of the algorithm or evaluation procedure, or differences in numerical precision. Consider running the example a few times and compare the average outcome.
Running the example, we can see that the model achieved an F-Measure of about 0.70 on the test dataset.
|
1 |
F-Score: 0.70130 |
Now we can use the same model on the same dataset and instead of predicting class labels directly, we can predict probabilities.
|
1 2 3 |
... # predict probabilities yhat = model.predict_proba(testX) |
We only require the probabilities for the positive class.
|
1 2 3 |
... # keep probabilities for the positive outcome only probs = yhat[:, 1] |
Next, we can then define a set of thresholds to evaluate the probabilities. In this case, we will test all thresholds between 0.0 and 1.0 with a step size of 0.001, that is, we will test 0.0, 0.001, 0.002, 0.003, and so on to 0.999.
|
1 2 3 |
... # define thresholds thresholds = arange(0, 1, 0.001) |
Next, we need a way of using a single threshold to interpret the predicted probabilities.
This can be achieved by mapping all values equal to or greater than the threshold to 1 and all values less than the threshold to 0. We will define a to_labels() function to do this that will take the probabilities and threshold as an argument and return an array of integers in {0, 1}.
|
1 2 3 |
# apply threshold to positive probabilities to create labels def to_labels(pos_probs, threshold): return (pos_probs >= threshold).astype('int') |
We can then call this function for each threshold and evaluate the resulting labels using the f1_score().
We can do this in a single line, as follows:
|
1 2 3 |
... # evaluate each threshold scores = [f1_score(testy, to_labels(probs, t)) for t in thresholds] |
We now have an array of scores that evaluate each threshold in our array of thresholds.
All we need to do now is locate the array index that has the largest score (best F-Measure) and we will have the optimal threshold and its evaluation.
|
1 2 3 4 |
... # get best threshold ix = argmax(scores) print('Threshold=%.3f, F-Score=%.5f' % (thresholds[ix], scores[ix])) |
Tying this all together, the complete example of tuning the threshold for the logistic regression model on the synthetic imbalanced classification dataset is listed below.
|
1 2 3 4 5 6 7 8 9 10 11 12 13 14 15 16 17 18 19 20 21 22 23 24 25 26 27 28 29 30 31 |
# search thresholds for imbalanced classification from numpy import arange from numpy import argmax from sklearn.datasets import make_classification from sklearn.linear_model import LogisticRegression from sklearn.model_selection import train_test_split from sklearn.metrics import f1_score # apply threshold to positive probabilities to create labels def to_labels(pos_probs, threshold): return (pos_probs >= threshold).astype('int') # generate dataset X, y = make_classification(n_samples=10000, n_features=2, n_redundant=0, n_clusters_per_class=1, weights=[0.99], flip_y=0, random_state=4) # split into train/test sets trainX, testX, trainy, testy = train_test_split(X, y, test_size=0.5, random_state=2, stratify=y) # fit a model model = LogisticRegression(solver='lbfgs') model.fit(trainX, trainy) # predict probabilities yhat = model.predict_proba(testX) # keep probabilities for the positive outcome only probs = yhat[:, 1] # define thresholds thresholds = arange(0, 1, 0.001) # evaluate each threshold scores = [f1_score(testy, to_labels(probs, t)) for t in thresholds] # get best threshold ix = argmax(scores) print('Threshold=%.3f, F-Score=%.5f' % (thresholds[ix], scores[ix])) |
Running the example reports the optimal threshold as 0.251 (compared to the default of 0.5) that achieves an F-Measure of about 0.75 (compared to 0.70).
Note: Your results may vary given the stochastic nature of the algorithm or evaluation procedure, or differences in numerical precision. Consider running the example a few times and compare the average outcome.
You can use this example as a template when tuning the threshold on your own problem, allowing you to substitute your own model, metric, and even resolution of thresholds that you want to evaluate.
|
1 |
Threshold=0.251, F-Score=0.75556 |
Further Reading
This section provides more resources on the topic if you are looking to go deeper.
Papers
- Machine Learning from Imbalanced Data Sets 101, 2000.
- Training Cost-sensitive Neural Networks With Methods Addressing The Class Imbalance Problem, 2005.
Books
- Learning from Imbalanced Data Sets, 2018.
- Imbalanced Learning: Foundations, Algorithms, and Applications, 2013.
APIs
- sklearn.metrics.roc_curve API.
- imblearn.metrics.geometric_mean_score API.
- sklearn.metrics.precision_recall_curve API.
Articles
- Discrimination Threshold, Yellowbrick.
- Youden’s J statistic, Wikipedia.
- Receiver operating characteristic, Wikipedia.
Summary
In this tutorial, you discovered how to tune the optimal threshold when converting probabilities to crisp class labels for imbalanced classification.
Specifically, you learned:
- The default threshold for interpreting probabilities to class labels is 0.5, and tuning this hyperparameter is called threshold moving.
- How to calculate the optimal threshold for the ROC Curve and Precision-Recall Curve directly.
- How to manually search threshold values for a chosen model and model evaluation metric.
Do you have any questions?
Ask your questions in the comments below and I will do my best to answer.
Get a Handle on Imbalanced Classification!
Develop Imbalanced Learning Models in Minutes
...with just a few lines of python code
Discover how in my new Ebook:
Imbalanced Classification with Python
It provides self-study tutorials and end-to-end projects on:
Performance Metrics, Undersampling Methods, SMOTE, Threshold Moving, Probability Calibration, Cost-Sensitive Algorithms
and much more...


Hi Jason,
Great article. I just wanted to ask if threshold moving is considered an alternative to other methods of dealing with class imbalances like resampling (i.e. SMOTE), or if threshold moving is supposed to be used in a complimentary manner with other imbalanced learning techniques?
Thanks!
It can be used in conjunction with other methods, to ensure that the best mapping of probabilities to class labels for your chosen metric is achieved.
Great article. How do we best deal with multi class or multinomial instead of binary classification in terms of threshold timing?
Great question. I don’t have an example – sounds like a great suggestion for a future tutorial.
you can explore a OneVsRest classifier which creates separate binary classifiers for each class.
Yes, this will help:
https://machinelearningmastery.com/one-vs-rest-and-one-vs-one-for-multi-class-classification/
Great article as always Jason. Can u address in a future tutorial techniques to find a window of rejection in binary classifiers? Ex: instead of having only 1 threshold the classifier would have 2 thresholds (lower and upper) and would ignore the predictions that fall in that middle region.
Great suggestion, thanks!
I have the same idea with you .Have you realized it?
Hi there. Thanks for the very helpful article.How would i tune to the threshold for a multiclass classification problem?
Hello Jason,
I’ve read about PyTorch.
What are major differences among scikit learn Keras and PyTorch?
How difficult is to write code in comparison with scikit learn?
Does (up to you) it worth to take a look at?
Do you have any example?
Thanks
sklearn is for machine learing.
tensorflow and pytorch are for deep learning
Keras runs on top of tensorflow, and is also now integrated into tensorflow.
sklearn is easy, keras is easy, pytorch is hard.
Fantastic article, very helpful!
I always get confused with specificity. You say it’s:
Specificity = FalseNegative / (FalsePositive + TrueNegative)
and the Wikipedia says:
Specificity = TrueNegative / (FalsePositive + TrueNegative)
Which one is correct?
Thanks
Thanks!
Looks like a typo, fixed.
Hi Jason,
Great article, I have been following this blog since long.
I on a project right now, done everything, got a perfect threshold, using that new set of predictions that balances my Precision and Recall score pretty well.
But I am not able to get an idea about now how to use this threshold to make predictions on the new data. I used a RandomForestClassifier that has been fitted on my training data. To get predictions on new data now i simply have to use **classifier.predict(X_test)** , where does new threshold comes into play now??
I know i probably be might not looking into something, please guide me on how to use it on test data.
Many Thanks
Pranay 🙂
Thanks!
Good question. Select a threshold, predict probabilities, convert the probabilities to classes using your threshold.
Hi, just want to make sure I understand correctly –
So, when we have built a model with an optimum threshold, then we use the model to predict new data, then we get the probabilities, then we use the optimum threshold from previous to convert these new probabilities to classes?
Correct.
It is only useful in adopting if the new threshold the skill of the model according to your chosen metric.
Thanks for the clarification! Appreciate it.
You’re welcome.
Exactly what I was looking for, great article Jason.
Thanks, I’m happy to hear that!
Very nice article Jason. When trying to get maximum threshold to maximize F1 score, I am getting NaN in max F-score. Is this OK ? or there is a problem with my data or model ?
No. Check for a problem with your data or model.
Hey, I am also getting NaN in max F-Score with LightGBM algorithm. How did you resolve your issue?
My data is ok since it works with other models.
Hi Jason, thanks for this post!
I’m working on a xgboost binary classification model on an imbalanced dataset. I’m done with model training and precision, recall all look good. Since it’s xgboost and imbalanced, the thresholds needs to be carefully selected. My questions are:
1. should I use training data or validation data to determine the optimal threshold?
2. I also tried probability calibration and calibration was done on validation data. Should I use raw output from predict_proba or the calibrated probability when selecting the optimal threshold?
Thanks a lot!
Well done!
Validation data.
Perhaps compare the threshold on the raw vs calibrated on a hold out dataset.
Gotcha, if I do probability calibration, should I build a calibration model using validation data first, then pick the best threshold using calibrated probabilities on the same validation data again?
Thanks!
Calibrate, then threshold to get labels.
Hi Jason,
In terms of which metric to use when picking thresholds, do you have a preference between precision and false positive rate? Which one do you think is more appropriate when working with an extremely imbalanced dataset? Is FPR more stable and precision very likely to be affected by new behaviors?
Thanks!
Hello
What does it mean by ‘ probability calibration’ in the modelling here?
See this on calibration:
https://machinelearningmastery.com/calibrated-classification-model-in-scikit-learn/
Thank you!
You’re welcome.
Hi Sir,
I am working on Ant colony optimization algorithm. I am facing problem to draw the ROC auc curve in that. Can you guide me how I can draw the ROC curve in that.
Yes, this tutorial shows how to plot a ROC curve:
https://machinelearningmastery.com/roc-curves-and-precision-recall-curves-for-classification-in-python/
hi Jason,
Same thing i tried with multi class classification , its not working while printing roc_curve and fpr and tpr resutls ,
getting this error : multiclass format is not supported
please suggest same thing i want to do for multi class problem
thanks in advance .
ROC curve is for binary classification only.
In a multinomial logit regression if you assume each outcome is 0/1 (probability of eating a banana, probability of watching tv…) then you can create several ROC curves, or choose to run several regressions. you can also assume the probability of each outcome as apposed to the sum of the others (benchmark). If the interest is to choose a combination of classes not binary then it might be better to apply a different model (for ex collaborative filtering) following the fact that roc wont be relevant as you explained.
Thanks for the great article, Jason! Do you have any posts explaining how to choose between these different threshold-moving methods and how the different cost of a false positive vs false negative can be incorporated?
No. First you choose a metric, then you tune the threshold to optimize that metric.
Also, the Optimal Threshold Tuning and the one based on Precision-Recall curve are essentially the same approach, but we get a slightly different threshold and f1 score because we’re using more points to calculate f1 score in Optimal Threshold. Is my understanding correct?
Same general approach, the difference is the metric being optimized – e.g. the key to understanding why we want to move thresholds.
Looks like this is done with a train_test_split method.
Do you have a suggestion or example to do it with a stratified cross validation, to optimize precision recall?
No, a threshold is found with a single hold out dataset.
Instead, you could use cross validation to estimate the performance of the modeling pipeline with threshold moving, but not to find a specific threshold value to use for a final model.
Hi Jason. Could you please elaborate more on this?
When we have CV cant we acerage G-mean ir F-measure from all folds and get threshold with best mean value? Could you give me an approach to do threshold tuning using also CV?
In my case, I average my metric from all folds and then sort by mean and std. At the end I get the threshold with max mean f1 and min std f1.
Any other better idea?
You can use cross-validation to estimate the performance of a model and report the mean f1 or gmean.
This is separate from threshold moving. You can can change how predicted probabilities are mapped to crisp class labels for evaluation by f1 and gmean by threshold moving and the threshold moving process could occur within cv.
Hi Jason,
Follow up question on this. I tried threshold moving within cv but get vastly different thresholds for each fold. Averaging the thresholds do not seem like a good choice. My dataset is imbalanced and I have to do stratified group k fold since there are groups present in the data. How do I use the threshold that I find in each fold?
Hi Gopi…The following resource may be of interest:
https://machinelearningmastery.com/probability-calibration-for-imbalanced-classification/
Hello Jason,
How to draw ROC curve for imbalanced multiclass classifier.Found some notes regarding Micro and Macro averaging,but couldn’t get correct idea about ROC curve.For eg.,in 4 classes of samples ,whether it should have to consider all positive and negative classes for each classes together or separately.lf any article regarding this in detail.(I’m working on matalab platform)
ROC curves are for binary classification.
Hi Jason,
do you have any reference for thresholding in the multiclass case?
Sorry I do not.
Thanks Jason for the great article !
How we select the optimal threshold in case of one-class classification (i.e. we only have samples from one class) ?
Not sure you can, sorry.
Hi Jason,
What is exactly the formula of the predict_proba here?
yhat = model.predict_proba(testX)
Is it taking the softmax function of logit scores from each class? i.e. converting numbers to probabilities?
It is a logistic regression model that predicts probabilities natively:
https://machinelearningmastery.com/logistic-regression-tutorial-for-machine-learning/
Thank you!
You’re welcome.
I ask few questions recently in various blogs on different topics here, however I did not get any notification if there was a reply. Should I expect any notification to my inbox or not?
No, the website does not notify you of a reply.
Hi Jason, thanks for the great article, I have two questions: 1. what is the difference between threshold tuning and Isotonic regression, could they be used at the same time or they are designed for different questions? 2. I tried the threshold tuning with my classifier, auc = 0.84, the best threshold with gmean is 0.0008 and the best threshold with P-R curve is 0.99885, is there anything wrong with my model ? any hint for this ? Thank you !
Threshold tuning is about mapping probabilities to labels.
Calibration is about changing the distribution of probabilities.
Compare model performance to a naive method to see if it has skill:
https://machinelearningmastery.com/naive-classifiers-imbalanced-classification-metrics/
Hi Jason, thanks for this post. I
was wondering if you could help me figure out what I need to in this case:
I have a 4-class classification problem that needs a high true positive and true negative rate across all classes.
The data is very imbalanced (65:30:3:2).
I have trained an XGBoost model that gives me a 85-80-65-60 true positive rate.
However, I don’t know how to tweak this to get well-calibrated probabilities. So far I have nested a CalibratedClassifierCV() on a OneVsRestClassifier(), but not sure if that’s the right way to go about it…
Can you please suggest a path?
You’re welcome.
Perhaps start with a metric that best captures the goal of your project:
https://machinelearningmastery.com/tour-of-evaluation-metrics-for-imbalanced-classification/
Then perhaps the methods in this framework will help you improve results:
https://machinelearningmastery.com/framework-for-imbalanced-classification-projects/
Hi Jason, thanks for this post.
I was wondering if you could help me figure out what I need to do in a case-
The goal is to increase the precision with some trade-off with recall.
Now, if I change the threshold to meet my desired goal.
Will this model perform as desired in the real-time production data after deployment?
Or will this generate some randomness and the model performance will be reduced?
Also if randomness is introduced, Is there any way to handle it?
Thanks in advance
Hi Jason,
Nice article. What is it that’s “optimal” about the G-mean? What is it that’s “optimal” about the F-measure? Since they don’t generally give the same result, how would you decide which one of them to optimize? Wouldn’t the real optimum depend on the relative costs of false negatives vs false positives?
For a chosen metric (like gmean or fmeasure), a fit model, and some hold out data, we can find the best (optimal) threshold – e.g. a threshold that maximizes or minmizes a chosen metric.
My point is, by what real-world criteria would you choose *which* metric to optimize, among the G-Mean, F-measure, or a potentially-unlimited number of other possible metrics? You can’t ask your client / business stakeholders because the question is not in terms they can conceptualize in relation to their business objectives.
Wouldn’t it be better to either (1) assign explicit costs to false positives and false negatives and calculate the unique optimal threshold resulting from those; or otherwise (2) to explore the tradeoff between Precision vs. Recall (Or True or False Positive Rate vs True or False Negative Rate) until you find a balance that is deemed most appropriate by the business stakeholders or your client according to their business objectives?
For example, I demonstrate how to do (2) above by plotting and exploring the False Positive Rate and False Negative Rate against a threshold axis showing a continuous range of possible thresholds in my article “How To Deal With Imbalanced Classification, Without Re-balancing the Data: …Before considering oversampling your skewed data, try adjusting your classification threshold (simple python code shown)” ( https://towardsdatascience.com/how-to-deal-with-imbalanced-classification-without-re-balancing-the-data-8a3c02353fe3?sk=28387a3cff54ef9ac496611846a46e10 )
I disagree. Perhaps even strongly.
I can’t give specific advice, but generally we can learn client preferences (for a metric) indirectly with them using a number of methods such as working through scenarios, talking about expectations, worst case analysis, and comparing across different candidate metrics. You can interpret their responses and select a metric with fully supported justification in any report.
This might be the most important part of the project – e.g. a primary requirement – how success is determined.
You can go middle of the road with f1 or roc auc, but who knows if that it is appropriate. It might be terribly inappropriate based on the business/scenario.
Thanks for your response. Let me put it this way. Depending on the relative business impact or cost of false negatives vs false positives, *any* threshold could be turn out to be the optimal one for your client. Not just the one threshold that optimizes the G-mean, or the one that optimizes the F-measure, or something similar to that.
So I’m suggesting that the better approach is to explore the full continuous range of thresholds and look at how this impacts the trade-off balance between false positives and false negatives, either by looking at the Precision and Recall as a function of threshold, if those metrics are most meaningful to the client, or else something like the False Positive Rate and False Negative Rate (or something similar from the ROC curve or the variant of it that I describe in my article linked above, which emphasizes the continuous threshold on one axis) as a function of the threshold.
Yes, that can be an interesting diagnostic to learn more about your model and domain.
Nevertheless, model performance will be distilled to a single metric – a single value to be optimized.
Okay, but any threshold t that you choose *is* the optimal threshold for a particular single metric. That is the cost metric: f(t) = t*FalsePositives + (1-t)*FalseNegatives (or any arbitrary constant multiplied by that metric). So again *any* threshold could be optimal, depending on the relative cost of False Positives (i.e. t) vs cost of False Negatives (i.e. 1-t). For example, choosing a high value of t (so that most instances are classified as the negative class) corresponds to the cost of FP being much greater than that of FN so we will seldom risk choosing the positive class.
But any such chosen threshold t does not necessarily optimize other metrics such as the G-mean or the F-measure, so we needn’t limit ourselves to only those thresholds that optimize any discrete set of such other metrics that we can think of.
Agreed, choosing a threshold that optimizes one metric comes at the expense of not optimizing another metric.
This is why I strongly recommend my readers to select one metric that best captures the project goals and focus on optimizing that. It makes life so much simpler.
Okay, that’s good, but I still don’t see what specific type of information about project goals would lead someone to choose to optimize something like the G-mean or the F-measure.
I *do* see what kind of information about project goals would lead you to choose a threshold t according to either the relative cost of false positives and false negatives, or by exploring the entire continuous range of thresholds to see which one gives the most acceptable (to the client) trade-off between Precision and Recall, or between False Positive Rate and False Negative Rate for example.
The client can understand false positives, false negatives, precision, recall, false negative rate, false positive rate, etc., but if you tell the client that one particular threshold optimizes the G-mean and another one optimizes the F-measure, I don’t see how the client could relate the choice between those two metrics to business goals, and anyway it’s unlikely that either of those 2 specific thresholds happens to provide the client’s optimal trade-off between false positives and false negatives.
See the flow chart diagram in this post to relate project goals (what’s important about predictions) to metrics:
https://machinelearningmastery.com/tour-of-evaluation-metrics-for-imbalanced-classification/
If your client is not technically sophisticated (most clients), you may need to gather their requirements, interpret them, map them to a metric, then in reverse map the metric back to the vocab of the client.
None of this should be surprising, it’s much as the same as old fashioned consulting work – if you come from that background (which it sounds like you might).
Great article, Jason!
I have a question that bothers me for a while. In your demonstration, you determine the threshold value after you get the probability by fitting the model with the testing set. Some people suggest should get the threshold value when building a cross-validation model with training set. not sure how to do this, but I would appreciate if you can share your opinion about it.
Yes, ideally you would want to include threshold finding within the cv fold or perform the operation on a hold out/validation dataset.
Thanks for this article. Is it possible to fine tune hyperparameters for your model(Random Forest e.g max depth, n_estimator and other) and at same time find the best threshold for your binary classifier using predict_prob for prbabilities?
Eg RF=RanndForestClassifier(nestimator). Now after finding the hyperparameter can you still go ahead to find best threshold? Or once you find the best threshold there is no need to use or tune hyperparameter for the algorithm. Thanks
Yes, you would have to make threshold moving part of your model or modeling pipeline. I expect you’d need to run the grid search manually to give you the space to run custom code to all of the required steps.
Yes, alternately, you could grid search first then threshold move as a final step. Results may not be as good.
Love your articles! If the optimal threshold is found using the test set, it’s possible the test set performance will look much better than training performance. Does it make sense to go back and evaluate the the metrics from the training set with the new optimal threshold?
Thanks!
Ideally you would use a large hold out validation dataset to find the threshold.
Hello Jason,
Thanks for an amazing article and an amazing content further. Just wanted to check that if the data is imbalanced and the intent of the model is to predict only one of the classes better, i.e. I am currently not having an issue to if my 1s are getting classified as 0s as my prime intent is to predict 0s. Can I go ahead and have a higher threshold value?
Also one of the intent of the model is that data eventually gets further imbalanced.
Let me know if I was able to explain the issue and if this makes sense
Perhaps.
Choose one metric and optimize it, compare results to a naive model.
Hello Jason,
Thanks for a clear explanation. I have a question for you.
1). I am facing another level of complexity while trying to find the right threshold. Since there are other parameters that can tuned for a logistic regression model, I am running a grid search then finding those parameters that maximize a certain scorer. Now with the optimal model in hand I generate the ROC curve and pick the optimal threshold, will a threshold so obtained be the BEST threshold compared to all the models ( models run with different sets of hyper parameters).
2) Instead of using the to-labels() function, is there any inbuilt sklearn function that can get me the optimal threshold point ? If not I wonder why they don’t have it.
Thank you,
Karthik
You could perform the threshold moving as part of the modeling pipeline and tune/select it like any other hyperparameter.
The optimal threshold depends on your choice of metric, as described above.
Thank you!
You’re welcome.
Thanks Jason .
For imbalanced class data set that I am working on , I did try threshold moving and predicting classes based on the best f1 score, as shown in the post above. It did improve the true positives marginally but helped in curtailing false positives and max f1 score I achieved is 0.5, which isn’t great.
So what would be my next steps ? Work on features ? Cost sensitive classification ? I did try balancing the train data sets with API’s in imblearn , but that didn’t help .
Thanks !
Try some of the techniques listed here:
https://machinelearningmastery.com/framework-for-imbalanced-classification-projects/
Hi Jason .
I have a clarification on the technique.
I have a cost function for mis- classification of imbalanced data . So based on a range of thresholds , I am searching for that threshold that gives the least cost.
The procedure is : hyper parameter tuning with kfold cross validation on train data —> select the best model —-> predict probabilities for test data —-> get the best threshold that gives the least cost.
If I save this model and run it across various sets of test data , the best threshold will also vary , right ? Is that fine ?
Sounds like a good starting point.
Thanks Jason.
Thanks a lot Jason!
How do we use adopted threshold when making predictions ?
See the to_labels() function in the last section for exactly this.
He dude, thanks for the tutorial. It really helps me a lot. But I have trouble here. When I was going to apply G-means, it shows me an error like this
TypeError: only size-1 arrays can be converted to Python scalars
I’m really confused with that. Already search on Stackoverflow and other sites but still can’t be solved. Thank you dude :”
You’re welcome.
Perhaps these tips will help:
https://machinelearningmastery.com/faq/single-faq/why-does-the-code-in-the-tutorial-not-work-for-me
Hello Jason, great arcticle!
after finding the best threshold, how to implement it to use the model with this new configuration? i’m working on a project of covid-19 diagnosis and with my current model i got a (0.76 recall and 0.75 specificity of .72). if i find a optmal threshold to maximize recall using the methods that you describe, how can i set this to put model in production? like, change the new threshold, pickle the model and put it on an API for example.
thank you very much!
The to_labels() function above shows you how to convert predicted probabilities into labels using your threshold.
Hi Jason, thanks much for the very informative article. It helps me tremendously.
In my field of work, I often need to control specificity. Say I want to achieve a specificity of 0.90, based on this, then find the corresponding threshold T and sensitivity. Any advice on what sklearn function to use to control specificity? Thanks so much for your help.
Perhaps start with a simple enumeration of threshold values and evaluate the metrics you require manually.
Thanks much, Jason. I was hoping there existed a function parameter I did know which would allow me to set specificity=0.9. Well, apparently not. Good to know.
This does exist and it’s in facebooks MMF library. (They also use it a lot there).
Precision@recallK and Recall@precisionk.
These two metrics get surprisingly little attention but Yann et al over at FB have used them so much that they put them in MMF.
This is an outstanding article so I appreciate the details in your post. I have a question in regards to searching for an optimal threshold. My understanding is that when searching for the value using precision-recall-curve or ROC one should do so using a validation set and not the test set. The reason is that there is a risk with lack of generalization (overfitting) by using the test set to arrive at the threshold value. How would you tackle this issue? would you suggest creating a training, validation, and test set and use the validation set to identify the optimal threshold? I also read one could use cross-validation. That said, I’m not clear on how to use cross-validation. In general, I’ve used cross-validation to evaluate generalization given training set prior to predicting on the test set using cross_val_score(X_train, y_train, cv=cv, scoring=’auc-score’). How would you use it to identify the threshold?
Thanks.
Yes, hold back some data and use that for threshold moving.
Hi Jason, thanks for this post. I have a question. let’s consider the separation hyperplane of logistic regression. Threshold moving is a bit like the displacement of separation hyperplane. So what’s the difference between them?As far as I know, there are some articles that solve the imbalance problem by moving the separation hyperplane. So what is the significance of these articles? Since the problem can be solved by threshold moving.
You’re welcome.
Yes. You can do it (threshold moving) to tune any arbitrary metric and with any algorithm.
Thank you! That is to say, threshold moving is more broadly.
Yes.
Hello Jason,
First of all, thanks a lot for sharing this amazing amount of valuable insights about Machine Learning.
Threshold moving seems could lead to irrealistic predicted class balance : how would you manage the fact that your predictions classes rates won’t match the initial rate?
I have the practical example of credit scoring failure prediction, where the threshold tuning to reach best Youden J index lead to a slightly different failure rate than “reality”. Observed failure rate has an imbalanced 8% failure, while optimized-predicted is approx. 32% of failure.
Thanks for your insights, regards
You’re welcome.
A god question is to perform the tuning of the threshold using a large and representative validation dataset.
Hi Jason,
your articles are amazing …I’m reading them back to back and finding lots of new info for the project I’m working on. I do have a question…I decided to choose ROC AUC as evaluation metric and I got a good score of 0.91. Then I tried to find the optimal threshold based on J statistics as you explained…let’s say the optimal threshold was 0.6…I put this threshold back to my predic_proba for logistic regression and calculated new y_pred_proba + new ROC AUC…but my new ROC AUC is 0.85…
I expected this to be higher than the first ROC AUC which was based on 0.5 threshold built in the predict_proba…what am I doing wrong?
Thanks!
Perhaps ensure that you used a hold out dataset to choose the threshold, e.g. data not used to train the model.
Then evaluate the effect of the new pipeline on a final test set, not used to train or move the threshold.
Hi Jason, thanks for this suggestion.
I split my entire dataset to train, validation and test dataset. Got ROC AUC of 0.91 with my validation dataset and used this dataset (20% of the whole data) for finding the optimal threshold. Then uses the test dataset (also 20%) to test the ROC AUC with e new optimal threshold…which gave me 0.85…
I know it’s difficult to diagnose without much of context but do you have any other tips for me ?
Perhaps choose a threshold using nested cross-validation.
Perhaps choose a threshold as the mean of a CV evaluation.
Perhaps try alternate models and model configs.
Perhaps try a cost sensitive model.
Perhaps try a 50/50 split.
One thing confuses me about your question. When you say “test the ROC AUC with e new optimal threshold”… The ROC and it’s AUC don’t depend on the choice of threshold because they are calculated directly from the model’s continuous probability prediction or decision function without thresholding it in advance. The ROC is calculated across the full range of hypothetical thresholds rather than one chosen threshold.
Agreed, the ROC and AUC are for the continuum of thresholds. But, you need to make specific predictions eventually which will require a threshold (if you need crips class labels).
Hi Jason!
Thanks for this great article.
I have a data set with binary imbalanced class problem. Only 7% of the records belong to positive class. So I applied minority class oversampling techniques and majority class under sampling techniques and re evaluated. But the classifer auc is not improving more than 0.5. So I applied the method of threshold moving and I get this result
Best Threshold=1.000000, G-Mean=0.420 Why is this? How can I fix this?
Thanks.
Perhaps explore additional techniques listed here:
https://machinelearningmastery.com/framework-for-imbalanced-classification-projects/
This sorta feels like we’re cheating – like we’re trying a bunch of thresholds on the test set, and then calculating performance metrics for each (which is what the ROC/PR curve does), and then selecting the best one. Aren’t we sorta “using” the test set for hyperparameter optimisation – wouldn’t it be fairer to use a separate validation set for evaluating the threshold?
Hahah.
Yes, we must use a hold out dataset to choose the threshold, e.g. a validation set. Then evaluate the model + threshold on a test set.
Makes sense, thanks!
Nice article Jason. One quick question, once we find the the optimum threshold how to print the confusion metric ?
Thanks!
This will help you with the confusion matrix:
https://machinelearningmastery.com/confusion-matrix-machine-learning/
Once you have determined the best threshold value using your methodology,
How do you actually implement this threshold value?
That use the optimal value to replace the default value of 0.5
See the “to_labels()” function in the final example for converting predicted probabilities to labels given a threshold.
Thanks
Yes I understand that but can you insert the best threshold value as a parameter within the LogisticRegression Model Class or a function within LogisticRegression so that this threshold value is used instead of 0.5 ?
It would be nice if you could set it as a global parameter before fitting the Logistic Regression Model
No, you post-process predictions using the threshold.
Hi Jason,
I have one confusion.
while finding the optimum threshold, we should use probabilities for training samples instead of testing samples or vice versa? If test examples are used to obtain threshold value then arent we utilizing test data information for label prediction, which shouldn’t be correct as test data is meant to be unseen and not to be used in any manner where it leaks information to the trained model.
Ideally you would use a validation dataset to find the threshold, not used to train or evaluate the model.
Hello sir,
If we are using a Deep neural network with Sigmoid activation in the last layer, how to calculate the roc curve? i.e
# predict probabilities
yhat = model.predict_proba(testX)
# keep probabilities for the positive outcome only
yhat = yhat[:, 1]
what should replace this in the code?
Same way as any other model, collect predicted probabilities. E.g. model.predict(…)
great post and lots of thanks!
I want to learn about methods and theories for finding optimal thresholds more systematically. Could you recommend some review papers or books?
Thank you!
See the references in the “further reading” section above.
Thank you for the elaborate post!
I have a question regarding when threshold moving is necessary.
I’m currently building a Gradient boosting model that predicts a binary target variable . I don’t care about its predictions at all, but just want to look into the model to see which features have been used by the model for the prediction. I do this with the use of FI and SHAP.
Of course, the FI and SHAP results are more reliable for a model that is performing well. So I evaluated the performance of the model with the ROC AUC.
I was wondering if setting a threshold makes any sense in this case. I’m actually working with the trained model, and not with its predictions, so how the predicted probabilities are mapped does not matter to me. Does the chosen threshold influence how the model is being trained and how it makes use of the features in the data?
You’re welcome.
It can help when your model natively predicts probabilities and you need class labels, and there is some bias in predicted probabilities that makes performance not ideal for your chosen metric.
If you’re unsure, try it and see.
Hi Jason,
Thank you for your fast reply, although I am not sure what to do now.
I do not need any class labels, I need to know that my model is trained well (which I evaluate with the AUC ROC), and then I look into the model to see its feature importances.
Will changing the threshold of the model change the predicted probabilities and the way the model is trained? Because I thought that the threshold is only applied after the probabilities have been predicted, so changing the threshold would then not change the probabilities, right?
If you don’t need class labels, then perhaps you don’t need threshold moving.
Also roc auc uses labels at all thresholds, it might not be the best metric for you, consider log loss or brier skill score.
Thank you. I will try those metrics!
Hi Jason,
Thank you for writing this amazing article.
I read all the contents above.
I am still confused about using which data set for searching the best threshold.
In my case, I use XGBoost model. I plan to do the following procedures.
(A)
Splitting my data set into TrainingSet, ValidationSet_1, ValidationSet_2, and TestSet.
1) Firstly, for TrainingSet, using cross-validation method to find the best hyper parameters (excluding n_estimators).
2) Secondly, using the best hyper parameters to train the TrainingSet to get a model.
3) Thirdly, using ValidationSet_1 for early stopping to find the best n_estimators to avoid overfitting.
4) Fourthly, using ValidationSet_2 for finding the best threshold.
5) Finally, using TestSet for evaluating my model.
OR,
(B) Splitting my data set into TrainingSet, ValidationSet_1, and TestSet.
1) Firstly, for TrainingSet, using cross-validation method to find the best hyper parameters (excluding n_estimators) and the best threshold.
2) Secondly, using the best hyper parameters to train the TrainingSet to get a model.
3) Thirdly, using ValidationSet_1 for early stopping to find the best n_estimators to avoid overfitting.
4) Finally, using TestSet for evaluating my model.
My data set is very small, only 200 samples, which procedure you will suggest? or any other suggestions?
Thank you in advance.
It would not make sense to use a threshold for xgboost as it does not natively predict probabilities.
Hi
Thank you for your reply.
I am using XGBClassifier, and the predict_proba() in sklearn can give the probability. So still make no sense to use a threshold for XGBClassifier?
Probably not.
If you do want to use this model, perhaps calibrate the probabilities then use a threshold moving – then and compare results to using the xgboost model directly. I expect using the model directly will perform better and be _much_ simpler.
Hi Jason,
Thank you for the reply.
Can I use the same validation set for early stopping and finding the best threshold, or shold I use two seperate validation sets, one for early stopping and one for finding the best threshold?
Hmmm – this is not so clear-cut. Off the cuff, I think that you would use different data for early stopping and threshold finding, if possible.
In the case of multiclass classification and after the threshold selection process. If we have classes A, B, C and pA>threshold-A and pB>threshold-B, pC>threshold-C. How to choose the classification in these cases?
Threshold moving is for binary classification.
For multi-class classification, you might want to consider a one hot encoding and argmax.
How to cite your articles
See this:
https://machinelearningmastery.com/faq/single-faq/how-do-i-reference-or-cite-a-book-or-blog-post
Dear Jason, thank you for this informative article.
I am wondering if you could tell me why we only need to keep the probabilities of the positive outcome when computing the fpr, tpr, recall, precision?
(I have only run your code with my data and the functions roc_curve and precision_recall_curve compain because testy is different in lenght from yhat, which makes sense to me if for yhat we are only taking the probabilities for the positive target but for testy we take all the data points, 0 and 1).
Many thanks!
The model will predict a probability for each class. On binary problems we only need the probability of the positive class as 1 – p is the probability of class 0. From this we can calculate our threshold.
The length of the vector will be the same, e.g. one probability per input sample/row.
hi Jason, after optimizing the threshold using validation data (suppose 20 % hold out data from training data) , should we train our model on entire training data ( 60 % training+ 20% validation data) and then make predictions for test data or train the model using on only 60 % training data and making test data predictions?
Once you choose a threshold, you can train the model on all data, then start using the model and threshold to make predictions on new data.
Thank you for your reply, Jason. It really helps. Please guide when we are using machine learning algorithms like knn and decision trees etc, then how should we optimize the threshold either by using the validation data or by plotting the roc curve for test data probabilities and then apply thresholding methods like min dist(0,1), etc. As in the deep learning model, validation data is used for preventing the overfitting/underfitting of the model. But in machine learning algorithms, the threshold may change when data is more while training. Please tell me as I have to compare the performances of the deep learning model with machine learning algorithms for class imbalanced datasets. Whether I should use validation data for machine learning algorithms or not?
There is no single best method. You must design a test harness that is a good fit for your project – e.g. that you understand and trust.
Hi, Jason. I’m working on a binary classification problem. I had this situation that I used the logistic regression and support vector machine model imported from sklearn. These two models are fit with the same training data and have achieved comparable performances. When I used these two pre-trained models to predict a new dataset. The LR model and the SVM models predicted similar number of instances as positives.
However, when I looked at the probability scores of being classified as positives, the distribution by LR is from 0.5 to 1 while the SVM starts from around 0.1. I called the function model.predict(prediction_data) to find out the instances predicted as each class and the function model.predict_proba(prediction_data) to give the probability scores of being classified as 0(neg) and 1(pos), and assume they all have a default threshold 0.5.
There is no error in my code and I have no idea why the SVM predicted instances with probability scores < 0.5 as positives as well. Any thoughts on how to interpret this situation? Thanks for the help in advance!
Generally, SVM does not predict calibrated probabilities, I recommend calibrating the model first:
https://machinelearningmastery.com/calibrated-classification-model-in-scikit-learn/
Thanks for your reply. I’ll check this out.
Hi Jason,
Thank you for a very informative article. I am working on a 4-class classification problem with an imbalance dataset, using random forest. I followed your method to find the optimal threshold, using AUC ROC plot. So I generated ROC curve line plots for: class A vs rest, class B vs rest, class C vs rest and class D vs rest plots & find the optimal threshold for each. The probabilities generated for the 4 classes do not sum up to 1, I was wondering if this is an issue? If so, how should I tackle this?
(I also tried to find the most optimal threshold for each class using 10-fold cross validation, and from looking at each fold, the sum of the 4 classes was in the range of 0.94 – 1.12.)
Not an issue at all. Because you are not guaranteed to give probability that can be added. Each model is estimating what class X is compare to NOT class X. But it does not mean not class X must be one of the rest. Hence the result. Indeed, in OvR model, if you throw in a new class, it should give you low probability from all models if they are doing good.
Thank you for a nice article! I was wondering if you happen to have an article showing OVO method instead of OVR when plotting ROC curves?
Could I also ask which method is preferred, if OVR over OVO – why is that the case?
You can produce one yourself: Filter your input data to only two class and run the code to generate ROC. But you should aware that with N classes, OvR has N curves but OvO has N*(N-1) curves.
How about the case of Multi-classes classification? Is it possible to set a threshold? And if yes, how to do that?
for example: class_a: 0.32; class_b: 0.33, class_c: 0.35. Without specifying a threshold value, it would go to class_c. But how would threshold work in this case?
Multiclass classification can potentially assign multiple classes to the same input at the same time. So you have to come up with your own strategy. What you get from the model is a vector of floats between 0 and 1. You have a great flexibility on how you want to interpret the result. What you mentioned is to pick the maximum, which is only one of the possible ways.
How would you go about this in a binary pixel level segmentation problem?
How would you isolate the positive class pixels from the negative ones, to use in the to_label() function? Because yhat here would be an mxn matrix (image dimensions of the predicted segmentation mask)
The logic on this post should just work. Do you see any specific problem in your case?
Great article Jason! I am wondering if you want to compare different models (for example hyper-parameters optimization) on the same dataset do you have to find the best threshold for each model before comparison?
It seems to me a better model should be better irrespective of the threshold, given both models are evaluated and compared for the same threshold.
Thank you for the feedback, Elias!
Hello, congratulations on the great article.
My question might be naive, but I still do not understand how the threshold of the function roc_auc_score() is calculated. If you know, could you tell me?
Hello SuRi…You may want to investigate the softmax function:
https://machinelearningmastery.com/softmax-activation-function-with-python/
Hello, nice article.
My question in case the thersholld itself and the associated metric decide your best model (for example, using validation f1-score to choose the best model during training). In this case, do you start with a default threshold, find the best model and then optimize the threshold on the trained model?
Hi EAZ…In my opinion, your suggested approach is a reasonable one. Let me know what you find.
Hi all,
Does it make sense to search for the best threshold when working with a balanced dataset?
Thanks
Great article. However, using the example, the roc_auc_score is not better when the optimal threshold for the roc curve is used. Could you explain why that is the case?
Hi Jo…It was just for demonstration purposes. You are correct that other methods would be more optimal.
Hi, I tried optimal threshold tuning with your example for the ROC AUC curve. However, the roc_auc_score was worse than before with the optimal threshold.
Could you please explain why this is the case?
Hi Jo…Please clarify the code list you are referencing and specify exactly what you modified so that I may better assist you.
Great article, thanks.
The mistake of the majority comes at a higher cost (FalsNegativ). What needs to change?
Hi Peter…Please clarify your question so that I may better assist you.
Number of negative cases 80%,
FalsNegative Cost > FalsPositiv Cost,
Goals: TruePositiv -> Maximum and FalsNegativ -> Minimum.
Which metric should I use? Can I use a cost matrix?
.predict_proba was removed in Tensorflow 2.6 version.
Can I ask why .predict doesn’t give same result?
Hi Min…What specific code listing are you referring to for which the results are different? Some variance is to be expected due the stochastic nature of training.
https://machinelearningmastery.com/stochastic-in-machine-learning/
Hi Jason, I am trying to calculate tpr, tnr, precision and f1 score at the optimal point of the ROC curve. I can calculate tpr and tnr but cannot calculate the precision/f1 score/accuracy because the sklearn provided roc_curve() function does not provide the precision score. Can you please help me with how I can calculate the precision/f1 score at that point? Thanks.
Hi Md…You may find the following of interest:
https://machinelearningmastery.com/roc-curves-and-precision-recall-curves-for-imbalanced-classification/
Thank you for a great article, I have a question about when you already made the threshold moving part of each CV fold. And that threshold value obtained from each fold is different. So, how do you then decide on the final threshold value to use with the final model? Can you average threshold values let say across 10 CV folds and use that? Is there a better alternative?
I also realised that the accuracy or F1 or other classification metrics I get from running this 10-CV is the result of using different thresholds per fold. This then means that these classification metrics are not reflecting the so-called ‘real performance’ of when I actually use the final threshold values.My question is, how should I then report the classification performance? Do I need to re-run the CV with the final threshold values?
Thank you so much!
Hi Ink…You are very welcome! You are on the right track! You can definitely average the threshold values as you suggested.
Thank you for this James, could you please advise me on the second part of my question?
I also realised that the accuracy or F1 or other classification metrics I get from running this 10-CV is the result of using different thresholds per fold. This then means that these classification metrics are not reflecting the so-called ‘real performance’ of when I actually use the final threshold values.My question is, how should I then report the classification performance? Do I need to re-run the CV with the final threshold values?
Hey Jason, excellent post. My question is related but not addressed here. If we notice subgroups in the data for which using a single cutoff may be harmful for prediction accuracy, would it be appropriate to use multiple cutoffs (2 or more) assuming I use the same scientific approach? (i.e. “train” then test on yet another hold out). Feels like the start of a model stacking convo but 2 cutoffs is more like a post processing step rather than an entirely new build (that I would like to avoid).
Hi Adam…You may find the following of interest:
https://datascience.stackexchange.com/questions/77264/finding-optimal-threshold-in-multi-class-classification-task
Hi Jason, that was very helpful. One question though. Recently I have developed a classification model which I may consider “a perfect model”, since it gives about 99% of probability (of churn) on training, test and validation (out of sample). What should be the value of THRESHOLD here? Looking at the Precision – Recall graphs, I always see a perfect/straight line of 99% at any value of threshold, and both start decreasing at about 99.7 %. I am not pretty sure if I am doing something wrong.
Thank you.
Hi Jaime…You are very welcome! You may want to determine how well your model able to generalize to data never seen.
https://machinelearningmastery.com/overfitting-and-underfitting-with-machine-learning-algorithms/
”
1. Fit Model on the Training Dataset.
2. Predict Probabilities on the Test Dataset.
3. For each threshold in Thresholds:
3a. Convert probabilities to Class Labels using the threshold.
3b. Evaluate Class Labels.
3c. If Score is Better than Best Score.
3ci. Adopt Threshold.
4. Use Adopted Threshold When Making Class Predictions on New Data.
”
Surely, by tuning the threshold after training you are overfitting to the test data set.
Absolutely Kiril! Keep up the great work!
Jason,
Here is what happens with me. My focus is on precision, when tuning to get best value I keep increasing the threshold so the False-Positives comes out to be 0 to get precision = 1 which is not what I want as it throws every misclassification to False-Negative case. When I use the techniques shared here, I get a good balance of False-Negatives and False-Positives, but that appears to be with lower threshold and I find way too many costly misclassifications (False-Positives in my problem). Is there any technique to find a threshold to maximize precision but not go to extreme of going to zero False-Positives?
Hi sir ,suppose i fit a model and using predict_proba for test set and gives out probabilities for each class label eg[0.1,0.2,0.3,0.05,0.35] and the calculated threshold for each class label is [0.09,0.1,0.25,0.1,0.2] so the output [0.1>0.09,0.2>0.1,0.3>0.25,0.050.2] still 1,2,3,5 class labels have got their places so when we sort by descending of their probabilities [0.35,0.2,0.3,0.1] still the class 5 be dominating ?how should we approach for these kind of threshold setting and weight adjustments
Hi sangeetha…The following resource may be of interest to you:
https://pub.towardsai.net/improve-your-classification-models-with-threshold-tuning-bb69fca15114
Also, the following resource discusses optimal threshold tuning:
https://towardsdatascience.com/optimal-threshold-for-imbalanced-classification-5884e870c293
Thanks Sir ,will check out .Thank for the reference
Hi, Jason
I have an SVC(bniary classifier) model trained on features extracted from Densnet.
When using det_curve it just returns a single threshold value and corresponding fpr and fnr values , though my prediction scores are in the range 0 to 1.
Why does this happen, can you please explain what am I doing wrong.
Hi S Ahmad…The following resource is 1 of a 3 part series that may be of interest to you:
https://machinelearningmastery.com/method-of-lagrange-multipliers-the-theory-behind-support-vector-machines-part-1-the-separable-case/
Hi Jason,
Thank you for the great article. I have an imbalanced problem as my outcome proportion is 5% vs 95%. I trained a CatBoost model, and the AUC was 0.89, but the F1 score was 0.1. I used class weights, sampling methods like SMOTE, and others. Additionally, I optimized the threshold and utilized the class weights approach. However, the best F1 score I obtained is 0.38. Are there any other methods or tricks I can use to improve the F1 score to at least 0.7?
Thank you.
Hi Yousif…Improving the F1 score in the context of a highly imbalanced dataset can indeed be challenging. An F1 score of 0.38, despite optimizing class weights and using techniques like SMOTE, indicates that the model struggles to balance precision and recall, especially for the minority class. Here are some strategies and advanced techniques you could explore to potentially enhance the F1 score:
### 1. **Advanced Sampling Techniques**
– **Cluster-based Over Sampling**: Instead of using SMOTE, which generates synthetic samples based purely on feature space, consider methods like Cluster-based Over Sampling (CBO). This method involves clustering the minority class and then performing over-sampling within each cluster, helping to preserve intra-class variance.
– **Borderline SMOTE or ADASYN**: These are variations of SMOTE that focus on generating synthetic samples near the decision boundary, which might be more helpful in crafting a more generalized decision surface.
### 2. **Cost-sensitive Learning**
– **Tune Class Weights More Precisely**: Beyond using automated class weight calculation, you could manually adjust the weights in a more nuanced way, perhaps based on validation set performance rather than just the training set.
– **Custom Loss Functions**: Modify the loss function to penalize wrong predictions on the minority class more heavily. CatBoost allows for the use of custom objective functions, which you can tailor to prioritize minimizing false negatives or false positives, depending on which is more impactful to your F1 score.
### 3. **Ensemble Methods**
– **Boosting Minority Class**: Train multiple models where each new model increasingly focuses on the minority class samples that previous models misclassified.
– **Blending Models**: Use a combination of different models trained with different resampling techniques. For example, blend the predictions of a model trained on the original data with a model trained on SMOTE-enhanced data.
### 4. **Threshold Moving**
– **Adjust Decision Threshold**: Although you’ve optimized the threshold, revisit this with a focus on maximizing the F1 score specifically. Use precision-recall curves to find the best trade-off.
– **Precision-Recall Trade-off**: Explore tools like the F-beta score, where you can adjust the beta parameter to give more importance to recall or precision, depending on which one is more critical for your application.
### 5. **Feature Engineering**
– **Add Interaction Terms**: Sometimes, interactions between features are not adequately captured by the model but can be highly predictive of the minority class.
– **Dimensionality Reduction Techniques**: Techniques like PCA or t-SNE might reveal new perspectives or combinations of features that better separate classes.
### 6. **Anomaly Detection Techniques**
– Treat the minority class as anomalies and explore anomaly detection algorithms. This can sometimes highlight different aspects of the data that conventional algorithms miss.
### 7. **External Data**
– **Incorporating More Data**: If possible, adding more samples, especially for the minority class, can help the model learn more robust features.
– **Transfer Learning**: If applicable, use a model pre-trained on a similar task and fine-tune it on your dataset.
### 8. **Evaluation and Iteration**
– **Cross-validation**: Use stratified K-fold cross-validation to ensure that your model’s performance assessment is robust and consistent across different subsets of your data.
– **Continuous Monitoring**: Continually evaluate the performance of your model on new data, and adjust strategies as necessary.
By integrating these strategies, you might find a combination that significantly improves the F1 score. Often, a mix of resampling techniques, ensemble methods, and careful tuning of model parameters (including decision thresholds) offers the best results.
Hi Jason,
Thank you for the great article. I am wondering to which set should one apply the ROC analysis for determining the optimal probability threshold, the train set, test set or a separate validation set?
Hey Jason. I’m working on a highly imbalanced binary sentiment classifier using RNNs. I used Binary Cross entropy with logits = True, and with label smoothing set to .1, was able to achieve TP predictions at a threshold of .5 for both classes(TP and TN) , where as before, my model was not predicting the underrepresented negative class at all. Would label smoothing be an equally viable approach to this problem if I did not modify my threshold at all and left it at the default .5?
Hi Syed…Label smoothing can help improve the performance of a neural network, including RNNs, by making the model less confident in its predictions, which can help mitigate overfitting and improve generalization. However, for imbalanced datasets, it is often not sufficient on its own.
Let’s break down the key concepts and address your specific question:
### Imbalanced Binary Classification and Label Smoothing
**Imbalanced Dataset**:
– In an imbalanced binary classification problem, one class (usually the minority class) has significantly fewer examples than the other class. This can lead to a bias in the model where it predicts the majority class more frequently.
**Label Smoothing**:
– Label smoothing is a regularization technique where the ground truth labels are smoothed by a small constant (e.g., 0.1). For a binary classification problem with label smoothing, the labels 0 and 1 are replaced with 0.1 and 0.9, respectively (assuming a smoothing factor of 0.1).
– This technique helps prevent the model from becoming overly confident in its predictions, which can improve generalization.
### Effect of Label Smoothing on Imbalanced Datasets
When you use label smoothing in an imbalanced dataset:
– **Positive Class**: The true labels for the positive class (1) are smoothed to 0.9.
– **Negative Class**: The true labels for the negative class (0) are smoothed to 0.1.
This can help the model not to be overly confident about the majority class, potentially increasing the recall for the minority class. However, label smoothing alone may not fully address the imbalance issue.
### Prediction Threshold
The prediction threshold determines the cutoff point at which the model assigns a positive label. The default threshold is typically 0.5:
– If \( \hat{y} \geq 0.5 \), predict positive (1).
– If \( \hat{y} < 0.5 \), predict negative (0). In the context of an imbalanced dataset: - You might find that using a threshold of 0.5 does not give you the best results in terms of balancing precision and recall for both classes. - Adjusting the threshold can help improve the performance for the minority class by making the model more likely to predict the minority class when it is uncertain. ### Combining Label Smoothing with Threshold Adjustment **Scenario**: - With label smoothing and a threshold of 0.5, you observed an improvement in the True Positive (TP) predictions for both classes. - This suggests that label smoothing is helping the model to better learn from the minority class, but it is often beneficial to also consider threshold adjustment. **Leaving Threshold at 0.5**: - If you leave the threshold at 0.5, label smoothing alone may still help, but it might not fully optimize the performance for the minority class. - It is generally recommended to experiment with different thresholds to find the optimal balance between precision and recall, especially for the minority class. ### Practical Approach 1. **Model Training with Label Smoothing**: - Train your model with label smoothing and evaluate its performance with a default threshold of 0.5. 2. **Evaluate Metrics**: - Evaluate metrics such as precision, recall, F1-score, and ROC-AUC for both classes. 3. **Threshold Adjustment**: - Experiment with different thresholds (e.g., 0.3, 0.4, 0.6) and evaluate the performance. - Use techniques like the ROC curve to find the optimal threshold that balances the trade-off between true positives and false positives. ### Example Code for Threshold Adjustment in PyTorch Here is an example in PyTorch that shows how to adjust the threshold:
pythonimport torch
import torch.nn as nn
# Example logits and labels
logits = torch.tensor([0.1, 1.2, -0.3, 2.5, -1.0])
labels = torch.tensor([0, 1, 0, 1, 0])
# Binary cross-entropy with logits and label smoothing
criterion = nn.BCEWithLogitsLoss(pos_weight=torch.tensor([1.0]))
loss = criterion(logits, labels.float())
print(f'Loss: {loss.item()}')
# Sigmoid function to convert logits to probabilities
probs = torch.sigmoid(logits)
# Experiment with different thresholds
threshold = 0.4 # Adjust this value
preds = (probs >= threshold).float()
print(f'Predictions: {preds}')
# Calculate metrics
tp = ((preds == 1) & (labels == 1)).sum().item()
tn = ((preds == 0) & (labels == 0)).sum().item()
fp = ((preds == 1) & (labels == 0)).sum().item()
fn = ((preds == 0) & (labels == 1)).sum().item()
precision = tp / (tp + fp) if (tp + fp) > 0 else 0
recall = tp / (tp + fn) if (tp + fn) > 0 else 0
f1 = 2 * (precision * recall) / (precision + recall) if (precision + recall) > 0 else 0
print(f'Precision: {precision}, Recall: {recall}, F1-score: {f1}')
### Conclusion
Label smoothing can be beneficial for improving the model’s performance, especially for imbalanced datasets. However, for optimal results, it is generally recommended to also consider adjusting the prediction threshold. Experiment with different thresholds to find the best balance between precision and recall for your specific use case.
I hope this helps! If you have further questions or need additional assistance, feel free to ask.