Outliers or anomalies are rare examples that do not fit in with the rest of the data.
Identifying outliers in data is referred to as outlier or anomaly detection and a subfield of machine learning focused on this problem is referred to as one-class classification. These are unsupervised learning algorithms that attempt to model “normal” examples in order to classify new examples as either normal or abnormal (e.g. outliers).
One-class classification algorithms can be used for binary classification tasks with a severely skewed class distribution. These techniques can be fit on the input examples from the majority class in the training dataset, then evaluated on a holdout test dataset.
Although not designed for these types of problems, one-class classification algorithms can be effective for imbalanced classification datasets where there are none or very few examples of the minority class, or datasets where there is no coherent structure to separate the classes that could be learned by a supervised algorithm.
In this tutorial, you will discover how to use one-class classification algorithms for datasets with severely skewed class distributions.
After completing this tutorial, you will know:
One-class classification is a field of machine learning that provides techniques for outlier and anomaly detection.
How to adapt one-class classification algorithms for imbalanced classification with a severely skewed class distribution.
How to fit and evaluate one-class classification algorithms such as SVM, isolation forest, elliptic envelope, and local outlier factor.
Kick-start your project with my new book Imbalanced Classification with Python, including step-by-step tutorials and the Python source code files for all examples.
Let’s get started.
One-Class Classification Algorithms for Imbalanced Classification Photo by Kosala Bandara, some rights reserved.
Tutorial Overview
This tutorial is divided into five parts; they are:
Rarity suggests that they have a low frequency relative to non-outlier data (so-called inliers). Unusual suggests that they do not fit neatly into the data distribution.
The presence of outliers can cause problems. For example, a single variable may have an outlier far from the mass of examples, which can skew summary statistics such as the mean and variance.
Fitting a machine learning model may require the identification and removal of outliers as a data preparation technique.
The process of identifying outliers in a dataset is generally referred to as anomaly detection, where the outliers are “anomalies,” and the rest of the data is “normal.” Outlier detection or anomaly detection is a challenging problem and is comprised of a range of techniques.
In machine learning, one approach to tackling the problem of anomaly detection is one-class classification.
One-Class Classification, or OCC for short, involves fitting a model on the “normal” data and predicting whether new data is normal or an outlier/anomaly.
A one-class classifier aims at capturing characteristics of training instances, in order to be able to distinguish between them and potential outliers to appear.
A one-class classifier is fit on a training dataset that only has examples from the normal class. Once prepared, the model is used to classify new examples as either normal or not-normal, i.e. outliers or anomalies.
One-class classification techniques can be used for binary (two-class) imbalanced classification problems where the negative case (class 0) is taken as “normal” and the positive case (class 1) is taken as an outlier or anomaly.
Negative Case: Normal or inlier.
Positive Case: Anomaly or outlier.
Given the nature of the approach, one-class classifications are most suited for those tasks where the positive cases don’t have a consistent pattern or structure in the feature space, making it hard for other classification algorithms to learn a class boundary. Instead, treating the positive cases as outliers, it allows one-class classifiers to ignore the task of discrimination and instead focus on deviations from normal or what is expected.
This solution has proven to be especially useful when the minority class lack any structure, being predominantly composed of small disjuncts or noisy instances.
It may also be appropriate where the number of positive cases in the training set is so few that they are not worth including in the model, such as a few tens of examples or fewer. Or for problems where no examples of positive cases can be collected prior to training a model.
To be clear, this adaptation of one-class classification algorithms for imbalanced classification is unusual but can be effective on some problems. The downside of this approach is that any examples of outliers (positive cases) we have during training are not used by the one-class classifier and are discarded. This suggests that perhaps an inverse modeling of the problem (e.g. model the positive case as normal) could be tried in parallel. It also suggests that the one-class classifier could provide an input to an ensemble of algorithms, each of which uses the training dataset in different ways.
One must remember that the advantages of one-class classifiers come at a price of discarding all of available information about the majority class. Therefore, this solution should be used carefully and may not fit some specific applications.
The scikit-learn library provides a handful of common one-class classification algorithms intended for use in outlier or anomaly detection and change detection, such as One-Class SVM, Isolation Forest, Elliptic Envelope, and Local Outlier Factor.
In the following sections, we will take a look at each in turn.
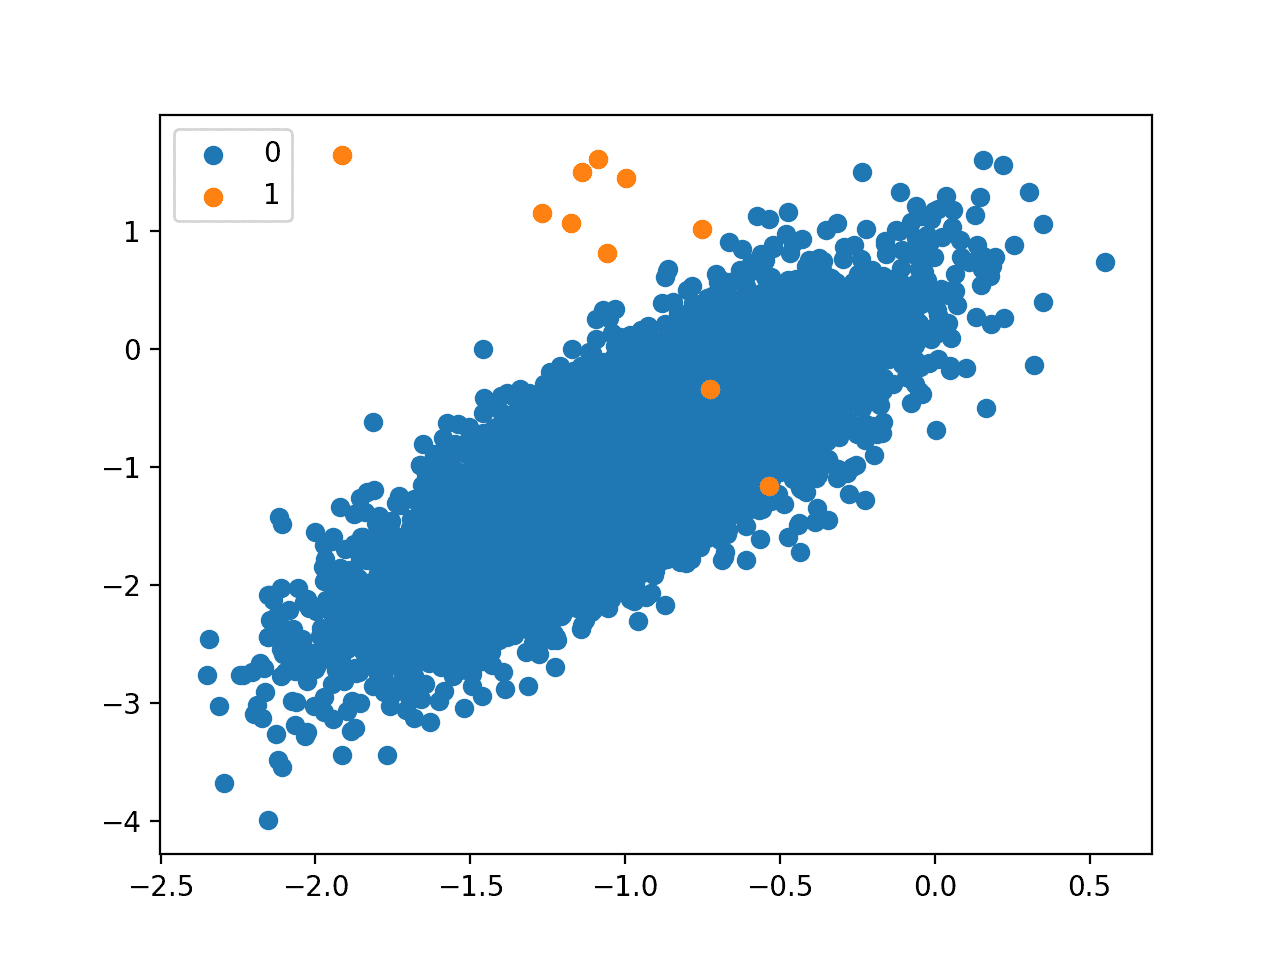
Before we do, we will devise a binary classification dataset to demonstrate the algorithms. We will use the make_classification() scikit-learn function to create 10,000 examples with 10 examples in the minority class and 9,990 in the majority class, or a 0.1 percent vs. 99.9 percent, or about 1:1000 class distribution.
The example below creates and summarizes this dataset.
1
2
3
4
5
6
7
8
9
10
11
12
13
14
15
16
17
# Generate and plot a synthetic imbalanced classification dataset
Running the example first summarizes the class distribution, confirming the imbalance was created as expected.
1
Counter({0: 9990, 1: 10})
Next, a scatter plot is created and examples are plotted as points colored by their class label, showing a large mass for the majority class (blue) and a few dots for the minority class (orange).
This severe class imbalance with so few examples in the positive class and the unstructured nature of the few examples in the positive class might make a good basis for using one-class classification methods.
Scatter Plot of a Binary Classification Problem With a 1 to 1000 Class Imbalance
Want to Get Started With Imbalance Classification?
Take my free 7-day email crash course now (with sample code).
Click to sign-up and also get a free PDF Ebook version of the course.
One-Class Support Vector Machines
The support vector machine, or SVM, algorithm developed initially for binary classification can be used for one-class classification.
If used for imbalanced classification, it is a good idea to evaluate the standard SVM and weighted SVM on your dataset before testing the one-class version.
When modeling one class, the algorithm captures the density of the majority class and classifies examples on the extremes of the density function as outliers. This modification of SVM is referred to as One-Class SVM.
… an algorithm that computes a binary function that is supposed to capture regions in input space where the probability density lives (its support), that is, a function such that most of the data will live in the region where the function is nonzero.
The scikit-learn library provides an implementation of one-class SVM in the OneClassSVM class.
The main difference from a standard SVM is that it is fit in an unsupervised manner and does not provide the normal hyperparameters for tuning the margin like C. Instead, it provides a hyperparameter “nu” that controls the sensitivity of the support vectors and should be tuned to the approximate ratio of outliers in the data, e.g. 0.01%.
1
2
3
...
# define outlier detection model
model=OneClassSVM(gamma='scale',nu=0.01)
The model can be fit on all examples in the training dataset or just those examples in the majority class. Perhaps try both on your problem.
In this case, we will try fitting on just those examples in the training set that belong to the majority class.
1
2
3
# fit on majority class
trainX=trainX[trainy==0]
model.fit(trainX)
Once fit, the model can be used to identify outliers in new data.
When calling the predict() function on the model, it will output a +1 for normal examples, so-called inliers, and a -1 for outliers.
Inlier Prediction: +1
Outlier Prediction: -1
1
2
3
...
# detect outliers in the test set
yhat=model.predict(testX)
If we want to evaluate the performance of the model as a binary classifier, we must change the labels in the test dataset from 0 and 1 for the majority and minority classes respectively, to +1 and -1.
1
2
3
4
...
# mark inliers 1, outliers -1
testy[testy==1]=-1
testy[testy==0]=1
We can then compare the predictions from the model to the expected target values and calculate a score. Given that we have crisp class labels, we might use a score like precision, recall, or a combination of both, such as the F-measure (F1-score).
In this case, we will use F-measure score, which is the harmonic mean of precision and recall. We can calculate the F-measure using the f1_score() function and specify the label of the minority class as -1 via the “pos_label” argument.
1
2
3
4
...
# calculate score
score=f1_score(testy,yhat,pos_label=-1)
print('F1 Score: %.3f'%score)
Tying this together, we can evaluate the one-class SVM algorithm on our synthetic dataset. We will split the dataset in two and use half to train the model in an unsupervised manner and the other half to evaluate it.
The complete example is listed below.
1
2
3
4
5
6
7
8
9
10
11
12
13
14
15
16
17
18
19
20
21
22
23
# one-class svm for imbalanced binary classification
from sklearn.datasets import make_classification
from sklearn.model_selection import train_test_split
Running the example fits the model on the input examples from the majority class in the training set. The model is then used to classify examples in the test set as inliers and outliers.
Note: Your results may vary given the stochastic nature of the algorithm or evaluation procedure, or differences in numerical precision. Consider running the example a few times and compare the average outcome.
In this case, an F1 score of 0.123 is achieved.
1
F1 Score: 0.123
Isolation Forest
Isolation Forest, or iForest for short, is a tree-based anomaly detection algorithm.
… Isolation Forest (iForest) which detects anomalies purely based on the concept of isolation without employing any distance or density measure
It is based on modeling the normal data in such a way to isolate anomalies that are both few in number and different in the feature space.
… our proposed method takes advantage of two anomalies’ quantitative properties: i) they are the minority consisting of fewer instances and ii) they have attribute-values that are very different from those of normal instances.
Tree structures are created to isolate anomalies. The result is that isolated examples have a relatively short depth in the trees, whereas normal data is less isolated and has a greater depth in the trees.
… a tree structure can be constructed effectively to isolate every single instance. Because of their susceptibility to isolation, anomalies are isolated closer to the root of the tree; whereas normal points are isolated at the deeper end of the tree.
The scikit-learn library provides an implementation of Isolation Forest in the IsolationForest class.
Perhaps the most important hyperparameters of the model are the “n_estimators” argument that sets the number of trees to create and the “contamination” argument, which is used to help define the number of outliers in the dataset.
We know the contamination is about 0.01 percent positive cases to negative cases, so we can set the “contamination” argument to be 0.01.
The model is probably best trained on examples that exclude outliers. In this case, we fit the model on the input features for examples from the majority class only.
1
2
3
4
...
# fit on majority class
trainX=trainX[trainy==0]
model.fit(trainX)
Like one-class SVM, the model will predict an inlier with a label of +1 and an outlier with a label of -1, therefore, the labels of the test set must be changed before evaluating the predictions.
Tying this together, the complete example is listed below.
1
2
3
4
5
6
7
8
9
10
11
12
13
14
15
16
17
18
19
20
21
22
23
# isolation forest for imbalanced classification
from sklearn.datasets import make_classification
from sklearn.model_selection import train_test_split
Running the example fits the isolation forest model on the training dataset in an unsupervised manner, then classifies examples in the test set as inliers and outliers and scores the result.
Note: Your results may vary given the stochastic nature of the algorithm or evaluation procedure, or differences in numerical precision. Consider running the example a few times and compare the average outcome.
In this case, an F1 score of 0.154 is achieved.
1
F1 Score: 0.154
Note: the contamination is quite low and may result in many runs with an F1 Score of 0.0.
To improve the stability of the method on this dataset, try increasing the contamination to 0.05 or even 0.1 and re-run the example.
Minimum Covariance Determinant
If the input variables have a Gaussian distribution, then simple statistical methods can be used to detect outliers.
For example, if the dataset has two input variables and both are Gaussian, then the feature space forms a multi-dimensional Gaussian and knowledge of this distribution can be used to identify values far from the distribution.
This approach can be generalized by defining a hypersphere (ellipsoid) that covers the normal data, and data that falls outside this shape is considered an outlier. An efficient implementation of this technique for multivariate data is known as the Minimum Covariance Determinant, or MCD for short.
It is unusual to have such well-behaved data, but if this is the case for your dataset, or you can use power transforms to make the variables Gaussian, then this approach might be appropriate.
The Minimum Covariance Determinant (MCD) method is a highly robust estimator of multivariate location and scatter, for which a fast algorithm is available. […] It also serves as a convenient and efficient tool for outlier detection.
It provides the “contamination” argument that defines the expected ratio of outliers to be observed in practice. We know that this is 0.01 percent in our synthetic dataset, so we can set it accordingly.
1
2
3
...
# define outlier detection model
model=EllipticEnvelope(contamination=0.01)
The model can be fit on the input data from the majority class only in order to estimate the distribution of “normal” data in an unsupervised manner.
1
2
3
4
...
# fit on majority class
trainX=trainX[trainy==0]
model.fit(trainX)
The model will then be used to classify new examples as either normal (+1) or outliers (-1).
1
2
3
...
# detect outliers in the test set
yhat=model.predict(testX)
Tying this together, the complete example of using the elliptic envelope outlier detection model for imbalanced classification on our synthetic binary classification dataset is listed below.
1
2
3
4
5
6
7
8
9
10
11
12
13
14
15
16
17
18
19
20
21
22
23
# elliptic envelope for imbalanced classification
from sklearn.datasets import make_classification
from sklearn.model_selection import train_test_split
Running the example fits the elliptic envelope model on the training dataset in an unsupervised manner, then classifies examples in the test set as inliers and outliers and scores the result.
Note: Your results may vary given the stochastic nature of the algorithm or evaluation procedure, or differences in numerical precision. Consider running the example a few times and compare the average outcome.
In this case, an F1 score of 0.157 is achieved.
1
F1 Score: 0.157
Local Outlier Factor
A simple approach to identifying outliers is to locate those examples that are far from the other examples in the feature space.
This can work well for feature spaces with low dimensionality (few features), although it can become less reliable as the number of features is increased, referred to as the curse of dimensionality.
The local outlier factor, or LOF for short, is a technique that attempts to harness the idea of nearest neighbors for outlier detection. Each example is assigned a scoring of how isolated or how likely it is to be outliers based on the size of its local neighborhood. Those examples with the largest score are more likely to be outliers.
We introduce a local outlier (LOF) for each object in the dataset, indicating its degree of outlier-ness.
The scikit-learn library provides an implementation of this approach in the LocalOutlierFactor class.
The model can be defined and requires that the expected percentage of outliers in the dataset be indicated, such as 0.01 percent in the case of our synthetic dataset.
1
2
3
...
# define outlier detection model
model=LocalOutlierFactor(contamination=0.01)
The model is not fit. Instead, a “normal” dataset is used as the basis for identifying outliers in new data via a call to fit_predict().
To use this model to identify outliers in our test dataset, we must first prepare the training dataset to only have input examples from the majority class.
1
2
3
...
# get examples for just the majority class
trainX=trainX[trainy==0]
Next, we can concatenate these examples with the input examples from the test dataset.
1
2
3
...
# create one large dataset
composite=vstack((trainX,testX))
We can then make a prediction by calling fit_predict() and retrieve only those labels for the examples in the test set.
1
2
3
4
5
...
# make prediction on composite dataset
yhat=model.fit_predict(composite)
# get just the predictions on the test set
yhat yhat[len(trainX):]
To make things easier, we can wrap this up into a new function with the name lof_predict() listed below.
1
2
3
4
5
6
7
8
# make a prediction with a lof model
def lof_predict(model,trainX,testX):
# create one large dataset
composite=vstack((trainX,testX))
# make prediction on composite dataset
yhat=model.fit_predict(composite)
# return just the predictions on the test set
returnyhat[len(trainX):]
The predicted labels will be +1 for normal and -1 for outliers, like the other outlier detection algorithms in scikit-learn.
Tying this together, the complete example of using the LOF outlier detection algorithm for classification with a skewed class distribution is listed below.
1
2
3
4
5
6
7
8
9
10
11
12
13
14
15
16
17
18
19
20
21
22
23
24
25
26
27
28
29
30
31
32
33
# local outlier factor for imbalanced classification
from numpy import vstack
from sklearn.datasets import make_classification
from sklearn.model_selection import train_test_split
Running the example uses the local outlier factor model with the training dataset in an unsupervised manner to classify examples in the test set as inliers and outliers, then scores the result.
Note: Your results may vary given the stochastic nature of the algorithm or evaluation procedure, or differences in numerical precision. Consider running the example a few times and compare the average outcome.
In this case, an F1 score of 0.138 is achieved.
1
F1 Score: 0.138
Further Reading
This section provides more resources on the topic if you are looking to go deeper.
It provides self-study tutorials and end-to-end projects on: Performance Metrics, Undersampling Methods, SMOTE, Threshold Moving, Probability Calibration, Cost-Sensitive Algorithms
and much more...
Bring Imbalanced Classification Methods to Your Machine Learning Projects
Could you please explain choice of hyper parameter “nu”? hyperparameter “nu” that controls the sensitivity of the support vectors and should be tuned to the approximate ratio of outliers in the data, e.g. 0.01%. ratio of one class to other is 1:999 which is 0.001 or 0.1 percent. Why choose 0.01%?
It is supposed to be related to the ratio of outliers, although this can be hard to estimate and I recommend testing different values to discover what works for your dataset.
f1_score returns a value between 0 and 1, and a high value for f1_score means better result,
Also, the pos_label parameter lets you specify which class should be considered “positive” for the sake of this computation. you defined the parameter pos_label with -1 whereas in your examples, the majority of data are labeled by 1.
So I think the results arent true, you should change the value of pos_label parameter to 1
Thank you for sharing your great expert.
I’m trying to find outliers from a dataset with 60 features and 180 observations. With isolation Forest approach which is unsupervised:
1- I don’t have any idea about actual outliers, so cannot separate them to inliers ant outliers, can I run the model on a mixed observations? What you suggest?
2/ How can determine contamination rate?
2- How can I get confident that reported outliers are accurate when I don’t have any targets to test the model?
Thank you.
I don’t have outliers.
I used isolation random forest to find outliers. Next, split dataset to train, test. Next, removed outliers and trained the model on pure training set. Then, used trained model to find outliers from test set, and estimate F score.
Ionosphere sure if this is the best method.
Dear Jason,
There are outliers, and I employed unsupervised isolation random forest to find them.
I found some outliers.
How can I check whether they are really outliers or not?
Thank you for this useful tutorial!
I have one question: how can I fit any of these methods on the minority class instead? It seems that all the above classifiers have the outlier or contamination ratio that is in the [0,1) range. But, if fitted on the minority class, this ratio is more than 1. Can any of the mentioned classifiers be fitted on the minority class, or I should try some other methods for such a problem? Thank you!
With the data that I have, abnormal class is the majority class. It has a distribution that is all over the place and doesn’t have a consistent pattern. My normal class has less data and it is less scattered in the feature space. That’s why I think fitting a model to the minority class, which in my case is the normal class, makes more sense. Do you have any thoughts on that?
Hello. 1% of my data is discarded and the rest is normal.
The Recall value is very low. What should be done after these steps?
I don’t understand what you came up with. Will the work end here?
As I mentioned before, my problem is how to define a hyperparameter like “nu” in one class svm, or “contamination” factor in some other methods. These hyperparameters are in (0,1) range. But, if I want to train on the normal data, that has a more consistent pattern in the feature space, the ratio of abnormal to normal is higher than 1 (as I mentioned I have more anomaly than normal data). Is there any other approach to try here?
No idea, never done it. You will have to experiment and discover what methods or framing of the problem are appropriate. It might require some creative thinking…
In the LOF method, you reached F1-score=0.13. What can be concluded from this output?
Was the LOF method appropriate or not?
In general, how do you evaluate these methods that you mentioned in this section?
Is it possible in this case to tell your interpretation of the output and performance of LOF?
Because my data is very unbalanced and the Fscore is very, very low
I have a doubt and i would like to give small details about my data before asking it. I am working on signal classification problems where i have two types of signals with almost same envelope and the abnormal class has time delays and attenuation compared to normal class. I have been trying to implement OCSVM and One class CNN (OCCNN) as mentioned in this article(https://arxiv.org/pdf/1901.08688.pdf). I am initializing the network with few (8 to 12 thousands) of signals belongs to normal class and i am getting some satisfactory results in testing phase with OCSVM. But i can’t get prediction of abnormal signals using OCCNN.
Here i give a brief about OCCNN: It uses pre-trained ALexNet or VggNet models with ImageNet models up to feature extraction stage by freezing dense network. To these half networks, single class data such as normal class data is fed to extract features and these features are appended with psuedonegative class data generated from zero mean Gaussian distribution and fed to dense layers as binary classification problem.
Can you please suggest me how should i proceed to achieve classification using OCCNN.
Sorry, I am not familiar with the technique off the cuff, not sure how I can help exactly. It sounds like you need to debug your implementation or find an existing implementation that you can adopt.
Could we use One-class classification algorithms for classification of audio signals. Audio signals are collected from gas turbine combustors. The audio signals mostly refer to normal operating condition. It is desired to develop system for detection of anomaly.
Hi…
Is it possible to explain the sentence you wrote?
(It also suggests that the one-class classifier could provide an input to an ensemble of algorithms, each of which uses the training dataset in different ways.)
That is, to be used as meta_classifier? How? Do you have an example?
Hello, this is a great tutorial and an overview of available methods! Do you by any chance know how similar methods could be implemented using Keras or Tensorflow? In my project TFX (Tensorflow Extended) is used as a framework for creating and deploying ML model, thus I’m limited to it when building a model. Or maybe you could help me understand how one-class SVM or isolation forest could be implemented in Keras/Tensorflow API?
I would, but the TFX framework is enforcing the model to be in format of either Tensorflow’s Estimator or Keras’ Model – I can’t find (or I’m not aware of) a way to transform model built with sklearn to the one accepted in TFX pipeline.
Hi Jason,
Thanks for the great articles and summarizing lot of things in one page.
1) For the unsupervised methods like clustering, we wouldn’t need any training data nor a target variable. But in this one-class classification problems, looks like we need to have the training data and also a target class. A little confused why it comes under unsupervised learning when we still need to train.
2) You have mentioned -“A one-class classifier is fit on a training dataset that only has examples from the normal class.”.
This means we have to make sure we don’t have any outliers in the training data. Say if have 1000 samples in training dat, we have to make sure that we don’t have any outliers in this 1000 samples?
Many thanks for this article. I have an unlabelled dataset where I’m running one class SVM to detect inliers and outliers. Would you know how I can validate the model in this case given there is no ground truth? Thanks!
Quick note: for Isolation forest, I got the warning “252: FutureWarning: ‘behaviour’ is deprecated in 0.22 and will be removed in 0.24. You should not pass or set this parameter.”
Hey jason!
Great article.
I am training one class svm model but there is only one class data for testing also. How can i measure performance of model using true positive and false negative values. Thanks!
I read this article. But in my case i have only one class data for training and testing. So, how can i measure the performance of my oneClassSVM model?
Hello, I just started learning ML and now I have an imbalanced dataset with almost 15 features;
the minority class (+) is important to me but I didn’t find meaningful correlations between the features and the label.
Can I use OCC for my classification?
Hi Jason,
Thanks for this helpful post.
I am new in ML. I’m trying to develop a model for anomaly detection (network attacks), but the dataset contains normal data less than attack (abnormal data) if I consider binary classification. Normal data is represented by 0 and Attacks are by 1.
In this case, can I make a subset from the csv file containing normal data 99% and abnormal data 1% for training set?
If yes, for testing set what percentage should I use for normal and abnormal data?
Are you doing binary classification? If so, the same algorithm works just as it is. The X in the sample code is not necessarily a single-column matrix.
Could you advise with a function that read from excel file or csv file my dataset: rows represent the samples and the columns are the feature, a matrix 200*6. To import it as trainsX in the above codes.
Regarding importing my dataset to the model instead of the above dataset generated using make_classification and train_test_split, as I imported my dataset (training) to model.fit. I couldn’t understand how to assign the label to the samples.
In another world, how to put my label in the code, I have the training (1000) and testing (1000) samples (6 feature), I generate a vector of zeros to label the training samples, and a vector of zeros of ones and zeros to label the test data, but I think the code didn’t sense my labeling because I always receive f1_score 1.000
You should not label your training samples as 1, but label certain class as 1. For example, if your data is to predict student’s exam score based on their homework scores, then you need to convert the exam score into labels, e.g., score > 50 is 1 (pass) and otherwise is 0. In this way, you are building two classes of students.
A simplest way is to use pandas read_csv() or read_excel() function; then you can convert the pandas DataFrame back to numpy array using the dataframe.values attribute
nu should be approximately the ratio of outliers in the data. But you should experiment to verify what is the best value. For the polynomial degree, it is the trade-off between underfitting and overfitting. Try a lower degree first and increase it only if the accuracy is not sufficient.
I have a question, my dataset is already split to train and test and the train doesn’t have any abnormal examples. The test contains normal and abnormal examples. Is this the one-class classification? And should I train my model on the dataset without any changes or resplit the train and test?
Should the train contain any example that belongs to the abnormal class? Or I can apply the one-class classification with only normal examples in the training set?
Yes, it is one-class classification. For the rest of your question, it is best for you to try it out and look at the accuracy. If you have training data not representative of the testing data, you will find that your validation score is low while your training score is good.
and as optimization is the main concept of machine learning, the max iteration field is it affect OCC?
in another word, the iteration in OCC I think is always 1, as here is the concept is to specify the percentage of the outlier. And there is no weight here to tune (no cost function to optimize).
I think it is a bit difficult because scikit-learn does not allow you to inject a scoring function in the middle of its training iterations. You can, however, copy scikit-learn’s code and modify it to add the print statements.
Hi,
Thanks for detailed explanation!
I have a question – My dataset has only one-class target variable and I want to find the importance variables.
Is there any way to find the importance of variables for such kind of dataset?
Thanks for this article. I’m working on anomaly detection. I’m getting results similar to those.
Why does F1 score is that low ? How can be improved, please?
Hi James Carmichael,
Thank you for your informative posts on machine learning.
I followed your advice on using an ensemble of one-class classification for better results. I used the stacking ensemble posted here https://machinelearningmastery.com/stacking-ensemble-machine-learning-with-python/.
Specifically, I use the one-class classifiers ( OSVM, IF, LOF..etc) as single classifiers and I use Logistic regression (LogisticRegression()) as the meta classifier.
However, after many trials, I get a lot of errors. Based on the errors I think Logistic regression may not be compatible with one-class classifiers to be their meta classifier. Is my method correct? what is your advice?
Thank you very much in advance.
To clearly explain the errors, when in the model-evaluate method I fit the single classifiers on only the train_x (model.fit(train_X)), it works fine for the single classifiers as they are one-class classifiers but then for the stacking method gives this error ( ” fit() missing 1 required positional argument: ‘y’ “) that means stacking ensemble needs (train_x and train_y) for training and when I change it to ( model.fit(train_X, train_y) ) for the sake of the ensemble I get the error (“ValueError: The estimator OneClassSVM should be a classifier.”). Hope I have explained it well and looking forward to getting your advice. Thank you
Why use the F1 coefficient at all here? It is unsuitable for unbalanced classes. MCC Score is much better “fit”. Also, the demonstrated results are quite meager. Can you please update the article and your knowledge on the topic with my research. I know asking like that is pretty sh**y from my side, but I can get F1 score on the KDDCUP 99 set north of 0.8 while using only “self” packets for training.
If interested, try searching for Negative Selection Neural Network (NSNN) by Marin E. Pamukov. I would love to read a HOWTO guide on my algorithm written by you.


")
")

")
Nice article…
I am new to ML…
How to achieve the anomaly detection/ one class classification in images?
Perhaps try using the methods described above – although as-is, without the two class datasets.
Could you please explain choice of hyper parameter “nu”? hyperparameter “nu” that controls the sensitivity of the support vectors and should be tuned to the approximate ratio of outliers in the data, e.g. 0.01%. ratio of one class to other is 1:999 which is 0.001 or 0.1 percent. Why choose 0.01%?
Good question.
It is supposed to be related to the ratio of outliers, although this can be hard to estimate and I recommend testing different values to discover what works for your dataset.
f1_score returns a value between 0 and 1, and a high value for f1_score means better result,
Also, the pos_label parameter lets you specify which class should be considered “positive” for the sake of this computation. you defined the parameter pos_label with -1 whereas in your examples, the majority of data are labeled by 1.
So I think the results arent true, you should change the value of pos_label parameter to 1
score = f1_score(testy, yhat, pos_label=-1)
score = f1_score(testy, yhat, pos_label=1)
The minority class are outliers and are marked as -1, therefore we set the pos_label to -1 when calculating F1.
If we set the pos_label to 1, then we would invert the positive-negative class relationship and give incorrect results.
Thank you for sharing your great expert.
I’m trying to find outliers from a dataset with 60 features and 180 observations. With isolation Forest approach which is unsupervised:
1- I don’t have any idea about actual outliers, so cannot separate them to inliers ant outliers, can I run the model on a mixed observations? What you suggest?
2/ How can determine contamination rate?
2- How can I get confident that reported outliers are accurate when I don’t have any targets to test the model?
Sorry for multiple questions and thank you again.
The approach does assume that you have some outliers in your data and can confirm/deny them when a model makes a suggestion.
Perhaps you don’t have outliers?
Thank you.
I don’t have outliers.
I used isolation random forest to find outliers. Next, split dataset to train, test. Next, removed outliers and trained the model on pure training set. Then, used trained model to find outliers from test set, and estimate F score.
Ionosphere sure if this is the best method.
If you don’t have outliers, why go looking for them?
I am not sure if this is the best method.
There are no “best” methods, only the methods we test given the time and resources we have available.
Dear Jason,
There are outliers, and I employed unsupervised isolation random forest to find them.
I found some outliers.
How can I check whether they are really outliers or not?
That is a hard question!
Perhaps try plotting the data with inliers vs outliers?
Perhaps try reviewing stats for inliers vs outliers?
Perhaps talk to domain experts?
Thank you for suggestions
You’re welcome.
Thank you for this useful tutorial!
I have one question: how can I fit any of these methods on the minority class instead? It seems that all the above classifiers have the outlier or contamination ratio that is in the [0,1) range. But, if fitted on the minority class, this ratio is more than 1. Can any of the mentioned classifiers be fitted on the minority class, or I should try some other methods for such a problem? Thank you!
Modeling the majority class as outliers to the minority class does not make sense to me, why would you do this?
With the data that I have, abnormal class is the majority class. It has a distribution that is all over the place and doesn’t have a consistent pattern. My normal class has less data and it is less scattered in the feature space. That’s why I think fitting a model to the minority class, which in my case is the normal class, makes more sense. Do you have any thoughts on that?
Fascinating!
Fair enough, try flipping the labels/model and see if it works for your data. Eager to hear how you go.
Hello. 1% of my data is discarded and the rest is normal.
The Recall value is very low. What should be done after these steps?
I don’t understand what you came up with. Will the work end here?
This framework will help you work through your imbalanced classification dataset:
https://machinelearningmastery.com/framework-for-imbalanced-classification-projects/
As I mentioned before, my problem is how to define a hyperparameter like “nu” in one class svm, or “contamination” factor in some other methods. These hyperparameters are in (0,1) range. But, if I want to train on the normal data, that has a more consistent pattern in the feature space, the ratio of abnormal to normal is higher than 1 (as I mentioned I have more anomaly than normal data). Is there any other approach to try here?
No idea, never done it. You will have to experiment and discover what methods or framing of the problem are appropriate. It might require some creative thinking…
In the LOF method, you reached F1-score=0.13. What can be concluded from this output?
Was the LOF method appropriate or not?
In general, how do you evaluate these methods that you mentioned in this section?
Nothing really, I am just demonstrating the methods rather than trying to solve a problem efficiently.
Great question! Choose a metric and use that to interpret all your methods:
https://machinelearningmastery.com/tour-of-evaluation-metrics-for-imbalanced-classification/
Is it possible in this case to tell your interpretation of the output and performance of LOF?
Because my data is very unbalanced and the Fscore is very, very low
I recommend testing each approach on your dataset and discover what works best in your specific case.
Dear Jason,
I am trying to use one-class classification, but I have labels only for my minority class! Are there any algorithms that would work in that case?
Thanks!
Yes, throw all the data at the algorithm, it will do its best to identify the outliers.
Thank you for this useful tutorial.
I have a doubt and i would like to give small details about my data before asking it. I am working on signal classification problems where i have two types of signals with almost same envelope and the abnormal class has time delays and attenuation compared to normal class. I have been trying to implement OCSVM and One class CNN (OCCNN) as mentioned in this article(https://arxiv.org/pdf/1901.08688.pdf). I am initializing the network with few (8 to 12 thousands) of signals belongs to normal class and i am getting some satisfactory results in testing phase with OCSVM. But i can’t get prediction of abnormal signals using OCCNN.
Here i give a brief about OCCNN: It uses pre-trained ALexNet or VggNet models with ImageNet models up to feature extraction stage by freezing dense network. To these half networks, single class data such as normal class data is fed to extract features and these features are appended with psuedonegative class data generated from zero mean Gaussian distribution and fed to dense layers as binary classification problem.
Can you please suggest me how should i proceed to achieve classification using OCCNN.
Thank you.
Sorry, I am not familiar with the technique off the cuff, not sure how I can help exactly. It sounds like you need to debug your implementation or find an existing implementation that you can adopt.
Can we use one-class classification for multi-label data also?
Not sure that it would be appropriate.
Sorry by multi-label I mean multi-class..
its is possible to combine one class svm with one vs one/rest to solve multi class problem?
Perhaps. How might that work?
Congratulations for the very rich and interesting material!
I just have a question regarding the low F-1 scores. Are these really expected to be that low?
Moreover, are there any additional metrics to assess the performance of the model?
Kind regards.
Thanks!
This tutorial will help you with metrics:
https://machinelearningmastery.com/tour-of-evaluation-metrics-for-imbalanced-classification/
The no skill baseline for PR-AUC curve is 0.01 in this case(percentage of positive class).
It’s different from ROC-AUC curves,where the no skill baseline is 0.5.So, any value of
precision above 0.01 is better then the naive classifier.
https://machinelearningmastery.com/roc-curves-and-precision-recall-curves-for-imbalanced-classification/
Could we use One-class classification algorithms for classification of audio signals. Audio signals are collected from gas turbine combustors. The audio signals mostly refer to normal operating condition. It is desired to develop system for detection of anomaly.
I don’t see why not.
Hi…
Is it possible to explain the sentence you wrote?
(It also suggests that the one-class classifier could provide an input to an ensemble of algorithms, each of which uses the training dataset in different ways.)
That is, to be used as meta_classifier? How? Do you have an example?
I’m suggesting that you can use the output of one-class models as input in an ensemble.
I have hundreds of examples of ensembles on the blog, perhaps start with a stacking ensemble:
https://machinelearningmastery.com/stacking-ensemble-machine-learning-with-python/
Hello, this is a great tutorial and an overview of available methods! Do you by any chance know how similar methods could be implemented using Keras or Tensorflow? In my project TFX (Tensorflow Extended) is used as a framework for creating and deploying ML model, thus I’m limited to it when building a model. Or maybe you could help me understand how one-class SVM or isolation forest could be implemented in Keras/Tensorflow API?
No.
Why not use these methods directly?
I would, but the TFX framework is enforcing the model to be in format of either Tensorflow’s Estimator or Keras’ Model – I can’t find (or I’m not aware of) a way to transform model built with sklearn to the one accepted in TFX pipeline.
Sorry, I have not heard of “TFX”, I cannot give you advice about it.
Awesome article. Thanks for the lesson.
Thanks!
Hi Jason,
Thanks for the great articles and summarizing lot of things in one page.
1) For the unsupervised methods like clustering, we wouldn’t need any training data nor a target variable. But in this one-class classification problems, looks like we need to have the training data and also a target class. A little confused why it comes under unsupervised learning when we still need to train.
2) You have mentioned -“A one-class classifier is fit on a training dataset that only has examples from the normal class.”.
This means we have to make sure we don’t have any outliers in the training data. Say if have 1000 samples in training dat, we have to make sure that we don’t have any outliers in this 1000 samples?
Yes, these are unsupervised methods that we are forcing to be supervised. You do not need to use them this way, for example:
https://machinelearningmastery.com/model-based-outlier-detection-and-removal-in-python/
could you please tell me how can i find an example code for artificial neural network in python for such a application?
Sure, right here:
https://machinelearningmastery.com/cost-sensitive-neural-network-for-imbalanced-classification/
Hi Jason,
Many thanks for this article. I have an unlabelled dataset where I’m running one class SVM to detect inliers and outliers. Would you know how I can validate the model in this case given there is no ground truth? Thanks!
Yes, you can find a subject matter expert for your domain and get their expert opinions on the results.
Quick note: for Isolation forest, I got the warning “252: FutureWarning: ‘behaviour’ is deprecated in 0.22 and will be removed in 0.24. You should not pass or set this parameter.”
You can safely ignore for now.
Hey jason!
Great article.
I am training one class svm model but there is only one class data for testing also. How can i measure performance of model using true positive and false negative values. Thanks!
Perhaps you can get examples of both classes from your domain to train and evaluate your model.
Perhaps this will help you choose a metric:
https://machinelearningmastery.com/tour-of-evaluation-metrics-for-imbalanced-classification/
I read this article. But in my case i have only one class data for training and testing. So, how can i measure the performance of my oneClassSVM model?
Choose a metric that best captures what is important to you or your project stakeholders about your model.
Perhaps it is the number of correctly identified outliers detected?
If you have no examples of outliers, how do you know you have a problem that requires modeling?
Hello, I just started learning ML and now I have an imbalanced dataset with almost 15 features;
the minority class (+) is important to me but I didn’t find meaningful correlations between the features and the label.
Can I use OCC for my classification?
Perhaps try it and compare results to other methods.
Hi Sir!
Can these techniques be applied to multivariate time-series data as well?
No, I don’t believe they would be appropriate for time series.
Hi Jason,
Thanks for this helpful post.
I am new in ML. I’m trying to develop a model for anomaly detection (network attacks), but the dataset contains normal data less than attack (abnormal data) if I consider binary classification. Normal data is represented by 0 and Attacks are by 1.
In this case, can I make a subset from the csv file containing normal data 99% and abnormal data 1% for training set?
If yes, for testing set what percentage should I use for normal and abnormal data?
Thanks.
The test set should be large enough to be representative of the problem.
Perhaps try repeated stratified k-fold cross-validation instead.
Thank you
You’re welcome.
Hi Sir,
thank you for this article.
can you please give an example with one class image data?
thank you
Thanks for the suggestion.
Hi Jason,
Thank you for your amazing tutorial.
If there are 4 or 5 features for my dataset, how can I import them to the above algorithms?
Thank you
Are you doing binary classification? If so, the same algorithm works just as it is. The X in the sample code is not necessarily a single-column matrix.
Could you advise with a function that read from excel file or csv file my dataset: rows represent the samples and the columns are the feature, a matrix 200*6. To import it as trainsX in the above codes.
its type is numpy.ndarray
Regarding importing my dataset to the model instead of the above dataset generated using make_classification and train_test_split, as I imported my dataset (training) to model.fit. I couldn’t understand how to assign the label to the samples.
In another world, how to put my label in the code, I have the training (1000) and testing (1000) samples (6 feature), I generate a vector of zeros to label the training samples, and a vector of zeros of ones and zeros to label the test data, but I think the code didn’t sense my labeling because I always receive f1_score 1.000
You should not label your training samples as 1, but label certain class as 1. For example, if your data is to predict student’s exam score based on their homework scores, then you need to convert the exam score into labels, e.g., score > 50 is 1 (pass) and otherwise is 0. In this way, you are building two classes of students.
A simplest way is to use pandas read_csv() or read_excel() function; then you can convert the pandas DataFrame back to numpy array using the dataframe.values attribute
could you advise how to optimize the learning parameter of one-class SVM (nu), and the polynomial degree?
nu should be approximately the ratio of outliers in the data. But you should experiment to verify what is the best value. For the polynomial degree, it is the trade-off between underfitting and overfitting. Try a lower degree first and increase it only if the accuracy is not sufficient.
Thank you for the great explanation!
I have a question, my dataset is already split to train and test and the train doesn’t have any abnormal examples. The test contains normal and abnormal examples. Is this the one-class classification? And should I train my model on the dataset without any changes or resplit the train and test?
Should the train contain any example that belongs to the abnormal class? Or I can apply the one-class classification with only normal examples in the training set?
Yes, it is one-class classification. For the rest of your question, it is best for you to try it out and look at the accuracy. If you have training data not representative of the testing data, you will find that your validation score is low while your training score is good.
Thank you for your continuous support
regarding the main function attributes
sklearn.svm.OneClassSVM(*, kernel=’rbf’, degree=3, gamma=’scale’, coef0=0.0, tol=0.001, nu=0.5, shrinking=True, cache_size=200, verbose=False, max_iter=- 1)
and as optimization is the main concept of machine learning, the max iteration field is it affect OCC?
in another word, the iteration in OCC I think is always 1, as here is the concept is to specify the percentage of the outlier. And there is no weight here to tune (no cost function to optimize).
is it correct?
The cost function is illustrated here (and read the original paper for more detail): https://stats.stackexchange.com/questions/346322/sch%C3%B6lkopfs-one-class-svm-role-of-rho-in-the-cost-function
So simply, it is not correct. There is cost for you to optimize (i.e., the boundary) and the max iteration is infinite as long as the cost can still improve.
Ok
could I print the number of iteration and the boundary ( from sklearn.svm.OneClassSVM function), to see how they converge?
I think it is a bit difficult because scikit-learn does not allow you to inject a scoring function in the middle of its training iterations. You can, however, copy scikit-learn’s code and modify it to add the print statements.
How can I make a feature selection for this kind of models?
Hi Francisco…The following resources may be of interest to you:
https://machinelearningmastery.com/feature-selection-for-regression-data/
https://machinelearningmastery.com/feature-selection-with-real-and-categorical-data/
Hi,
Thanks for detailed explanation!
I have a question – My dataset has only one-class target variable and I want to find the importance variables.
Is there any way to find the importance of variables for such kind of dataset?
Hi Abhijit…The following will hopefully provide more clarity:
https://machinelearningmastery.com/feature-selection-with-categorical-data/
Hi!
Thanks for this article. I’m working on anomaly detection. I’m getting results similar to those.
Why does F1 score is that low ? How can be improved, please?
Hi Tarek…The following should add clarity to make improvements.
https://www.analyticsvidhya.com/blog/2020/10/improve-class-imbalance-class-weights/
Thank you!!!!
Hi James Carmichael,
Thank you for your informative posts on machine learning.
I followed your advice on using an ensemble of one-class classification for better results. I used the stacking ensemble posted here https://machinelearningmastery.com/stacking-ensemble-machine-learning-with-python/.
Specifically, I use the one-class classifiers ( OSVM, IF, LOF..etc) as single classifiers and I use Logistic regression (LogisticRegression()) as the meta classifier.
However, after many trials, I get a lot of errors. Based on the errors I think Logistic regression may not be compatible with one-class classifiers to be their meta classifier. Is my method correct? what is your advice?
Thank you very much in advance.
Hello shSam…What are the errors you are encountering?
I get the results of the single classifiers ( mean of accuracy and standard deviation ) below
>OCSVM 0.403 (0.019)
>IF 0.384 (0.024)
>EE 0.394 (0.019)
> Stacking
ValueError: The estimator OneClassSVM should be a classifier.
To clearly explain the errors, when in the model-evaluate method I fit the single classifiers on only the train_x (model.fit(train_X)), it works fine for the single classifiers as they are one-class classifiers but then for the stacking method gives this error ( ” fit() missing 1 required positional argument: ‘y’ “) that means stacking ensemble needs (train_x and train_y) for training and when I change it to ( model.fit(train_X, train_y) ) for the sake of the ensemble I get the error (“ValueError: The estimator OneClassSVM should be a classifier.”). Hope I have explained it well and looking forward to getting your advice. Thank you
Thanks for this Article. Helped a lot.
You are very welcome Anil!
Hi, Jason. I Have a doubt regarding the anamoly class. what if I have only one class to train but to generalize two classes.
Thank you for this post.
Do you know anything about One-Class CNNs and could you do a tutorial about it?
Hi Shamsheer…The following resources may be of interest:
https://stackoverflow.com/questions/61048870/can-i-build-a-one-class-cnn-in-keras
https://arxiv.org/abs/1901.08688
Why use the F1 coefficient at all here? It is unsuitable for unbalanced classes. MCC Score is much better “fit”. Also, the demonstrated results are quite meager. Can you please update the article and your knowledge on the topic with my research. I know asking like that is pretty sh**y from my side, but I can get F1 score on the KDDCUP 99 set north of 0.8 while using only “self” packets for training.
If interested, try searching for Negative Selection Neural Network (NSNN) by Marin E. Pamukov. I would love to read a HOWTO guide on my algorithm written by you.
Thank you for your feedback Marin! We appreciate it!