Deep learning neural networks learn how to map inputs to outputs from examples in a training dataset.
The weights of the model are initialized to small random values and updated via an optimization algorithm in response to estimates of error on the training dataset.
Given the use of small weights in the model and the use of error between predictions and expected values, the scale of inputs and outputs used to train the model are an important factor. Unscaled input variables can result in a slow or unstable learning process, whereas unscaled target variables on regression problems can result in exploding gradients causing the learning process to fail.
Data preparation involves using techniques such as the normalization and standardization to rescale input and output variables prior to training a neural network model.
In this tutorial, you will discover how to improve neural network stability and modeling performance by scaling data.
After completing this tutorial, you will know:
Data scaling is a recommended pre-processing step when working with deep learning neural networks.
Data scaling can be achieved by normalizing or standardizing real-valued input and output variables.
How to apply standardization and normalization to improve the performance of a Multilayer Perceptron model on a regression predictive modeling problem.
Kick-start your project with my new book Better Deep Learning, including step-by-step tutorials and the Python source code files for all examples.
Let’s get started.
How to Improve Neural Network Stability and Modeling Performance With Data Scaling Photo by Javier Sanchez Portero, some rights reserved.
Tutorial Overview
This tutorial is divided into six parts; they are:
The Scale of Your Data Matters
Data Scaling Methods
Regression Predictive Modeling Problem
Multilayer Perceptron With Unscaled Data
Multilayer Perceptron With Scaled Output Variables
Multilayer Perceptron With Scaled Input Variables
The Scale of Your Data Matters
Deep learning neural network models learn a mapping from input variables to an output variable.
As such, the scale and distribution of the data drawn from the domain may be different for each variable.
Input variables may have different units (e.g. feet, kilometers, and hours) that, in turn, may mean the variables have different scales.
Differences in the scales across input variables may increase the difficulty of the problem being modeled. An example of this is that large input values (e.g. a spread of hundreds or thousands of units) can result in a model that learns large weight values. A model with large weight values is often unstable, meaning that it may suffer from poor performance during learning and sensitivity to input values resulting in higher generalization error.
One of the most common forms of pre-processing consists of a simple linear rescaling of the input variables.
A target variable with a large spread of values, in turn, may result in large error gradient values causing weight values to change dramatically, making the learning process unstable.
Scaling input and output variables is a critical step in using neural network models.
In practice it is nearly always advantageous to apply pre-processing transformations to the input data before it is presented to a network. Similarly, the outputs of the network are often post-processed to give the required output values.
The input variables are those that the network takes on the input or visible layer in order to make a prediction.
A good rule of thumb is that input variables should be small values, probably in the range of 0-1 or standardized with a zero mean and a standard deviation of one.
Whether input variables require scaling depends on the specifics of your problem and of each variable.
You may have a sequence of quantities as inputs, such as prices or temperatures.
If the distribution of the quantity is normal, then it should be standardized, otherwise the data should be normalized. This applies if the range of quantity values is large (10s, 100s, etc.) or small (0.01, 0.0001).
If the quantity values are small (near 0-1) and the distribution is limited (e.g. standard deviation near 1) then perhaps you can get away with no scaling of the data.
Problems can be complex and it may not be clear how to best scale input data.
If in doubt, normalize the input sequence. If you have the resources, explore modeling with the raw data, standardized data, and normalized data and see if there is a beneficial difference in the performance of the resulting model.
If the input variables are combined linearly, as in an MLP [Multilayer Perceptron], then it is rarely strictly necessary to standardize the inputs, at least in theory. […] However, there are a variety of practical reasons why standardizing the inputs can make training faster and reduce the chances of getting stuck in local optima.
The output variable is the variable predicted by the network.
You must ensure that the scale of your output variable matches the scale of the activation function (transfer function) on the output layer of your network.
If your output activation function has a range of [0,1], then obviously you must ensure that the target values lie within that range. But it is generally better to choose an output activation function suited to the distribution of the targets than to force your data to conform to the output activation function.
If your problem is a regression problem, then the output will be a real value.
This is best modeled with a linear activation function. If the distribution of the value is normal, then you can standardize the output variable. Otherwise, the output variable can be normalized.
Want Better Results with Deep Learning?
Take my free 7-day email crash course now (with sample code).
Click to sign-up and also get a free PDF Ebook version of the course.
Data Scaling Methods
There are two types of scaling of your data that you may want to consider: normalization and standardization.
These can both be achieved using the scikit-learn library.
Data Normalization
Normalization is a rescaling of the data from the original range so that all values are within the range of 0 and 1.
Normalization requires that you know or are able to accurately estimate the minimum and maximum observable values. You may be able to estimate these values from your available data.
A value is normalized as follows:
1
y = (x - min) / (max - min)
Where the minimum and maximum values pertain to the value x being normalized.
For example, for a dataset, we could guesstimate the min and max observable values as 30 and -10. We can then normalize any value, like 18.8, as follows:
1
2
3
4
y = (x - min) / (max - min)
y = (18.8 - (-10)) / (30 - (-10))
y = 28.8 / 40
y = 0.72
You can see that if an x value is provided that is outside the bounds of the minimum and maximum values, the resulting value will not be in the range of 0 and 1. You could check for these observations prior to making predictions and either remove them from the dataset or limit them to the pre-defined maximum or minimum values.
You can normalize your dataset using the scikit-learn object MinMaxScaler.
Good practice usage with the MinMaxScaler and other scaling techniques is as follows:
Fit the scaler using available training data. For normalization, this means the training data will be used to estimate the minimum and maximum observable values. This is done by calling the fit() function.
Apply the scale to training data. This means you can use the normalized data to train your model. This is done by calling the transform() function.
Apply the scale to data going forward. This means you can prepare new data in the future on which you want to make predictions.
The default scale for the MinMaxScaler is to rescale variables into the range [0,1], although a preferred scale can be specified via the “feature_range” argument and specify a tuple including the min and the max for all variables.
1
2
# create scaler
scaler=MinMaxScaler(feature_range=(-1,1))
If needed, the transform can be inverted. This is useful for converting predictions back into their original scale for reporting or plotting. This can be done by calling the inverse_transform() function.
The example below provides a general demonstration for using the MinMaxScaler to normalize data.
1
2
3
4
5
6
7
8
9
10
11
12
# demonstrate data normalization with sklearn
from sklearn.preprocessing import MinMaxScaler
# load data
data=...
# create scaler
scaler=MinMaxScaler()
# fit scaler on data
scaler.fit(data)
# apply transform
normalized=scaler.transform(data)
# inverse transform
inverse=scaler.inverse_transform(normalized)
You can also perform the fit and transform in a single step using the fit_transform() function; for example:
1
2
3
4
5
6
7
8
9
10
# demonstrate data normalization with sklearn
from sklearn.preprocessing import MinMaxScaler
# load data
data=...
# create scaler
scaler=MinMaxScaler()
# fit and transform in one step
normalized=scaler.fit_transform(data)
# inverse transform
inverse=scaler.inverse_transform(normalized)
Data Standardization
Standardizing a dataset involves rescaling the distribution of values so that the mean of observed values is 0 and the standard deviation is 1. It is sometimes referred to as “whitening.”
This can be thought of as subtracting the mean value or centering the data.
Like normalization, standardization can be useful, and even required in some machine learning algorithms when your data has input values with differing scales.
Standardization assumes that your observations fit a Gaussian distribution (bell curve) with a well behaved mean and standard deviation. You can still standardize your data if this expectation is not met, but you may not get reliable results.
Standardization requires that you know or are able to accurately estimate the mean and standard deviation of observable values. You may be able to estimate these values from your training data.
We can guesstimate a mean of 10 and a standard deviation of about 5. Using these values, we can standardize the first value of 20.7 as follows:
1
2
3
4
y = (x - mean) / standard_deviation
y = (20.7 - 10) / 5
y = (10.7) / 5
y = 2.14
The mean and standard deviation estimates of a dataset can be more robust to new data than the minimum and maximum.
You can standardize your dataset using the scikit-learn object StandardScaler.
1
2
3
4
5
6
7
8
9
10
11
12
# demonstrate data standardization with sklearn
from sklearn.preprocessing import StandardScaler
# load data
data=...
# create scaler
scaler=StandardScaler()
# fit scaler on data
scaler.fit(data)
# apply transform
standardized=scaler.transform(data)
# inverse transform
inverse=scaler.inverse_transform(standardized)
You can also perform the fit and transform in a single step using the fit_transform() function; for example:
1
2
3
4
5
6
7
8
9
10
# demonstrate data standardization with sklearn
from sklearn.preprocessing import StandardScaler
# load data
data=...
# create scaler
scaler=StandardScaler()
# fit and transform in one step
standardized=scaler.fit_transform(data)
# inverse transform
inverse=scaler.inverse_transform(standardized)
Regression Predictive Modeling Problem
A regression predictive modeling problem involves predicting a real-valued quantity.
We can use a standard regression problem generator provided by the scikit-learn library in the make_regression() function. This function will generate examples from a simple regression problem with a given number of input variables, statistical noise, and other properties.
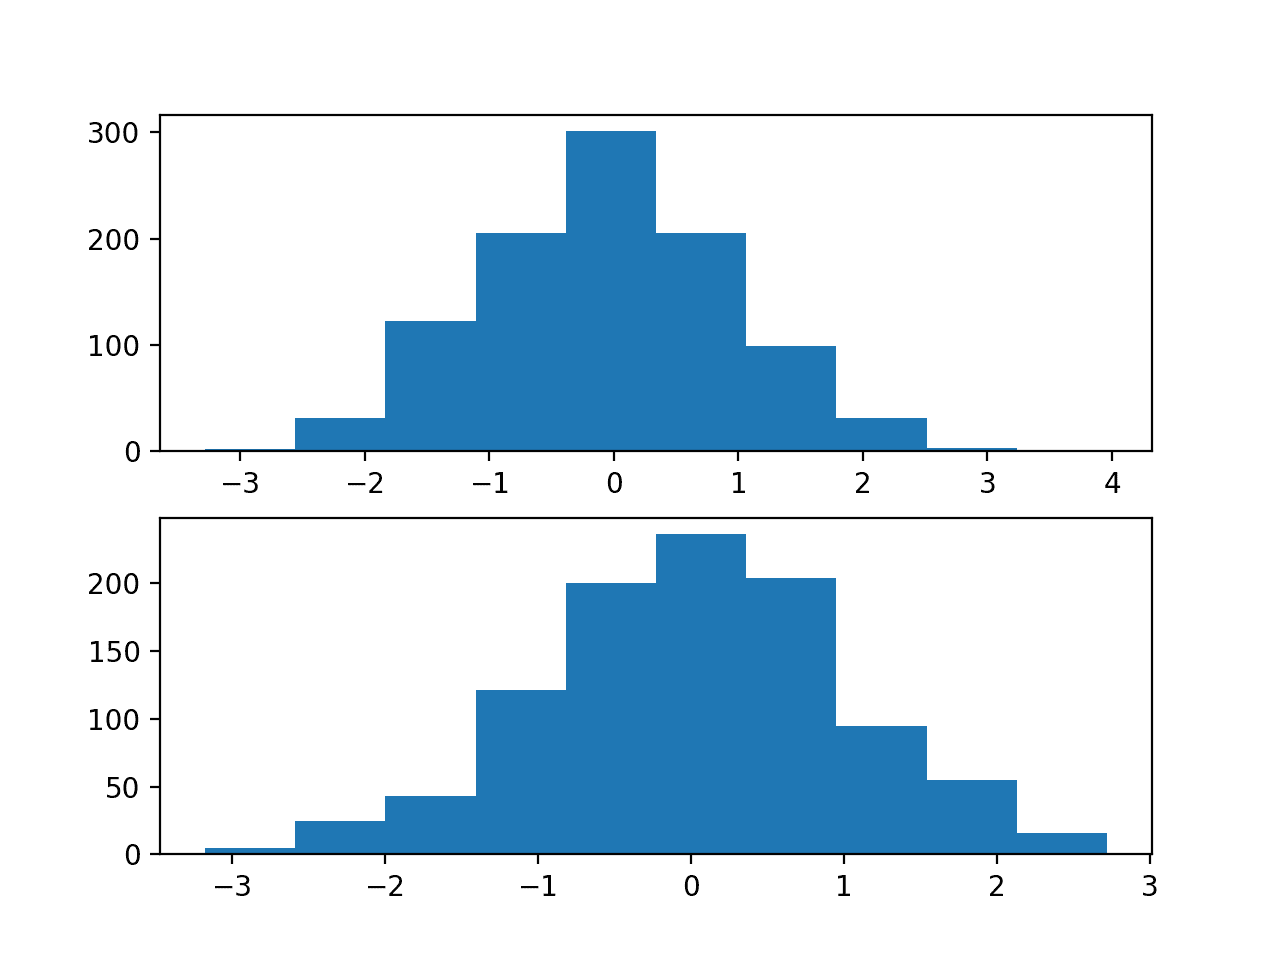
We will use this function to define a problem that has 20 input features; 10 of the features will be meaningful and 10 will not be relevant. A total of 1,000 examples will be randomly generated. The pseudorandom number generator will be fixed to ensure that we get the same 1,000 examples each time the code is run.
The first shows histograms of the first two of the twenty input variables, showing that each has a Gaussian data distribution.
Histograms of Two of the Twenty Input Variables for the Regression Problem
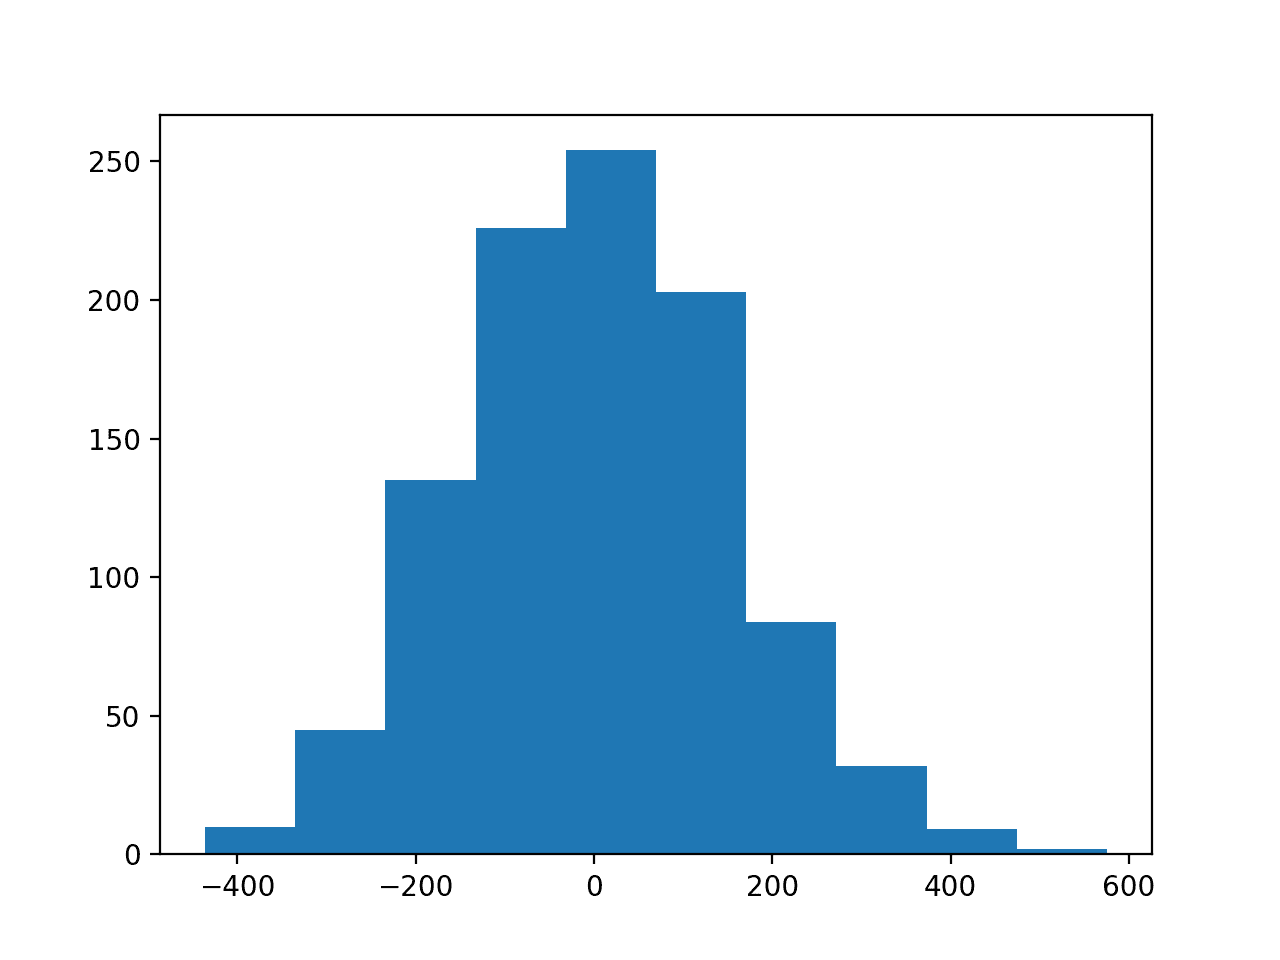
The second figure shows a histogram of the target variable, showing a much larger range for the variable as compared to the input variables and, again, a Gaussian data distribution.
Histogram of the Target Variable for the Regression Problem
Now that we have a regression problem that we can use as the basis for the investigation, we can develop a model to address it.
Multilayer Perceptron With Unscaled Data
We can develop a Multilayer Perceptron (MLP) model for the regression problem.
A model will be demonstrated on the raw data, without any scaling of the input or output variables. We expect that model performance will be generally poor.
The first step is to split the data into train and test sets so that we can fit and evaluate a model. We will generate 1,000 examples from the domain and split the dataset in half, using 500 examples for the train and test datasets.
1
2
3
4
# split into train and test
n_train=500
trainX,testX=X[:n_train,:],X[n_train:,:]
trainy,testy=y[:n_train],y[n_train:]
Next, we can define an MLP model. The model will expect 20 inputs in the 20 input variables in the problem.
A single hidden layer will be used with 25 nodes and a rectified linear activation function. The output layer has one node for the single target variable and a linear activation function to predict real values directly.
The mean squared error loss function will be used to optimize the model and the stochastic gradient descent optimization algorithm will be used with the sensible default configuration of a learning rate of 0.01 and a momentum of 0.9.
The model will be fit for 100 training epochs and the test set will be used as a validation set, evaluated at the end of each training epoch.
The mean squared error is calculated on the train and test datasets at the end of training to get an idea of how well the model learned the problem.
1
2
3
# evaluate the model
train_mse=model.evaluate(trainX,trainy,verbose=0)
test_mse=model.evaluate(testX,testy,verbose=0)
Finally, learning curves of mean squared error on the train and test sets at the end of each training epoch are graphed using line plots, providing learning curves to get an idea of the dynamics of the model while learning the problem.
Running the example fits the model and calculates the mean squared error on the train and test sets.
In this case, the model is unable to learn the problem, resulting in predictions of NaN values. The model weights exploded during training given the very large errors and, in turn, error gradients calculated for weight updates.
1
Train: nan, Test: nan
This demonstrates that, at the very least, some data scaling is required for the target variable.
A line plot of training history is created but does not show anything as the model almost immediately results in a NaN mean squared error.
Multilayer Perceptron With Scaled Output Variables
The MLP model can be updated to scale the target variable.
Reducing the scale of the target variable will, in turn, reduce the size of the gradient used to update the weights and result in a more stable model and training process.
Given the Gaussian distribution of the target variable, a natural method for rescaling the variable would be to standardize the variable. This requires estimating the mean and standard deviation of the variable and using these estimates to perform the rescaling.
It is best practice is to estimate the mean and standard deviation of the training dataset and use these variables to scale the train and test dataset. This is to avoid any data leakage during the model evaluation process.
The scikit-learn transformers expect input data to be matrices of rows and columns, therefore the 1D arrays for the target variable will have to be reshaped into 2D arrays prior to the transforms.
1
2
3
# reshape 1d arrays to 2d arrays
trainy=trainy.reshape(len(trainy),1)
testy=testy.reshape(len(trainy),1)
We can then create and apply the StandardScaler to rescale the target variable.
1
2
3
4
5
6
7
8
# created scaler
scaler=StandardScaler()
# fit scaler on training dataset
scaler.fit(trainy)
# transform training dataset
trainy=scaler.transform(trainy)
# transform test dataset
testy=scaler.transform(testy)
Rescaling the target variable means that estimating the performance of the model and plotting the learning curves will calculate an MSE in squared units of the scaled variable rather than squared units of the original scale. This can make interpreting the error within the context of the domain challenging.
In practice, it may be helpful to estimate the performance of the model by first inverting the transform on the test dataset target variable and on the model predictions and estimating model performance using the root mean squared error on the unscaled data. This is left as an exercise to the reader.
The complete example of standardizing the target variable for the MLP on the regression problem is listed below.
1
2
3
4
5
6
7
8
9
10
11
12
13
14
15
16
17
18
19
20
21
22
23
24
25
26
27
28
29
30
31
32
33
34
35
36
37
38
39
40
41
42
# mlp with scaled outputs on the regression problem
Running the example fits the model and calculates the mean squared error on the train and test sets.
Note: Your results may vary given the stochastic nature of the algorithm or evaluation procedure, or differences in numerical precision. Consider running the example a few times and compare the average outcome.
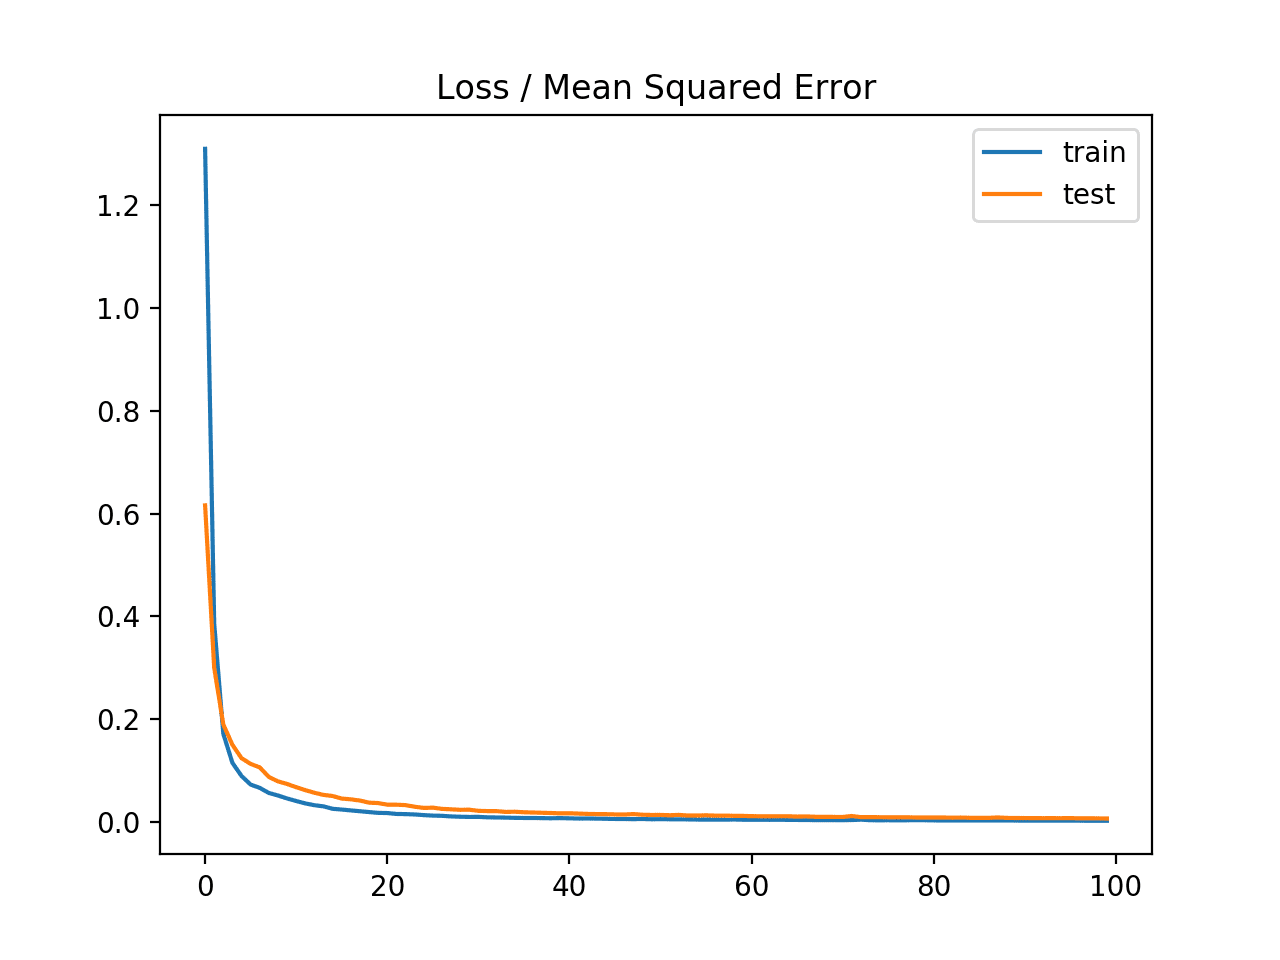
In this case, the model does appear to learn the problem and achieves near-zero mean squared error, at least to three decimal places.
1
Train: 0.003, Test: 0.007
A line plot of the mean squared error on the train (blue) and test (orange) dataset over each training epoch is created.
In this case, we can see that the model rapidly learns to effectively map inputs to outputs for the regression problem and achieves good performance on both datasets over the course of the run, neither overfitting or underfitting the training dataset.
Line Plot of Mean Squared Error on the Train a Test Datasets for Each Training Epoch
It may be interesting to repeat this experiment and normalize the target variable instead and compare results.
Multilayer Perceptron With Scaled Input Variables
We have seen that data scaling can stabilize the training process when fitting a model for regression with a target variable that has a wide spread.
It is also possible to improve the stability and performance of the model by scaling the input variables.
In this section, we will design an experiment to compare the performance of different scaling methods for the input variables.
The input variables also have a Gaussian data distribution, like the target variable, therefore we would expect that standardizing the data would be the best approach. This is not always the case.
We can compare the performance of the unscaled input variables to models fit with either standardized and normalized input variables.
The first step is to define a function to create the same 1,000 data samples, split them into train and test sets, and apply the data scaling methods specified via input arguments. The get_dataset() function below implements this, requiring the scaler to be provided for the input and target variables and returns the train and test datasets split into input and output components ready to train and evaluate a model.
1
2
3
4
5
6
7
8
9
10
11
12
13
14
15
16
17
18
19
20
21
22
23
24
25
26
27
# prepare dataset with input and output scalers, can be none
Neural networks are trained using a stochastic learning algorithm. This means that the same model fit on the same data may result in a different performance.
We can address this in our experiment by repeating the evaluation of each model configuration, in this case a choice of data scaling, multiple times and report performance as the mean of the error scores across all of the runs. We will repeat each run 30 times to ensure the mean is statistically robust.
The repeated_evaluation() function below implements this, taking the scaler for input and output variables as arguments, evaluating a model 30 times with those scalers, printing error scores along the way, and returning a list of the calculated error scores from each run.
1
2
3
4
5
6
7
8
9
10
11
# evaluate model multiple times with given input and output scalers
Finally, we can run the experiment and evaluate the same model on the same dataset three different ways:
No scaling of inputs, standardized outputs.
Normalized inputs, standardized outputs.
Standardized inputs, standardized outputs.
The mean and standard deviation of the error for each configuration is reported, then box and whisker plots are created to summarize the error scores for each configuration.
Running the example prints the mean squared error for each model run along the way.
After each of the three configurations have been evaluated 30 times each, the mean errors for each are reported.
Note: Your results may vary given the stochastic nature of the algorithm or evaluation procedure, or differences in numerical precision. Consider running the example a few times and compare the average outcome.
In this case, we can see that as we expected, scaling the input variables does result in a model with better performance. Unexpectedly, better performance is seen using normalized inputs instead of standardized inputs. This may be related to the choice of the rectified linear activation function in the first hidden layer.
1
2
3
4
5
6
7
8
9
...
>0.010
>0.012
>0.005
>0.008
>0.008
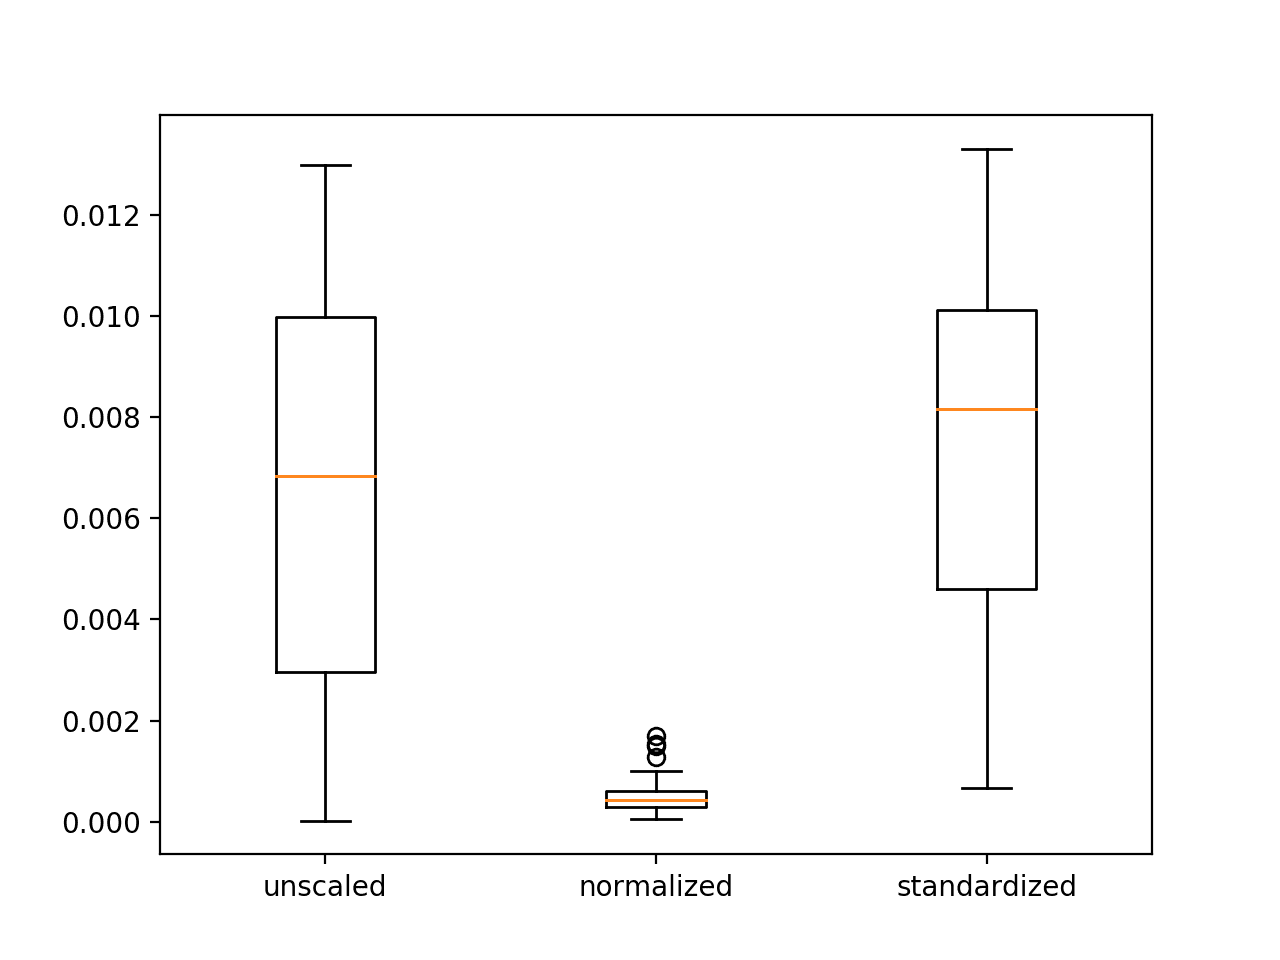
Unscaled: 0.007 (0.004)
Normalized: 0.001 (0.000)
Standardized: 0.008 (0.004)
A figure with three box and whisker plots is created summarizing the spread of error scores for each configuration.
The plots show that there was little difference between the distributions of error scores for the unscaled and standardized input variables, and that the normalized input variables result in better performance and more stable or a tighter distribution of error scores.
These results highlight that it is important to actually experiment and confirm the results of data scaling methods rather than assuming that a given data preparation scheme will work best based on the observed distribution of the data.
Box and Whisker Plots of Mean Squared Error With Unscaled, Normalized and Standardized Input Variables for the Regression Problem
Extensions
This section lists some ideas for extending the tutorial that you may wish to explore.
Normalize Target Variable. Update the example and normalize instead of standardize the target variable and compare results.
Compared Scaling for Target Variable. Update the example to compare standardizing and normalizing the target variable using repeated experiments and compare the results.
Other Scales. Update the example to evaluate other min/max scales when normalizing and compare performance, e.g. [-1, 1] and [0.0, 0.5].
If you explore any of these extensions, I’d love to know.
Further Reading
This section provides more resources on the topic if you are looking to go deeper.
In this tutorial, you discovered how to improve neural network stability and modeling performance by scaling data.
Specifically, you learned:
Data scaling is a recommended pre-processing step when working with deep learning neural networks.
Data scaling can be achieved by normalizing or standardizing real-valued input and output variables.
How to apply standardization and normalization to improve the performance of a Multilayer Perceptron model on a regression predictive modeling problem.
Do you have any questions?
Ask your questions in the comments below and I will do my best to answer.
Could you please provide more details about the steps of “using the root mean squared error on the unscaled data” to interpret the performance in a specific domain?
Would it be like this??
———————————————————–
1. Finalize the model (based on the performance being calculated from the scaled output variable)
2. Make predictions on test set
3. Invert the predictions (to convert them back into their original scale)
4. Calculate the metrics (e.g. RMSE, MAPE)
———————————————————–
If I have multiple input columns, each has different value range, might be [0, 1000] or even a one-hot-encoded data, should all be scaled with same method, or it can be processed differently?
For example:
– input A is normalized to [0, 1],
– input B is normalized to [-1, 1],
– input C is standardized,
– one-hot-encoded data is not scaled
Yes, typically it is a good idea to scale all columns to have the same range. Perhaps start with [0,1] and compare others to see if they result in an improvement.
Your experiment is very helpful for me to understand the difference between different methods, actually I have also done similar things. I always standardized the input data. I have compared the results between standardized and standardized targets. The plots shows that with standardized targets, the network seems to work better. However, here I have a question: suppose the standard deviation of my target is 300, then I think the MSE will be strongly decreased after you fixed the standard deviation to 1. So shall we multiply the original std to the MSE in order to get the MSE in the original target value space?
My data includes categorical and continued data. Could I transform the categorical data with 1,2,3…into standardized data and put them into the neural network models to make classification? Or do I need to transformr the categorical data with with one-hot coding(0,1)? I have been confused about it. Thanks
Hi Jason, I have a specific Question regarding the normalization (min-max scaling) of the output value. Usually you are supposed to use normalization only on the training data set and then apply those stats to the validation and test set. Otherwise you would feed the model at training time certain information about the world it shouldn’t have access to. (The Elements of Statistical Learning: Data Mining, Inference, and Prediction p.247)
But for instance, my output value is a single percentage value ranging [0, 100%] and I am using the ReLU activation function in my output layer. I know for sure that in the “real world” regarding my problem statement, that I will get samples ranging form 60 – 100%. But my training sample size is to small and does not contain enough data points including all possible output values. So here comes my question: Should I stay with my initial statement (normalization only on training data set) or should I apply the maximum possible value of 100% to max()-value of the normalization step? The latter would contradict the literature. Best Regards Bart
I am wondering if there is any advantage using StadardScaler or MinMaxScaler over scaling manually. I could calculate the mean, std or min, max of my training data and apply them with the corresponding formula for standard or minmax scaling.
Would this approach produce the same results as the StadardScaler or MinMaxScaler or are the sklearn scalers special?
I have a few questions from section “Data normalization”. You mention that we should estimate the max and min values, and use that to normalize the training set to e.g. [-1,1]. But what if the max and min values are in the validation or test set? Then I might get values e.g. [-1.2, 1.3] in the validation set. Do you consider this to be incorrect or not?
Another approach is then to make sure that the min and max values for all parameters are contained in the training set. What are your thoughts on this? Is this the way to do it? Or should we use the max and min values for all data combined (training, validation and test sets) when normalizing the training set?
For the moment I use the MinMaxScaler and fit_transform on the training set and then apply that scaler on the validation and test set using transform. But I realise that some of my max values are in the validation set. I suppose this is also related to network saturation.
Perhaps estimate the min/max using domain knowledge. If new data exceeded the limits, snap to known limits, or not – test and see how the model is impacted.
Regardless, the training set must be representative of the problem.
Hi Jason,
Regarding the question asked by Magnus, when we normalize the columns of the test data using the min and max values of each column of the training dataset, if there exists a value in the test set that is greater than the max or less than the min of the training set, we are to get normalized values greater than one and less than zero respectively. In this case, we’ll be feeding the model with values for which the model has not been trained. To overcome this issue, do you think it is plausible to replace negative values with zero and values greater than one with one?
Thanks.
Hello Jason, I am a huge fan of your work! Thank you so much for your insightful tutorials. You are a life saver! I have a small question if i may:
I am trying to fit spectrograms in a cnn in order to do some classification tasks. Unfortunately each spectrogram is around (3000,300) array. Is there a way to reduce the dimensionality without losing so much information?
Hi Jason,
It was always good and informative to go through your blogs and your interaction with comments by different people all across the globe.
I have question regarding the scaling techniques.
As you explained about scaling :
Case1:
# created scaler
scaler = StandardScaler()
# fit scaler on training dataset
scaler.fit(trainy)
# transform training dataset
trainy = scaler.transform(trainy)
# transform test dataset
testy = scaler.transform(testy)
in this case mean and standard deviation for all train and test remain same.
What i approached is:
case2
# created scaler
scaler_train = StandardScaler()
# fit scaler on training dataset
scaler_train.fit(trainy)
# transform training dataset
trainy = scaler_train.transform(trainy)
# created scaler
scaler_test = StandardScaler()
# fit scaler on training dataset
scaler_test.fit(trainy)
# transform test dataset
testy = scaler_test.transform(testy)
Here the mean and standard deviation in train data and test data are different.so model may find the test data completely unknown and new .rather in first case where mean and standard deviation is same on train and test data that may leads to providing the known test data to model (known in term of same mean and standard deviation treatment).
Jason,can you guide me if my logics is good to go with case2 or shall i consider case1 .
or if logic is wrong you can also say that and explain.
(Also i applied Same for min-max scaling i.e normalization, if i choose this then)
Again thanks Jason for such a nice work !
I’m working on sequence2sequence problem. Input’s max and min points are around 500-300, however output’s are 200-0. If I want to normalize them, should I use different scalers? For example:
Yes, use a separate transform for inputs and outputs is a good idea. Otherwise have them all as separate columns in the same matrix and use one scaler, but the column order for transform/inverse_transform will always have to be consistent.
Confused about one aspect, I have a small NN with 8 independent variables and one dichotomous dependent variable. I have standardized the input variables (the output variable was left untouched). I have both trained and created the final model with the same standardized data. However, the question is, if I want to create a user interface to receive manual inputs, those will no longer be in the standardized format, so what is the best way to proceed?
You must maintain the objects used to prepare the data, or the coefficients used by those objects (mean and stdev) so that you can prepare new data in an identically way to the way data was prepared during training.
I have built an ANN model and scaled my inputs and outputs before feeding to the network. I measure the performance of the model by r2_score. My output variable is height. My r2_score when the output variable is in metres is .98, but when my output variable is in centi-metres , my r2_score is .91. I have scaled my output too before feeding to the network, why is there a difference in r2_score even because the output variable is scaled before feeding to the network.
Good question, this is why it is important to test different scaling approaches in order to discover what works best for a given dataset and model combination.
Hi Jason,
I am working on sequence to data prediction problem wherein i am performing normalization on input and output both.
Once model is trained then to get the actual output in real-time, I have to perform the de-normalization and when I will perform the denorm then error will increase by the same factor I have used for normalization.
Lets consider, norm predicted output is 0.1 and error of the model is 0.01 .
denorm predicted output become 0.1*100 = 10 and after de-normalizing the error will be 0.01*100= 1
So, what will be solution to this eliminate this kind of problem in regression.
The problem is after de-normalization of the output, the error difference between actual and predicted output is scaled up by the normalization factor (max-min) So, I want to know what can be done to make the error difference same for both de-normized as well as normalized output.
Hello, i was trying to normalize/inverse transoformation in my data, but i got one error that i think its due to the resize i did in my input data. Here’s my code:
import numpy as np
import tensorflow as tf
from tensorflow import keras
import pandas as pd
import time as time
import matplotlib.pyplot as plt
import pydot
import csv as csv
import keras.backend as K
from sklearn.preprocessing import MinMaxScaler
Is there anyway i can do the inverse transform inside the model itself? Because, for example, my MSE reported at the end of each epoch would be in the “wrong” scale.
I love this tutorial. I was wondering if I can get your permission to use this tutorial, convert all its experimentation and tracking using MLflow, and include it in my tutorials I teach at conferences.
It’s a fitting example of how you can use MLFlow to track different experiments and visually compare the outcomes.
Thanks, I will certainly put the original link and plug your book too, along with your site and an excellent resource of tutorials and examples to learn from.
Amazing content Jason! I was wondering if it is possible to apply different scalers to different inputs given based on their original characteristics? I am asking you that because as you mentioned in the tutorial “Differences in the scales across input variables may increase the difficulty of the problem being modeled” Therefore, if I use standard scaler in one input and normal scaler in another it could be bad for gradient descend.
Hi Jason,
I am solving the Regression problem and my accuracy after normalizing the target variable is 92% but I have the doubt about scaling the target variable. So can you elaborate about scaling the Target variable?
Hi Jason Sir!
My data range is variable, e.g. -1500000, 0.0003456, 2387900,23,50,-45,-0.034, what should i do? i want to use MLP, 1D-CNN and SAE.
THANKS
i tried different type of normalization but got data type errors, i used “MinMaxScaler ” and also (X-min(X))/ (max(X)-min(X)), but it can’t process. I want to know about the tf.compat.v1.keras.utils.normalize() command, what it actually do? thanks
I have a question about the normalization of data. Samples from the population may be added to the dataset over time, and the attribute values for these new objects may then lie outside those you have seen so far. One possibility to handle new minimum and maximum values is to periodically renormalize the data after including the new values. Is there any normalization approach without renormalization?
Should we use “standard_deviation = sqrt( sum( (x – mean)**2 ) / count(x))” instead of “standard_deviation = sqrt( sum( (x – mean)^2 ) / count(x))”?
Does “^” sign represent square root in Python and is it fine not to subtract count (x) by 1 (in order to make it std of sample distribution, unless we have 100% observation of a population)?
I then use this data to train a deep learning model.
My question is, should I use the same scaler object, which was created using the training set, to scale my new, unseen test data before using that test set for predicting my model’s performance? Or should I create a new, separate scaler object using the test data?
Thank you for the tutorial. A question about the conclusion: I find it surprising that standardization did not yield better performance compared to the model with unscaled inputs. Shouldn’t standardization provide better convergence properties when training neural networks? It’s also surprising that min-max scaling worked so well. If all of your inputs are positive (i.e between [0, 1] in this case), doesn’t that mean ALL of your weight updates at each step will be the same sign, which leads to inefficient learning?
I am an absolute beginner into neural networks and I appreciate your helpful website. In the lecture, I learned that when normalizing a training set, one should use the same mean and standard deviation from training for the test set. But I see in your codes that you’re normalizing training and test sets individually. Is that for a specific reason?
since I saw another comment having the same question like me, I noticed that you acutally have done exactly the same thing as I expected. Since I am not familiar with the syntax yet, I got it wrong. Thanks very much!
Hai Jaison, I am a beginner in ML and I am having an issue with normalizing..
I am developing a multivariate regression model with three inputs and three outputs.
The three inputs are in the range of [700 1500] , [700-1500] and [700 1500]
The three outputs are in the range of [-0.5 0.5] , [-0.5 0.5] and [700 1500]
I have normalized everything in the range of [-1 1].
The loss at the end of 1000 epoch is in the order of 1e-4, but still, I am not satisfied with the fit of the model. Since the loss function is based on normalized target variables and normalized prediction, its value id very less from the first epoch itself.
I wonder how you apply scaling to batch data? Say we batch load from tfrecords, for each batch we fit a scaler? If so, then the final scaler is on the last batch, which will be used for test data? Also in batch data, if the batch is small, then it seems the scaler is volatile, especially for MaxMin. Would like to hear your thoughts since in a lot of practices it’s nearly impossible to load huge data into driver to do scaling.
The entire training set? What if the entire training set is too big to load in the memory? Even doing batch training, you still do scaling on the entire training set first then do batch training? That seems pretty inefficient
Yes, that’s my question. When doing batch training, do you fit (or re-fit) a scaler on each batch? If so, it seems the final scaler that will be used for scoring is fit on the final batch. Do you see any issue with that especially when batch is small? Thanks
I used your method (i did standardized my outputs and normalized my inputs with MinMaxScaler()) but i keep having the same issue : when i train my neural network with 3200 and validate with 800 everything alright, i have R2 = 99% but when i increase the training / validation set, R2 decreases which is weird, it should be even higher ? Do you think it has something to do with the scaling of the data ?
Thank you !
I have a NN with 6 input variables and one output , I employed minmaxscaler for inputs as well as outputs . My approach was applying the scaler to my whole dataset then splitting it into training and testing dataset, as I dont know the know-hows so is my approach wrong .
Currently the problem I am facing is my actual outputs are positive values but after unscaling the NN predictions I am getting negative values. I tried changing the feature range, still NN predicted negative values , so how can i solve this?
First, perhaps confirm that there is no bug in your code.
Second, it is possible for the model to predict values that get mapped to a value out of bounds. You could use a n if-statement to snap them to the required range or use a model that forces predictions to the required range.
I finish training my model and I use normalized data for inputs and outputs.
my problem now is when I need to use this model I do the following:
1- I load the model
2- normalize the inputs
3- use model to get the outputs (predicted data)
how to denormalized the output of the model ??? I don’t have the MinMaxScaler for the output ??
imagine than I finish the training phase and save the trained model named “model1”.
I send the “model1” file to a friend and he tries to use it, he will normalize the inputs and get the outputs. In this case, he doesn’t have the scaler object to recover the original values using inverse_transform().
Do you know of any textbooks or journal articles that address the input scaling issue as you’ve described it here, in addition to the Bishop textbook? I’m struggling so far in vain to find discussions of this type of scaling, when different raw input variables have much different ranges. Instead I’m finding plenty of mentions in tutorials and blog posts (of which yours is one of the clearest), and papers describing the problems of scale (size) variance in neural networks designed for image recognition.
Thank you very much for the article. I wanted to understand the following scenario
I have mix of categorical and numerical inputs. I can normalize/standardize the numerical inputs and the output numerical variable.
But in the categorical variables I have high number of categories ~3000. So I use label encoder (not one hot coding) and then I use embedding layers. How can I achieve scaling in this case.
I really enjoyed reading your article. My CNN regression network has binary image as input which the background is black, and foreground is white. The ground truth associated with each input is an image with color range from 0 to 255 which is normalized between 0 and 1.
The network can almost detect edges and background but in foreground all the predicted values are almost same. Do you have any idea what is the solution?
at the end i tried to get the predicted values: yhat = model.predict(X_test)
the problem here yhat is not the original data, it’s a transformed data and there is no inverse for normalizer.
I tried to use the minmaxScalar an order to do the inverse operation (invyhat = scaler2.inverse_transform(yhat)) but i get a big numbers compared to the y_test values that i want.
I tried to normalize just X, i get a worst result compared to the first one.
could you please help me.
example of X values : 1006.808362,13.335140,104.536458 …..
289.197205,257.489613,106.245104,566.941857…..
.
example of y values: 0.50000, 250.0000
0.879200,436.000000
.
.
this is my code:
X = dataset[:,0:20]
y = dataset[:,20:22]
scaler1 = Normalizer()
X = scaler1.fit_transform(X)
scaler2 = Normalizer()
y = scaler2.fit_transform(y)
print(X_train.shape, X_test.shape, y_train.shape, y_test.shape)
# define the keras model
model = Sequential()
#input layer
model.add(Dense(20, input_dim=20,activation=’relu’,kernel_initializer=’normal’))
#hidden layer
model.add(Dense(7272,activation=’relu’,kernel_initializer=’normal’))
model.add(Dropout(0.8))
#output layer
model.add(Dense(2, activation=’linear’))
opt =Adadelta(lr=0.01)
# compile the keras model
model.compile(loss=’mean_squared_error’, optimizer=opt, metrics=[‘mse’])
# fit the keras model on the dataset
history=model.fit(X_train, y_train, validation_data=(X_test, y_test),epochs=20,verbose=0)
# evaluate the model
_, train_mse = model.evaluate(X_train, y_train, verbose=0)
_, test_mse = model.evaluate(X_test, y_test, verbose=0)
print(‘Train: %.3f, Test: %.3f’ % (train_mse, test_mse))
yhat = model.predict(X_test)
#plot loss during training
pyplot.title(‘Loss / Mean Squared Error’)
pyplot.plot(history.history[‘loss’], label=’train’)
pyplot.plot(history.history[‘val_loss’], label=’test’)
pyplot.legend()
pyplot.show()
Hi Jason, first thanks for the wonderful article. I have a little doubt. By normalizing my data and then dividing it into training and testing, all samples will be normalized. But in the case of a real application, where I have an input given by the user, do I need to put it together with all the data and normalize it so that it has the same pattern as the other data? What would be the best alternative?
Hi Jason, what is the best way to scale NANs when you need the model to generate them? I am creating a synthetic dataset where NANs are critical part. In one case we have people with no corresponding values for a field (truly missing) and in another case we have missing values but want to replicate the fact that values are missing. I tried filling the missing values with the negative sys.max value, but the model tends to spread values between the real data negative limit and the max limit, instead of treating the max value as an outlier. In another case, it seems to ignore that value and always generates values with the real data range, resulting in no generated NANs. I enjoyed your book and look forward to your response.
You cannot scale a NaN, you must replace it with a value, called imputation.
If you want to mark missing values with a special value, mark and then scale, or remove the rows from the scale process, and impute after scale. The latter sounds better to me.
When normalizing a dataset, the resulting data will have a minimum value of 0 and a
maximum value of 1. However, the dataset we work with in data mining is typically a
sample of a population. Therefore, the minimum and maximum for each of the attributes
in the population are unknown.
Samples from the population may be added to the dataset over time, and the attribute
values for these new objects may then lie outside those you have seen so far. One
possibility to handle new minimum and maximum values is to periodically renormalize
the data after including the new values. Your task is to think of a normalization scheme
that does not require you to renormalize all of the data. Your normalization approach has
to fulfill all of the following requirements:
– all values (old and new) have to lie in the range between 0 and 1
– no transformation or renormalization of the old values is allowed
Describe your normalization approach.
I have one question I hope you could help with:
Why do we need to conduct 30 model runs in particular? I do understand the idea, but i mean why 30 exactly?
30 is often used to create a large enough sample that we can use statistical methods and that the estimated stats like mean and stev are not too noisy.
Thanks Jason
I have some confused questions
If the scaling to input data done on the all data set or done to each sample of the data set seperately?
the scalling is done after dividing data to training and test, yes?
If I done normalizations manual to inputs and output, so I should save the max and min values to normalization inputs and denormalization outputs in future prediction?
If I have the outputs containing two differerent range of variables , is same normalization is effective or I should do further things,for example two different normalization?
Many thanks for that, I hd read your mentioned article and understood to avoid data leakage. as I should split data first and got the scale from the trainning set .
but i had another Q:
my data set , for example contain four vectors [ x1 x2 x3 x4 ], where for example each had 100 values ., x1= [value1……………………..value100], x2=[value1…….value100],……
then my traing data may be 400Xnumberof sumples.
but the range of values to these is varying , x1 , x2 and x3 had values in range [ -04], forexample [ – 4.7338e-04 to – 1.33-04 ] and the x4 has values in range of [-02], forexample[ -1.33e-02 to 3.66e-02 ]
the same the output has values some in range [-0.0698 to 0.06211] and other in range [-3.1556 to 3.15556]
sorry for long discription , but , what suitable scaling you recommend me to do, if normalization(max, min ) to input and outs can be suitable , or I had to do any other prepation
If normalization and standarization is done of the whole data or each row of the samples , for example , in standardization , we got the mean of the whole data set and substract from each element in data set , or we treat each row in the data set separately and got its mean ,..?
Hi Jason,
I have a question.. I hope you have time to answer it…
If I scale/normalize the input data… The output label (calculated) will be generated “scalated/normalized” also..correct…
and in order to calculate the output error the expected label should be scalated also..
Correct??
In other words.. I should scalate both..data and labels??
I’m new to deep learning. I tried to implement a CNN regression model with multiple impute image chips of 31 channels(Raster image/TIFF format), and a numeric target variable. But the result I got is quite weird cos its giving me 100% accuracy (r2_score). I also noticed that during training, the loss/val loss output values were all zeros and the training was pretty fast considering feeding over 5000 images into the network. so I feel the network isn’t training anything passé.
I want to ask if this could be as a result of data scaling? My image chips pixel values are in decimals (float) between 0 and 1 (all the image chips are less than 1), while my target variable are a continuous variable between 0 and 160 (integer).
Do you think i need to perform some sort of normalization or standardization of my data?
Im currently training an MLP and I have 9 metric features and 3 binary coded to 0/1.
So I have decided only to standardize the 9 metric feautes and leave the binary features untouched.
Is this approch okay or should standardize the binary features as well – so they have an mean neat to zero and sd of 1
“You must ensure that the scale of your output variable matches the scale of the activation function (transfer function) on the output layer of your network.”
I don’t understand this point.
First, the output layer often has no activation function, or in other words, identity activation function which has arbitrary scale.
Second, normalization and standardization are only linear transformations.
Therefore, is it true that normalization/standardization of output is almost always unnecessary? If not, why?
Great article as always. I have a question, if I have multiple input variables should I rescale then individually or as a conjunction.
Input 1 between 20 – 50, Input 2 between 30-60.
Option 1: rescale Input 1 and 2 individually using their respective minimum and maximum value.
or
Option 2: rescale Input 1 and 2 as a conjunction using the minimum and maximum value of all the data set, which will imply rescaling both inputs from 20 – 60
Hi Jason! Thank you so much for writing all these pieces..I’m a big fan of your work and they have been immensely helpful. Quick (hopefully) question – I didn’t find where you explained what you mean by “standardization assumes that your observations fit a Gaussian distribution (bell curve) with a well behaved mean and standard deviation. You can still standardize your data if this expectation is not met, but you may not get reliable results.” Mind shedding more light on why that is the case? Thanks~
Assume you’re predicting price of something and you standardize it. Surely you can find the mean and standard deviation. But then your model can give you prediction of -2, which is 2 s.d. below mean, and this can become negative price – make no sense but that’s what your model predicts.
Hi Mr Jason, I am begining in ML
Please dear, I have a adaptive scaling factor between[0.1-0.9],it is a value that effect the robustness and imperceptibility result for watermarking image, How to obtain a good compromise between the transparency and the robustness requirements for scaling factor using machine learning algorithm.
thank you dear
Great article indeed!
I’m dealing with regression problem.
I’m using EfficientNet model to predict two float values from image input.
The tricky part is my float outputs could be positive, negative or neutral (e.g. 0.832, -0.041, 0.000).
Input images are normalized, but I’m getting very poor results with RMSE metric.
Should I somehow normalize these outputs to help the model?
Hello Jason, thanks to you i’ve understand Machine Learning. In my master thesis i want create a regression MLP network that use as inputs 5 variables and predict 1. I don’t know hot to scale my input data, because the application of the model is the generation of a curve between the predicted output and 1 input variable, so the dataset which i am going to feed the model in order to produce the curve will use as inputs x1, x2, x3, x4 and x5, x1 will start from 7 and end to 16 with a step of 0.1 and the other are held constant. So given that how should i scale the dataset prior to train the model because z-score or other techniques cant be applied. Thanks in advance!
Hello, i’ve already tried to scale my data with minmaxscaller and the result is my output without minmaxscaller is better than with minmaxscaller. Do you know the reason is?
the result show bad output value when i use feature_range = (0,1) but when is use feature_range =(0,40) the result is good, i put 40 because my maximum data is around 30. What should i choose?
i think there is something wrong with the scaller because for another example when i use minmaxscaller with range input data from 0 to 20 the output is just around 5-10. why this can be happen?
Hello Jason Brownlee,
first of all thank you for the informative post.
My question arises from a machine learning project of my own. From various posts on ML projects, one learns that you transform column-wise, meaning feature-wise. Reasons that come to my mind are that you want to bring differently scaled features to a common scale. Other reasons are left aside. My consideration is, would also a row-wise (the individual n-dimensional data points with n features) be conceivable or is it basically not recommended? Why does it perhaps nevertheless make sense? Instead of training an AI directly on the numbers, one could use a row-wise transformation to get the AI to make its predictions based on the ratios of two distances of points from the n-dimensional data point?
Hi Patrick…Please elaborate on the type of model you are wanting to develop (i.e classification, regression, time-series prediction, etc.) so that we may be better able to help you.
Hi
The quote source link
” — Should I normalize/standardize/rescale the data? Neural Nets FAQ”
gives me an error message where it “wants to open microsoft edge”, yet will not load a page or document. Is this a broken link or my laptop?
Hello,
Thank you for your work, I find your articles well constructed and I appreciate that you always give sources!
Now, a question …
“Standardization assumes that your observations fit a Gaussian distribution (bell curve) with a well behaved mean and standard deviation. You can still standardize your data if this expectation is not met, but you may not get reliable results.” : could you please elaborate a little on this? I have seen this statement on several websites, one would make an assumption using standardization, but for now I don’t understand why. Is there a mathematical explanation behind this statement? Could you please explain the “you may not get reliable results” ?


Thank you for this helpful post for beginners!
Could you please provide more details about the steps of “using the root mean squared error on the unscaled data” to interpret the performance in a specific domain?
Would it be like this??
———————————————————–
1. Finalize the model (based on the performance being calculated from the scaled output variable)
2. Make predictions on test set
3. Invert the predictions (to convert them back into their original scale)
4. Calculate the metrics (e.g. RMSE, MAPE)
———————————————————–
Waiting for your reply! Cheers mate!
Correct.
Really nice article! I got Some quick questions,
If I have multiple input columns, each has different value range, might be [0, 1000] or even a one-hot-encoded data, should all be scaled with same method, or it can be processed differently?
For example:
– input A is normalized to [0, 1],
– input B is normalized to [-1, 1],
– input C is standardized,
– one-hot-encoded data is not scaled
Yes, typically it is a good idea to scale all columns to have the same range. Perhaps start with [0,1] and compare others to see if they result in an improvement.
we want standardized inputs, no scaling of outputs,but outputs value is not in (0,1).Are the predictions inaccurate?
I don’t follow, are what predictions accurate?
Hi Jason,
Your experiment is very helpful for me to understand the difference between different methods, actually I have also done similar things. I always standardized the input data. I have compared the results between standardized and standardized targets. The plots shows that with standardized targets, the network seems to work better. However, here I have a question: suppose the standard deviation of my target is 300, then I think the MSE will be strongly decreased after you fixed the standard deviation to 1. So shall we multiply the original std to the MSE in order to get the MSE in the original target value space?
You can invert the standardization, by adding the mean and multiplying by the stdev.
I also have an example here using the sklaern:
https://machinelearningmastery.com/machine-learning-data-transforms-for-time-series-forecasting/
Hi Jason,
My data includes categorical and continued data. Could I transform the categorical data with 1,2,3…into standardized data and put them into the neural network models to make classification? Or do I need to transformr the categorical data with with one-hot coding(0,1)? I have been confused about it. Thanks
Yes, perhaps try it and compare results?
Hi Jason, I have a specific Question regarding the normalization (min-max scaling) of the output value. Usually you are supposed to use normalization only on the training data set and then apply those stats to the validation and test set. Otherwise you would feed the model at training time certain information about the world it shouldn’t have access to. (The Elements of Statistical Learning: Data Mining, Inference, and Prediction p.247)
But for instance, my output value is a single percentage value ranging [0, 100%] and I am using the ReLU activation function in my output layer. I know for sure that in the “real world” regarding my problem statement, that I will get samples ranging form 60 – 100%. But my training sample size is to small and does not contain enough data points including all possible output values. So here comes my question: Should I stay with my initial statement (normalization only on training data set) or should I apply the maximum possible value of 100% to max()-value of the normalization step? The latter would contradict the literature. Best Regards Bart
Correct.
I would recommend a sigmoid activation in the output.
I would then recommend interpreting the 0-1 scale as 60-100 prior to model evaluation.
Does that help?
I’m not quite sure what you mean by your second recommendation. How would I achieve that?
You can project the scale of 0-1 to anything you want, such as 60-100.
First rescale to a number between 0 and 40 (value * 40) then add the min value (+ 60)
result = value * 40 + 60
Dear Jason, thank you for the great article.
I am wondering if there is any advantage using StadardScaler or MinMaxScaler over scaling manually. I could calculate the mean, std or min, max of my training data and apply them with the corresponding formula for standard or minmax scaling.
Would this approach produce the same results as the StadardScaler or MinMaxScaler or are the sklearn scalers special?
Yes, it is reliable bug free code all wrapped up in a single class – making it harder to introduce new bugs.
Same results as manual, if you coded the manual scaling correctly.
Dear Jason,
I have a few questions from section “Data normalization”. You mention that we should estimate the max and min values, and use that to normalize the training set to e.g. [-1,1]. But what if the max and min values are in the validation or test set? Then I might get values e.g. [-1.2, 1.3] in the validation set. Do you consider this to be incorrect or not?
Another approach is then to make sure that the min and max values for all parameters are contained in the training set. What are your thoughts on this? Is this the way to do it? Or should we use the max and min values for all data combined (training, validation and test sets) when normalizing the training set?
For the moment I use the MinMaxScaler and fit_transform on the training set and then apply that scaler on the validation and test set using transform. But I realise that some of my max values are in the validation set. I suppose this is also related to network saturation.
Perhaps estimate the min/max using domain knowledge. If new data exceeded the limits, snap to known limits, or not – test and see how the model is impacted.
Regardless, the training set must be representative of the problem.
Hi Jason,
Regarding the question asked by Magnus, when we normalize the columns of the test data using the min and max values of each column of the training dataset, if there exists a value in the test set that is greater than the max or less than the min of the training set, we are to get normalized values greater than one and less than zero respectively. In this case, we’ll be feeding the model with values for which the model has not been trained. To overcome this issue, do you think it is plausible to replace negative values with zero and values greater than one with one?
Thanks.
Hi Okan…The following resource may be of interest:
https://machinelearningmastery.com/standardscaler-and-minmaxscaler-transforms-in-python/
Hello Jason, I am a huge fan of your work! Thank you so much for your insightful tutorials. You are a life saver! I have a small question if i may:
I am trying to fit spectrograms in a cnn in order to do some classification tasks. Unfortunately each spectrogram is around (3000,300) array. Is there a way to reduce the dimensionality without losing so much information?
Ouch, perhaps start with simple downsampling and see what effect that has?
Hi Jason,
It was always good and informative to go through your blogs and your interaction with comments by different people all across the globe.
I have question regarding the scaling techniques.
As you explained about scaling :
Case1:
# created scaler
scaler = StandardScaler()
# fit scaler on training dataset
scaler.fit(trainy)
# transform training dataset
trainy = scaler.transform(trainy)
# transform test dataset
testy = scaler.transform(testy)
in this case mean and standard deviation for all train and test remain same.
What i approached is:
case2
# created scaler
scaler_train = StandardScaler()
# fit scaler on training dataset
scaler_train.fit(trainy)
# transform training dataset
trainy = scaler_train.transform(trainy)
# created scaler
scaler_test = StandardScaler()
# fit scaler on training dataset
scaler_test.fit(trainy)
# transform test dataset
testy = scaler_test.transform(testy)
Here the mean and standard deviation in train data and test data are different.so model may find the test data completely unknown and new .rather in first case where mean and standard deviation is same on train and test data that may leads to providing the known test data to model (known in term of same mean and standard deviation treatment).
Jason,can you guide me if my logics is good to go with case2 or shall i consider case1 .
or if logic is wrong you can also say that and explain.
(Also i applied Same for min-max scaling i.e normalization, if i choose this then)
Again thanks Jason for such a nice work !
Happy Learning !!
I recommend fitting the scaler on the training dataset once, then apply it to transform the training dataset and test set.
If you fit the scaler using the test dataset, you will have data leakage and possibly an invalid estimate of model performance.
Hi Jason,
I’m working on sequence2sequence problem. Input’s max and min points are around 500-300, however output’s are 200-0. If I want to normalize them, should I use different scalers? For example:
scx = MinMaxScaler(feature_range = (0, 1))
scy = MinMaxScaler(feature_range = (0, 1))
trainx = scx.fit_transform(trainx)
trainy = scy.fit_transform(trainy)
or should I scale them with same scale like below?
sc = MinMaxScaler(feature_range = (0, 1))
trainx = sc.fit_transform(trainx)
trainy = sc.fit_transform(trainy)
Yes, use a separate transform for inputs and outputs is a good idea. Otherwise have them all as separate columns in the same matrix and use one scaler, but the column order for transform/inverse_transform will always have to be consistent.
Hi Jason,
Confused about one aspect, I have a small NN with 8 independent variables and one dichotomous dependent variable. I have standardized the input variables (the output variable was left untouched). I have both trained and created the final model with the same standardized data. However, the question is, if I want to create a user interface to receive manual inputs, those will no longer be in the standardized format, so what is the best way to proceed?
You must maintain the objects used to prepare the data, or the coefficients used by those objects (mean and stdev) so that you can prepare new data in an identically way to the way data was prepared during training.
Does that help
Thank you, that makes perfect sense.
Hi Jason,
I have built an ANN model and scaled my inputs and outputs before feeding to the network. I measure the performance of the model by r2_score. My output variable is height. My r2_score when the output variable is in metres is .98, but when my output variable is in centi-metres , my r2_score is .91. I have scaled my output too before feeding to the network, why is there a difference in r2_score even because the output variable is scaled before feeding to the network.
Thanks in advance
Good question, this is why it is important to test different scaling approaches in order to discover what works best for a given dataset and model combination.
Hi Jason,
I am working on sequence to data prediction problem wherein i am performing normalization on input and output both.
Once model is trained then to get the actual output in real-time, I have to perform the de-normalization and when I will perform the denorm then error will increase by the same factor I have used for normalization.
Lets consider, norm predicted output is 0.1 and error of the model is 0.01 .
denorm predicted output become 0.1*100 = 10 and after de-normalizing the error will be 0.01*100= 1
So, what will be solution to this eliminate this kind of problem in regression.
Thanks
What problem exactly?
The problem is after de-normalization of the output, the error difference between actual and predicted output is scaled up by the normalization factor (max-min) So, I want to know what can be done to make the error difference same for both de-normized as well as normalized output.
Thanks
I don’t understand, sorry.
Hi Jason,
Do I have to use only one normalization formula for all inputs?
For example: I have 5 inputs [inp1, inp2, inp3, inp4, inp5] where I can estimate max and min only for [inp1, inp2]. So can I use
y = (x – min) / (max – min)
for [inp1, inp2] and
y = x/(1+x)
for [inp3, inp4, inp5]?
Yes, it is applied to each input separately – assuming they have different units.
Hi Jason
what if I scale the word vectors(glove) for exposing to LSTM?
would it affect the accuracy of results or it maintains the semantic relations of words?
Thank you a lot.
I don’t think so. Try it and see?
Hello, i was trying to normalize/inverse transoformation in my data, but i got one error that i think its due to the resize i did in my input data. Here’s my code:
import numpy as np
import tensorflow as tf
from tensorflow import keras
import pandas as pd
import time as time
import matplotlib.pyplot as plt
import pydot
import csv as csv
import keras.backend as K
from sklearn.preprocessing import MinMaxScaler
# Downloading data
!wget https://raw.githubusercontent.com/sibyjackgrove/CNN-on-Wind-Power-Data/master/MISO_power_data_classification_labels.csv
!wget https://raw.githubusercontent.com/sibyjackgrove/CNN-on-Wind-Power-Data/master/MISO_power_data_input.csv
# Trying normalization
batch_size = 1
valid_size = max(1,np.int(0.2*batch_size))
df_input = pd.read_csv(‘./MISO_power_data_input.csv’,usecols =[‘Wind_MWh’,’Actual_Load_MWh’], chunksize=24*(batch_size+valid_size),nrows = 24*(batch_size+valid_size),iterator=True)
df_target = pd.read_csv(‘./MISO_power_data_classification_labels.csv’,usecols =[‘Mean Wind Power’,’Standard Deviation’,’WindShare’],chunksize =batch_size+valid_size,nrows = batch_size+valid_size, iterator=True)
for chunk, chunk2 in zip(df_input,df_target):
InputX = chunk.values
InputX = np.resize(InputX,(batch_size+valid_size,24,2,1))
print(InputX)
InputX.astype(‘float32’, copy=False)
InputY = chunk2.values
InputY.astype(‘float32’, copy=False)
print(InputY)
# create scaler
scaler = MinMaxScaler() # Define limits for normalize data
normalized_input = scaler.fit_transform(InputX) # Normalize input data
normalized_output = scaler.fit_transform(InputY) # Normalize output data
print(normalized_input)
print(normalized_output)
inverse_output = scaler.inverse_transform(normalized_output) # Inverse transformation of output data
print(inverse_output)
The error:
“ValueError: Found array with dim 4. MinMaxScaler expected <= 2."
Do you have any idea how can i fix this? I really didn't wish to change the resize command at the moment.
Perhaps this will help:
https://machinelearningmastery.com/machine-learning-data-transforms-for-time-series-forecasting/
Is there anyway i can do the inverse transform inside the model itself? Because, for example, my MSE reported at the end of each epoch would be in the “wrong” scale.
Yes, you could wrap the model in a sklearn pipeline.
Or wrap the model in your own wrapper class.
Does it improve the net to do this?
No, but it may be helpful when coding.
Hey Jason,
I love this tutorial. I was wondering if I can get your permission to use this tutorial, convert all its experimentation and tracking using MLflow, and include it in my tutorials I teach at conferences.
It’s a fitting example of how you can use MLFlow to track different experiments and visually compare the outcomes.
All the credit will be given to you as the source and inspiration. You can see some of the examples here: https://github.com/dmatrix/spark-saturday/tree/master/tutorials/mlflow/src/python.
Thanks!
No problem as long as you clearly cite and link to the post.
Thanks, I will certainly put the original link and plug your book too, along with your site and an excellent resource of tutorials and examples to learn from.
Cheers
Jules
Thanks Jules.
Amazing content Jason! I was wondering if it is possible to apply different scalers to different inputs given based on their original characteristics? I am asking you that because as you mentioned in the tutorial “Differences in the scales across input variables may increase the difficulty of the problem being modeled” Therefore, if I use standard scaler in one input and normal scaler in another it could be bad for gradient descend.
Thanks!
Yes, perhaps try it and compare the results to using one type of scaling for all inputs.
Hi Jason,
I am solving the Regression problem and my accuracy after normalizing the target variable is 92% but I have the doubt about scaling the target variable. So can you elaborate about scaling the Target variable?
You cannot calculate accuracy for regression. You must calculate error.
More details here:
https://machinelearningmastery.com/faq/single-faq/how-do-i-calculate-accuracy-for-regression
Hi Jason Sir!
My data range is variable, e.g. -1500000, 0.0003456, 2387900,23,50,-45,-0.034, what should i do? i want to use MLP, 1D-CNN and SAE.
THANKS
Perhaps try normalizing the data first?
i tried different type of normalization but got data type errors, i used “MinMaxScaler ” and also (X-min(X))/ (max(X)-min(X)), but it can’t process. I want to know about the tf.compat.v1.keras.utils.normalize() command, what it actually do? thanks
I don’t have a tutorial on that, perhaps check the source code?
Hi Jason
I have a question about the normalization of data. Samples from the population may be added to the dataset over time, and the attribute values for these new objects may then lie outside those you have seen so far. One possibility to handle new minimum and maximum values is to periodically renormalize the data after including the new values. Is there any normalization approach without renormalization?
Thanks,
Yes, re-normalizing is one approach.
Clipping values to historical limits is another.
Perhaps try a few methods and see what makes sense for your project?
Hi Jason
Should we use “standard_deviation = sqrt( sum( (x – mean)**2 ) / count(x))” instead of “standard_deviation = sqrt( sum( (x – mean)^2 ) / count(x))”?
Does “^” sign represent square root in Python and is it fine not to subtract count (x) by 1 (in order to make it std of sample distribution, unless we have 100% observation of a population)?
Thank you
Best
Tajik
^ means superscript (e.g. exponent) in latex and excel.
Hi Jason,
Very helpful post as always! I am slightly confused regarding the use of the scaler object though. In my scenario…
If I have a set of data that I split into a training set and validation set, I then scale the data as follows:
scaler = MinMaxScaler()
scaledTrain = scaler.fit_transform(trainingSet)
scaledValid = scaler.transform(validationSet)
I then use this data to train a deep learning model.
My question is, should I use the same scaler object, which was created using the training set, to scale my new, unseen test data before using that test set for predicting my model’s performance? Or should I create a new, separate scaler object using the test data?
Thanks in advance
Michael
Yes.
Any data given to your model MUST be prepared in the same way. You are defining the expectations for the model based on how the training set looks.
Use the same scaler object – it knows – from being fit on the training dataset – how to transform data in the way your model expects.
Awesome! Thanks so much for the quick response and clearing that up for me.
Very best wishes.
You’re welcome.
Hi Jason,
Thank you for the tutorial. A question about the conclusion: I find it surprising that standardization did not yield better performance compared to the model with unscaled inputs. Shouldn’t standardization provide better convergence properties when training neural networks? It’s also surprising that min-max scaling worked so well. If all of your inputs are positive (i.e between [0, 1] in this case), doesn’t that mean ALL of your weight updates at each step will be the same sign, which leads to inefficient learning?
Not always. It really depends on the problem and the model.
Hi Jason,
I am an absolute beginner into neural networks and I appreciate your helpful website. In the lecture, I learned that when normalizing a training set, one should use the same mean and standard deviation from training for the test set. But I see in your codes that you’re normalizing training and test sets individually. Is that for a specific reason?
The example correctly fits the transform on the training set then applies the transform to train and test sets.
If we don’t do it this way, it will result in data leakage and in turn an optimistic estimate of model performance.
Hi again,
since I saw another comment having the same question like me, I noticed that you acutally have done exactly the same thing as I expected. Since I am not familiar with the syntax yet, I got it wrong. Thanks very much!
No problem!
Ask questions anyway, even if you’re not sure. The tutorials are really just the starting point in a conversation.
Hai Jaison, I am a beginner in ML and I am having an issue with normalizing..
I am developing a multivariate regression model with three inputs and three outputs.
The three inputs are in the range of [700 1500] , [700-1500] and [700 1500]
The three outputs are in the range of [-0.5 0.5] , [-0.5 0.5] and [700 1500]
I have normalized everything in the range of [-1 1].
The loss at the end of 1000 epoch is in the order of 1e-4, but still, I am not satisfied with the fit of the model. Since the loss function is based on normalized target variables and normalized prediction, its value id very less from the first epoch itself.
Is there a way to bring the cost further down?
Yes, the suggestions here will help you improve your model:
https://machinelearningmastery.com/start-here/#better
Hi Jason,
I wonder how you apply scaling to batch data? Say we batch load from tfrecords, for each batch we fit a scaler? If so, then the final scaler is on the last batch, which will be used for test data? Also in batch data, if the batch is small, then it seems the scaler is volatile, especially for MaxMin. Would like to hear your thoughts since in a lot of practices it’s nearly impossible to load huge data into driver to do scaling.
Thanks!
Scaling is fit on the training set, then applied to all data, e.g. train, test, val.
The entire training set? What if the entire training set is too big to load in the memory? Even doing batch training, you still do scaling on the entire training set first then do batch training? That seems pretty inefficient
You can use a generator to load the data step by step, only keep in memory what you can/need.
More suggestions here:
https://machinelearningmastery.com/faq/single-faq/how-to-i-work-with-a-very-large-dataset
Yes, that’s my question. When doing batch training, do you fit (or re-fit) a scaler on each batch? If so, it seems the final scaler that will be used for scoring is fit on the final batch. Do you see any issue with that especially when batch is small? Thanks
You could, this is what batch norm does.
Or you can estimate the coefficients used in scaling up front from a sample of training data. Or some other way you prefer.
Hi Jason,
In deep learning as machine learning, data should be transformed into a tabular format? if yes or no why?
Input data must be vectors or matrices of numbers, this covers tabular data, images, audio, text, and so on.
Hello Jason,
I used your method (i did standardized my outputs and normalized my inputs with MinMaxScaler()) but i keep having the same issue : when i train my neural network with 3200 and validate with 800 everything alright, i have R2 = 99% but when i increase the training / validation set, R2 decreases which is weird, it should be even higher ? Do you think it has something to do with the scaling of the data ?
Thank you !
It might be interesting to perform a sensitivity analysis on model performance vs train or test set size to understand the relationship.
Sir how can I normalize real-time data and scale them between -150 to 150? The data are coming every 5 min interval.
Perhaps use the minmaxscaler if you’re having trouble:
https://machinelearningmastery.com/standardscaler-and-minmaxscaler-transforms-in-python/
Hi sir,
I have a NN with 6 input variables and one output , I employed minmaxscaler for inputs as well as outputs . My approach was applying the scaler to my whole dataset then splitting it into training and testing dataset, as I dont know the know-hows so is my approach wrong .
Currently the problem I am facing is my actual outputs are positive values but after unscaling the NN predictions I am getting negative values. I tried changing the feature range, still NN predicted negative values , so how can i solve this?
Y1=Y1.reshape(-1, 1)
Y2=Y2.reshape(-1, 1)
TY1=TY1.reshape(-1, 1)
TY2=TY2.reshape(-1, 1)
scaler1 = MinMaxScaler(feature_range=(0, 1))
rescaledX= scaler1.fit_transform(X)
rescaledTX=scaler1.fit_transform(TX)
scaler2 = MinMaxScaler(feature_range=(0, 2))
rescaledY1 = scaler2.fit_transform(Y1)
scaler3 = MinMaxScaler(feature_range=(0, 2))
rescaledY2 = scaler3.fit_transform(Y2)
First, perhaps confirm that there is no bug in your code.
Second, it is possible for the model to predict values that get mapped to a value out of bounds. You could use a n if-statement to snap them to the required range or use a model that forces predictions to the required range.
Thanks a lot,
My question is:
I finish training my model and I use normalized data for inputs and outputs.
my problem now is when I need to use this model I do the following:
1- I load the model
2- normalize the inputs
3- use model to get the outputs (predicted data)
how to denormalized the output of the model ??? I don’t have the MinMaxScaler for the output ??
You can call inverse_transform() on the scaler object for the predictions to get the data back to the original scale.
Thanks for fast replay,
I think my question is not clear to you.
imagine than I finish the training phase and save the trained model named “model1”.
I send the “model1” file to a friend and he tries to use it, he will normalize the inputs and get the outputs. In this case, he doesn’t have the scaler object to recover the original values using inverse_transform().
my problem is similar to: https://stackoverflow.com/questions/37595891/how-to-recover-original-values-after-a-model-predict-in-keras
but the answer don’t use the scaler object. It depends on manual normalization and normalization process
Thanks for your time
Save the scaler object as well:
https://machinelearningmastery.com/how-to-save-and-load-models-and-data-preparation-in-scikit-learn-for-later-use/
You are developing a “modeling pipeline”, not just a predictive model.
Hi Jason,
Do you know of any textbooks or journal articles that address the input scaling issue as you’ve described it here, in addition to the Bishop textbook? I’m struggling so far in vain to find discussions of this type of scaling, when different raw input variables have much different ranges. Instead I’m finding plenty of mentions in tutorials and blog posts (of which yours is one of the clearest), and papers describing the problems of scale (size) variance in neural networks designed for image recognition.
Thanks!
Not really, practical issues are not often discussed in textbooks/papers.
Maybe “neural smithing”? Maybe Bishops later book?
Hi Jason,
Thank you very much for the article. I wanted to understand the following scenario
I have mix of categorical and numerical inputs. I can normalize/standardize the numerical inputs and the output numerical variable.
But in the categorical variables I have high number of categories ~3000. So I use label encoder (not one hot coding) and then I use embedding layers. How can I achieve scaling in this case.
You can separate the columns and scale them independently, then aggregate the results.
Hi Jason,
I really enjoyed reading your article. My CNN regression network has binary image as input which the background is black, and foreground is white. The ground truth associated with each input is an image with color range from 0 to 255 which is normalized between 0 and 1.
The network can almost detect edges and background but in foreground all the predicted values are almost same. Do you have any idea what is the solution?
I appreciate in advance.
Thanks.
Perhaps these tips will help you improve the performance of your model:
https://machinelearningmastery.com/start-here/#better
Hi jason, how are you?
i have data with input X (matrix with real values) and output y (matrix real values).
i tried to normalize X and y :
scaler1 = Normalizer()
X = scaler1.fit_transform(X)
scaler2 = Normalizer()
y = scaler2.fit_transform(y)
i get a good result with the transform normalizer as shown by: https://ibb.co/bQYCkvK
at the end i tried to get the predicted values: yhat = model.predict(X_test)
the problem here yhat is not the original data, it’s a transformed data and there is no inverse for normalizer.
I tried to use the minmaxScalar an order to do the inverse operation (invyhat = scaler2.inverse_transform(yhat)) but i get a big numbers compared to the y_test values that i want.
I tried to normalize just X, i get a worst result compared to the first one.
could you please help me.
example of X values : 1006.808362,13.335140,104.536458 …..
289.197205,257.489613,106.245104,566.941857…..
.
example of y values: 0.50000, 250.0000
0.879200,436.000000
.
.
this is my code:
X = dataset[:,0:20]
y = dataset[:,20:22]
scaler1 = Normalizer()
X = scaler1.fit_transform(X)
scaler2 = Normalizer()
y = scaler2.fit_transform(y)
X_train = X[90000:,:]
X_test= X[:90000,:]
y_train =y[90000:,:]
y_test=y[:90000,:]
print(X_train.shape, X_test.shape, y_train.shape, y_test.shape)
# define the keras model
model = Sequential()
#input layer
model.add(Dense(20, input_dim=20,activation=’relu’,kernel_initializer=’normal’))
#hidden layer
model.add(Dense(7272,activation=’relu’,kernel_initializer=’normal’))
model.add(Dropout(0.8))
#output layer
model.add(Dense(2, activation=’linear’))
opt =Adadelta(lr=0.01)
# compile the keras model
model.compile(loss=’mean_squared_error’, optimizer=opt, metrics=[‘mse’])
# fit the keras model on the dataset
history=model.fit(X_train, y_train, validation_data=(X_test, y_test),epochs=20,verbose=0)
# evaluate the model
_, train_mse = model.evaluate(X_train, y_train, verbose=0)
_, test_mse = model.evaluate(X_test, y_test, verbose=0)
print(‘Train: %.3f, Test: %.3f’ % (train_mse, test_mse))
yhat = model.predict(X_test)
#plot loss during training
pyplot.title(‘Loss / Mean Squared Error’)
pyplot.plot(history.history[‘loss’], label=’train’)
pyplot.plot(history.history[‘val_loss’], label=’test’)
pyplot.legend()
pyplot.show()
Sorry to hear that you’re having trouble, perhaps some of these tips will help:
https://machinelearningmastery.com/faq/single-faq/can-you-read-review-or-debug-my-code
Hi Jason, first thanks for the wonderful article. I have a little doubt. By normalizing my data and then dividing it into training and testing, all samples will be normalized. But in the case of a real application, where I have an input given by the user, do I need to put it together with all the data and normalize it so that it has the same pattern as the other data? What would be the best alternative?
Good question.
No, save the scaler object or coefficients used for scaling along with the model and use them to prepare new data in the future. More here:
https://machinelearningmastery.com/how-to-save-and-load-models-and-data-preparation-in-scikit-learn-for-later-use/
Hi Jason, what is the best way to scale NANs when you need the model to generate them? I am creating a synthetic dataset where NANs are critical part. In one case we have people with no corresponding values for a field (truly missing) and in another case we have missing values but want to replicate the fact that values are missing. I tried filling the missing values with the negative sys.max value, but the model tends to spread values between the real data negative limit and the max limit, instead of treating the max value as an outlier. In another case, it seems to ignore that value and always generates values with the real data range, resulting in no generated NANs. I enjoyed your book and look forward to your response.
You cannot scale a NaN, you must replace it with a value, called imputation.
If you want to mark missing values with a special value, mark and then scale, or remove the rows from the scale process, and impute after scale. The latter sounds better to me.
Thanks Jason for the blog post.
One question:
is it necessary to apply feature scaling for linear regression models as well as MLP’s?
Yes, it is a good idea to scale input data prior to modeling for models that use a weighted sum of input, like neural nets and regression models.
Thanks Jason. May I ask a follow up question, what is your view on if it is wrong to only scale the input, not scale the output?.
It depends on the data and model.
Do whatever results in the best performance for your prediction problem.
sir, i have a 1 problem
When normalizing a dataset, the resulting data will have a minimum value of 0 and a
maximum value of 1. However, the dataset we work with in data mining is typically a
sample of a population. Therefore, the minimum and maximum for each of the attributes
in the population are unknown.
Samples from the population may be added to the dataset over time, and the attribute
values for these new objects may then lie outside those you have seen so far. One
possibility to handle new minimum and maximum values is to periodically renormalize
the data after including the new values. Your task is to think of a normalization scheme
that does not require you to renormalize all of the data. Your normalization approach has
to fulfill all of the following requirements:
– all values (old and new) have to lie in the range between 0 and 1
– no transformation or renormalization of the old values is allowed
Describe your normalization approach.
Perhaps you can use domain knowledge to estimate a broader min and max range prior to scaling.
Perhaps you can clip values to a pre-defined range prior to scaling.
Hi Jason!
Thank you so much for this great post 🙂
I have one question I hope you could help with:
Why do we need to conduct 30 model runs in particular? I do understand the idea, but i mean why 30 exactly?
30 is often used to create a large enough sample that we can use statistical methods and that the estimated stats like mean and stev are not too noisy.
Thanks Jason
I have some confused questions
If the scaling to input data done on the all data set or done to each sample of the data set seperately?
the scalling is done after dividing data to training and test, yes?
If I done normalizations manual to inputs and output, so I should save the max and min values to normalization inputs and denormalization outputs in future prediction?
If I have the outputs containing two differerent range of variables , is same normalization is effective or I should do further things,for example two different normalization?
Thanks in advance
Data scaling, and all data pre-processing should be fit on the training set and applied to the training set, validation set and test sets in order to avoid data leakage. You can learn more about this here:
https://machinelearningmastery.com/data-preparation-without-data-leakage/
Many thanks for that, I hd read your mentioned article and understood to avoid data leakage. as I should split data first and got the scale from the trainning set .
but i had another Q:
my data set , for example contain four vectors [ x1 x2 x3 x4 ], where for example each had 100 values ., x1= [value1……………………..value100], x2=[value1…….value100],……
then my traing data may be 400Xnumberof sumples.
but the range of values to these is varying , x1 , x2 and x3 had values in range [ -04], forexample [ – 4.7338e-04 to – 1.33-04 ] and the x4 has values in range of [-02], forexample[ -1.33e-02 to 3.66e-02 ]
the same the output has values some in range [-0.0698 to 0.06211] and other in range [-3.1556 to 3.15556]
sorry for long discription , but , what suitable scaling you recommend me to do, if normalization(max, min ) to input and outs can be suitable , or I had to do any other prepation
many thanks to you
I recommend starting with normalization. Perhaps try standardization if the variables look like they have a gaussian probability distribution.
If normalization and standarization is done of the whole data or each row of the samples , for example , in standardization , we got the mean of the whole data set and substract from each element in data set , or we treat each row in the data set separately and got its mean ,..?
No, data preparation is typically fit on the training set and applied to the train and test dataset.
Hi Jason,
I have a question.. I hope you have time to answer it…
If I scale/normalize the input data… The output label (calculated) will be generated “scalated/normalized” also..correct…
and in order to calculate the output error the expected label should be scalated also..
Correct??
In other words.. I should scalate both..data and labels??
Scaling input is a good idea, depending on the data and choice of model.
If the target is numeric (e.g. regression), then scaling the target is a good idea, depending on the data and choice of model.
If the target was sealed, then the scaling must be inverted on the prediction and the test data before calculating an error metic.
Hi Jason,
I’m new to deep learning. I tried to implement a CNN regression model with multiple impute image chips of 31 channels(Raster image/TIFF format), and a numeric target variable. But the result I got is quite weird cos its giving me 100% accuracy (r2_score). I also noticed that during training, the loss/val loss output values were all zeros and the training was pretty fast considering feeding over 5000 images into the network. so I feel the network isn’t training anything passé.
I want to ask if this could be as a result of data scaling? My image chips pixel values are in decimals (float) between 0 and 1 (all the image chips are less than 1), while my target variable are a continuous variable between 0 and 160 (integer).
Do you think i need to perform some sort of normalization or standardization of my data?
Perhaps try scaling the data and see if it makes a difference.
Hi Jason,
Great Tutorial! Thank you very much.
very clear explanation of scaling inputs and output necessity !
I am introducing your tutorial to a friend of mine who is very interested in following you.
regards
Thanks!
Hi Jason,
Im currently training an MLP and I have 9 metric features and 3 binary coded to 0/1.
So I have decided only to standardize the 9 metric feautes and leave the binary features untouched.
Is this approch okay or should standardize the binary features as well – so they have an mean neat to zero and sd of 1
Cheers
It sounds strange to me that you would standardize binary features. Often they would be excluded from any scaling operation.
“You must ensure that the scale of your output variable matches the scale of the activation function (transfer function) on the output layer of your network.”
I don’t understand this point.
First, the output layer often has no activation function, or in other words, identity activation function which has arbitrary scale.
Second, normalization and standardization are only linear transformations.
Therefore, is it true that normalization/standardization of output is almost always unnecessary? If not, why?
This was critical in the olden days of sigmoid and tanh. These days, normalizing or standardizing is sufficient.
It’s critical because large inputs cause large weights which leads to an unstable network, in general.
Great article as always. I have a question, if I have multiple input variables should I rescale then individually or as a conjunction.
Input 1 between 20 – 50, Input 2 between 30-60.
Option 1: rescale Input 1 and 2 individually using their respective minimum and maximum value.
or
Option 2: rescale Input 1 and 2 as a conjunction using the minimum and maximum value of all the data set, which will imply rescaling both inputs from 20 – 60
Individually.
Hi Jason! Thank you so much for writing all these pieces..I’m a big fan of your work and they have been immensely helpful. Quick (hopefully) question – I didn’t find where you explained what you mean by “standardization assumes that your observations fit a Gaussian distribution (bell curve) with a well behaved mean and standard deviation. You can still standardize your data if this expectation is not met, but you may not get reliable results.” Mind shedding more light on why that is the case? Thanks~
Assume you’re predicting price of something and you standardize it. Surely you can find the mean and standard deviation. But then your model can give you prediction of -2, which is 2 s.d. below mean, and this can become negative price – make no sense but that’s what your model predicts.
Hi Mr Jason, I am begining in ML
Please dear, I have a adaptive scaling factor between[0.1-0.9],it is a value that effect the robustness and imperceptibility result for watermarking image, How to obtain a good compromise between the transparency and the robustness requirements for scaling factor using machine learning algorithm.
thank you dear
That’s an engineering trade off. You have to evaluate the pros and cons and decide on the sweet spot.
Great article indeed!
I’m dealing with regression problem.
I’m using EfficientNet model to predict two float values from image input.
The tricky part is my float outputs could be positive, negative or neutral (e.g. 0.832, -0.041, 0.000).
Input images are normalized, but I’m getting very poor results with RMSE metric.
Should I somehow normalize these outputs to help the model?
You can try. Or your two float values are too hard to infer from the image input can also give poor RMSE result.
Hello Jason, thanks to you i’ve understand Machine Learning. In my master thesis i want create a regression MLP network that use as inputs 5 variables and predict 1. I don’t know hot to scale my input data, because the application of the model is the generation of a curve between the predicted output and 1 input variable, so the dataset which i am going to feed the model in order to produce the curve will use as inputs x1, x2, x3, x4 and x5, x1 will start from 7 and end to 16 with a step of 0.1 and the other are held constant. So given that how should i scale the dataset prior to train the model because z-score or other techniques cant be applied. Thanks in advance!
Hello, i’ve already tried to scale my data with minmaxscaller and the result is my output without minmaxscaller is better than with minmaxscaller. Do you know the reason is?
the result show bad output value when i use feature_range = (0,1) but when is use feature_range =(0,40) the result is good, i put 40 because my maximum data is around 30. What should i choose?
i think there is something wrong with the scaller because for another example when i use minmaxscaller with range input data from 0 to 20 the output is just around 5-10. why this can be happen?
Hi Muhammad…Please provide a posting of your code and a sample of your data you wish to scale.
Regards,
That simply means your data fit the model better without scaling. You don’t always need that.
Hi Jason and Adrian,
Thanks for sharing insight into scaling.
I have a question as I am getting a big error after denormalization my predictions, on normalization is all good.
What are the reasons, please share your views?
cheers
Hello Jason Brownlee,
first of all thank you for the informative post.
My question arises from a machine learning project of my own. From various posts on ML projects, one learns that you transform column-wise, meaning feature-wise. Reasons that come to my mind are that you want to bring differently scaled features to a common scale. Other reasons are left aside. My consideration is, would also a row-wise (the individual n-dimensional data points with n features) be conceivable or is it basically not recommended? Why does it perhaps nevertheless make sense? Instead of training an AI directly on the numbers, one could use a row-wise transformation to get the AI to make its predictions based on the ratios of two distances of points from the n-dimensional data point?
Best regards Patrick S.
Hi Patrick…Please elaborate on the type of model you are wanting to develop (i.e classification, regression, time-series prediction, etc.) so that we may be better able to help you.
Hi
The quote source link
” — Should I normalize/standardize/rescale the data? Neural Nets FAQ”
gives me an error message where it “wants to open microsoft edge”, yet will not load a page or document. Is this a broken link or my laptop?
Hi Ciaran…There seems to be an issue with link. Try the following:
http://www.faqs.org/faqs/ai-faq/neural-nets/part2/section-16.html
Hello,
Thank you for your work, I find your articles well constructed and I appreciate that you always give sources!
Now, a question …
“Standardization assumes that your observations fit a Gaussian distribution (bell curve) with a well behaved mean and standard deviation. You can still standardize your data if this expectation is not met, but you may not get reliable results.” : could you please elaborate a little on this? I have seen this statement on several websites, one would make an assumption using standardization, but for now I don’t understand why. Is there a mathematical explanation behind this statement? Could you please explain the “you may not get reliable results” ?
Hi Elena…The following resource explains the concept in a different way and hopefully it will be clearer.
https://becominghuman.ai/what-does-feature-scaling-mean-when-to-normalize-data-and-when-to-standardize-data-c3de654405ed