Many machine learning algorithms perform better when numerical input variables are scaled to a standard range.
This includes algorithms that use a weighted sum of the input, like linear regression, and algorithms that use distance measures, like k-nearest neighbors.
The two most popular techniques for scaling numerical data prior to modeling are normalization and standardization. Normalization scales each input variable separately to the range 0-1, which is the range for floating-point values where we have the most precision. Standardization scales each input variable separately by subtracting the mean (called centering) and dividing by the standard deviation to shift the distribution to have a mean of zero and a standard deviation of one.
In this tutorial, you will discover how to use scaler transforms to standardize and normalize numerical input variables for classification and regression.
After completing this tutorial, you will know:
Data scaling is a recommended pre-processing step when working with many machine learning algorithms.
Data scaling can be achieved by normalizing or standardizing real-valued input and output variables.
How to apply standardization and normalization to improve the performance of predictive modeling algorithms.
Kick-start your project with my new book Data Preparation for Machine Learning, including step-by-step tutorials and the Python source code files for all examples.
Let’s get started.
How to Use StandardScaler and MinMaxScaler Transforms Photo by Marco Verch, some rights reserved.
Tutorial Overview
This tutorial is divided into six parts; they are:
The Scale of Your Data Matters
Numerical Data Scaling Methods
Data Normalization
Data Standardization
Sonar Dataset
MinMaxScaler Transform
StandardScaler Transform
Common Questions
The Scale of Your Data Matters
Machine learning models learn a mapping from input variables to an output variable.
As such, the scale and distribution of the data drawn from the domain may be different for each variable.
Input variables may have different units (e.g. feet, kilometers, and hours) that, in turn, may mean the variables have different scales.
Differences in the scales across input variables may increase the difficulty of the problem being modeled. An example of this is that large input values (e.g. a spread of hundreds or thousands of units) can result in a model that learns large weight values. A model with large weight values is often unstable, meaning that it may suffer from poor performance during learning and sensitivity to input values resulting in higher generalization error.
One of the most common forms of pre-processing consists of a simple linear rescaling of the input variables.
This difference in scale for input variables does not affect all machine learning algorithms.
For example, algorithms that fit a model that use a weighted sum of input variables are affected, such as linear regression, logistic regression, and artificial neural networks (deep learning).
For example, when the distance or dot products between predictors are used (such as K-nearest neighbors or support vector machines) or when the variables are required to be a common scale in order to apply a penalty, a standardization procedure is essential.
Also, algorithms that use distance measures between examples or exemplars are affected, such as k-nearest neighbors and support vector machines. There are also algorithms that are unaffected by the scale of numerical input variables, most notably decision trees and ensembles of trees, like random forest.
Different attributes are measured on different scales, so if the Euclidean distance formula were used directly, the effect of some attributes might be completely dwarfed by others that had larger scales of measurement. Consequently, it is usual to normalize all attribute values …
It can also be a good idea to scale the target variable for regression predictive modeling problems to make the problem easier to learn, most notably in the case of neural network models. A target variable with a large spread of values, in turn, may result in large error gradient values causing weight values to change dramatically, making the learning process unstable.
Scaling input and output variables is a critical step in using neural network models.
In practice, it is nearly always advantageous to apply pre-processing transformations to the input data before it is presented to a network. Similarly, the outputs of the network are often post-processed to give the required output values.
Take my free 7-day email crash course now (with sample code).
Click to sign-up and also get a free PDF Ebook version of the course.
Numerical Data Scaling Methods
Both normalization and standardization can be achieved using the scikit-learn library.
Let’s take a closer look at each in turn.
Data Normalization
Normalization is a rescaling of the data from the original range so that all values are within the new range of 0 and 1.
Normalization requires that you know or are able to accurately estimate the minimum and maximum observable values. You may be able to estimate these values from your available data.
Attributes are often normalized to lie in a fixed range — usually from zero to one—by dividing all values by the maximum value encountered or by subtracting the minimum value and dividing by the range between the maximum and minimum values.
Where the minimum and maximum values pertain to the value x being normalized.
For example, for a dataset, we could guesstimate the min and max observable values as 30 and -10. We can then normalize any value, like 18.8, as follows:
y = (x – min) / (max – min)
y = (18.8 – (-10)) / (30 – (-10))
y = 28.8 / 40
y = 0.72
You can see that if an x value is provided that is outside the bounds of the minimum and maximum values, the resulting value will not be in the range of 0 and 1. You could check for these observations prior to making predictions and either remove them from the dataset or limit them to the pre-defined maximum or minimum values.
You can normalize your dataset using the scikit-learn object MinMaxScaler.
Good practice usage with the MinMaxScaler and other scaling techniques is as follows:
Fit the scaler using available training data. For normalization, this means the training data will be used to estimate the minimum and maximum observable values. This is done by calling the fit() function.
Apply the scale to training data. This means you can use the normalized data to train your model. This is done by calling the transform() function.
Apply the scale to data going forward. This means you can prepare new data in the future on which you want to make predictions.
The default scale for the MinMaxScaler is to rescale variables into the range [0,1], although a preferred scale can be specified via the “feature_range” argument and specify a tuple, including the min and the max for all variables.
We can demonstrate the usage of this class by converting two variables to a range 0-to-1, the default range for normalization. The first variable has values between about 4 and 100, the second has values between about 0.1 and 0.001.
The complete example is listed below.
1
2
3
4
5
6
7
8
9
10
11
12
13
14
15
# example of a normalization
from numpy import asarray
from sklearn.preprocessing import MinMaxScaler
# define data
data=asarray([[100,0.001],
[8,0.05],
[50,0.005],
[88,0.07],
[4,0.1]])
print(data)
# define min max scaler
scaler=MinMaxScaler()
# transform data
scaled=scaler.fit_transform(data)
print(scaled)
Running the example first reports the raw dataset, showing 2 columns with 4 rows. The values are in scientific notation which can be hard to read if you’re not used to it.
Next, the scaler is defined, fit on the whole dataset and then used to create a transformed version of the dataset with each column normalized independently. We can see that the largest raw value for each column now has the value 1.0 and the smallest value for each column now has the value 0.0.
1
2
3
4
5
6
7
8
9
10
[[1.0e+02 1.0e-03]
[8.0e+00 5.0e-02]
[5.0e+01 5.0e-03]
[8.8e+01 7.0e-02]
[4.0e+00 1.0e-01]]
[[1. 0. ]
[0.04166667 0.49494949]
[0.47916667 0.04040404]
[0.875 0.6969697 ]
[0. 1. ]]
Now that we are familiar with normalization, let’s take a closer look at standardization.
Data Standardization
Standardizing a dataset involves rescaling the distribution of values so that the mean of observed values is 0 and the standard deviation is 1.
This can be thought of as subtracting the mean value or centering the data.
Like normalization, standardization can be useful, and even required in some machine learning algorithms when your data has input values with differing scales.
Standardization assumes that your observations fit a Gaussian distribution (bell curve) with a well-behaved mean and standard deviation. You can still standardize your data if this expectation is not met, but you may not get reliable results.
Another […] technique is to calculate the statistical mean and standard deviation of the attribute values, subtract the mean from each value, and divide the result by the standard deviation. This process is called standardizing a statistical variable and results in a set of values whose mean is zero and standard deviation is one.
Standardization requires that you know or are able to accurately estimate the mean and standard deviation of observable values. You may be able to estimate these values from your training data, not the entire dataset.
Again, it is emphasized that the statistics required for the transformation (e.g., the mean) are estimated from the training set and are applied to all data sets (e.g., the test set or new samples).
Subtracting the mean from the data is called centering, whereas dividing by the standard deviation is called scaling. As such, the method is sometime called “center scaling“.
The most straightforward and common data transformation is to center scale the predictor variables. To center a predictor variable, the average predictor value is subtracted from all the values. As a result of centering, the predictor has a zero mean. Similarly, to scale the data, each value of the predictor variable is divided by its standard deviation. Scaling the data coerce the values to have a common standard deviation of one.
We can guesstimate a mean of 10.0 and a standard deviation of about 5.0. Using these values, we can standardize the first value of 20.7 as follows:
y = (x – mean) / standard_deviation
y = (20.7 – 10) / 5
y = (10.7) / 5
y = 2.14
The mean and standard deviation estimates of a dataset can be more robust to new data than the minimum and maximum.
You can standardize your dataset using the scikit-learn object StandardScaler.
We can demonstrate the usage of this class by converting two variables to a range 0-to-1 defined in the previous section. We will use the default configuration that will both center and scale the values in each column, e.g. full standardization.
The complete example is listed below.
1
2
3
4
5
6
7
8
9
10
11
12
13
14
15
# example of a standardization
from numpy import asarray
from sklearn.preprocessing import StandardScaler
# define data
data=asarray([[100,0.001],
[8,0.05],
[50,0.005],
[88,0.07],
[4,0.1]])
print(data)
# define standard scaler
scaler=StandardScaler()
# transform data
scaled=scaler.fit_transform(data)
print(scaled)
Running the example first reports the raw dataset, showing 2 columns with 4 rows as before.
Next, the scaler is defined, fit on the whole dataset and then used to create a transformed version of the dataset with each column standardized independently. We can see that the mean value in each column is assigned a value of 0.0 if present and the values are centered around 0.0 with values both positive and negative.
1
2
3
4
5
6
7
8
9
10
[[1.0e+02 1.0e-03]
[8.0e+00 5.0e-02]
[5.0e+01 5.0e-03]
[8.8e+01 7.0e-02]
[4.0e+00 1.0e-01]]
[[ 1.26398112 -1.16389967]
[-1.06174414 0.12639634]
[ 0. -1.05856939]
[ 0.96062565 0.65304778]
[-1.16286263 1.44302493]]
Next, we can introduce a real dataset that provides the basis for applying normalization and standardization transforms as a part of modeling.
Sonar Dataset
The sonar dataset is a standard machine learning dataset for binary classification.
It involves 60 real-valued inputs and a two-class target variable. There are 208 examples in the dataset and the classes are reasonably balanced.
A baseline classification algorithm can achieve a classification accuracy of about 53.4 percent using repeated stratified 10-fold cross-validation. Top performance on this dataset is about 88 percent using repeated stratified 10-fold cross-validation.
The dataset describes radar returns of rocks or simulated mines.
max 0.137100 0.233900 0.305900 ... 0.044000 0.036400 0.043900
[8 rows x 60 columns]
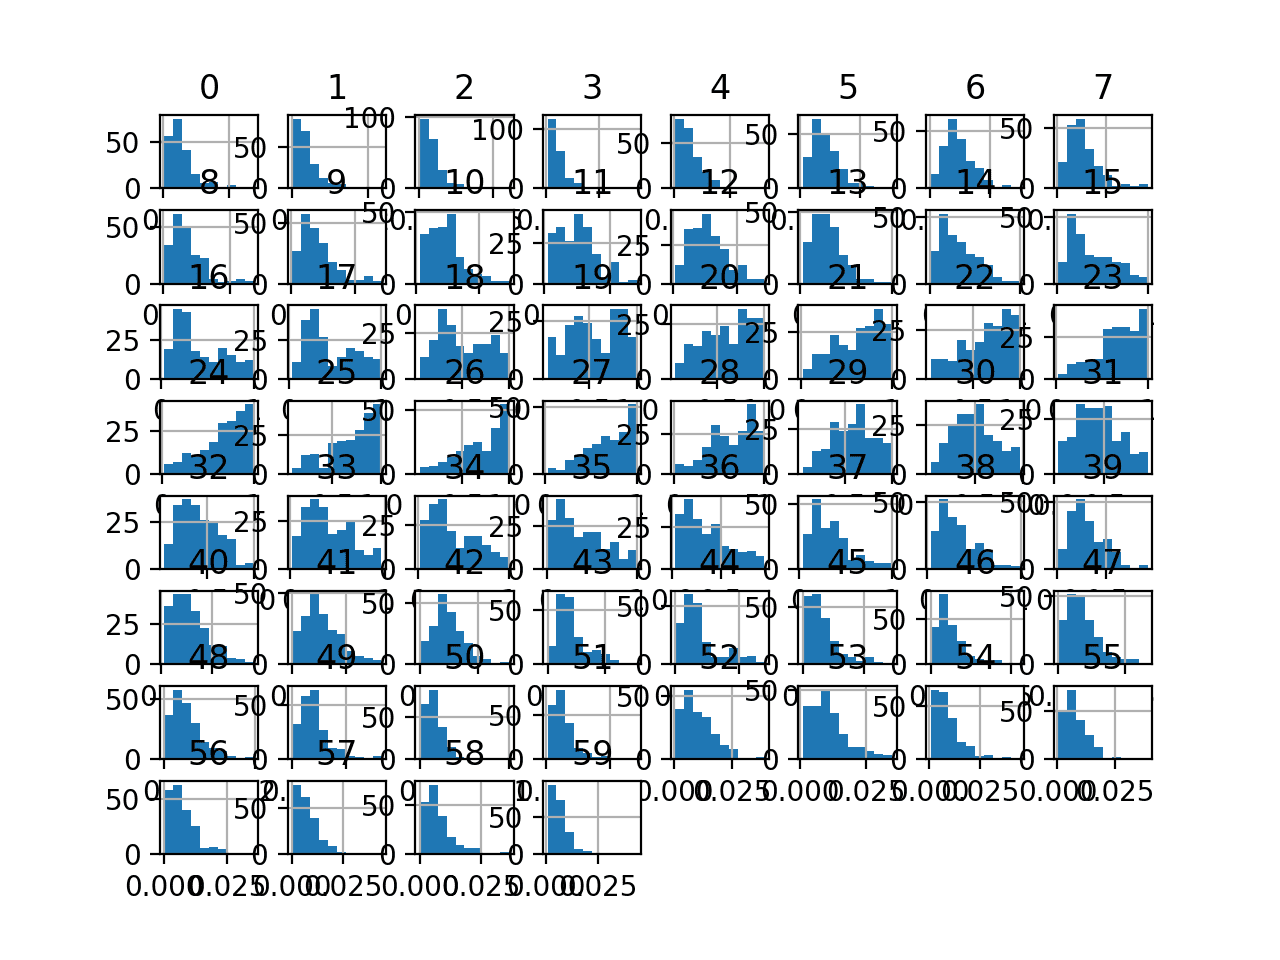
Finally, a histogram is created for each input variable.
If we ignore the clutter of the plots and focus on the histograms themselves, we can see that many variables have a skewed distribution.
The dataset provides a good candidate for using scaler transforms as the variables have differing minimum and maximum values, as well as different data distributions.
Histogram Plots of Input Variables for the Sonar Binary Classification Dataset
Next, let’s fit and evaluate a machine learning model on the raw dataset.
We will use a k-nearest neighbor algorithm with default hyperparameters and evaluate it using repeated stratified k-fold cross-validation. The complete example is listed below.
1
2
3
4
5
6
7
8
9
10
11
12
13
14
15
16
17
18
19
20
21
22
23
24
25
# evaluate knn on the raw sonar dataset
from numpy import mean
from numpy import std
from pandas import read_csv
from sklearn.model_selection import cross_val_score
from sklearn.model_selection import RepeatedStratifiedKFold
from sklearn.neighbors import KNeighborsClassifier
Running the example evaluates a KNN model on the raw sonar dataset.
Note: Your results may vary given the stochastic nature of the algorithm or evaluation procedure, or differences in numerical precision. Consider running the example a few times and compare the average outcome.
We can see that the model achieved a mean classification accuracy of about 79.7 percent, showing that it has skill (better than 53.4 percent) and is in the ball-park of good performance (88 percent).
1
Accuracy: 0.797 (0.073)
Next, let’s explore a scaling transform of the dataset.
MinMaxScaler Transform
We can apply the MinMaxScaler to the Sonar dataset directly to normalize the input variables.
We will use the default configuration and scale values to the range 0 and 1. First, a MinMaxScaler instance is defined with default hyperparameters. Once defined, we can call the fit_transform() function and pass it to our dataset to create a transformed version of our dataset.
1
2
3
4
...
# perform a robust scaler transform of the dataset
trans=MinMaxScaler()
data=trans.fit_transform(data)
Let’s try it on our sonar dataset.
The complete example of creating a MinMaxScaler transform of the sonar dataset and plotting histograms of the result is listed below.
1
2
3
4
5
6
7
8
9
10
11
12
13
14
15
16
17
18
19
20
21
# visualize a minmax scaler transform of the sonar dataset
# perform a robust scaler transform of the dataset
trans=MinMaxScaler()
data=trans.fit_transform(data)
# convert the array back to a dataframe
dataset=DataFrame(data)
# summarize
print(dataset.describe())
# histograms of the variables
dataset.hist()
pyplot.show()
Running the example first reports a summary of each input variable.
We can see that the distributions have been adjusted and that the minimum and maximum values for each variable are now a crisp 0.0 and 1.0 respectively.
max 1.000000 1.000000 1.000000 ... 1.000000 1.000000 1.000000
[8 rows x 60 columns]
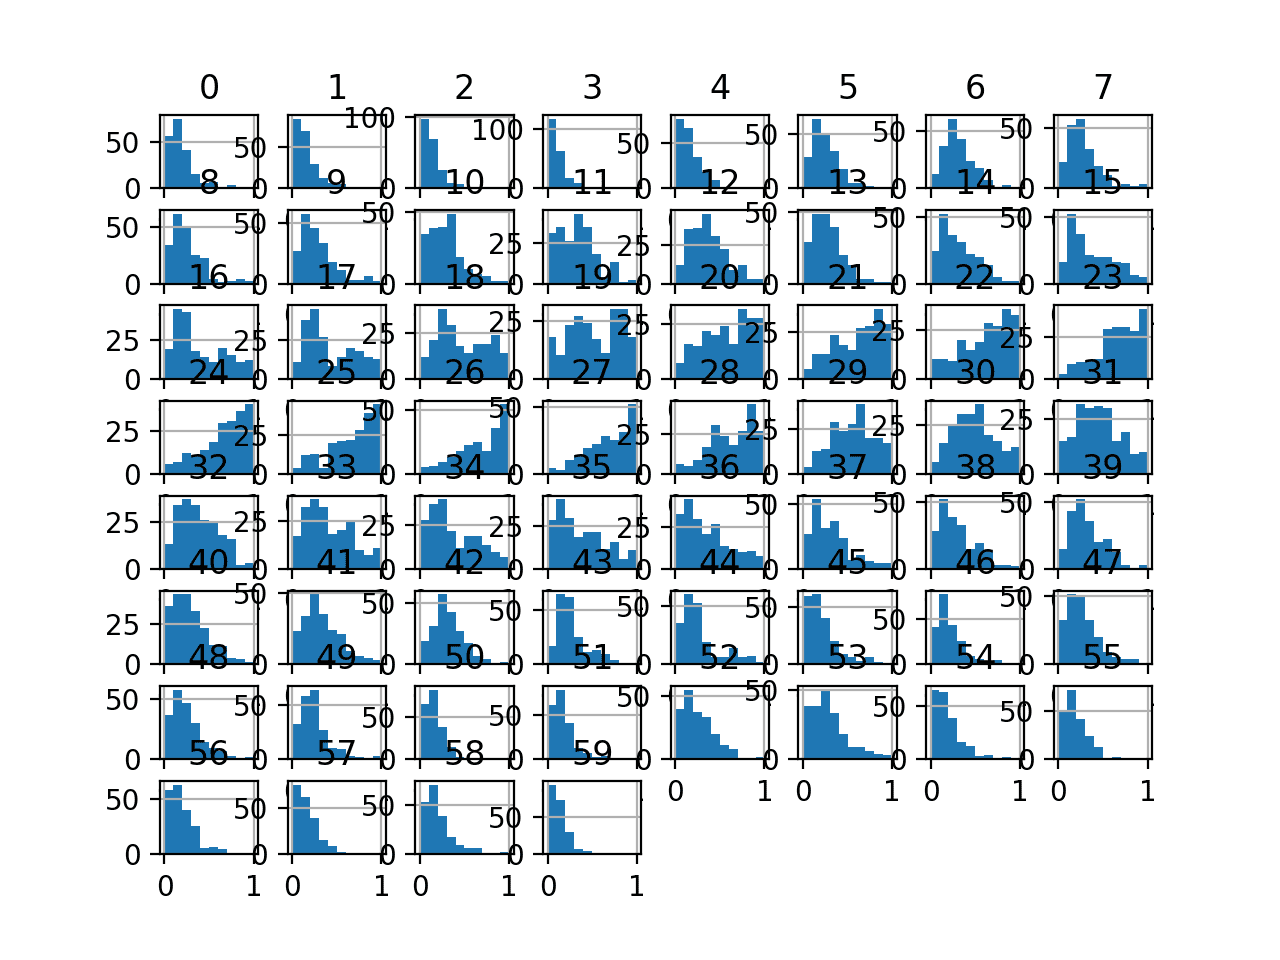
Histogram plots of the variables are created, although the distributions don’t look much different from their original distributions seen in the previous section.
Histogram Plots of MinMaxScaler Transformed Input Variables for the Sonar Dataset
Next, let’s evaluate the same KNN model as the previous section, but in this case, on a MinMaxScaler transform of the dataset.
The complete example is listed below.
1
2
3
4
5
6
7
8
9
10
11
12
13
14
15
16
17
18
19
20
21
22
23
24
25
26
27
28
29
# evaluate knn on the sonar dataset with minmax scaler transform
from numpy import mean
from numpy import std
from pandas import read_csv
from sklearn.model_selection import cross_val_score
from sklearn.model_selection import RepeatedStratifiedKFold
from sklearn.neighbors import KNeighborsClassifier
Note: Your results may vary given the stochastic nature of the algorithm or evaluation procedure, or differences in numerical precision. Consider running the example a few times and compare the average outcome.
Running the example, we can see that the MinMaxScaler transform results in a lift in performance from 79.7 percent accuracy without the transform to about 81.3 percent with the transform.
1
Accuracy: 0.813 (0.085)
Next, let’s explore the effect of standardizing the input variables.
StandardScaler Transform
We can apply the StandardScaler to the Sonar dataset directly to standardize the input variables.
We will use the default configuration and scale values to subtract the mean to center them on 0.0 and divide by the standard deviation to give the standard deviation of 1.0. First, a StandardScaler instance is defined with default hyperparameters.
Once defined, we can call the fit_transform() function and pass it to our dataset to create a transformed version of our dataset.
1
2
3
4
...
# perform a robust scaler transform of the dataset
trans=StandardScaler()
data=trans.fit_transform(data)
Let’s try it on our sonar dataset.
The complete example of creating a StandardScaler transform of the sonar dataset and plotting histograms of the results is listed below.
1
2
3
4
5
6
7
8
9
10
11
12
13
14
15
16
17
18
19
20
21
# visualize a standard scaler transform of the sonar dataset
# perform a robust scaler transform of the dataset
trans=StandardScaler()
data=trans.fit_transform(data)
# convert the array back to a dataframe
dataset=DataFrame(data)
# summarize
print(dataset.describe())
# histograms of the variables
dataset.hist()
pyplot.show()
Running the example first reports a summary of each input variable.
We can see that the distributions have been adjusted and that the mean is a very small number close to zero and the standard deviation is very close to 1.0 for each variable.
max 4.706053e+00 5.944643e+00 ... 4.615037e+00 7.450343e+00
[8 rows x 60 columns]
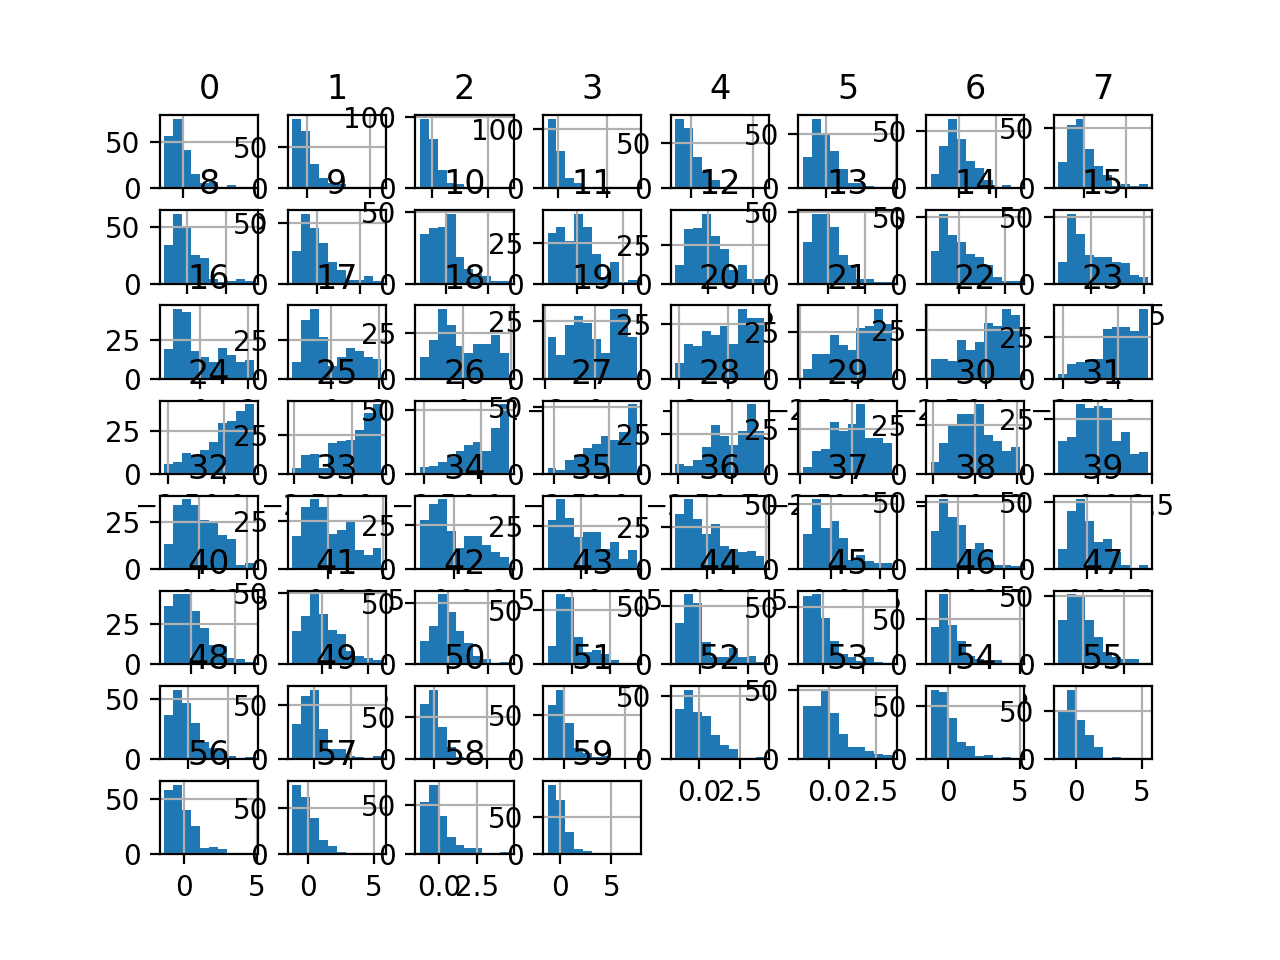
Histogram plots of the variables are created, although the distributions don’t look much different from their original distributions seen in the previous section other than their scale on the x-axis.
Histogram Plots of StandardScaler Transformed Input Variables for the Sonar Dataset
Next, let’s evaluate the same KNN model as the previous section, but in this case, on a StandardScaler transform of the dataset.
The complete example is listed below.
1
2
3
4
5
6
7
8
9
10
11
12
13
14
15
16
17
18
19
20
21
22
23
24
25
26
27
28
29
# evaluate knn on the sonar dataset with standard scaler transform
from numpy import mean
from numpy import std
from pandas import read_csv
from sklearn.model_selection import cross_val_score
from sklearn.model_selection import RepeatedStratifiedKFold
from sklearn.neighbors import KNeighborsClassifier
Note: Your results may vary given the stochastic nature of the algorithm or evaluation procedure, or differences in numerical precision. Consider running the example a few times and compare the average outcome.
Running the example, we can see that the StandardScaler transform results in a lift in performance from 79.7 percent accuracy without the transform to about 81.0 percent with the transform, although slightly lower than the result using the MinMaxScaler.
1
Accuracy: 0.810 (0.080)
Common Questions
This section lists some common questions and answers when scaling numerical data.
Q. Should I Normalize or Standardize?
Whether input variables require scaling depends on the specifics of your problem and of each variable.
You may have a sequence of quantities as inputs, such as prices or temperatures.
If the distribution of the quantity is normal, then it should be standardized, otherwise, the data should be normalized. This applies if the range of quantity values is large (10s, 100s, etc.) or small (0.01, 0.0001).
If the quantity values are small (near 0-1) and the distribution is limited (e.g. standard deviation near 1), then perhaps you can get away with no scaling of the data.
These manipulations are generally used to improve the numerical stability of some calculations. Some models […] benefit from the predictors being on a common scale.
Predictive modeling problems can be complex, and it may not be clear how to best scale input data.
If in doubt, normalize the input sequence. If you have the resources, explore modeling with the raw data, standardized data, and normalized data and see if there is a beneficial difference in the performance of the resulting model.
If the input variables are combined linearly, as in an MLP [Multilayer Perceptron], then it is rarely strictly necessary to standardize the inputs, at least in theory. […] However, there are a variety of practical reasons why standardizing the inputs can make training faster and reduce the chances of getting stuck in local optima.
Standardization can give values that are both positive and negative centered around zero.
It may be desirable to normalize data after it has been standardized.
This might be a good idea of you have a mixture of standardized and normalized variables and wish all input variables to have the same minimum and maximum values as input for a given algorithm, such as an algorithm that calculates distance measures.
Q. But Which is Best?
This is unknowable.
Evaluate models on data prepared with each transform and use the transform or combination of transforms that result in the best performance for your data set on your model.
Q. How Do I Handle Out-of-Bounds Values?
You may normalize your data by calculating the minimum and maximum on the training data.
Later, you may have new data with values smaller or larger than the minimum or maximum respectively.
One simple approach to handling this may be to check for such out-of-bound values and change their values to the known minimum or maximum prior to scaling. Alternately, you may want to estimate the minimum and maximum values used in the normalization manually based on domain knowledge.
Further Reading
This section provides more resources on the topic if you are looking to go deeper.
In this tutorial, you discovered how to use scaler transforms to standardize and normalize numerical input variables for classification and regression.
Specifically, you learned:
Data scaling is a recommended pre-processing step when working with many machine learning algorithms.
Data scaling can be achieved by normalizing or standardizing real-valued input and output variables.
How to apply standardization and normalization to improve the performance of predictive modeling algorithms.
Do you have any questions?
Ask your questions in the comments below and I will do my best to answer.
It provides self-study tutorials with full working code on: Feature Selection, RFE, Data Cleaning, Data Transforms, Scaling, Dimensionality Reduction,
and much more...
Bring Modern Data Preparation Techniques to Your Machine Learning Projects
Thank you for the article Jason! I made the mistake of doing separate scalers on my training and testing set data earlier, and corrected it after reading your article.
Hi there Jason! Thanks for the article! I do have a question though: why is it a bad idea to normalize (or standardize) the entire dataset? That way you wouldnt have to worry about out-of-bounds values.
I´d like to share that I have tested both the naive and the correct approach on my ML problem (oil production forecast) and the difference was very very very tiny, same as what happened to you in the post you referred me to (https://machinelearningmastery.com/data-preparation-without-data-leakage/)!
Hi Jason, for LSTM and random walk time series data is it a better practice to scale all data (training and test) individually (e.g., fit on train and scale training data, then fit on test and scale test data) or should I fit on the training data and the use this fit to also scale the test data?
Hi Jason, Thank you for the informative post. I have a few questions
1. You mentioned the algorithms that use a “weighted sum of the input”. Can you please let me know which algorithms that you’re actually referring to?
2. We should not do the scaling for one-hot-encoded variables. Am I correct?
3. Let’s say we have a variable that is highly skewed. Can we first convert the variable to be normally distributed(using log/power/Box-Cox transformations) and then apply scaling?
4. Regarding the statement “It may be desirable to normalize data after it has been standardized. This might be a good idea of you have a mixture of standardized and normalized variables and wish all input variables to have the same minimum and maximum values as input for a given algorithm, such as an algorithm that calculates distance measures.” Can you please explain a little bit more about this statement, please?
Hi Jason, Thank you so much for the reply. I got the point now what you mean by “weighted sum of input”. And I never tried the 4th one. I will try this next time.
Why do we standardize then normalize as opposed to the other way around? Also, StandardScaler operates under the assumption that the data has a normal distribution, so how would we go about ensuring this
Hi Laura…Great question! The order of **standardization** followed by **normalization** is generally chosen for specific reasons, particularly when you’re dealing with machine learning models that are sensitive to scale and distribution, such as gradient-based models (e.g., neural networks) or models that rely on distances (e.g., k-NN, SVMs).
### 1. **Why Standardize First, Then Normalize?**
– **Standardization** involves shifting the mean of the data to 0 and scaling it to have a standard deviation of 1. It ensures that all features have the same scale but doesn’t restrict the range of the data values. It is especially useful when the data comes from different distributions or is highly skewed.
– **Normalization**, on the other hand, rescales the data to a fixed range, usually between 0 and 1 or -1 and 1, which is essential for models where the data’s absolute range affects performance (e.g., neural networks with activation functions like sigmoid, ReLU).
#### Why standardize first:
– **Preserve Variability**: Standardization removes the bias in scale and centers the data around 0, ensuring each feature has the same variance. By doing this first, you ensure that all features have the same relative importance (even if they are on different scales initially), making normalization more consistent across features.
– **Numerical Stability**: Standardizing first can improve the numerical stability of many machine learning algorithms, especially in high-dimensional spaces.
– **Outliers**: Standardization handles outliers better than normalization because it doesn’t squash the data into a specific range. This way, extreme values don’t get overly compressed during the subsequent normalization step.
#### Why not normalize first:
– **Skewed Distributions**: Normalization does not address skewness or the spread of data. If you normalize first, you’re scaling data without adjusting for the underlying spread or distribution, which could lead to misleading results if your data is highly variable or contains outliers.
– **Reduced Effectiveness**: Normalization alone won’t handle outliers effectively. If you apply normalization directly, extreme values might dominate the range, skewing the results of certain algorithms.
Therefore, **standardization followed by normalization** ensures that the data’s distribution is handled first, and then it’s scaled to a consistent range for the model to process efficiently.
—
### 2. **StandardScaler and Normal Distribution Assumption**
You’re correct that **StandardScaler** operates under the assumption that the data roughly follows a normal distribution (or at least symmetric). While it doesn’t enforce this assumption strictly, the effectiveness of standardization improves if the data is normally distributed. Here’s how to handle this:
#### a. **Checking for Normality**
Before applying StandardScaler, you might want to check if the data follows a normal distribution. You can do this using various methods:
– **Visualization**: Use a **histogram** or **Q-Q plot** (Quantile-Quantile plot) to visually assess whether the data is normally distributed.
– **Statistical Tests**:
– **Shapiro-Wilk test** or **Kolmogorov-Smirnov test**: These tests check for normality. If the p-value is low (usually below 0.05), it suggests that the data significantly deviates from a normal distribution.
#### b. **If Data is Not Normally Distributed**
If your data is not normally distributed, here are a few ways to deal with it:
– **Transformation**: You can apply transformations to make the data more normal-like before applying standardization:
– **Log Transformation**: Useful for data with exponential or skewed distributions.
– **Box-Cox Transformation**: This can help normalize non-normal data.
– **Yeo-Johnson Transformation**: Similar to Box-Cox but works for negative values and zero.
– **RobustScaler**: If your data contains many outliers or deviates from normality, using **RobustScaler** (which scales data based on the interquartile range) might be a better choice. It is less sensitive to outliers and doesn’t assume a normal distribution.
– **MinMaxScaler without Standardization**: For some cases where strict normality isn’t necessary, you can directly apply **MinMaxScaler** to normalize the data without worrying about the distribution. This is particularly useful for neural networks.
—
### Summary:
– **Standardize first, then normalize** to ensure the data has a consistent mean and variance before squashing it into a fixed range. This approach helps avoid distortion due to skewed distributions or outliers.
– **Ensure normality** before using StandardScaler by applying tests like Shapiro-Wilk or visualizing the data. If the data isn’t normally distributed, consider transformations or use scaling methods that don’t assume normality (e.g., RobustScaler).
Let me know if you’d like further details on any part of this process!
Always delighted to go through your tutorials. It has helped me quite alot, and this is no different, delivered as usual. Thank you for this great piece, totally helpful.
Dear Dr Jason,
In the above example the distributions of the individual features did not look symmetric, some historgrams of features are skewed to the left.
Would transforming some features to look symmetric or gaussian improve the model score rather than one transform for all features as in the MinMaxScaler()?
Dear Dr Jason,
To handle out-of-bounds values you suggest to set them to the maximum or minimum.
However I am doing anomaly detection using an encoder-decoder RNN-LSTM, therefore I am particularly interested by the values that are larger in the real data compared to the training data. Should I let the maximum values to be higher than 1?
Thank you,
Timothée
Hi, Jason. I have learned so much from your posts.
I have a question: if my input features vary a lot, that is, one feature values are very small, maybe between 0-10, the other feature values are very big, such as 100-700, how should I minmax scale them? if I just minmax them, how can I know the difference between them?
Hi Jason,
Thank you for all the blogs it helps me every time.
I’m currently trying to figure out one thing about data transformation. When we use .fit_transform(df), this fit and transform all the columns from the dataset. But, how can we get what is the transformation for a particular column.
I usually try to do following:
encoder_dict = defaultdict(MinMaxScaler)
scaledX_train = X_train.apply(lambda x: encoder_dict[x.name].fit_transform(x))
This way I can get a different encoder for all the columns present in the data frame.
Am I doing this correctly? Or should I follow MinMaxScaler().fit_transform(df) only? or both the things are same? I’m really confused on this
I got confused recently due to the fact that I was scaling all my dataset with StandardScaler before splitting train and test set. It turned out it was wrong as I should first split and then scale with fit_transform the training set (so that the mean and std used to scale are not “coming” from the test set) and then use only transform for the validation set (both features and target).
Therefore I did as follows (binary classification problem):
df_idx = df[df.Date == ‘1996-12-01’].index[0] #index where to split
#scale training features
df_training_features_ = df_features.iloc[:df_idx,:]
scaler=StandardScaler()
df_training_features = scaler.fit_transform(df_training_features_)
#scale testset features with only transform
df_validation_features_ = df_features.iloc[df_idx:, :]
df_validation_features = scaler.transform(df_validation_features_)
#scalo il training target
df_training_targets_ = df_targets[:df_idx]
lb = preprocessing.Binarizer(threshold = 0.5)
df_training_targets = lb.fit_transform(df_training_targets_.reshape(1, -1))[0]
Only after this I start doing my hyperparameter tuning, feature selection, and model definition..do you agree? or am I doing the scaling train/test in the wrong way?
Thanks for the post. It is very informative. I do have further questions on standardizing/ normalizing. What if I have both categorical and continuous variables in the feature vector. Do I need to normalize the categorial features? If not, how do I avoid normalizing them using MinMaxScaler() in a pipeline?
Oi Jason, boa noite.
Muito bom o seu artigo. Eu tenho uma pergunta. Supondo que eu gere um predict de uma regressão linear do scikit-learn. Fui obrigado a normalizar os dados com MinMaxScaler (com -1 e 1). Os dados do predict estão normalizados.
Como eu faço para os valores do predict “voltarem aos valores normais”.
Obrigado.
I wonder if you could help me to inverse_transform predictions obtained using in the following code. I am getting large values when I inverse_transform the predictions, which I’m sure not in coherence with the exected amplitude of the data.
# mlp for regression with mse loss function
from keras.models import Sequential
from sklearn.preprocessing import MinMaxScaler
from keras.layers import Dense
from sklearn.utils import shuffle
import numpy as np
from numpy import loadtxt
from sklearn.model_selection import train_test_split
from keras.models import load_model
from matplotlib import pyplot
# load the dataset
dataset = loadtxt(‘AugIC_Train.csv’, delimiter=’,’)
# split into input (X) and output (y) variables
X = dataset[:,0:47]
Y = dataset[:,47]
#save model
model.save(‘IMD_Aug_deeplearning.h5’) # creates a HDF5 file for model to save
# plot loss during training
pyplot.title(‘Loss / Mean Squared Error’)
pyplot.plot(history.history[‘loss’], label=’train’)
pyplot.plot(history.history[‘val_loss’], label=’test’)
pyplot.legend()
pyplot.savefig(‘Jul_training_loss.eps’, format=’eps’)
pyplot.show()
Can you please let me know how to standardize an already partitioned test and train data set. Should they be joined together and use scalar.fit_transform() once followed by splitting them back. Or can i use fit_transform twice seperatily?. which is the right approach?
Hi Jason , I have a dataset where I was using the MinMax Scalar (0,1) but someone recommended me to use the MinMax Scalar (-1,1) and justified that the distribution is better.
I tried calculating the distribution using the ( (x-mean) / standard deviation) for both MinMax Scalar results and got the same values.
Can u tell me if it makes a difference ?
and how is higher distribution better?
and also if standardisation same as Distribution?
Thank you so much
Thanks for the informative article. In the case of features as a mix of ordinal, nominal and continuous numeric variable (i.e. performance rank, gender, salary), after having encoded the ordinal and nominal variables, how should one apply scaling? Should it be scaling just the continuous numeric variable or scale all the features? Appreciate the clarifications on this. Thanks
Thank you so much for this article. I am almost a fan of you in the machine learning area.
My question is as follows:
Say if I have scaled a multivariate dataset(have multiple columns), then I would have a fitted scaler, right? If I want to apply this saved fitted scaler to transform one part of my original dataset (eg: one column of the data), how to do it?
I have met some trouble because of the dimension issue.
It is a very informative post.
I have a question about when we scale our training data in a pipeline and build the model.
After that when we have to measure the metrics in the testing data. Before calling predict function how to transform our testing data as per the training fit metrics.
This is such a comprehensive article. I had a question and searched in many places but couldn’t find an answer to it.
After standardization, I noticed that the columns are automatically renamed to numbers. So I have 200+ columns and I was wondering how I can rename the columns to their original names. Appreciate any help or pointers where I can find a solution to this. Thanks and appreciate it very much.
What is the best mechanism if future data may lie outside the min and max of the training set? If we were somehow able to take a good guess at what the smallest possible min and largest possible max might be, how would we make sure that the training data normalization is not too tightly bunched up?
If I want to standardize my data for a regression model with cross-validation…
There are three alternatives:
– standardize the training data and apply this standardization to the testing data. (All tutorials and docs use this option).
– standardize the training data and the testing data separately.
– standardize all the data together.
I have a dataset where one of the variables is normaly distributed but all of the others are not. Does It make sense to use a StandardScaler on the data normaly distributed and a MinMax scaler on the other variables?
As per your article —
Q. Should I Standardize then Normalize?
(Or in the case of —-Standardization & then Transformation for eg. Log, power, Square-root etc)
With reference to the aforesaid scenario—could you have explain the same with a Use-Case or a Business Scenario along with the approach of solving using a dataset?
An article/write-up on such topics would indeed be helpful…
i’m Amina interested in deep learning. i’ve been struggling to predict the wind speed using lstm models with wind direction, pressure, temperature, relative humidity as inputs. I use the Z-score to scale all the data and predict for the next 48h. i’ve been facing to a problem when i want to calcule the real values of the wind speed after prediction. this is my cde please do help to correct the line code wich is not twell written.


Thank you for the article Jason! I made the mistake of doing separate scalers on my training and testing set data earlier, and corrected it after reading your article.
Well done on catching the problem!
Why is my only option to reply to someone, why i can’t just leave a comment??
Also, you always use:
scaled = scaler.fit_transform(data)
But you never explain WTF is fit_transform, you never defined it.
Going to look for better examples.
fit_transform() means to fit() the data, then transform the same data. It is just a handy function.
Comments should be allowed, maybe adblock on your browser causing issue?
Excellent article! Thank you!
Thanks!
Nice work
Thanks!
Hi there Jason! Thanks for the article! I do have a question though: why is it a bad idea to normalize (or standardize) the entire dataset? That way you wouldnt have to worry about out-of-bounds values.
Thank you!
Good question, see this:
https://machinelearningmastery.com/data-preparation-without-data-leakage/
Interesting, like all your other articles!
I´d like to share that I have tested both the naive and the correct approach on my ML problem (oil production forecast) and the difference was very very very tiny, same as what happened to you in the post you referred me to (https://machinelearningmastery.com/data-preparation-without-data-leakage/)!
Thank you for your help.
Thanks!
Nice work.
Hi Jason,
How do you feel about log transform comparing to standard scaler and normalization? Any pros & cons and when to use which?
Thanks!
Yes, they solve different problems.
Log/power transforms fix skewness:
https://machinelearningmastery.com/power-transforms-with-scikit-learn/
Hi Jason, for LSTM and random walk time series data is it a better practice to scale all data (training and test) individually (e.g., fit on train and scale training data, then fit on test and scale test data) or should I fit on the training data and the use this fit to also scale the test data?
Thanks for your tutorials, they are all amazing!
Good question.
With time series, fit transforms on train, apply to train and out of sample.
Hi Jason, Thank you for the informative post. I have a few questions
1. You mentioned the algorithms that use a “weighted sum of the input”. Can you please let me know which algorithms that you’re actually referring to?
2. We should not do the scaling for one-hot-encoded variables. Am I correct?
3. Let’s say we have a variable that is highly skewed. Can we first convert the variable to be normally distributed(using log/power/Box-Cox transformations) and then apply scaling?
4. Regarding the statement “It may be desirable to normalize data after it has been standardized. This might be a good idea of you have a mixture of standardized and normalized variables and wish all input variables to have the same minimum and maximum values as input for a given algorithm, such as an algorithm that calculates distance measures.” Can you please explain a little bit more about this statement, please?
You’re welcome.
Linear regression, logistic regression, neural nets.
Correct.
Yes.
You would first standardize a feature then normalize it.
Hi Jason, Thank you so much for the reply. I got the point now what you mean by “weighted sum of input”. And I never tried the 4th one. I will try this next time.
You’re welcome.
Why do we standardize then normalize as opposed to the other way around? Also, StandardScaler operates under the assumption that the data has a normal distribution, so how would we go about ensuring this
Hi Laura…Great question! The order of **standardization** followed by **normalization** is generally chosen for specific reasons, particularly when you’re dealing with machine learning models that are sensitive to scale and distribution, such as gradient-based models (e.g., neural networks) or models that rely on distances (e.g., k-NN, SVMs).
### 1. **Why Standardize First, Then Normalize?**
– **Standardization** involves shifting the mean of the data to 0 and scaling it to have a standard deviation of 1. It ensures that all features have the same scale but doesn’t restrict the range of the data values. It is especially useful when the data comes from different distributions or is highly skewed.
– **Normalization**, on the other hand, rescales the data to a fixed range, usually between 0 and 1 or -1 and 1, which is essential for models where the data’s absolute range affects performance (e.g., neural networks with activation functions like sigmoid, ReLU).
#### Why standardize first:
– **Preserve Variability**: Standardization removes the bias in scale and centers the data around 0, ensuring each feature has the same variance. By doing this first, you ensure that all features have the same relative importance (even if they are on different scales initially), making normalization more consistent across features.
– **Numerical Stability**: Standardizing first can improve the numerical stability of many machine learning algorithms, especially in high-dimensional spaces.
– **Outliers**: Standardization handles outliers better than normalization because it doesn’t squash the data into a specific range. This way, extreme values don’t get overly compressed during the subsequent normalization step.
#### Why not normalize first:
– **Skewed Distributions**: Normalization does not address skewness or the spread of data. If you normalize first, you’re scaling data without adjusting for the underlying spread or distribution, which could lead to misleading results if your data is highly variable or contains outliers.
– **Reduced Effectiveness**: Normalization alone won’t handle outliers effectively. If you apply normalization directly, extreme values might dominate the range, skewing the results of certain algorithms.
Therefore, **standardization followed by normalization** ensures that the data’s distribution is handled first, and then it’s scaled to a consistent range for the model to process efficiently.
—
### 2. **StandardScaler and Normal Distribution Assumption**
You’re correct that **StandardScaler** operates under the assumption that the data roughly follows a normal distribution (or at least symmetric). While it doesn’t enforce this assumption strictly, the effectiveness of standardization improves if the data is normally distributed. Here’s how to handle this:
#### a. **Checking for Normality**
Before applying StandardScaler, you might want to check if the data follows a normal distribution. You can do this using various methods:
– **Visualization**: Use a **histogram** or **Q-Q plot** (Quantile-Quantile plot) to visually assess whether the data is normally distributed.
– **Statistical Tests**:
– **Shapiro-Wilk test** or **Kolmogorov-Smirnov test**: These tests check for normality. If the p-value is low (usually below 0.05), it suggests that the data significantly deviates from a normal distribution.
#### b. **If Data is Not Normally Distributed**
If your data is not normally distributed, here are a few ways to deal with it:
– **Transformation**: You can apply transformations to make the data more normal-like before applying standardization:
– **Log Transformation**: Useful for data with exponential or skewed distributions.
– **Box-Cox Transformation**: This can help normalize non-normal data.
– **Yeo-Johnson Transformation**: Similar to Box-Cox but works for negative values and zero.
– **RobustScaler**: If your data contains many outliers or deviates from normality, using **RobustScaler** (which scales data based on the interquartile range) might be a better choice. It is less sensitive to outliers and doesn’t assume a normal distribution.
– **MinMaxScaler without Standardization**: For some cases where strict normality isn’t necessary, you can directly apply **MinMaxScaler** to normalize the data without worrying about the distribution. This is particularly useful for neural networks.
—
### Summary:
– **Standardize first, then normalize** to ensure the data has a consistent mean and variance before squashing it into a fixed range. This approach helps avoid distortion due to skewed distributions or outliers.
– **Ensure normality** before using StandardScaler by applying tests like Shapiro-Wilk or visualizing the data. If the data isn’t normally distributed, consider transformations or use scaling methods that don’t assume normality (e.g., RobustScaler).
Let me know if you’d like further details on any part of this process!
Always delighted to go through your tutorials. It has helped me quite alot, and this is no different, delivered as usual. Thank you for this great piece, totally helpful.
Thanks, I’m happy to hear that!
Dear Dr Jason,
In the above example the distributions of the individual features did not look symmetric, some historgrams of features are skewed to the left.
Would transforming some features to look symmetric or gaussian improve the model score rather than one transform for all features as in the MinMaxScaler()?
To illustrate there is a tutorial on your site at https://machinelearningmastery.com/how-to-transform-data-to-fit-the-normal-distribution/
Thank you,
Anthony of Sydney
It may, e.g. using a power transform.
Dear Dr Jason,
Thank you, it is appreciated.
Anthony of Sydney
You’re welcome.
Dear Dr Jason,
To handle out-of-bounds values you suggest to set them to the maximum or minimum.
However I am doing anomaly detection using an encoder-decoder RNN-LSTM, therefore I am particularly interested by the values that are larger in the real data compared to the training data. Should I let the maximum values to be higher than 1?
Thank you,
Timothée
If a value exceeds the prior known min/max then it is very likely an outlier and does not need to be classified by your model.
Or you you can use the standardscaler or robustscaler instead if the minmaxscaler.
Showing the implementation made that fit like two jigsaws.
Thankyou
Thanks!
Hi!
When I have a model for energy theft detection (fraud), it’s minmax scaler better than standard scaler? (dataset = daily consumption kWh)
Wich is the best option?
Thanks!
If you are unsure, perhaps try both and compare the results on your model to working with raw data.
Hi, Jason. I have learned so much from your posts.
I have a question: if my input features vary a lot, that is, one feature values are very small, maybe between 0-10, the other feature values are very big, such as 100-700, how should I minmax scale them? if I just minmax them, how can I know the difference between them?
Yes, try it and compare results to a model operating on raw data.
Hi Jason,
Thank you for all the blogs it helps me every time.
I’m currently trying to figure out one thing about data transformation. When we use .fit_transform(df), this fit and transform all the columns from the dataset. But, how can we get what is the transformation for a particular column.
I usually try to do following:
encoder_dict = defaultdict(MinMaxScaler)
scaledX_train = X_train.apply(lambda x: encoder_dict[x.name].fit_transform(x))
This way I can get a different encoder for all the columns present in the data frame.
Am I doing this correctly? Or should I follow MinMaxScaler().fit_transform(df) only? or both the things are same? I’m really confused on this
You’re welcome.
The former, not the later. It handles all columns automatically for you.
Hi Jason,
thanks for this post.
I got confused recently due to the fact that I was scaling all my dataset with StandardScaler before splitting train and test set. It turned out it was wrong as I should first split and then scale with fit_transform the training set (so that the mean and std used to scale are not “coming” from the test set) and then use only transform for the validation set (both features and target).
Therefore I did as follows (binary classification problem):
df_idx = df[df.Date == ‘1996-12-01’].index[0] #index where to split
df_targets = df[‘Label’].values
df_features = df.drop([‘Regime’,’Date’,’Label’], axis=1)
#scale training features
df_training_features_ = df_features.iloc[:df_idx,:]
scaler=StandardScaler()
df_training_features = scaler.fit_transform(df_training_features_)
#scale testset features with only transform
df_validation_features_ = df_features.iloc[df_idx:, :]
df_validation_features = scaler.transform(df_validation_features_)
#scalo il training target
df_training_targets_ = df_targets[:df_idx]
lb = preprocessing.Binarizer(threshold = 0.5)
df_training_targets = lb.fit_transform(df_training_targets_.reshape(1, -1))[0]
df_validation_targets_ = df_targets[df_idx:]
df_validation_targets = lb.fit_transform(df_validation_targets_.reshape(1, -1))[0]
Only after this I start doing my hyperparameter tuning, feature selection, and model definition..do you agree? or am I doing the scaling train/test in the wrong way?
Many thanks
Luigi
Yes, split then prepare.
Ideally, if you use a pipeline and nested CV, then it is all handled for you.
ok thanks, do you have an article on this where you show pipeline and nested CV? just to have an idea about the coding part. Many thanks
Yes, the search box at the top of the page will locate it.
Here is the link:
https://machinelearningmastery.com/nested-cross-validation-for-machine-learning-with-python/
Thanks a lot!!!
You’re welcome.
Hi Jason,
Thanks for the post. It is very informative. I do have further questions on standardizing/ normalizing. What if I have both categorical and continuous variables in the feature vector. Do I need to normalize the categorial features? If not, how do I avoid normalizing them using MinMaxScaler() in a pipeline?
You’re welcome.
No, just the numeric variables are scaled.
A ColumnTransformer lets you choose what variables/columns to transform:
https://machinelearningmastery.com/columntransformer-for-numerical-and-categorical-data/
Oi Jason, boa noite.
Muito bom o seu artigo. Eu tenho uma pergunta. Supondo que eu gere um predict de uma regressão linear do scikit-learn. Fui obrigado a normalizar os dados com MinMaxScaler (com -1 e 1). Os dados do predict estão normalizados.
Como eu faço para os valores do predict “voltarem aos valores normais”.
Obrigado.
Good question, you can invert the scaling on the predictions manually, e.g. inverse_transform().
Alternately you can use the TransformedTargetRegressor which will do it for you (I believe – if my memory is correct):
https://machinelearningmastery.com/how-to-transform-target-variables-for-regression-with-scikit-learn/
Valeu Jason … muito obrigado.
RCG.
You’re very welcome!
Hi Jason,
So, if I want to standardize two columns of a dataset SEPARATELY, should I instantiate two separate objects of the StandardScaler?
Good question!
No, you can provide a matrix to fit() and transform() and it clever enough to keep each variable/column separate.
Hi Jason,
I wonder if you could help me to inverse_transform predictions obtained using in the following code. I am getting large values when I inverse_transform the predictions, which I’m sure not in coherence with the exected amplitude of the data.
# mlp for regression with mse loss function
from keras.models import Sequential
from sklearn.preprocessing import MinMaxScaler
from keras.layers import Dense
from sklearn.utils import shuffle
import numpy as np
from numpy import loadtxt
from sklearn.model_selection import train_test_split
from keras.models import load_model
from matplotlib import pyplot
# load the dataset
dataset = loadtxt(‘AugIC_Train.csv’, delimiter=’,’)
# split into input (X) and output (y) variables
X = dataset[:,0:47]
Y = dataset[:,47]
X, Y = shuffle(X, Y)
scalerX = MinMaxScaler().fit_transform(X)
scalery = MinMaxScaler().fit_transform(Y.reshape(len(Y),1))
# split into train and test
x_train, x_test, y_train, y_test = train_test_split(scalerX, scalery)
# define the keras model
model = Sequential()
# Model
model.add(Dense(200, kernel_initializer=’normal’,input_dim = x_train.shape[1], activation=’relu’))
model.add(Dense(50, kernel_initializer=’normal’,activation=’relu’))
model.add(Dense(1, kernel_initializer=’normal’,activation=’relu’))
# Compile the network :
model.compile(loss=’mean_absolute_error’, optimizer=’adam’)
model.summary()
# fit model
history = model.fit(x_train, y_train, validation_data=(x_test, y_test), epochs=10, verbose=1, batch_size=32, validation_split = 0.2)
# evaluate the model
train_mse = model.evaluate(x_train, y_train, verbose=1)
test_mse = model.evaluate(x_test, y_test, verbose=1)
print(‘Train: %.3f, Test: %.3f’ % (train_mse, test_mse))
#save model
model.save(‘IMD_Aug_deeplearning.h5’) # creates a HDF5 file for model to save
# plot loss during training
pyplot.title(‘Loss / Mean Squared Error’)
pyplot.plot(history.history[‘loss’], label=’train’)
pyplot.plot(history.history[‘val_loss’], label=’test’)
pyplot.legend()
pyplot.savefig(‘Jul_training_loss.eps’, format=’eps’)
pyplot.show()
# make regress predictions with the model
predictions = scalery.inverse_transform(model.predict(X))
np.savetxt(“Aug_trainresults.csv”, predictions, delimiter=”,”)
print(predictions.shape)
print(X.shape)
Sorry, I don’t have the capacity to review/debug code. I hope you can understand.
Perhaps this will help you to make predictions:
https://machinelearningmastery.com/how-to-make-classification-and-regression-predictions-for-deep-learning-models-in-keras/
Hi Jason,
Can you please let me know how to standardize an already partitioned test and train data set. Should they be joined together and use scalar.fit_transform() once followed by splitting them back. Or can i use fit_transform twice seperatily?. which is the right approach?
No, fit the scaler on the training set, then apply to training set and test set.
Should i standradize/Normalize target variable or dependent variable? If yes, can we use inverse transform to get the actual output?
Perhaps try bot and see what works best for your datasets.
Yes, inverse transform the predictions to return to the original units.
Hi Jason , I have a dataset where I was using the MinMax Scalar (0,1) but someone recommended me to use the MinMax Scalar (-1,1) and justified that the distribution is better.
I tried calculating the distribution using the ( (x-mean) / standard deviation) for both MinMax Scalar results and got the same values.
Can u tell me if it makes a difference ?
and how is higher distribution better?
and also if standardisation same as Distribution?
Thank you so much
If it works better for your data and model, then use it.
Hi,
Thank you for your article.
My question is the following:
Should I scale all the features/columns in my dataset? if no, how to know which to scale and which to keep as is?
Thank you so much.
If you’re unsure, yes.
Hi Jason,
Thanks for the informative article. In the case of features as a mix of ordinal, nominal and continuous numeric variable (i.e. performance rank, gender, salary), after having encoded the ordinal and nominal variables, how should one apply scaling? Should it be scaling just the continuous numeric variable or scale all the features? Appreciate the clarifications on this. Thanks
Do not scale the ordinal and nominal variables. That doesn’t make sense.
Thank you
Thank you so much for this article. I am almost a fan of you in the machine learning area.
My question is as follows:
Say if I have scaled a multivariate dataset(have multiple columns), then I would have a fitted scaler, right? If I want to apply this saved fitted scaler to transform one part of my original dataset (eg: one column of the data), how to do it?
I have met some trouble because of the dimension issue.
Hi Nate…The following will hopefully be of interest to you:
https://machinelearningmastery.com/framework-for-data-preparation-for-machine-learning/
Hi Jason,
It is a very informative post.
I have a question about when we scale our training data in a pipeline and build the model.
After that when we have to measure the metrics in the testing data. Before calling predict function how to transform our testing data as per the training fit metrics.
Hi Udit…Please clarify your question so that I may better assist you.
Hi Jason,
This is such a comprehensive article. I had a question and searched in many places but couldn’t find an answer to it.
After standardization, I noticed that the columns are automatically renamed to numbers. So I have 200+ columns and I was wondering how I can rename the columns to their original names. Appreciate any help or pointers where I can find a solution to this. Thanks and appreciate it very much.
Sankara
Hi Sankara…Column names should not be included in the normalization process. Please clarify if I have misunderstood your question.
What is the best mechanism if future data may lie outside the min and max of the training set? If we were somehow able to take a good guess at what the smallest possible min and largest possible max might be, how would we make sure that the training data normalization is not too tightly bunched up?
Hi Greg…Your model could be retrained in a “walk-forward” manner to account for changing features such as trend, seasonality and residual error.
Hello.
If I want to standardize my data for a regression model with cross-validation…
There are three alternatives:
– standardize the training data and apply this standardization to the testing data. (All tutorials and docs use this option).
– standardize the training data and the testing data separately.
– standardize all the data together.
What is the difference?
What is the best method?
Hi Jason,
Thank you so much for this article.
Does “StandardScaler” scales data by the standard deviations of each single feature? or it uses the full correlation matrix?
Hi Bahar…The following resource may add clarity:
https://scikit-learn.org/stable/modules/generated/sklearn.preprocessing.StandardScaler.html
Hello Jason,
I have a dataset where one of the variables is normaly distributed but all of the others are not. Does It make sense to use a StandardScaler on the data normaly distributed and a MinMax scaler on the other variables?
Hi Caio…The following resource may be of interest:
https://towardsdatascience.com/scale-standardize-or-normalize-with-scikit-learn-6ccc7d176a02
Hi Jason,
As per your article —
Q. Should I Standardize then Normalize?
(Or in the case of —-Standardization & then Transformation for eg. Log, power, Square-root etc)
With reference to the aforesaid scenario—could you have explain the same with a Use-Case or a Business Scenario along with the approach of solving using a dataset?
An article/write-up on such topics would indeed be helpful…
Just a suggestion… Thought of letting you know..
hi Jason,
i’m Amina interested in deep learning. i’ve been struggling to predict the wind speed using lstm models with wind direction, pressure, temperature, relative humidity as inputs. I use the Z-score to scale all the data and predict for the next 48h. i’ve been facing to a problem when i want to calcule the real values of the wind speed after prediction. this is my cde please do help to correct the line code wich is not twell written.
prediction_test=[]
batch_one=train_df[-WS:].to_numpy()
batch_new=batch_one.reshape((1,WS,9))
for i in range(len(test_df)):
first_pred=Model.predict(batch_new)[0]
prediction_test.append(first_pred)
batch_new=np.append(batch_new[:,1:,:],[[first_pred]], axis=1)
prediction_test
## Denormalising
def INver_transform(arr):
arr=(arr*train_std) + train_mean
return arr
value_error: the length of data is 48h and the index 9 doest not match
Hi Amina…Perhaps there is an issue with the shape of your data:
https://machinelearningmastery.com/reshape-input-data-long-short-term-memory-networks-keras/