Once you fit a deep learning neural network model, you must evaluate its performance on a test dataset.
This is critical, as the reported performance allows you to both choose between candidate models and to communicate to stakeholders about how good the model is at solving the problem.
The Keras deep learning API model is very limited in terms of the metrics that you can use to report the model performance.
I am frequently asked questions, such as:
How can I calculate the precision and recall for my model?
And:
How can I calculate the F1-score or confusion matrix for my model?
In this tutorial, you will discover how to calculate metrics to evaluate your deep learning neural network model with a step-by-step example.
After completing this tutorial, you will know:
- How to use the scikit-learn metrics API to evaluate a deep learning model.
- How to make both class and probability predictions with a final model required by the scikit-learn API.
- How to calculate precision, recall, F1-score, ROC AUC, and more with the scikit-learn API for a model.
Kick-start your project with my new book Deep Learning With Python, including step-by-step tutorials and the Python source code files for all examples.
Let’s get started.
- Mar/2019: First publish
- Update Jan/2020: Updated API for Keras 2.3 and TensorFlow 2.0.

How to Calculate Precision, Recall, F1, and More for Deep Learning Models
Photo by John, some rights reserved.
Tutorial Overview
This tutorial is divided into three parts; they are:
- Binary Classification Problem
- Multilayer Perceptron Model
- How to Calculate Model Metrics
Binary Classification Problem
We will use a standard binary classification problem as the basis for this tutorial, called the “two circles” problem.
It is called the two circles problem because the problem is comprised of points that when plotted, show two concentric circles, one for each class. As such, this is an example of a binary classification problem. The problem has two inputs that can be interpreted as x and y coordinates on a graph. Each point belongs to either the inner or outer circle.
The make_circles() function in the scikit-learn library allows you to generate samples from the two circles problem. The “n_samples” argument allows you to specify the number of samples to generate, divided evenly between the two classes. The “noise” argument allows you to specify how much random statistical noise is added to the inputs or coordinates of each point, making the classification task more challenging. The “random_state” argument specifies the seed for the pseudorandom number generator, ensuring that the same samples are generated each time the code is run.
The example below generates 1,000 samples, with 0.1 statistical noise and a seed of 1.
|
1 2 |
# generate 2d classification dataset X, y = make_circles(n_samples=1000, noise=0.1, random_state=1) |
Once generated, we can create a plot of the dataset to get an idea of how challenging the classification task is.
The example below generates samples and plots them, coloring each point according to the class, where points belonging to class 0 (outer circle) are colored blue and points that belong to class 1 (inner circle) are colored orange.
|
1 2 3 4 5 6 7 8 9 10 11 |
# Example of generating samples from the two circle problem from sklearn.datasets import make_circles from matplotlib import pyplot from numpy import where # generate 2d classification dataset X, y = make_circles(n_samples=1000, noise=0.1, random_state=1) # scatter plot, dots colored by class value for i in range(2): samples_ix = where(y == i) pyplot.scatter(X[samples_ix, 0], X[samples_ix, 1]) pyplot.show() |
Running the example generates the dataset and plots the points on a graph, clearly showing two concentric circles for points belonging to class 0 and class 1.
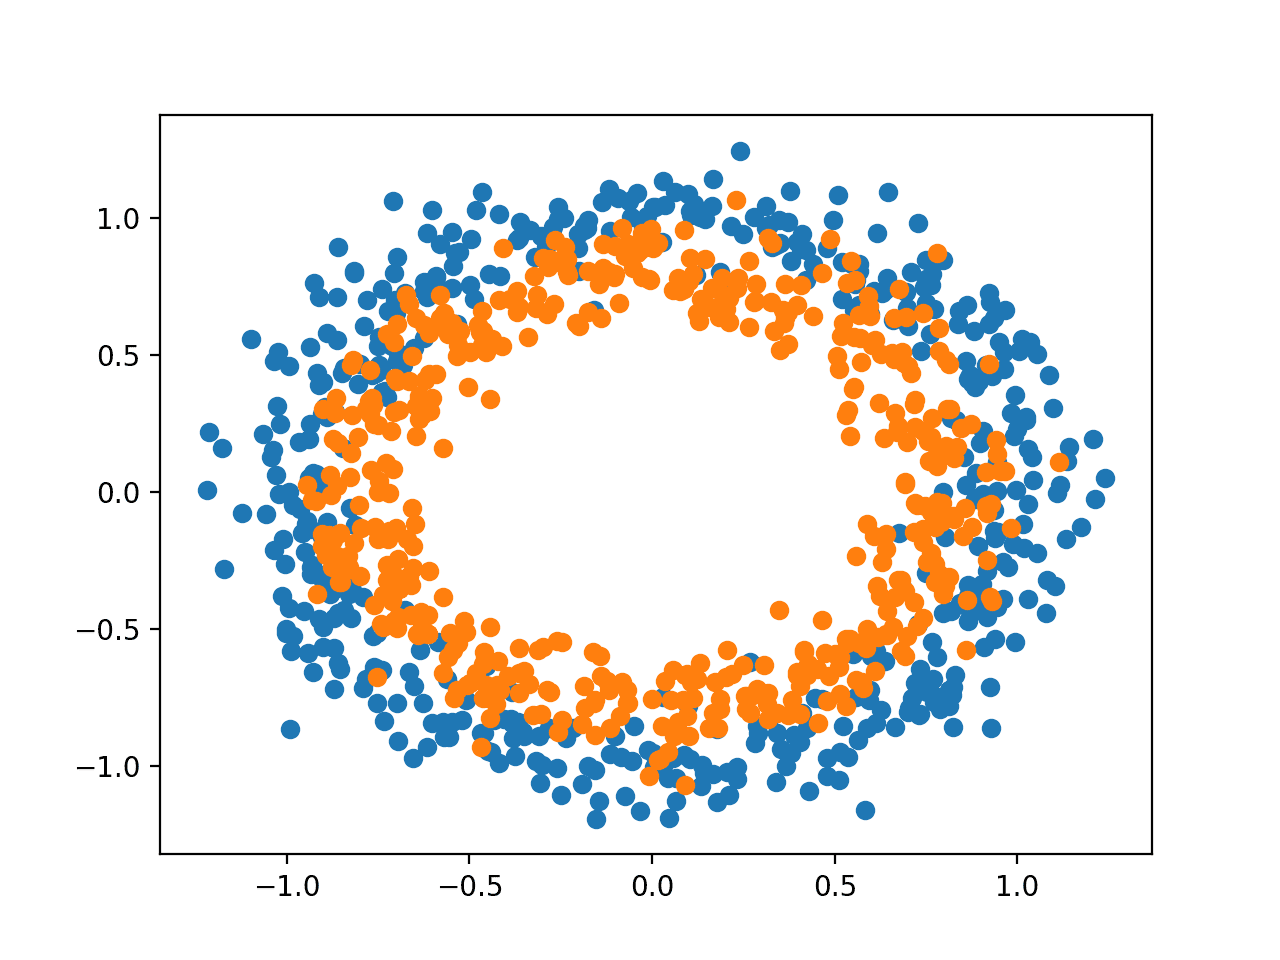
Scatter Plot of Samples From the Two Circles Problem
Multilayer Perceptron Model
We will develop a Multilayer Perceptron, or MLP, model to address the binary classification problem.
This model is not optimized for the problem, but it is skillful (better than random).
After the samples for the dataset are generated, we will split them into two equal parts: one for training the model and one for evaluating the trained model.
|
1 2 3 4 |
# split into train and test n_test = 500 trainX, testX = X[:n_test, :], X[n_test:, :] trainy, testy = y[:n_test], y[n_test:] |
Next, we can define our MLP model. The model is simple, expecting 2 input variables from the dataset, a single hidden layer with 100 nodes, and a ReLU activation function, then an output layer with a single node and a sigmoid activation function.
The model will predict a value between 0 and 1 that will be interpreted as to whether the input example belongs to class 0 or class 1.
|
1 2 3 4 |
# define model model = Sequential() model.add(Dense(100, input_shape=(2,), activation='relu')) model.add(Dense(1, activation='sigmoid')) |
The model will be fit using the binary cross entropy loss function and we will use the efficient Adam version of stochastic gradient descent. The model will also monitor the classification accuracy metric.
|
1 2 |
# compile model model.compile(loss='binary_crossentropy', optimizer='adam', metrics=['accuracy']) |
We will fit the model for 300 training epochs with the default batch size of 32 samples and evaluate the performance of the model at the end of each training epoch on the test dataset.
|
1 2 |
# fit model history = model.fit(trainX, trainy, validation_data=(testX, testy), epochs=300, verbose=0) |
At the end of training, we will evaluate the final model once more on the train and test datasets and report the classification accuracy.
|
1 2 3 |
# evaluate the model _, train_acc = model.evaluate(trainX, trainy, verbose=0) _, test_acc = model.evaluate(testX, testy, verbose=0) |
Finally, the performance of the model on the train and test sets recorded during training will be graphed using a line plot, one for each of the loss and the classification accuracy.
|
1 2 3 4 5 6 7 8 9 10 11 12 13 |
# plot loss during training pyplot.subplot(211) pyplot.title('Loss') pyplot.plot(history.history['loss'], label='train') pyplot.plot(history.history['val_loss'], label='test') pyplot.legend() # plot accuracy during training pyplot.subplot(212) pyplot.title('Accuracy') pyplot.plot(history.history['accuracy'], label='train') pyplot.plot(history.history['val_accuracy'], label='test') pyplot.legend() pyplot.show() |
Tying all of these elements together, the complete code listing of training and evaluating an MLP on the two circles problem is listed below.
|
1 2 3 4 5 6 7 8 9 10 11 12 13 14 15 16 17 18 19 20 21 22 23 24 25 26 27 28 29 30 31 32 33 34 35 36 |
# multilayer perceptron model for the two circles problem from sklearn.datasets import make_circles from keras.models import Sequential from keras.layers import Dense from matplotlib import pyplot # generate dataset X, y = make_circles(n_samples=1000, noise=0.1, random_state=1) # split into train and test n_test = 500 trainX, testX = X[:n_test, :], X[n_test:, :] trainy, testy = y[:n_test], y[n_test:] # define model model = Sequential() model.add(Dense(100, input_shape=(2,), activation='relu')) model.add(Dense(1, activation='sigmoid')) # compile model model.compile(loss='binary_crossentropy', optimizer='adam', metrics=['accuracy']) # fit model history = model.fit(trainX, trainy, validation_data=(testX, testy), epochs=300, verbose=0) # evaluate the model _, train_acc = model.evaluate(trainX, trainy, verbose=0) _, test_acc = model.evaluate(testX, testy, verbose=0) print('Train: %.3f, Test: %.3f' % (train_acc, test_acc)) # plot loss during training pyplot.subplot(211) pyplot.title('Loss') pyplot.plot(history.history['loss'], label='train') pyplot.plot(history.history['val_loss'], label='test') pyplot.legend() # plot accuracy during training pyplot.subplot(212) pyplot.title('Accuracy') pyplot.plot(history.history['accuracy'], label='train') pyplot.plot(history.history['val_accuracy'], label='test') pyplot.legend() pyplot.show() |
Running the example fits the model very quickly on the CPU (no GPU is required).
Note: Your results may vary given the stochastic nature of the algorithm or evaluation procedure, or differences in numerical precision. Consider running the example a few times and compare the average outcome.
The model is evaluated, reporting the classification accuracy on the train and test sets of about 83% and 85% respectively.
|
1 |
Train: 0.838, Test: 0.850 |
A figure is created showing two line plots: one for the learning curves of the loss on the train and test sets and one for the classification on the train and test sets.
The plots suggest that the model has a good fit on the problem.
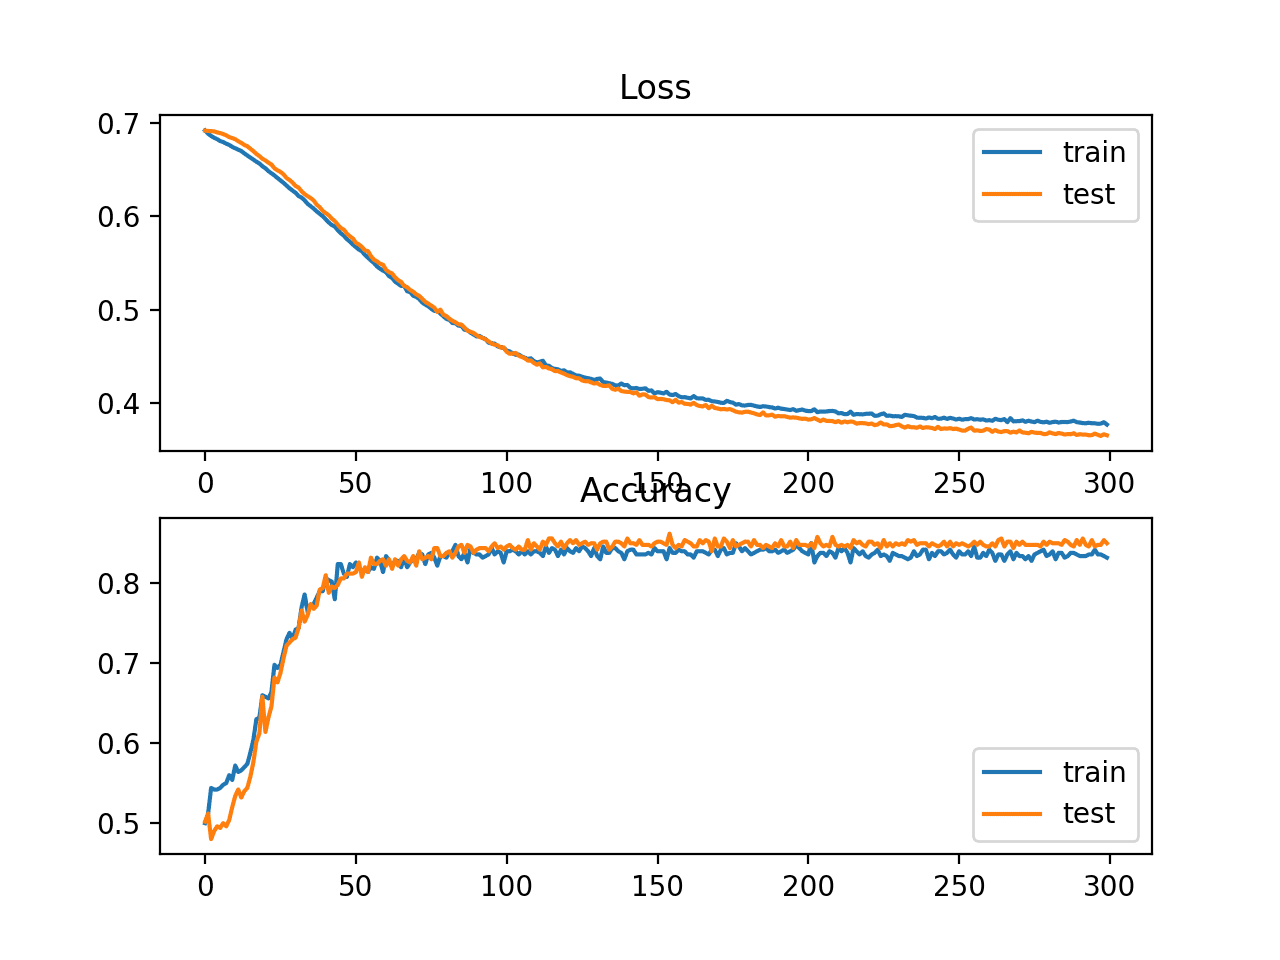
Line Plot Showing Learning Curves of Loss and Accuracy of the MLP on the Two Circles Problem During Training
How to Calculate Model Metrics
Perhaps you need to evaluate your deep learning neural network model using additional metrics that are not supported by the Keras metrics API.
The Keras metrics API is limited and you may want to calculate metrics such as precision, recall, F1, and more.
One approach to calculating new metrics is to implement them yourself in the Keras API and have Keras calculate them for you during model training and during model evaluation.
For help with this approach, see the tutorial:
This can be technically challenging.
A much simpler alternative is to use your final model to make a prediction for the test dataset, then calculate any metric you wish using the scikit-learn metrics API.
Three metrics, in addition to classification accuracy, that are commonly required for a neural network model on a binary classification problem are:
- Precision
- Recall
- F1 Score
In this section, we will calculate these three metrics, as well as classification accuracy using the scikit-learn metrics API, and we will also calculate three additional metrics that are less common but may be useful. They are:
- Cohen’s Kappa
- ROC AUC
- Confusion Matrix.
This is not a complete list of metrics for classification models supported by scikit-learn; nevertheless, calculating these metrics will show you how to calculate any metrics you may require using the scikit-learn API.
For a full list of supported metrics, see:
The example in this section will calculate metrics for an MLP model, but the same code for calculating metrics can be used for other models, such as RNNs and CNNs.
We can use the same code from the previous sections for preparing the dataset, as well as defining and fitting the model. To make the example simpler, we will put the code for these steps into simple function.
First, we can define a function called get_data() that will generate the dataset and split it into train and test sets.
|
1 2 3 4 5 6 7 8 9 |
# generate and prepare the dataset def get_data(): # generate dataset X, y = make_circles(n_samples=1000, noise=0.1, random_state=1) # split into train and test n_test = 500 trainX, testX = X[:n_test, :], X[n_test:, :] trainy, testy = y[:n_test], y[n_test:] return trainX, trainy, testX, testy |
Next, we will define a function called get_model() that will define the MLP model and fit it on the training dataset.
|
1 2 3 4 5 6 7 8 9 10 11 |
# define and fit the model def get_model(trainX, trainy): # define model model = Sequential() model.add(Dense(100, input_shape=(2,), activation='relu')) model.add(Dense(1, activation='sigmoid')) # compile model model.compile(loss='binary_crossentropy', optimizer='adam', metrics=['accuracy']) # fit model model.fit(trainX, trainy, epochs=300, verbose=0) return model |
We can then call the get_data() function to prepare the dataset and the get_model() function to fit and return the model.
|
1 2 3 4 |
# generate data trainX, trainy, testX, testy = get_data() # fit model model = get_model(trainX, trainy) |
Now that we have a model fit on the training dataset, we can evaluate it using metrics from the scikit-learn metrics API.
First, we must use the model to make predictions. Most of the metric functions require a comparison between the true class values (e.g. testy) and the predicted class values (yhat_classes). We can predict the class values directly with our model using the predict_classes() function on the model.
Some metrics, like the ROC AUC, require a prediction of class probabilities (yhat_probs). These can be retrieved by calling the predict() function on the model.
For more help with making predictions using a Keras model, see the post:
We can make the class and probability predictions with the model.
|
1 2 3 4 |
# predict probabilities for test set yhat_probs = model.predict(testX, verbose=0) # predict crisp classes for test set yhat_classes = model.predict_classes(testX, verbose=0) |
The predictions are returned in a two-dimensional array, with one row for each example in the test dataset and one column for the prediction.
The scikit-learn metrics API expects a 1D array of actual and predicted values for comparison, therefore, we must reduce the 2D prediction arrays to 1D arrays.
|
1 2 3 |
# reduce to 1d array yhat_probs = yhat_probs[:, 0] yhat_classes = yhat_classes[:, 0] |
We are now ready to calculate metrics for our deep learning neural network model. We can start by calculating the classification accuracy, precision, recall, and F1 scores.
|
1 2 3 4 5 6 7 8 9 10 11 12 |
# accuracy: (tp + tn) / (p + n) accuracy = accuracy_score(testy, yhat_classes) print('Accuracy: %f' % accuracy) # precision tp / (tp + fp) precision = precision_score(testy, yhat_classes) print('Precision: %f' % precision) # recall: tp / (tp + fn) recall = recall_score(testy, yhat_classes) print('Recall: %f' % recall) # f1: 2 tp / (2 tp + fp + fn) f1 = f1_score(testy, yhat_classes) print('F1 score: %f' % f1) |
Notice that calculating a metric is as simple as choosing the metric that interests us and calling the function passing in the true class values (testy) and the predicted class values (yhat_classes).
We can also calculate some additional metrics, such as the Cohen’s kappa, ROC AUC, and confusion matrix.
Notice that the ROC AUC requires the predicted class probabilities (yhat_probs) as an argument instead of the predicted classes (yhat_classes).
|
1 2 3 4 5 6 7 8 9 |
# kappa kappa = cohen_kappa_score(testy, yhat_classes) print('Cohens kappa: %f' % kappa) # ROC AUC auc = roc_auc_score(testy, yhat_probs) print('ROC AUC: %f' % auc) # confusion matrix matrix = confusion_matrix(testy, yhat_classes) print(matrix) |
Now that we know how to calculate metrics for a deep learning neural network using the scikit-learn API, we can tie all of these elements together into a complete example, listed below.
|
1 2 3 4 5 6 7 8 9 10 11 12 13 14 15 16 17 18 19 20 21 22 23 24 25 26 27 28 29 30 31 32 33 34 35 36 37 38 39 40 41 42 43 44 45 46 47 48 49 50 51 52 53 54 55 56 57 58 59 60 61 62 63 64 65 66 67 68 69 70 |
# demonstration of calculating metrics for a neural network model using sklearn from sklearn.datasets import make_circles from sklearn.metrics import accuracy_score from sklearn.metrics import precision_score from sklearn.metrics import recall_score from sklearn.metrics import f1_score from sklearn.metrics import cohen_kappa_score from sklearn.metrics import roc_auc_score from sklearn.metrics import confusion_matrix from keras.models import Sequential from keras.layers import Dense # generate and prepare the dataset def get_data(): # generate dataset X, y = make_circles(n_samples=1000, noise=0.1, random_state=1) # split into train and test n_test = 500 trainX, testX = X[:n_test, :], X[n_test:, :] trainy, testy = y[:n_test], y[n_test:] return trainX, trainy, testX, testy # define and fit the model def get_model(trainX, trainy): # define model model = Sequential() model.add(Dense(100, input_shape=(2,), activation='relu')) model.add(Dense(1, activation='sigmoid')) # compile model model.compile(loss='binary_crossentropy', optimizer='adam', metrics=['accuracy']) # fit model model.fit(trainX, trainy, epochs=300, verbose=0) return model # generate data trainX, trainy, testX, testy = get_data() # fit model model = get_model(trainX, trainy) # predict probabilities for test set yhat_probs = model.predict(testX, verbose=0) # predict crisp classes for test set yhat_classes = model.predict_classes(testX, verbose=0) # reduce to 1d array yhat_probs = yhat_probs[:, 0] yhat_classes = yhat_classes[:, 0] # accuracy: (tp + tn) / (p + n) accuracy = accuracy_score(testy, yhat_classes) print('Accuracy: %f' % accuracy) # precision tp / (tp + fp) precision = precision_score(testy, yhat_classes) print('Precision: %f' % precision) # recall: tp / (tp + fn) recall = recall_score(testy, yhat_classes) print('Recall: %f' % recall) # f1: 2 tp / (2 tp + fp + fn) f1 = f1_score(testy, yhat_classes) print('F1 score: %f' % f1) # kappa kappa = cohen_kappa_score(testy, yhat_classes) print('Cohens kappa: %f' % kappa) # ROC AUC auc = roc_auc_score(testy, yhat_probs) print('ROC AUC: %f' % auc) # confusion matrix matrix = confusion_matrix(testy, yhat_classes) print(matrix) |
Note: Your results may vary given the stochastic nature of the algorithm or evaluation procedure, or differences in numerical precision. Consider running the example a few times and compare the average outcome.
Running the example prepares the dataset, fits the model, then calculates and reports the metrics for the model evaluated on the test dataset.
|
1 2 3 4 5 6 7 8 |
Accuracy: 0.842000 Precision: 0.836576 Recall: 0.853175 F1 score: 0.844794 Cohens kappa: 0.683929 ROC AUC: 0.923739 [[206 42] [ 37 215]] |
If you need help interpreting a given metric, perhaps start with the “Classification Metrics Guide” in the scikit-learn API documentation: Classification Metrics Guide
Also, checkout the Wikipedia page for your metric; for example: Precision and recall, Wikipedia.
Further Reading
This section provides more resources on the topic if you are looking to go deeper.
Posts
- How to Use Metrics for Deep Learning With Keras in Python
- How to Generate Test Datasets in Python With scikit-learn
- How to Make Predictions With Keras
API
- sklearn.metrics: Metrics API
- Classification Metrics Guide
- Keras Metrics API
- sklearn.datasets.make_circles API
Articles
- Evaluation of binary classifiers, Wikipedia.
- Confusion Matrix, Wikipedia.
- Precision and recall, Wikipedia.
Summary
In this tutorial, you discovered how to calculate metrics to evaluate your deep learning neural network model with a step-by-step example.
Specifically, you learned:
- How to use the scikit-learn metrics API to evaluate a deep learning model.
- How to make both class and probability predictions with a final model required by the scikit-learn API.
- How to calculate precision, recall, F1-score, ROC, AUC, and more with the scikit-learn API for a model.
Do you have any questions?
Ask your questions in the comments below and I will do my best to answer.


Very useful scikit-learn library modules (API), to avoid construct and develop your owns functions. Thanks !!.
I would appreciate if you can add to this snippet (example) the appropriate code to plot (to visualize) the ROC Curves, confusion matrix, (to determine the best threshold probability to decide where to put the “marker” to decide when it is positive or negative or 0/1).
Also I understand, those metrics only apply for binary classification (F1, precision, recall, AOC curve)? But I know Cohen`s kappa and confusion matrix also apply for multiclass !. Thank you.
Great suggestion, thanks.
i used the code blow to get the model result for F1-score
nn = MLPClassifier(activation=’relu’,alpha=0.01,hidden_layer_sizes=(20,10))
print (“F1-Score by Neural Network, threshold =”,threshold ,”:” ,predict(nn,train, y_train, test, y_test))
now i want to get all the other matrices result accuracy and prediction with Plot but i dont know how i can used in the code above
What problem are you having exactly?
thank you so much about your support ..
from sklearn.neural_network import MLPClassifier
threshold = 200
train, y_train, test, y_test = prep(data,threshold)
nn = MLPClassifier(activation=’relu’,alpha=0.01,hidden_layer_sizes=(20,10))
print (“F1-Score by Neural Network, threshold =”,threshold ,”:” ,predict(nn,train, y_train, test, y_test))
i used the code above i got it from your website to get the F1-score of the model now am looking to get the accuracy ,Precision and Recall for the same model
Perhaps check this:
https://scikit-learn.org/stable/modules/model_evaluation.html
Hello, thank you very much for your website, it helps a lot !
I have a problem related to this post, may be you can halp me 🙂
I try to understand why I obtain different metrics using “model.evaluate” vs “model.predict” and then compute the metrics…
I work on sementic segmentation.
I have an evaluation set of 24 images.
I have a custom DICE INDEX metrics defined as :
”
def dice_coef(y_true, y_pred):
y_true_f = K.flatten(y_true)
y_pred_f = K.flatten(y_pred)
intersection = K.sum (y_true_f * y_pred_f)
result =(2 * intersection)+1 / (K.sum(y_true_f) + K.sum(y_pred_f))+1
return result
”
When I use model.evaluate, I obtain a dice score of 0.9093835949897766.
When I use model.predict and then compute the metrics, I obtain a dice score of 0.9092264051238695.
To give more precisions : I set a batchsize of 24 in model.predict as well as in model.evaluate to be sure the problem is not caused by batch size. I do not know what happen when the batch size is larger (ex: 32) than the number of sample in evaluation set…
Finaly, to compute the metrics after model.prediction, I run :
”
dice_result = 0
for y_i in range(len(y)):
dice_result += tf.Session().run(tf.cast(dice_coef(y[y_i], preds[y_i]),
tf.float32))
tf.Session().close
dice_result /= (len(y))
”
I thought about the tf.float32 casting to be the cause of the difference ?
(Maybe “model.evaluate” computes all with tensorflow tensor and return a float at the end whereas I cast tensor in float32 at every loop ? …)
Do you think about an explanation ?
Thank you for your help.
Cheers !
Thibault
I suspect the evaluate score is averaging across batches.
Perhaps take use predict then calculate the score on all predictions.
Thank you for your reply.
I just have 24 images in my evaluation set, so if “model.evaluate” compute across batches, with a batch size of 24, it will compute the metric in one time on the whole evaluation set. So it will normally gives the same results than “model.predict” followed by the metric computation on the evaluation set ?
That’s why I do not understand my differences here.
Have a good day.
Thibault
I recommend calling predict, then calling the sklearn metric of choice with the results.
Ok 🙂
If I finally decide not to use my dice personal score, but rather to trust Sklearn, is it possible to use this biblioteque with Keras during the training?
Indeed, at the end of the training I get a graph showing the loss and the dice during the epochs.
I would like these graphs to be consistent with the final results?
Thanks again for help!
Have a good day
Thibault
I would expect the graphs to be a fair summary of the training performance.
For presenting an algorithm, I recommend using a final model to make predictions, and plot the results anew.
Ok, I worked on this today.
I fixed this problem. Just in case someone alse has a similar problem.
The fact was that when I resized my ground truth masks before feeding the network with, I did not threshold after the resizing, so I got other values than 0 and 1 at the edges, and my custom dice score gives bad results.
Now I put the threshold just after the resizing and have same results for all the functions I use !
Also, be careful with types casting (float32 vs float64 vs int) !
Anyway, I thank you very much for your disponibility.
Have a good daye
Well done!
How to calculate Precision, Recall, F1, and AUC for multi-class classification Problem
You can use the same approach, the scores are averaged across the classes.
Your lessons are extremely informative, Professor. I am trying to use this approach to calculate the F1 score for a multi-class classification problem but I keep receiving the error message:
“ValueError: Classification metrics can’t handle a mix of multilabel-indicator and binary targets” I would very much appreciate if you please guide me to what I am doing wrong? Here is the relevant code:
# generate and prepare the dataset
def get_data():
n_test = 280
Xtrain, Xtest = X[:n_test, :], X[n_test:, :]
ytrain, ytest = y[:n_test], y[n_test:]
return X_train, y_train, X_test, y_test
# define and fit the model
def get_model(Xtrain, ytrain):
model = Sequential()
model.add(Embedding(max_words, embedding_dim, input_length=max_sequence_length))
model.add(SpatialDropout1D(0.2))
model.add(LSTM(150, dropout=0.2, recurrent_dropout=0.2))
model.add(Dense(5, activation=’softmax’))
model.compile(loss=’categorical_crossentropy’, optimizer= “adam”, metrics=[‘accuracy’])
model.fit(X_train, y_train, epochs=2, batch_size=15,callbacks=[EarlyStopping(monitor=’loss’)])
return model
# generate data
X_train, y_train, X_test, y_test = get_data()
# fit model
model = get_model(X_train, y_train)
# predict probabilities for test set
yhat_probs = model.predict(X_test, verbose=0)
# predict crisp classes for test set
yhat_classes = model.predict_classes(X_test, verbose=0)
# reduce to 1d array
yhat_probs = yhat_probs.flatten()
yhat_classes = yhat_classes.flatten()
# accuracy: (tp + tn) / (p + n)
accuracy = accuracy_score(y_test, yhat_classes)
print(‘Accuracy: %f’ % accuracy)
# precision tp / (tp + fp)
precision = precision_score(y_test, yhat_classes)
print(‘Precision: %f’ % precision)
# recall: tp / (tp + fn)
recall = recall_score(y_test, yhat_classes)
print(‘Recall: %f’ % recall)
# f1: 2 tp / (2 tp + fp + fn)
f1 = f1_score(y_test, yhat_classes)
print(‘F1 score: %f’ % f1)
# kappa
kappa = cohen_kappa_score(testy, yhat_classes)
print(‘Cohens kappa: %f’ % kappa)
# ROC AUC
auc = roc_auc_score(testy, yhat_probs)
print(‘ROC AUC: %f’ % auc)
# confusion matrix
matrix = confusion_matrix(y_test, yhat_classes)
print(matrix)
Perhaps check your data matches the expectation of the measures you intend to use?
I see my error in preprocessing. Thanks for the quick reply!
Happy to hear that.
hi @Eric Rac .
I am getting the same error. How you have corrected it for multiclass classification.
Hello i tried the same approach but i end up getting error message ‘Classification metrics can’t handle a mix of multilabel-indicator and multiclass targets ‘
Hello! Another great post of you! Thank you!
I want to calculate Precision, Recall, F1 for every class not only the average. Is it possible?
Thank you in advance
Yes, I believe the sklearn classification report will provide this information.
I also suspect you can configure the sklearn functions for each metric to report per-class scores.
Thank you so much for the quick answer! I will try to calculate them.
No problem. Let me know how you go.
I used
from sklearn.metrics import precision_recall_fscore_support
precision_recall_fscore_support(y_test, y_pred, average=None)
print(classification_report(y_test, y_pred, labels=[0, 1]))
It works fine for me.
Thanks again!
Nice work!
How is that accuracy calculated using “history.history[‘val_acc’]” provides different values as compared to accuracy calculated using “accuracy = accuracy_score(testy, yhat_classes)” ?
It should be the same, e.g. calculate score at the end of each epoch.
thank you
hi jason, i need a code of RNN through which i can find out the classification and confusion matrix of a specific dataset.
There are many examples you can use to get started, perhaps start here:
https://machinelearningmastery.com/start-here/#deep_learning_time_series
I calculated accuracy, precision,recall and f1 using following formulas.
accuracy = metrics.accuracy_score(true_classes, predicted_classes)
precision=metrics.precision_score(true_classes, predicted_classes)
recall=metrics.recall_score(true_classes, predicted_classes)
f1=metrics.f1_score(true_classes, predicted_classes)
The metrics stays at very low value of around 49% to 52 % even after increasing the number of nodes and performing all kinds of tweaking.
Eg:
precision recall f1-score support
nu 0.49 0.34 0.40 2814
u 0.50 0.65 0.56 2814
avg / total 0.49 0.49 0.48 5628
The confusion matrix shows very high values of FP and FN
confusion= [[ 953 1861]
[ 984 1830]]
What can I do to improve the performance?
For the low values of accuracy, precision, recall and F1, the accuracy and loss plot is also weird.
The accuracy of validation dataset remains higher than training dataset; similarly, the validation loss remains lower than that of training dataset; whereas the reverse is expected.
How to overcome this problem?
Better results on the test set than the training set may suggest that the test set is not representative of the problem, e.g. is too small.
thanks
No problem.
I offer some suggestions here:
https://machinelearningmastery.com/start-here/#better
Hey very nice explanation, but i want to calculate f1 score and auc at every epoch how will i get that.
Depends on what library you use – if Keras, you just add them as “metrics” in your compile() function. See https://keras.io/api/metrics/ for a long list.
ValueError: Error when checking input: expected dense_74_input to have shape (2,) but got array with shape (10,)
i got this error and i dont know what to do next
Sorry to hear that, I have some suggestions here that might help:
https://machinelearningmastery.com/faq/single-faq/why-does-the-code-in-the-tutorial-not-work-for-me
I’m doing a binary text classification, my X_val shape is (85, 1, 62, 300) and my Y_val shape is (85, 2). I get an error when executing this line:
yhat_classes = saved_model.predict_classes(X_val, verbose=0)
AttributeError: ‘Model’ object has no attribute ‘predict_classes’
My snippet code bellow:
cv_scores, models_history = list(), list()
start_time = time.time()
for train, test in myCViterator:
# Spliting our data
X_train, X_val, y_train, y_val = df_claim.loc[train].word.tolist(), df_claim.loc[test].word.tolist(), df_label.loc[train].fact.tolist(), df_label.loc[test].fact.tolist()
X_train = np.array(X_train)
X_val = np.array(X_val)
y_train = np.array(y_train)
y_val = np.array(y_val)
# Evaluating our model
model_history, val_acc, saved_model = evaluate_model(X_train, X_val, y_train, y_val)
# plot loss during training
pyplot.subplot(211)
pyplot.title(‘Loss’)
pyplot.plot(model_history.history[‘loss’], label=’train’)
pyplot.plot(model_history.history[‘val_loss’], label=’test’)
pyplot.legend()
pyplot.show()
# plot accuracy during training
pyplot.subplot(212)
pyplot.title(‘Accuracy’)
pyplot.plot(model_history.history[‘acc’], label=’train’)
pyplot.plot(model_history.history[‘val_acc’], label=’test’)
pyplot.legend()
pyplot.show()
print(“\n Metrics for this model:”)
print(‘> Accuracy: %.3f’ % val_acc)
cv_scores.append(val_acc)
models_history.append(model_history)
print(y_val.shape)
# Scikit-learn metrics:
# predict probabilities for test set
yhat_probs = saved_model.predict(X_val, verbose=0)
# predict crisp classes for test set
#yhat_classes = np.argmax(yhat_probs, axis=1)
yhat_classes = saved_model.predict_classes(X_val, verbose=0)
# reduce to 1d array
yhat_probs = yhat_probs[:, 0]
#yhat_classes = yhat_classes[:, 0]
# accuracy: (tp + tn) / (p + n)
accuracy = accuracy_score(y_val, yhat_classes)
print(‘> Accuracy: %f’ % accuracy)
# precision tp / (tp + fp)
precision = precision_score(y_val, yhat_classes)
print(‘> Precision: %f’ % precision)
# recall: tp / (tp + fn)
recall = recall_score(y_val, yhat_classes)
print(‘> Recall: %f’ % recall)
# f1: 2 tp / (2 tp + fp + fn)
f1 = f1_score(y_val, yhat_classes)
print(‘> F1 score: %f’ % f1)
# kappa
kappa = cohen_kappa_score(y_val, yhat_classes)
print(‘> Cohens kappa: %f’ % kappa)
# ROC AUC
auc = roc_auc_score(y_val, yhat_probs)
print(‘> ROC AUC: %f’ % auc)
# confusion matrix
matrix = confusion_matrix(y_val, yhat_classes)
print(matrix)
print(“\n\n”)
print(“— %s seconds —” % (time.time() – start_time))
print(‘Estimated Accuracy for 5-Folds Cross-Validation: %.3f (%.3f)’ % (np.mean(cv_scores), np.std(cv_scores)))
If your model is wrapped by scikit-learn, then predict_classes() is not available, it is function on the Keras model. Instead, you can use predict().
I’ve tried to use the predict() method and then get the argmax of the vector (with yhat_classes = np.argmax(yhat_probs, axis=1) ) but then it gives me another error when trying to get the accuracy:
accuracy = accuracy_score(y_val, yhat_classes)
ValueError: Classification metrics can’t handle a mix of multilabel-indicator and binary targets
I found the solution, obviously I need to reduce ‘y_val’ to 1d array as well lol.
Thank you so much for your help and for this great post!
I’m happy to hear that!
Hello, can you explain me how you fixed the problem?
maybe I have the same problem but I am not able to fix it.
Really thanks!
Hello! I trained and got the different accuracy form the model.fit() and model.evaluate() methods. What is the problem? How can I get the right accuracy between this?
During fit, scores are estimated averaged over batches of samples.
Use evaluate() to get a true evaluation of the model’s performance.
Thanks Jason
Hi Jason
I got the validation accuracy and test accuracy which are better than the train accuracy without dropout. What can be the problems?
Perhaps the test or validation dataset are too small and the results are statistically noisy?
I also set 40%(0.4) to the test size
I also set the test size 0.4
Thanks a lot for this useful tutorial.
I was wondering How to Calculate Precision, Recall, F1 in Multi-label CNN.
I mean having these Metrics for each label in the output.
Many thanks for your help.
I believe the above tutorial shows you how to calculate these metrics.
Once calculated, you can print the result with your own labels.
Hi Jason,
Whenever I have doubts related to ML your articles are always there to clarify those. Thank you very much.
My question is : Can I plot a graph of the Kappa error metric of classifiers?
Thanks.
Yes, you may need to implement it yourself for Keras to access, see here for an example with RMSE that you can adapt:
https://machinelearningmastery.com/custom-metrics-deep-learning-keras-python/
I wonder how to upload a figure in my response, However, my Line Plot Showing Learning Curves of Loss and Accuracy is very different the training and testing lines do not appear above each other like your plot, they have totally different directions opposite each other.
what could be the problem given that I tested your code on two different datasets, one is balanced (with 70% f1-score ) and the other is not (with 33% f1-score)?
You can upload an image to social media, github or an image hosting service like imgur.
Not sure I follow your question, sorry. Perhaps you can elaborate?
Thank you for your nice post. I have one question. if we use the one-hot encoder to process labels by using np_utils.to_categorical of Keras in the preprocessing, how to use model.predict()?
Sorry I don’t understand, they are not related. What is the problem exactly?
Sorry I did not describe my question clearly.
In the example of the post, if the label was one hot encoded, and the argmax value was taken to predict when using model.predict().
the code is as below, in this code, the yhat_classes can not be taken argmax, so I think the model.predict_classes() can not used in the one-hot encoder labels.
And the results here is not better than the results in your post.
My question is that whether to use on-hot encoder when using model.predict()?
from sklearn.datasets import make_circles
from sklearn.metrics import accuracy_score
from sklearn.metrics import precision_score
from sklearn.metrics import recall_score
from sklearn.metrics import f1_score
from sklearn.metrics import cohen_kappa_score
from sklearn.metrics import roc_auc_score
from sklearn.metrics import confusion_matrix
from keras.models import Sequential
from keras.layers import Dense
import keras
import numpy as np
# generate and prepare the dataset
def get_data():
# generate dataset
X, y = make_circles(n_samples=1000, noise=0.1, random_state=1)
# split into train and test
n_test = 500
trainX, testX = X[:n_test, :], X[n_test:, :]
trainy, testy = y[:n_test], y[n_test:]
return trainX, trainy, testX, testy
# define and fit the model
def get_model(trainX, trainy):
# define model
model = Sequential()
model.add(Dense(100, input_dim=2, activation=’relu’))
model.add(Dense(num_classes, activation=’sigmoid’))
# compile model
model.compile(loss=’binary_crossentropy’, optimizer=’adam’, metrics=[‘accuracy’])
# fit model
model.fit(trainX, trainy, epochs=300, verbose=0)
return model
# generate data
trainX, trainy, testX, testy = get_data()
# One hot encode labels
num_classes = 2
trainy = keras.utils.to_categorical(trainy, num_classes)
testy = keras.utils.to_categorical(testy, num_classes)
# fit model
model = get_model(trainX, trainy)
# predict probabilities for test set
yhat_probs = model.predict(testX, verbose=0)
# predict crisp classes for test set
yhat_classes = model.predict_classes(testX, verbose=0).reshape(-1,1)
yhat_probs_inverse = np.argmax(yhat_probs,axis=1).reshape(-1,1)
testy_inverse = np.argmax(testy, axis=1).reshape(-1,1)
# reduce to 1d array
yhat_probs = yhat_probs_inverse[:, 0]
yhat_classes = yhat_classes[:, 0]
# accuracy: (tp + tn) / (p + n)
accuracy = accuracy_score(testy_inverse, yhat_classes)
print(‘Accuracy: %f’ % accuracy)
# precision tp / (tp + fp)
precision = precision_score(testy_inverse, yhat_classes)
print(‘Precision: %f’ % precision)
# recall: tp / (tp + fn)
recall = recall_score(testy_inverse, yhat_classes)
print(‘Recall: %f’ % recall)
# f1: 2 tp / (2 tp + fp + fn)
f1 = f1_score(testy_inverse, yhat_classes)
print(‘F1 score: %f’ % f1)
# kappa
kappa = cohen_kappa_score(testy_inverse, yhat_classes)
print(‘Cohens kappa: %f’ % kappa)
# ROC AUC
auc = roc_auc_score(testy_inverse, yhat_probs_inverse)
print(‘ROC AUC: %f’ % auc)
# confusion matrix
matrix = confusion_matrix(testy_inverse, yhat_classes)
print(matrix)
—————————————————————————–
>>Accuracy: 0.852000
Precision: 0.858871
Recall: 0.845238
F1 score: 0.852000
Cohens kappa: 0.704019
ROC AUC: 0.852055
[[213 35]
[39 213]]
If you one hot encode your target, a call to predict() will output the probability of class membership, a call to predict_classes() will return the classes directly.
To learn more about the difference between predict() and predict_classes() see this:
https://machinelearningmastery.com/how-to-make-classification-and-regression-predictions-for-deep-learning-models-in-keras/
Thank you very much. useful reply for me.
You’re welcome.
I used Cohen Kappa to find the inner annotator agreement between two annotator
rater1 = [0,1,1]
rater2 = [1,1,1]
labels=[0,1]
print(“cohen_kappa_score”,cohen_kappa_score(rater1, rater2, labels=labels))
why Iam getting 0 result?
I don’t know off hand, perhaps the prediction has no skill?
mmm, I am not working on classification problem, I am working on measuring how the raters agree with each other this is called inner annotator agreement as mentioned here https://en.wikipedia.org/wiki/Cohen%27s_kappa cohen kappa is one of the ways to do that, I am expecting to have a very high value because the annotators opinion is almost similar but I am surprised to have a negative values
I’m not familiar wit that task.
I was working with SVHN data base and after using the above code i was getting precison\Recall\F1 of same value.
which does not looks correct.
Perhaps try debugging your code to discover the cause of the fault.
Thank. you, this is very helpful and clear. My only difficulty, which I haven’t found a solution for yet, is how to apply this to a multi-label classification problem?
My Keras Model (not Sequential) outputs from a Dense layer with a sigmoid activation for 8 possible classes. Samples can be of several classes. If I do a model.predict( ) I get the probabilities for each class:
pred[0]
array([0.9876269 , 0.08615541, 0.81185186, 0.6329404 , 0.6115263 ,
0.11617774, 0.7847705 , 0.9649658 ], dtype=float32)
My y looks something like this though, a binary classification for each of the 8 classes:
[1 0 1 1 1 0 1 1]
predict_classes is only for Sequential, so what can I do in this case in order to get a classification report with precision, recall and f-1 for each class?
Há, nevermind! Sometimes the simplest solutions are right there in front of us and we fail to see them…
predicted[predicted>=0.5] = 1
predicted[predicted<0.5] = 0
Problem solved! 😀
Nice.
Yes, for multi-label classification, you get a binary prediction for each label.
If you want a multi-class classification (mutually exclusive clases), use a softmax activation function instead and an arg max to get the single class.
# define model
model = Sequential()
model.add(embedding_layer)
model.add(Conv1D(filters=128, kernel_size=5, activation=’relu’))
model.add(MaxPooling1D(pool_size=2))
model.add(Flatten())
model.add(Dense(1, activation=’sigmoid’))
print(model.summary())
# compile network
model.compile(loss=’binary_crossentropy’, optimizer=’adam’, metrics=[‘accuracy’])
# fit network
model.fit(Xtrain, ytrain, epochs=15, verbose=2)
# evaluate
loss, acc = model.evaluate(Xtest, ytest, verbose=0)
# predict probabilities for test set
yhat_probs = model.predict(Xtest, verbose=0)
# predict crisp classes for test set
yhat_classes = model.predict_classes(Xtest, verbose=0)
# reduce to 1d array
yhat_probs = yhat_probs[:, 0]
yhat_classes = yhat_classes[:, 0]
# accuracy: (tp + tn) / (p + n)
accuracy = accuracy_score(ytest, yhat_classes)
print(‘Accuracy: %f’ % accuracy)
# precision tp / (tp + fp)
precision = precision_score(ytest, yhat_classes)
print(‘Precision: %f’ % precision)
# recall: tp / (tp + fn)
recall = recall_score(ytest, yhat_classes)
print(‘Recall: %f’ % recall)
# f1: 2 tp / (2 tp + fp + fn)
f1 = f1_score(ytest, yhat_classes)
print(‘F1 score: %f’ % f1)
# confusion matrix
matrix = confusion_matrix(ytest, yhat_classes)
print(matrix)
but my output show:
Accuracy: 0.745556
Precision: 0.830660
Recall: 0.776667
TypeError: ‘numpy.float64’ object is not callable
how to solve this problem??
Sorry to hear that, this will help:
https://machinelearningmastery.com/faq/single-faq/why-does-the-code-in-the-tutorial-not-work-for-me
How to replace make_circles by my data (file.csv) … how to change the code
This will show you how to load a CSV:
https://machinelearningmastery.com/load-machine-learning-data-python/
Thank you so much Jason i do enjoy codes a lot, please i will like to know if these metrics Precision, F1 score and Recall can also be applied to Sequence to Sequence prediction with RNN
Perhaps, but not really. If the output is text, look at metrics like BLEU or ROGUE.
Ok thanks for your reply, what will your advice for the choice of metrics in RNN sequence to sequence, where the output is number.
If you are predicting one value per sample, then MAE or RMSE are great metrics to start with.
Hello. I’m doing an SVM algorithm together with a library to learn binary classification. How could I make a f1_score chart with this algorithm?
Thanks.
What is an f1 score chart? What would you plot exactly?
My base is composed of tweeters and has two classes, crime and non-crime. Intend to generate the f1_score because the base is unbalanced, then, or more advisable to measure the effectiveness of the serious model in the f1_score metric.
Thanks.
Good question, this will help you choose a metric for your project:
https://machinelearningmastery.com/tour-of-evaluation-metrics-for-imbalanced-classification/
In reality, I know which metric to use, I already know that it is a f1_score, however, I was unable to do it with SVM.
Why not?
f1_score em rede neural eu pego cada época e mostro no gráfico, já no SVM não sei como fazer.
Sorry, I don’t have examples of working with graph data.
f1_score in neural network I take each season and show it in the graph, already in SVM I don’t know how to do it.
obs:sorry for the message replication, it was an error.
If someone has created a report or plot you like, perhaps ask them how they made it?
Muito obrigado.
You’re very welcome!
hi sir,
How can we achieve 100% recall in deep learning ,
please suggest any tips to improve the recall part in deep learning.
more over i am trying on text classification , all datasets having imbalanced ,
we have applied smote method to overcome imbalanced one ,not getting error smote method .
is that good way to apply smote method for imbalanced text classification is their any other methods are available to improve recall of imbalanced text classification .
Here are suggestions for improving model performance:
https://machinelearningmastery.com/start-here/#better
Hi Mr. Jason,
Function predict_classes is not available for Keras functional API. Any suggestions please. How to calculate matrices for functional API case?
Yes, use predict() then argmax on the result:
https://machinelearningmastery.com/argmax-in-machine-learning/
Some metrics, like the ROC AUC, require a prediction of class probabilities (yhat_probs). These can be retrieved by calling the predict() function on the model.
I really dont get why yhat_classes isn’t used for ROC AUC as well. It would be great if you could explain this. Also when you say “prediction of class probabilities” shouldn’t we use “predict_proba” rather than just “predict”?.
Many thanks
In keras the predict() function returns probabilities on classification tasks:
Thanks much! Great tutorial
Thanks.
Hi Mr. Jason,
thanks for your great support. I am working on four class classification of images with equal number of images in each class (for testing, total 480 images, 120 in each class). I am calculating metrics viz. accuracy, Precision, Recall and F1-score from test dataset. I used three options to calculate these metrics, first scikit learn API as explained by you, second option is printing classification summary and third using confusion matrix. In all three ways, I am getting same value (0.92) for all fours metrics. Is it possible to get same value for all four metrics or I am doing something wrong. From your experience, kindly clarify and suggest way ahead.
Thanks ans Regards
Perhaps. Check that you don’t have a bug in your test harness.
Also, I recommend selecting one metric and optimize that.
Thanks for your quick Reply. I am attaching my test code in hope that your experience will definitely show some solution:
#Four class classification problem:
class_labels = list(test_it.class_indices.keys())
y_true = test_it.classes
test_it.reset() #
Y_pred = model.predict(test_it, STEP_SIZE_TEST,verbose=1)
y_pred1 = np.argmax(Y_pred, axis=1, out=None)
target_names = [‘Apple’, ‘Orange, ‘Mango’,’Guava’]
cm = confusion_matrix(y_true, y_pred1)
print(‘Confusion Matrix’)
print(cm)
print(‘Classification Report’)
print(classification_report(test_it.classes, y_pred1, target_names=class_labels))
ax= plt.subplot()
sns.heatmap(cm, annot=True, ax = ax, cmap=’Blues’, fmt=’d’ );
ax.set_xlabel(‘Predicted labels’);ax.set_ylabel(‘True labels’);
ax.set_title(‘Confusion Matrix’);
ax.xaxis.set_ticklabels([‘Apple’, ‘Orange, ‘Mango’,’Guava’]);
ax.yaxis.set_ticklabels([‘Apple’, ‘Orange, ‘Mango’,’Guava’]);
accuracy = accuracy_score(y_true, y_pred1)
print(‘Accuracy: %f’ % accuracy)
precision = precision_score(y_true, y_pred1, average=’micro’)
print(‘Precision: %f’ % precision)
recall = recall_score(y_true, y_pred1, average=’micro’)
print(‘Recall: %f’ % recall)
f1 = f1_score(y_true, y_pred1,average=’micro’)
print(‘F1 score: %f’ % f1)
With thanks and Regards
I don’t have the capacity to review/debug your code, sorry. Perhaps this will help:
https://machinelearningmastery.com/faq/single-faq/can-you-read-review-or-debug-my-code
Thanks for quick reply.
My question is : is it possible to have all metrics same? For example in scikit learn classification report (example for Recognizing hand-written digits) all are shown same to 0.97. I am putting link for reference:-
https://scikit-learn.org/stable/auto_examples/classification/plot_digits_classification.html#sphx-glr-auto-examples-classification-plot-digits-classification-py
Comments are requested.
Sorry, I don’t understand your question. Perhaps you can rephrase it?
I multiclass classification, can three evaluation metrices (accuracy, precision, recall) converge to the same value?
In this reference, there is a classification report shown, which has same values for all the three metrices:-
https://scikit-learn.org/stable/auto_examples/classification/plot_digits_classification.html#sphx-glr-auto-examples-classification-plot-digits-classification-py
Perhaps.
you are the best
Thanks!
What about for multiclass classification??
Thanks
You can use the metrics for binary or multi-class classification directly.
• There are 1400 fish and 300 shrimps in a pool. In order to catch fish,
we cast a net. 700 fish and 200 shrimps are caught. Please calculate
the precision, recall and F1 score.
can someone find me answer
Perhaps this will help:
https://machinelearningmastery.com/precision-recall-and-f-measure-for-imbalanced-classification/
how i can print precision, recall for if training using one dataset and testing using another dataset
Fit your model on the first dataset, make predictions for the second and calculate your metrics with the predictions.
sir that already done. can you please give reference code for this.
Perhaps start here:
https://machinelearningmastery.com/train-test-split-for-evaluating-machine-learning-algorithms/
Hi Jason,
Thank you very much for your tutorials which help me a lot. I am wondering if it is possible to use Tensorflow/Keras built-in APIs (e.g. tf.keras.metrics.Precision) to get the metrics (precision/recall) for a sequence to sequence model, whose output label of each time-step is one-hot encoded as a multi-classes case? If the answer is Yes, do you have any reference or example I can refer to. If No, do you have any suggestion that I can try to get them. Thanks.
Yes, but no example yet. Thanks for your suggestion and we will consider that.
Got it. Thanks.
Hello,
I got a new PC with tensorflow 2.7.0 and when I tried my old binary classification code (which was created by following this tutorial) I got the following error:
AttributeError: ‘Sequential’ object has no attribute ‘predict_classes’
Any clue to solve this?
Thanks
Yes, whenever you see:
replace it with
This is because predict_classes() is removed in recent version of Keras API.
y = np.argmax(v) does not return the classes.
Hi Emml…What was the result you encountered from execution of the code?
So here is what I get from the article. A train/test split is performed. Then, the test set is used as both validation data during training and as test data, reporting the F1 score on what was called the test set in the original split. Is this proper to have the test set double as a validation set? Effectively I could say that you are reporting F1 score on the validation set (which happens to be the same as the test set).
Personally I would say it is acceptable. The reason you want to do a validation or test is to get a metric to tell how good is your model. Hence you do not want your training set used for scoring as well because otherwise you can’t tell it is overfitting. But even so, the test during training is sampled on the test set, while the validation after training is using the full test set. Hence you’re not looking at the same thing.
I truly appreciate you Jason, you just made it possible for me to finish my programme, you affecting a lot of us positively. Thanks a bunch
Awesome feedback Lawrence!
Hello there,
I’m really wondering how to use f1_score from sklearn library for metrics in keras compiler to use it as ModelCheckpoint’s monitor argument to save the model with the best f1_score and use it after for prediction?
I really need to find it out how ? or if you can tell me how to do something like this by making costume metrics?
Best regards!
AttributeError: ‘Sequential’ object has no attribute ‘predict_classes’
Hi Asif…Please elaborate the error. Did you copy and paste the code or type it in?
Hello.
If we want to apply a classification model to imbalanced data we should
– Use a cost matrix or apply weights for the clases.
– Avoid using the Accuracy to optimize the model, and use the F1 instead, or even better the AUC ROC or the AUC PR.
My question is… should we use only one of these recommendations or both simultaneously?
I mean, if we are using the AUC_PR… do we still need to apply weights to the input?
and vice versa
if we are using weights… Is it still recommended to use the AUC_PR instead of simply the Accuracy?
n_test = 500
trainX, testX = X[:n_test, :], X[n_test:, :]
trainy, testy = y[:n_test], y[n_test:]
return trainX, trainy, testX, testy
Cell In[62], line 4
return trainX, trainy, testX, testy
^
SyntaxError: ‘return’ outside function
How can I solve this??
Thanks
Well done this tutorial
Hi Andrea…The
SyntaxError: 'return' outside functionerror occurs because thereturnstatement is used outside of a function. In Python,returncan only be used within a function to send back a result to the caller.To fix this, you need to wrap your code in a function definition. Here’s an example of how to define a function that splits the data into training and test sets and then returns them:
pythondef split_data(X, y, n_test=500):
trainX, testX = X[:n_test, :], X[n_test:, :]
trainy, testy = y[:n_test], y[n_test:]
return trainX, trainy, testX, testy
# Example usage
trainX, trainy, testX, testy = split_data(X, y)
This way, the
returnstatement is within thesplit_datafunction, and you can call this function to get your desired split of the data.Hi
I want to create a bar plot for each algorithm such as random forest, logistic regression and 2 other with parameters as accuracy, precision, recall, f1 score. I already have the values calculate for parameters but need a code to create a bar chart for 4 algorithm.
Here’s a simple Python code using **Matplotlib** to create a grouped bar plot that compares **Accuracy**, **Precision**, **Recall**, and **F1 Score** across **4 different algorithms** like Random Forest, Logistic Regression, etc.
You just need to **fill in your values** where indicated:
pythonimport matplotlib.pyplot as plt
import numpy as np
# Algorithm names
algorithms = ['Random Forest', 'Logistic Regression', 'SVM', 'KNN'] # Customize names
# Metrics for each algorithm (replace with your actual calculated values)
accuracy = [0.91, 0.88, 0.89, 0.86]
precision = [0.90, 0.85, 0.87, 0.84]
recall = [0.92, 0.86, 0.88, 0.85]
f1_score = [0.91, 0.85, 0.87, 0.84]
# Grouped bar chart positions
x = np.arange(len(algorithms))
width = 0.2
# Plotting
plt.figure(figsize=(10, 6))
plt.bar(x - 1.5*width, accuracy, width, label='Accuracy')
plt.bar(x - 0.5*width, precision, width, label='Precision')
plt.bar(x + 0.5*width, recall, width, label='Recall')
plt.bar(x + 1.5*width, f1_score, width, label='F1 Score')
# Labels and Title
plt.xlabel('Algorithms')
plt.ylabel('Scores')
plt.title('Performance Comparison of ML Algorithms')
plt.xticks(x, algorithms)
plt.ylim(0, 1.1)
plt.legend()
plt.grid(axis='y', linestyle='--', alpha=0.7)
plt.tight_layout()
plt.show()
—
### ✅ Notes:
– You can **swap in other models** like XGBoost, Naive Bayes, etc.
– Ensure all metric lists (accuracy, precision, etc.) are the same length as the number of algorithms.