When you build a model for a classification problem you almost always want to look at the accuracy of that model as the number of correct predictions from all predictions made.
This is the classification accuracy.
In a previous post, we have looked at evaluating the robustness of a model for making predictions on unseen data using cross-validation and multiple cross-validation where we used classification accuracy and average classification accuracy.
Once you have a model that you believe can make robust predictions you need to decide whether it is a good enough model to solve your problem. Classification accuracy alone is typically not enough information to make this decision.
Classification Accuracy Photo by Nina Matthews Photography, some rights reserved
In this post, we will look at Precision and Recall performance measures you can use to evaluate your model for a binary classification problem.
Recurrence of Breast Cancer
The breast cancer dataset is a standard machine learning dataset. It contains 9 attributes describing 286 women that have suffered and survived breast cancer and whether or not breast cancer recurred within 5 years.
It is a binary classification problem. Of the 286 women, 201 did not suffer a recurrence of breast cancer, leaving the remaining 85 that did.
I think that False Negatives are probably worse than False Positives for this problem. Do you agree? More detailed screening can clear the False Positives, but False Negatives are sent home and lost to follow-up evaluation.
Classification Accuracy
Classification accuracy is our starting point. It is the number of correct predictions made divided by the total number of predictions made, multiplied by 100 to turn it into a percentage.
All No Recurrence
A model that only predicted no recurrence of breast cancer would achieve an accuracy of (201/286)*100 or 70.28%. We’ll call this our “All No Recurrence”. This is a high accuracy, but a terrible model. If it was used alone for decision support to inform doctors (impossible, but play along), it would send home 85 women with incorrectly thinking their breast cancer was not going to reoccur (high False Negatives).
All Recurrence
A model that only predicted the recurrence of breast cancer would achieve an accuracy of (85/286)*100 or 29.72%. We’ll call this our “All Recurrence”. This model has terrible accuracy and would send home 201 women thinking that had a recurrence of breast cancer but really didn’t (high False Positives).
CART
CART or Classification And Regression Trees is a powerful yet simple decision tree algorithm. On this problem, CART can achieve an accuracy of 69.23%. This is lower than our “All No Recurrence” model, but is this model more valuable?
We can see that classification accuracy alone is not sufficient to select a model for this problem.
Confusion Matrix
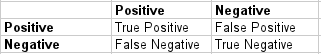
A clean and unambiguous way to present the prediction results of a classifier is to use a confusion matrix (also called a contingency table).
For a binary classification problem the table has 2 rows and 2 columns. Across the top is the observed class labels and down the side are the predicted class labels. Each cell contains the number of predictions made by the classifier that fall into that cell.
Truth Table Confusion Matrix
In this case, a perfect classifier would correctly predict 201 no recurrence and 85 recurrence which would be entered into the top left cell no recurrence/no recurrence (True Negatives) and bottom right cell recurrence/recurrence (True Positives).
Incorrect predictions are clearly broken down into the two other cells. False Negatives which are recurrence that the classifier has marked as no recurrence. We do not have any of those. False Positives are no recurrence that the classifier has marked as recurrence.
This is a useful table that presents both the class distribution in the data and the classifiers predicted class distribution with a breakdown of error types.
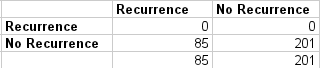
All No Recurrence Confusion Matrix
The confusion matrix highlights the large number (85) of False Negatives.
All No Recurrence Confusion Matrix
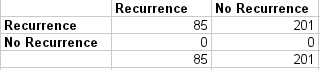
All Recurrence Confusion Matrix
The confusion matrix highlights the large number (201) of False Positives.
All Recurrence Confusion Matrix
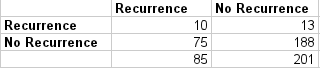
CART Confusion Matrix
This looks like a more valuable classifier because it correctly predicted 10 recurrence events as well as 188 no recurrence events. The model also shows a modest number of False Negatives (75) and False Positives (13).
CART Confusion Matrix
Accuracy Paradox
As we can see in this example, accuracy can be misleading. Sometimes it may be desirable to select a model with a lower accuracy because it has a greater predictive power on the problem.
For example, in a problem where there is a large class imbalance, a model can predict the value of the majority class for all predictions and achieve a high classification accuracy, the problem is that this model is not useful in the problem domain. As we saw in our breast cancer example.
This is called the Accuracy Paradox. For problems like, this additional measures are required to evaluate a classifier.
Precision
Precision is the number of True Positives divided by the number of True Positives and False Positives. Put another way, it is the number of positive predictions divided by the total number of positive class values predicted. It is also called the Positive Predictive Value (PPV).
Precision can be thought of as a measure of a classifiers exactness. A low precision can also indicate a large number of False Positives.
The precision of the All No Recurrence model is 0/(0+0) or not a number, or 0.
The precision of the All Recurrence model is 85/(85+201) or 0.30.
The precision of the CART model is 10/(10+13) or 0.43.
The precision suggests CART is a better model and that the All Recurrence is more useful than the All No Recurrence model even though it has a lower accuracy. The difference in precision between the All Recurrence model and the CART can be explained by the large number of False Positives predicted by the All Recurrence model.
Recall
Recall is the number of True Positives divided by the number of True Positives and the number of False Negatives. Put another way it is the number of positive predictions divided by the number of positive class values in the test data. It is also called Sensitivity or the True Positive Rate.
Recall can be thought of as a measure of a classifiers completeness. A low recall indicates many False Negatives.
The recall of the All No Recurrence model is 0/(0+85) or 0.
The recall of the All Recurrence model is 85/(85+0) or 1.
The recall of CART is 10/(10+75) or 0.12.
As you would expect, the All Recurrence model has a perfect recall because it predicts “recurrence” for all instances. The recall for CART is lower than that of the All Recurrence model. This can be explained by the large number (75) of False Negatives predicted by the CART model.
F1 Score
The F1 Score is the 2*((precision*recall)/(precision+recall)). It is also called the F Score or the F Measure. Put another way, the F1 score conveys the balance between the precision and the recall.
The F1 for the All No Recurrence model is 2*((0*0)/0+0) or 0.
The F1 for the All Recurrence model is 2*((0.3*1)/0.3+1) or 0.46.
The F1 for the CART model is 2*((0.43*0.12)/0.43+0.12) or 0.19.
If we were looking to select a model based on a balance between precision and recall, the F1 measure suggests that All Recurrence model is the one to beat and that CART model is not yet sufficiently competitive.
Summary
In this post, you learned about the Accuracy Paradox and problems with a class imbalance when Classification Accuracy alone cannot be trusted to select a well-performing model.
Through example, you learned about the Confusion Matrix as a way of describing the breakdown of errors in predictions for an unseen dataset. You learned about measures that summarize the precision (exactness) and recall (completeness) of a model and a description of the balance between the two in the F1 Score.
There is a spelling mistake in the first paragraph of “Confusion Matrix” section where you wrote “A clean and unambiguous way to present the prediction results of a classifier is to use a use a confusion matrix (also called a contingency table).”.
If we were looking to select a model based on a balance between precision and recall, the F1 measure suggests that All Recurrence model is the one to beat and that CART model is not yet sufficiently competitive.
here do we then select the all recurrence model because it is giving a better balance of precision and recall? or do we try to get a model which performs at least better than cart?
The F1 metric is not a suitable method of combining precision and recall if there is a class imbalance, as there is here. More appropriate would be to use the Matthew’s Correlation Coefficient (https://en.wikipedia.org/wiki/Matthews_correlation_coefficient). By my calculations the results are:
All No Recurrence = 0
All Recurrence = 0
CART = 0.089
Meaning the “All No Recurrence” and “All Recurrence” models are no better than randomly guessing, and CART is only marginally better. Unfortunately no useful models were presented in this article, but using MCC it’s possible to catch this. Here’s how to interpret MCC:
Sir – In the above we wish to give more weight to False Negatives than False Positives. However F1 Score has given same weight to both (Simple Harmonic Mean). How can we adjust the Weights?
Or Should we go for Mathew’s Correlation coefficient as you mentioned above
We know 0 is the worst value and 1 is the best value for F1 Score while choosing among the models. Is there any standard value of F1 Score (like p-value) above which we accept the model and below which we reject the model?
If we look at the examples of F1 score calculations we can see that there are missing parentheses at the denominator. Just reporting, you might want to update this according to the correct formula you previously stated! 🙂
Balanced accuracy can be used as a better metrics than accuracy for a multi class imbalanced dataset classification task. have you tried to review that to affirm if that is correct or not. If yes, can you drop your implementation on your blog
It would be useful to see how the F-beta (specifically the F2) measure would perform in your scenario, particularly as we are seeking to minimise false negatives … and how that would compare with AUC
Hello, I am a beginner for ML. Recently, I’m doing a project about Feature Selection. I have fineshed the most part of it. And writing the code with the help of the matlab toolboxs is OK. Now I haved learned that we can build a decision tree with the class classregtree in matlab. And we can get the Cost of Misclassification with the method test of classregtree. BUT what should I do next to get the classification accuracy? Is there any methods can get the classification accuracy? or we can calculate it by the Cost of Misclassification? Any help that you can give it to me will be appreciated.
You can make predictions on unsee data (data not used to fit the model). This will give you an estimate of the skill of the model when making predictions on new data.
This article should describe Balanced Accuracy = (Recall + Specificity)/2, which addresses the data set imbalance problem. Using the 3 models above:
The balanced accuracy of the All No Recurrence model is ((0/85)+(201/201))/2 or 0.5.
The balanced accuracy of the All Recurrence model is ((85/85)+(0/201))/2 or 0.5.
The precision of the CART model is ((10/85)+(188/201))/2 or 0.53
Making the CART the one to choose if there are no preferences for minimizing the false positive or false negative rates
Hi, i’m considerably a beginner at ML especially when dealing with measuring its performance. I’ve recently tried to measure the performance of a deep learning architecture in doing a classification task. The dataset used on that task is highly imbalanced. In proportion, the first class only take 33% of the entire data in terms of amount. I tried to use Accuracy, F1, and Area Under ROC Curve. I also used StratifiedKFold for the cross validation algorithm. But, the F1 value is higher than the accuracy with 3-5% margin. The Area Under ROC Curve value is still under the accuracy. Me, and my research supervisor never saw something like this. But, i, personally, believe that it is possible. One of my hypothesis is because of the imbalance dataset that gives a smaller true negative value in the accuracy calculation. Is it possible? Is there any explanation for it?
Is it possible to have a lower f measure value than the accuracy if the data is imbalanced (divided into 2 classes, 33% for first class, and 67% for the second class)? I assume it’s because of the low true negative value, is it correct?
When training a classifier (e.g. DNN based) with a continuous output p is it possible to specifically optimize for e.g. high recall? I am not talking about just making a cut on p at a point where recall is high but for instance setting a high recall goal e.g. 95% and minimizing the false positive rate obtainable at that recall goal.
When we examine how well the classifier is, do we care about True Negatives? Also, how to apply these measures on a multi-class problem? To me it feels like the Positive and Negative are two classes. But if we extend this to, say a 3 classes problem. Wouldn’t we need to extend this idea of Precision and Recall to all three classes to find the best classifier?
I didn’t know the difference of accuracy and f1-score. And here presenting the paradox of accuracy, it was explicitly clear the importance of validation models.
Hello Jason Brownlee
Great explaination!!
Please could you me on how to calculate model classification and predication ability in case of multiclass respones variable. help me in provide relavent infornation on this topic.
Is ‘Confusion matrix’ useful in detection of incorrect value in timeseries data ? If yes, how to classify output of neural network as true positive, true negative etc.
For example, when I put value ‘x’ to an input of NN it says ‘y’, but I can see that in my test data the value is ‘z’ (let’s say that ‘z’ is the incorrect value and value ‘y’ is the correct one). Should I consider it as a true positive ( assuming that incorrect values are represented by ‘positives’).
Thanks Jason,
great article.
Is it possible to compare different binary based classification models (using imbalanced data set) in terms of 7 different performance measures (recall, specificity, balanced accuracy, precision, F-score, MCC and AUC) and how can we decide which model is the best?
How can we interpret the following results when there is a conflict between different measures and what decision can we make?
For example, in terms of high balanced accuracy, the Kernel-SVM was the best model with 98.09%, followed by RBF-NN with 97.74% and CART DT with 95.26%. For the F-score, MCC and AUC measures , the RBF-NN model achieved the highest results (99.21 %, 92.82 and 0.98) followed by the CART DT (98.43%, 85.34% and 0.91) and the Kernel-SVM model (98.05%, 81.32% and 0.97).
Hi!Mr.Jason. I did a multiclass classification and found the confusion matrix for it.Then I found precision and sensitivity for each class and now I want to calculate Fscore.So what do I do?Should I calculate Fscore for each class and then average???or find average precision and sensitivity and find Fscore? or something
Thanks for the article! One of the biggest and first mistakes I made when I was starting out in machine learning was to think that accuracy tells the whole story. In fact, I found that more complex metric such as AUC, F1 and Precision and Recall are used more frequently than accuracy. In particular, Kaggle tends to favor AUC over accuracy or F1 in classification competitions.
I am doing a binary classification on images and I am fine-tuning the resnet50 pre-trained on imagenet dataset and fine tuning the all layers but I can only get upto 91% validation accuracy.How can I achieve higher than this?
import os
import glob
import numpy as np
import json
import pickle
import cv2
import ntpath
import random
import pdb
import datetime
from sklearn.preprocessing import LabelEncoder
import numpy as np
import h5py
import datetime
import time
# keras imports
#from keras.applications.mobilenet import MobileNet, preprocess_input
from keras.applications.resnet50 import ResNet50, preprocess_input
from keras.preprocessing import image
from keras.models import Model , load_model
from keras.models import model_from_json
from keras.layers import Input , Dense , Dropout , GlobalAveragePooling2D
from tensorflow.python.keras._impl.keras.layers import Conv2D , Reshape
from keras.preprocessing.image import ImageDataGenerator
from keras.optimizers import SGD,Adam
from keras import models
from keras import layers
from keras.callbacks import ReduceLROnPlateau , ModelCheckpoint , Callback
from keras import regularizers
#print (“[STATUS] start time – {}”.format(datetime.datetime.now().strftime(“%Y-%m-%d %H:%M”)))
#start = time.time()
image_size = 224
#prepare the data
train_datagen = ImageDataGenerator(
rescale=1./255,
vertical_flip=True,
horizontal_flip=True,
rotation_range=20)
x = resnet50.layers[-1].output
x = Dropout(0.5)(x)
predictions = Dense(2 , activation = “softmax”)(x)
model = Model(inputs = resnet50.inputs , outputs = predictions)
for layer in resnet50.layers:
layer.trainable = True
filepath=”weights-improvement-{epoch:02d}-{val_acc:.2f}.hdf5″
#Compile the model
model.compile(optimizer=Adam(lr=0.000001), loss=’categorical_crossentropy’, metrics=[‘accuracy’])
Sorry for that…I haven’t asked you to debug.I just wanted you to look at the parameters and augmentation techniques and suggest any ideas.
My training data is 6000 images and validation data is 1600 images.
Dear Jason,
A very informative article but here I have a query that if values of precision and recall are identical(means same)that what does it shows?Thanks for your precious time.
Dear Jason, thank you for your clear post. I am new in ML and I have a question on this topic. For the classification I divide my dataset into training and test sets. Iam wondering if it is proper or not to iterate the prediction of che classification (and the related confusion matrices) several time to assess the robustness of the model, namely to see what appens when the parameters used to build the model on the training data change. I hope I’ve been clear enough, thank you for your help.
Thanks for this write-up, it’s a helpful example that makes it easier for me to communicate this stuff to the bosses.
Questions:
Why doesn’t a prediction of No Recurrence count as a true-positive for the outcome of “No Recurrence”? Is that just because this is a binary example? And how is a binary problem really any different from classification of two classes that are mutually exclusive of each other…say apples and bananas?
Great article! I find myself referring to the F1 score a lot in statistical modeling of disease diagnosis. Besides balancing precision and recall, it also corresponds to the lowest false detection rate (FDR), which is something we have to be aware of in the real world. AUROC and F1 similarly describe performance, but sometimes a high AUROC can also have a high FDR (not usually true with F1). But as you say, there is no better, it really depends on what the problem is, and what types are errors are more acceptable. It’s all about trade-offs 🙂
hi can anybody help me how the values of “CART Confusion Matrix” are calculated/displayed please help me I tried my best but did not understand. please explain in detail
I have a query. Suppose we have 1 dataset, 2 models which are built on it and 2 performance metrics and each model is giving a better value on different metrics then how do we decide that which metrics to choose for both the models and also for more models which has to be tested on same dataset.
I mean there should be two accuracies as stated above for (1) All Recurrence Model (2) All No Recurrence Model (3) CART model.
Accuracy of Rightly Predicting that
(a) Lady has malignant cancer (b) Lady has NO malignant cancer
(1) FOR ALL NO RECURRENCE (2) FOR ALL RECURRENCE (3) FOR CART (4) FOR AN IDEAL MODEL
Then the
accuracy of Rightly Predicting that
(a1) 0/85 (a2) 85/85 (a3) 10/85 (a4) 85/85
(b1) 201/201 (b2) 0/201 (b3) 188/201 (b4) 201/201 .
Let me Explain more, to give a context:
Suppose we give the machine algorithm, two set of cells for comparison. One set for known cancer cells. One set for known healthy cells.
So the algorithm should compare the patient’s cell with the above two sets and generate two correlations.
Correlation of the patient cell with.
Healthy Cell: 80%-100% : Known Cancer Cell: 0%-30% : High chance lady you have no cancer.
Healthy Cell: 0%-30% : Known Cancer Cell: 70% – 99%: High chance lady that you have cancer.
Healthy Cell: 40%- 70% : Known Cancer Cell: 30%-70% : High chance lady you are on borderline.
Healthy Cell: 0%-30% : Known Cancer Cell: 10%-40% : ML Engineer, there is something you and I need learning. Lady, you are on borderline.
Healthy Cell: 50%-70% : Known Cancer Cell: 40%-60% : ML Engineer, there is something you and I need learning. Lady, you are on borderline.
Would it be possible to use the distance between the model performances and the optimal ones?
For example, let’s say we have a two class dataset, let’s say an imbalanced one. We have five measures :
global accuracy, detection rate of majority class (also called specificity), precision rate of majority class, and detection rate of minority class (sensitivity) and precision rate of minority class.
Thus, the perfect model would have the following measure vector : (1, 1, 1, 1, 1).
thank you for this great article Mr. Jason as it very usefull for me.
However i have some question, what is the best possible metric for multiclass imbalance problem in your opinion?
My project is on fault classification, so i think in my case recall or fbeta would suits better. but i have doubt whether i use micro, macro or weighted averaging on the metric. what do you think will suit better for imbalanced classification?
I’m working in a model to predict probability of default and i’m interested in the accuracy of the model.
I know 0 is the worst value and 1 is the best value while choosing among the models. Is there any standard value of the accuracy above which i can accept the model?
i have 80,17% of accuracy but i can’t find a minimun like in a p value where there is a minimun standard for example
A newbie (steadily growing better), I am experiencing the situation where three different classification models, NB, LR and SVM, show same numbers in scoreboard for precision, recall, etc. I realise that my dataset is imbalanced, i.e. 2,320 lines with abstracts in one column, and in another a qualifier indication ‘Go’/’No go’. 2K+ of abstracts show No go, while <100 show Go. Qualifier indicates whether or not to proceed with abstract contents.
I read that I could change weights in models from None to balanced, but I am not sure where in the model to add this information…;o/
The traceback I get says:
UndefinedMetricWarning: Precision and F-score are ill-defined and being set to 0.0 in labels with no predicted samples. Use zero_division parameter to control this behavior.
_warn_prf(average, modifier, msg_start, len(result))
I have problems removing the error (which, btw, I understand from Googling is not really an error per se), but that does not change the circumstance that all selected classification models have zeros to their precision and recall metrics.
I tried to change the train/test split from .3 to .5, and then to .1. Same error as above.
Any idea how to add weights (if that is the issue??) or generally how to deal with the issue?
You can set the class_weights to ‘balanced’ when you define the model.
This is a warning and it suggests that precision or recall needed by f1 cannot be calculated. It is likely that you are predicting all 1 values (the minority class).
Perhaps explore alternate models and alternate model configurations as well.
I have NO problems removing the error (which, btw, I understand from Googling is not really an error per se), but that does not change the circumstance that all selected classification models have zeros to their precision and recall metrics
Great article. I would like to know how which metrics is appropriate for NLP predictive model. It is seen that in literature accuracy is not preferred as compared to recall, precision and F1 score, any particular reason.
I have an issue, I had an umbalced and poor training set, I did up sampling but I have a problem with neural network. It does not classify upsampled class.
For these numbers to be correct, there should be a parenthesis in the additions:
The F1 for the All No Recurrence model is 2*((0*0)/0+0) or 0.
The F1 for the All Recurrence model is 2*((0.3*1)/0.3+1) or 0.46.
The F1 for the CART model is 2*((0.43*0.12)/0.43+0.12) or 0.19.
Something like
The F1 for the All No Recurrence model is 2*(0*0)/(0+0) or 0.
The F1 for the All Recurrence model is 2*(0.3*1)/(0.3+1) or 0.46.
The F1 for the CART model is 2*(0.43*0.12)/(0.43+0.12) or 0.19.
Hello sir i wanna asked one thing RIFO (Ranked improved f-score ordering ) and F-score differncence im confused about please sir help out which one is good and advanced.
I am trying to build a churn classification model. However, whatever model I try I am not able to go past 0.66 for any of the evaluation metrics. Does it mean I need more better features ?
Also, what would be the best course of action to take in this situation?
Just by counting. You count how many positive you predicted, and how many positive it has in the dataset. Then you can classify each sample into TP, FP, TN, FN.
i mean if i have a dataset that has 100 positive samples and 1000 is negative samples. And we calculate the f1 score of this data so, in which context this difference is notable.
If i apply Random Forest on this data a suppose i get 98% F1 score and similarly the other person does the same work and he gets a 98.5% F1 score. So, in which context this .5% improvement in the F1 score makes a difference in this dataset.
I am not sure what you’re asking. But with 10% positive samples of negative, a 0.5% improvement in F1 score seems a lot to me. Are you asking for a use case of 0.5% improvement is significant? This may be an answer to you: https://qr.ae/pGxHUL


")
")

Hey Jason,
There is a spelling mistake in the first paragraph of “Confusion Matrix” section where you wrote “A clean and unambiguous way to present the prediction results of a classifier is to use a use a confusion matrix (also called a contingency table).”.
You see two “use a”. 🙂
Thank you.
you also made a typo by repeating “use a”
Thanks, fixed.
In the last point that you made,
If we were looking to select a model based on a balance between precision and recall, the F1 measure suggests that All Recurrence model is the one to beat and that CART model is not yet sufficiently competitive.
here do we then select the all recurrence model because it is giving a better balance of precision and recall? or do we try to get a model which performs at least better than cart?
The F1 metric is not a suitable method of combining precision and recall if there is a class imbalance, as there is here. More appropriate would be to use the Matthew’s Correlation Coefficient (https://en.wikipedia.org/wiki/Matthews_correlation_coefficient). By my calculations the results are:
All No Recurrence = 0
All Recurrence = 0
CART = 0.089
Meaning the “All No Recurrence” and “All Recurrence” models are no better than randomly guessing, and CART is only marginally better. Unfortunately no useful models were presented in this article, but using MCC it’s possible to catch this. Here’s how to interpret MCC:
http://stats.stackexchange.com/questions/118219/how-to-interpret-matthews-correlation-coefficient-mcc
Hi Asim,
Sir – In the above we wish to give more weight to False Negatives than False Positives. However F1 Score has given same weight to both (Simple Harmonic Mean). How can we adjust the Weights?
Or Should we go for Mathew’s Correlation coefficient as you mentioned above
Thanks
Panchajanya
We know 0 is the worst value and 1 is the best value for F1 Score while choosing among the models. Is there any standard value of F1 Score (like p-value) above which we accept the model and below which we reject the model?
what is the R Code for calculating accuracy of decision tree of cancer data
Hi Jason,
[Reporting mistake in article]
If we look at the examples of F1 score calculations we can see that there are missing parentheses at the denominator. Just reporting, you might want to update this according to the correct formula you previously stated! 🙂
https://en.wikipedia.org/wiki/F1_score
Best,
Hichame
I found, the precision and recall value given by the caret package in R are different from the actual definition of them in https://en.wikipedia.org/wiki/Precision_and_recall. Could you tell me why it is? In fact , I got an online confusion matrix where both results are showing. http://www.marcovanetti.com/pages/cfmatrix/ . I can’t understand which one I should use.
Balanced accuracy can be used as a better metrics than accuracy for a multi class imbalanced dataset classification task. have you tried to review that to affirm if that is correct or not. If yes, can you drop your implementation on your blog
It is helpful to know that the F1/F Score is a measure of how accurate a model is by using Precision and Recall following the formula of:
F1_Score = 2 * ((Precision * Recall) / (Precision + Recall))
Precision is commonly called positive predictive value. It is also interesting to note that the PPV can be derived using Bayes’ theorem as well.
Precision = True Positives / (True Positives + False Positives)
Recall is also known as the True Positive Rate and is defined as the following:
Recall = True Positives / (True Positives + False Negatives)
Thanks for sharing.
is auc better?
AUC is a very useful metric also.
A very good explanation to a very common analytics scenario!
Thanks Ankur.
It would be useful to see how the F-beta (specifically the F2) measure would perform in your scenario, particularly as we are seeking to minimise false negatives … and how that would compare with AUC
Great suggestion, thanks.
Hello, I am a beginner for ML. Recently, I’m doing a project about Feature Selection. I have fineshed the most part of it. And writing the code with the help of the matlab toolboxs is OK. Now I haved learned that we can build a decision tree with the class classregtree in matlab. And we can get the Cost of Misclassification with the method test of classregtree. BUT what should I do next to get the classification accuracy? Is there any methods can get the classification accuracy? or we can calculate it by the Cost of Misclassification? Any help that you can give it to me will be appreciated.
You can make predictions on unsee data (data not used to fit the model). This will give you an estimate of the skill of the model when making predictions on new data.
Thanks a lot
This article should describe Balanced Accuracy = (Recall + Specificity)/2, which addresses the data set imbalance problem. Using the 3 models above:
The balanced accuracy of the All No Recurrence model is ((0/85)+(201/201))/2 or 0.5.
The balanced accuracy of the All Recurrence model is ((85/85)+(0/201))/2 or 0.5.
The precision of the CART model is ((10/85)+(188/201))/2 or 0.53
Making the CART the one to choose if there are no preferences for minimizing the false positive or false negative rates
Thanks for sharing Kaleb.
Hi, i’m considerably a beginner at ML especially when dealing with measuring its performance. I’ve recently tried to measure the performance of a deep learning architecture in doing a classification task. The dataset used on that task is highly imbalanced. In proportion, the first class only take 33% of the entire data in terms of amount. I tried to use Accuracy, F1, and Area Under ROC Curve. I also used StratifiedKFold for the cross validation algorithm. But, the F1 value is higher than the accuracy with 3-5% margin. The Area Under ROC Curve value is still under the accuracy. Me, and my research supervisor never saw something like this. But, i, personally, believe that it is possible. One of my hypothesis is because of the imbalance dataset that gives a smaller true negative value in the accuracy calculation. Is it possible? Is there any explanation for it?
Is it possible to have a lower f measure value than the accuracy if the data is imbalanced (divided into 2 classes, 33% for first class, and 67% for the second class)? I assume it’s because of the low true negative value, is it correct?
Hi,
I think it would be nice including those informations in your ebook “Machine Learning Mastery with R”
I am afraid there is a lot missing there about this subject,
Thanks,
Thanks for the suggestion Eduardo.
I would love to see the same explanation for multi-class problems.Defining confusion matrix for binary classes is old now.
Thanks for the suggestion.
When training a classifier (e.g. DNN based) with a continuous output p is it possible to specifically optimize for e.g. high recall? I am not talking about just making a cut on p at a point where recall is high but for instance setting a high recall goal e.g. 95% and minimizing the false positive rate obtainable at that recall goal.
A real-valued outcome makes your prediction problem regression not classification.
Recall and precision cannot be measured on regression problems.
The confusion matrix you presented shows predictions as rows and observed classes as columns. Isn’t this the wrong way round?
Compared to what Richard?
When we examine how well the classifier is, do we care about True Negatives? Also, how to apply these measures on a multi-class problem? To me it feels like the Positive and Negative are two classes. But if we extend this to, say a 3 classes problem. Wouldn’t we need to extend this idea of Precision and Recall to all three classes to find the best classifier?
It really depends on your specific problem and on the area of your predictions that are most important to you.
Great article Jason!
I didn’t know the difference of accuracy and f1-score. And here presenting the paradox of accuracy, it was explicitly clear the importance of validation models.
I’m glad the post helped.
Hello Jason Brownlee
Great explaination!!
Please could you me on how to calculate model classification and predication ability in case of multiclass respones variable. help me in provide relavent infornation on this topic.
Thank you
Perhaps start with a confusion matrix to help understand the model output:
https://machinelearningmastery.com/confusion-matrix-machine-learning/
Hi Jason, thanks for this article. May I ask if you could reflect to the problem I asked in this question regarding MCC?
https://stats.stackexchange.com/questions/299333/question-about-imbalanced-training-and-test-sets
Also, do you have any opinion about using G-mean as a performance metric for imbalanced datasets?
Thanks for all your help!
In that case, what will be the good Precision and Recall values to determine that our model prediction is good?
Thanks.
Great question.
You want results that are better relative to a baseline model, such as the Zero Rule algorithm.
Is ‘Confusion matrix’ useful in detection of incorrect value in timeseries data ? If yes, how to classify output of neural network as true positive, true negative etc.
For example, when I put value ‘x’ to an input of NN it says ‘y’, but I can see that in my test data the value is ‘z’ (let’s say that ‘z’ is the incorrect value and value ‘y’ is the correct one). Should I consider it as a true positive ( assuming that incorrect values are represented by ‘positives’).
No, it is for classification problems, and time series are often regression problems.
Thanks Jason,
great article.
Is it possible to compare different binary based classification models (using imbalanced data set) in terms of 7 different performance measures (recall, specificity, balanced accuracy, precision, F-score, MCC and AUC) and how can we decide which model is the best?
Thanks
Yes. Model selection will be specific your project goals.
Hi Jason,
I have a question about decision making.
How can we interpret the following results when there is a conflict between different measures and what decision can we make?
For example, in terms of high balanced accuracy, the Kernel-SVM was the best model with 98.09%, followed by RBF-NN with 97.74% and CART DT with 95.26%. For the F-score, MCC and AUC measures , the RBF-NN model achieved the highest results (99.21 %, 92.82 and 0.98) followed by the CART DT (98.43%, 85.34% and 0.91) and the Kernel-SVM model (98.05%, 81.32% and 0.97).
Thanks
It comes down to the measure that best reflects your goals and the simplest-skillful model on that measure.
Thanks Jason,
Is it possible to compare different classification models based on the overall mean of different performance measures?
Sure, you can compare algorithms anyway you wish for your specific requirements.
Jason, thanks.
I see a string of useful evaluation metrics. Take classification for example, we see accuracy, F-measure, area under ROC etc.
dumb question: is there a utility score metric that combines many (all?) of them and give us a universal score? probably not, why not?
For example, F-measure combines precision and recall.
ps. How can I get email notifications when somebody replies to my questions or comments.
Model skill is really a balance of trade-offs. You must find the right trade-off for your specific problem (e.g. by talking to stakeholders).
Sorry, I don’t have notifications yet, I hope to add them in the future. Thanks for the prompt!
Hi!Mr.Jason. I did a multiclass classification and found the confusion matrix for it.Then I found precision and sensitivity for each class and now I want to calculate Fscore.So what do I do?Should I calculate Fscore for each class and then average???or find average precision and sensitivity and find Fscore? or something
This article may help you calculate the F-score manually:
https://en.wikipedia.org/wiki/F1_score
Thanks for the article! One of the biggest and first mistakes I made when I was starting out in machine learning was to think that accuracy tells the whole story. In fact, I found that more complex metric such as AUC, F1 and Precision and Recall are used more frequently than accuracy. In particular, Kaggle tends to favor AUC over accuracy or F1 in classification competitions.
Yes, and log loss.
Hi Jason! Thanks for this information. Does your book have this content?
I do cover measures in some of my books, but not in great detail.
What do you need help with exactly?
Typo: The recall metrics in the CART F-score calculation is missing the decimals i.e. reads as 12 instead of 0.12
“The F1 for the CART model is 2*((0.43*12)/0.43+12) or 0.19.”
Great blog Jason!
Thanks, fixed!
I am doing a binary classification on images and I am fine-tuning the resnet50 pre-trained on imagenet dataset and fine tuning the all layers but I can only get upto 91% validation accuracy.How can I achieve higher than this?
I have some general ideas here:
https://machinelearningmastery.com/improve-deep-learning-performance/
Here is the total code that I have used.
import os
import glob
import numpy as np
import json
import pickle
import cv2
import ntpath
import random
import pdb
import datetime
from sklearn.preprocessing import LabelEncoder
import numpy as np
import h5py
import datetime
import time
# keras imports
#from keras.applications.mobilenet import MobileNet, preprocess_input
from keras.applications.resnet50 import ResNet50, preprocess_input
from keras.preprocessing import image
from keras.models import Model , load_model
from keras.models import model_from_json
from keras.layers import Input , Dense , Dropout , GlobalAveragePooling2D
from tensorflow.python.keras._impl.keras.layers import Conv2D , Reshape
from keras.preprocessing.image import ImageDataGenerator
from keras.optimizers import SGD,Adam
from keras import models
from keras import layers
from keras.callbacks import ReduceLROnPlateau , ModelCheckpoint , Callback
from keras import regularizers
#print (“[STATUS] start time – {}”.format(datetime.datetime.now().strftime(“%Y-%m-%d %H:%M”)))
#start = time.time()
image_size = 224
#prepare the data
train_datagen = ImageDataGenerator(
rescale=1./255,
vertical_flip=True,
horizontal_flip=True,
rotation_range=20)
validation_datagen = ImageDataGenerator(rescale=1./255)
# Change the batchsize according to your system RAM
train_batchsize = 16
val_batchsize = 16
train_generator = train_datagen.flow_from_directory(
train_dir,
target_size=(224, 224),
batch_size=train_batchsize,
class_mode=’categorical’)
validation_generator = validation_datagen.flow_from_directory(
validation_dir,
target_size=(224, 224),
batch_size=val_batchsize,
class_mode=’categorical’,
shuffle=False)
#Model
resnet50 = ResNet50()
resnet50.layers.pop()
#x = mobilenet.layers[-6].output
#x = Dense(512 , activation = “relu”)(x)
#x = Dropout(0.2)(x)
#predictions = Dense(2 , activation = “softmax”)(x)
#model = Model(inputs = mobilenet.inputs , outputs = predictions)
#print(model.summary())
x = resnet50.layers[-1].output
x = Dropout(0.5)(x)
predictions = Dense(2 , activation = “softmax”)(x)
model = Model(inputs = resnet50.inputs , outputs = predictions)
for layer in resnet50.layers:
layer.trainable = True
filepath=”weights-improvement-{epoch:02d}-{val_acc:.2f}.hdf5″
#Compile the model
model.compile(optimizer=Adam(lr=0.000001), loss=’categorical_crossentropy’, metrics=[‘accuracy’])
#Callbacks
checkpointer = ModelCheckpoint(filepath, monitor=’val_loss’ , verbose=1, save_best_only=True , mode = ‘min’)
history = model.fit_generator(
train_generator,
steps_per_epoch=train_generator.samples/train_generator.batch_size ,
epochs=200,
validation_data=validation_generator,
validation_steps=validation_generator.samples/validation_generator.batch_size,
verbose=1,
callbacks=[checkpointer]
)
Can you share any ideas based on this.
I’m eager to help, but I don’t have the capacity to debug your code.
Sorry for that…I haven’t asked you to debug.I just wanted you to look at the parameters and augmentation techniques and suggest any ideas.
My training data is 6000 images and validation data is 1600 images.
Dear Jason,
A very informative article but here I have a query that if values of precision and recall are identical(means same)that what does it shows?Thanks for your precious time.
I’m not sure what you’re driving at?
Dear Jason,
Below is an example of identical precision and recall values.
Precision Recall
0.82 0.85
0.85 0.81
avg 0.83 0.83
I want to know that what is the reason that the precision and recall values appear to be same.
Why?
Dear Jason, thank you for your clear post. I am new in ML and I have a question on this topic. For the classification I divide my dataset into training and test sets. Iam wondering if it is proper or not to iterate the prediction of che classification (and the related confusion matrices) several time to assess the robustness of the model, namely to see what appens when the parameters used to build the model on the training data change. I hope I’ve been clear enough, thank you for your help.
Yes, it is a good idea to fit and evaluate a given configuration many times and calculate the average performance.
This is in order to counter the stochastic nature of the algorithm. I explain more here:
https://machinelearningmastery.com/evaluate-skill-deep-learning-models/
Which is more important to you– model accuracy, or model performance?
Accuracy is a performance metric.
Perhaps I don’t follow your question? Do you mean performance as in computational complexity?
I think All Recurrence accuracy should be (85/286) instead of (75/286)
Thanks, fixed.
Thanks for this write-up, it’s a helpful example that makes it easier for me to communicate this stuff to the bosses.
Questions:
Why doesn’t a prediction of No Recurrence count as a true-positive for the outcome of “No Recurrence”? Is that just because this is a binary example? And how is a binary problem really any different from classification of two classes that are mutually exclusive of each other…say apples and bananas?
Perhaps this will make things clearer Tyler:
https://en.wikipedia.org/wiki/Precision_and_recall
I would think even a metric as simple as (TPR + TNR)/2 would be useful for evaluating accuracy. What makes F1 better?
There is no “better”, just different approaches to try, one might be a good fit for your problem.
Great article! I find myself referring to the F1 score a lot in statistical modeling of disease diagnosis. Besides balancing precision and recall, it also corresponds to the lowest false detection rate (FDR), which is something we have to be aware of in the real world. AUROC and F1 similarly describe performance, but sometimes a high AUROC can also have a high FDR (not usually true with F1). But as you say, there is no better, it really depends on what the problem is, and what types are errors are more acceptable. It’s all about trade-offs 🙂
For sure. You really need to know what is important in measuring performance of a model no your problem and focus on that like a laser.
hi can anybody help me how the values of “CART Confusion Matrix” are calculated/displayed please help me I tried my best but did not understand. please explain in detail
This post will help:
https://machinelearningmastery.com/confusion-matrix-machine-learning/
Sir still not clear how the value of Recurrence 10 and No Recurrence 188 calculated in CART Confusion Matrix.
Sir in the link there is example of men and women but in this there is only example of women.
The example was contrived I believe.
Hi Jason,
I have a query. Suppose we have 1 dataset, 2 models which are built on it and 2 performance metrics and each model is giving a better value on different metrics then how do we decide that which metrics to choose for both the models and also for more models which has to be tested on same dataset.
Perhaps choose the metric that best captures what is important about the model to you and project stakeholders?
Are the columns and rows of the confusion matrix the ‘Actual’ and ‘Predicted’ separately? Some marks will make the information more clear.
Thanks.
Classification accuracy is our starting point. It is the number of correct predictions made divided by the total number of predictions made.
Shouldn’t there be two parameters for “a correct prediction” ?
Accuracy of correctly predicting person has cancer/ recurrance.
Accuracy of correctly predicting person has no cancer/no recurrance.
A correct prediction simply means that the model predicted what occurred, e.g. cancer/no cancer.
You can then further divide the predictions into types based on the class outcome, e.g. true-positive, false-positive and so on.
I mean there should be two accuracies as stated above for (1) All Recurrence Model (2) All No Recurrence Model (3) CART model.
Accuracy of Rightly Predicting that
(a) Lady has malignant cancer (b) Lady has NO malignant cancer
(1) FOR ALL NO RECURRENCE (2) FOR ALL RECURRENCE (3) FOR CART (4) FOR AN IDEAL MODEL
Then the
accuracy of Rightly Predicting that
(a1) 0/85 (a2) 85/85 (a3) 10/85 (a4) 85/85
(b1) 201/201 (b2) 0/201 (b3) 188/201 (b4) 201/201 .
Let me Explain more, to give a context:
Suppose we give the machine algorithm, two set of cells for comparison. One set for known cancer cells. One set for known healthy cells.
So the algorithm should compare the patient’s cell with the above two sets and generate two correlations.
Correlation of the patient cell with.
Healthy Cell: 80%-100% : Known Cancer Cell: 0%-30% : High chance lady you have no cancer.
Healthy Cell: 0%-30% : Known Cancer Cell: 70% – 99%: High chance lady that you have cancer.
Healthy Cell: 40%- 70% : Known Cancer Cell: 30%-70% : High chance lady you are on borderline.
Healthy Cell: 0%-30% : Known Cancer Cell: 10%-40% : ML Engineer, there is something you and I need learning. Lady, you are on borderline.
Healthy Cell: 50%-70% : Known Cancer Cell: 40%-60% : ML Engineer, there is something you and I need learning. Lady, you are on borderline.
I believe you are referring to TP/FP/FN/TN, you can learn more here:
https://en.wikipedia.org/wiki/Precision_and_recall#Definition_(classification_context)
Very well written. To the point and in simplest explanations. Thank you!
Thanks, I’m glad it helped!
Hi and thanks for you article!
Would it be possible to use the distance between the model performances and the optimal ones?
For example, let’s say we have a two class dataset, let’s say an imbalanced one. We have five measures :
global accuracy, detection rate of majority class (also called specificity), precision rate of majority class, and detection rate of minority class (sensitivity) and precision rate of minority class.
Thus, the perfect model would have the following measure vector : (1, 1, 1, 1, 1).
So the distance would be equal to :
sqrt( (global_accuracy – 1)^2 + (sensitivity – 1)^2 + … )
would it make sense to choose the model (or threshold, or parameter set…) thaht minimize that metrics?
If so, do you have some paper about it (couldn’t find on the net yet..)
Thanks again for your great job!
Perhaps, it is really a project specific concern – e.g. what is most important about a model to the project stakeholders.
thank you for this great article Mr. Jason as it very usefull for me.
However i have some question, what is the best possible metric for multiclass imbalance problem in your opinion?
It really depends on your project and what is important to yuor project stakeholders.
Popular options include F1, precision, recall, and probabilistic measures like log loss.
My project is on fault classification, so i think in my case recall or fbeta would suits better. but i have doubt whether i use micro, macro or weighted averaging on the metric. what do you think will suit better for imbalanced classification?
I’m working in a model to predict probability of default and i’m interested in the accuracy of the model.
I know 0 is the worst value and 1 is the best value while choosing among the models. Is there any standard value of the accuracy above which i can accept the model?
i have 80,17% of accuracy but i can’t find a minimun like in a p value where there is a minimun standard for example
Yes, you can calculate the accuracy using a naive model, specifically a majority class model.
Any model that has accuracy above that has skill, any model that has accuracy below that, does not have skill.
Learn more here:
https://machinelearningmastery.com/faq/single-faq/how-to-know-if-a-model-has-good-performance
And here:
https://machinelearningmastery.com/how-to-develop-and-evaluate-naive-classifier-strategies-using-probability/
Hi Gianinna,
Could you share your experiences about the PD-models that you have been working with? I am in the same situation now.
Best regards
Hi,
A newbie (steadily growing better), I am experiencing the situation where three different classification models, NB, LR and SVM, show same numbers in scoreboard for precision, recall, etc. I realise that my dataset is imbalanced, i.e. 2,320 lines with abstracts in one column, and in another a qualifier indication ‘Go’/’No go’. 2K+ of abstracts show No go, while <100 show Go. Qualifier indicates whether or not to proceed with abstract contents.
I read that I could change weights in models from None to balanced, but I am not sure where in the model to add this information…;o/
The traceback I get says:
UndefinedMetricWarning: Precision and F-score are ill-defined and being set to 0.0 in labels with no predicted samples. Use
zero_divisionparameter to control this behavior._warn_prf(average, modifier, msg_start, len(result))
I have problems removing the error (which, btw, I understand from Googling is not really an error per se), but that does not change the circumstance that all selected classification models have zeros to their precision and recall metrics.
I tried to change the train/test split from .3 to .5, and then to .1. Same error as above.
Any idea how to add weights (if that is the issue??) or generally how to deal with the issue?
BR
Jens
You can set the class_weights to ‘balanced’ when you define the model.
This is a warning and it suggests that precision or recall needed by f1 cannot be calculated. It is likely that you are predicting all 1 values (the minority class).
Perhaps explore alternate models and alternate model configurations as well.
Correction:
It should say:
I have NO problems removing the error (which, btw, I understand from Googling is not really an error per se), but that does not change the circumstance that all selected classification models have zeros to their precision and recall metrics
Exactly.
Thank you for this informative article. However, I have a question.
Can we calculate sensitivity and specificity for a multi-class problem? If so, then what will be the significance of those values?
I believe so. You will have to specify which are the positive and negative classes.
Great article. I would like to know how which metrics is appropriate for NLP predictive model. It is seen that in literature accuracy is not preferred as compared to recall, precision and F1 score, any particular reason.
Thanks!
It really depends on the task. Perhaps check the literature for papers on your task and see what measures they use?
Can i know what is best technique to evaluate Multi-Class Classification mode ?l
Good question, see this:
https://machinelearningmastery.com/tour-of-evaluation-metrics-for-imbalanced-classification/
Hello,
as always your articles are wonderfull.
I have an issue, I had an umbalced and poor training set, I did up sampling but I have a problem with neural network. It does not classify upsampled class.
just to be clear:
precision recall f1-score support
1 0.56 1.00 0.72 1013
2 0.00 0.00 0.00 797
accuracy 0.56 1810
macro avg 0.28 0.50 0.36 1810
weighted avg 0.31 0.56 0.40 1810
this is what I get from neural network, but the paradox is that for SVC, always after upsampling, this is what I get:
precision recall f1-score support
1 0.84 0.96 0.90 1013
2 0.94 0.78 0.85 797
accuracy 0.88 1810
macro avg 0.89 0.87 0.88 1810
weighted avg 0.89 0.88 0.88 1810
It’s like neural network , is to complicated for my training set ( I tried to modify architecture, layers and so on).
Could be possible?
Really Thanks
It may be. Use the model that gives the best performance.
Hello ,
Is accuracy enough if we have a multiclass classification but with a balanced dataset ?
It can be!
For these numbers to be correct, there should be a parenthesis in the additions:
The F1 for the All No Recurrence model is 2*((0*0)/0+0) or 0.
The F1 for the All Recurrence model is 2*((0.3*1)/0.3+1) or 0.46.
The F1 for the CART model is 2*((0.43*0.12)/0.43+0.12) or 0.19.
Something like
The F1 for the All No Recurrence model is 2*(0*0)/(0+0) or 0.
The F1 for the All Recurrence model is 2*(0.3*1)/(0.3+1) or 0.46.
The F1 for the CART model is 2*(0.43*0.12)/(0.43+0.12) or 0.19.
Great article, thanks!
Thanks, this might be better:
https://machinelearningmastery.com/feature-selection-with-real-and-categorical-data/
This example is very confusing. You should have taken a Yes/No type example.
Thanks for the suggestion.
Hello sir i wanna asked one thing RIFO (Ranked improved f-score ordering ) and F-score differncence im confused about please sir help out which one is good and advanced.
Sorry, I don’t know about “RIFO”.
Hi Jason,
I am trying to build a churn classification model. However, whatever model I try I am not able to go past 0.66 for any of the evaluation metrics. Does it mean I need more better features ?
Also, what would be the best course of action to take in this situation?
Perhaps this will help you to choose a metric:
https://machinelearningmastery.com/tour-of-evaluation-metrics-for-imbalanced-classification/
Hello Jason,
How did you figure out the numbers in CART CONFUSION MATRIX?
That is the numbers forTP, FP, FN, TN. I could not get this part.
Please share the details on the same.
Just by counting. You count how many positive you predicted, and how many positive it has in the dataset. Then you can classify each sample into TP, FP, TN, FN.
In which context does F-score make such a difference if it’s even 1%
Sorry, can’t see what you’re referring to. Which difference you’re talking about?
i mean if i have a dataset that has 100 positive samples and 1000 is negative samples. And we calculate the f1 score of this data so, in which context this difference is notable.
If i apply Random Forest on this data a suppose i get 98% F1 score and similarly the other person does the same work and he gets a 98.5% F1 score. So, in which context this .5% improvement in the F1 score makes a difference in this dataset.
I am not sure what you’re asking. But with 10% positive samples of negative, a 0.5% improvement in F1 score seems a lot to me. Are you asking for a use case of 0.5% improvement is significant? This may be an answer to you: https://qr.ae/pGxHUL
So, in a case when we need false positive and false negative, we measure F-score. so, in this case I think 0.5% improvement seems a lot.? am i right
I think so. But if you are not convinced, try to consider MCC, which takes into account off both positive side and negative side: https://en.wikipedia.org/wiki/Matthews_correlation_coefficient
firstival I would like to thank you for your lessons, they are very very useful.
what is the best metric for document classification and why?
Hi marwa..You are very welcome! The following resource will hopefully be helpful:
https://iq.opengenus.org/performance-metrics-in-classification-regression/