Logistic regression is another technique borrowed by machine learning from the field of statistics.
It is the go-to method for binary classification problems (problems with two class values). In this post, you will discover the logistic regression algorithm for machine learning.
After reading this post you will know:
- The many names and terms used when describing logistic regression (like log odds and logit).
- The representation used for a logistic regression model.
- Techniques used to learn the coefficients of a logistic regression model from data.
- How to actually make predictions using a learned logistic regression model.
- Where to go for more information if you want to dig a little deeper.
- Problem faced by the algorithm and the latest solution.
- Recent updates in machine learning and deep learning frameworks.
- Logistic regression and XAI.
- Logistic regression and federated learning.
This post was written for developers interested in applied machine learning, specifically predictive modeling. You do not need to have a background in linear algebra or statistics.
Updated Dec 2023:
- Updated existing sections for clarity
- Added section: Major Problem with the Algorithm
- Added section: Updates in Well-known Frameworks for Logistic Regression
- Added section: Logistic Regression: Versatility in Explainable AI and Low-Resource/Federated Environments
Kick-start your project with my new book Master Machine Learning Algorithms, including step-by-step tutorials and the Excel Spreadsheet files for all examples.
Let’s get started.

Learning Algorithm for Logistic Regression
Photo by Michael Vadon, some rights reserved.
Logistic Function
Logistic regression is named for the function used at the core of the method, the logistic function.
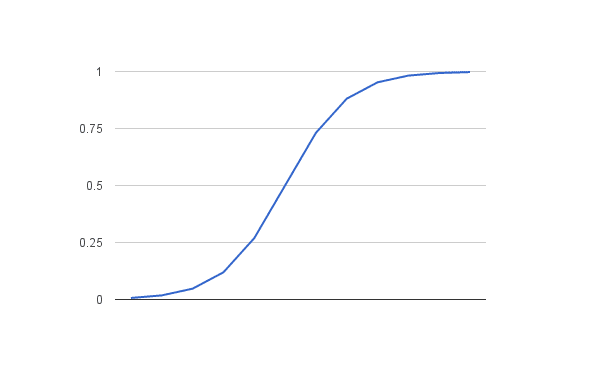
The logistic function, also called the sigmoid function was developed by statisticians to describe properties of population growth in ecology, rising quickly and maxing out at the carrying capacity of the environment. It’s an S-shaped curve that can take any real-valued number and map it into a value between 0 and 1, but never exactly at those limits.
1 / (1 + e^-value)
Where e is the base of the natural logarithms (Euler’s number or the EXP() function in your spreadsheet) and value is the actual numerical value that you want to transform. Below is a plot of the numbers between -5 and 5 transformed into the range 0 and 1 using the logistic function.
Logistic Function
Now that we know what the logistic function is, let’s see how it is used in logistic regression.
Representation Used for Logistic Regression
Logistic regression uses an equation as the representation, very much like linear regression.
Input values (x) are combined linearly using weights or coefficient values (referred to as the Greek capital letter Beta) to predict an output value (y). A key difference from linear regression is that the output value being modeled is a binary value (0 or 1) rather than a numeric value.
Below is an example logistic regression equation:
y = e^(b0 + b1*x) / (1 + e^(b0 + b1*x))
Where y is the predicted output, b0 is the bias or intercept term and b1 is the coefficient for the single input value (x). Each column in your input data has an associated b coefficient (a constant real value) that must be learned from your training data.
The actual representation of the model that you would store in memory or in a file are the coefficients in the equation (the beta value or b’s).
Get your FREE Algorithms Mind Map
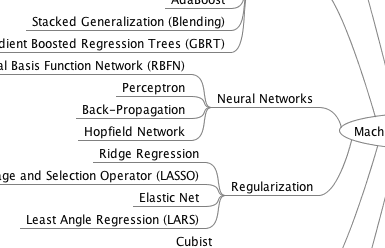
Sample of the handy machine learning algorithms mind map.
I've created a handy mind map of 60+ algorithms organized by type.
Download it, print it and use it.
Also get exclusive access to the machine learning algorithms email mini-course.
Logistic Regression Predicts Probabilities (Technical Interlude)
Logistic regression models the probability of the default class (e.g. the first class). For example, if we are modeling people’s sex as male or female from their height, then the first class could be male, and the logistic regression model could be written as the probability of male given a person’s height, or more formally:
P(sex=male|height)
In contemporary machine learning applications, understanding probability estimation is crucial. Logistic regression predicts probabilities, which are the foundation for classification tasks.
Written another way, we are modeling the probability that an input (X) belongs to the default class (Y=1), and we can write this formally as:
P(X) = P(Y=1|X)
It’s essential to emphasize that logistic regression is not just a classification algorithm; it’s a method for estimating probabilities.
Are we predicting probabilities? I thought logistic regression was a classification algorithm.
Logistic regression is a powerful classification technique by estimating the likelihood of an input belonging to a particular class. This estimation is inherently a probability prediction, which must be converted into binary values (0 or 1) to make class predictions. We’ll delve deeper into this process shortly when discussing making predictions.
Logistic regression is a linear method, but the predictions are transformed using the logistic function. The impact of this is that we can no longer understand the predictions as a linear combination of the inputs as we can with linear regression. For example, continuing from above, the model can be stated as:
p(X) = e^(b0 + b1*X) / (1 + e^(b0 + b1*X))
I don’t want to dive into the math too much, but we can turn around the above equation as follows (remember we can remove the e from one side by adding a natural logarithm (ln) to the other):
ln(p(X) / 1 – p(X)) = b0 + b1 * X
This mathematical transformation allows us to interpret the model more intuitively. The left-hand side represents the log odds or the probit, which is a crucial concept in logistic regression.
This is useful because we can see that the calculation of the output on the right is linear again (just like linear regression), and the input on the left is a log of the probability of the default class.
This ratio on the left is called the odds of the default class (it’s historical that we use odds, for example, odds are used in horse racing rather than probabilities). Odds are calculated as a ratio of the probability of the event divided by the probability of not the event, e.g. 0.8/(1-0.8) which has the odds of 4. So we could instead write:
ln(odds) = b0 + b1 * X
Because the odds are log-transformed, we call this left-hand side the log-odds or the probit. It is possible to use other types of functions for the transform (which is out of scope), but as such, it is common to refer to the transformation that relates the linear regression equation to the probabilities as the link function, e.g., the probit link function.
We can move the exponent back to the right and write it as:
odds = e^(b0 + b1 * X)
All of this provides valuable insights into the inner workings of logistic regression, demonstrating that the model is indeed a linear combination of the inputs. However, this linear combination is related to the log-odds of the default class, making it a powerful tool for probabilistic classification.
Learning the Logistic Regression Model
The coefficients (Beta values b) of the logistic regression algorithm must be estimated from your training data. This is done using maximum-likelihood estimation.
Maximum-likelihood estimation is a common learning algorithm used by a variety of machine learning algorithms, although it does make assumptions about the distribution of your data (more on this when we talk about preparing your data).
The best coefficients would result in a model that would predict a value very close to 1 (e.g. male) for the default class and a value very close to 0 (e.g. female) for the other class. The intuition for maximum-likelihood for logistic regression is that a search procedure seeks values for the coefficients (Beta values) that minimize the error in the probabilities predicted by the model to those in the data (e.g. probability of 1 if the data is the primary class).
We are not going to go into the math of maximum likelihood. It is enough to say that a minimization algorithm is used to optimize the best values for the coefficients for your training data. In practice, the optimization of logistic regression models is often implemented using efficient numerical optimization algorithms such as Limited-memory Broyden–Fletcher–Goldfarb–Shanno (L-BFGS) and Adaptive Moment Estimation (ADAM), which are now considered best practices. These methods provide faster convergence and improved efficiency, particularly when dealing with large datasets.
When you are learning logistic regression, you can implement it yourself from scratch using the much simpler gradient descent algorithm.

Logistic Regression for Machine Learning
Photo by woodleywonderworks, some rights reserved.
Making Predictions with Logistic Regression
Making predictions with a logistic regression model is as simple as plugging in numbers into the logistic regression equation and calculating a result.
Let’s make this concrete with a specific example.
Let’s say we have a model that can predict whether a person is male or female based on their height (completely fictitious). Given a height of 150cm is the person male or female.
We have learned the coefficients of b0 = -100 and b1 = 0.6. Using the equation above we can calculate the probability of male given a height of 150cm or more formally P(male|height=150). We will use EXP() for e, because that is what you can use if you type this example into your spreadsheet:
y = e^(b0 + b1*X) / (1 + e^(b0 + b1*X))
y = exp(-100 + 0.6*150) / (1 + EXP(-100 + 0.6*X))
y = 0.0000453978687
Or a probability of near zero that the person is a male.
In practice we can use the probabilities directly. Because this is classification and we want a crisp answer, we can snap the probabilities to a binary class value, for example:
0 if p(male) < 0.5
1 if p(male) >= 0.5
Now that we know how to make predictions using logistic regression, let’s look at how we can prepare our data to get the most from the technique.
Prepare Data for Logistic Regression
The assumptions made by logistic regression about the distribution and relationships in your data are much the same as the assumptions made in linear regression.
Much study has gone into defining these assumptions and precise probabilistic and statistical language is used. My advice is to use these as guidelines or rules of thumb and experiment with different data preparation schemes.
Ultimately in predictive modeling machine learning projects you are laser focused on making accurate predictions rather than interpreting the results. As such, you can break some assumptions as long as the model is robust and performs well.
- Binary Output Variable: This might be obvious as we have already mentioned it, but logistic regression is intended for binary (two-class) classification problems. It will predict the probability of an instance belonging to the default class, which can be snapped into a 0 or 1 classification.
- Remove Noise: Logistic regression assumes no error in the output variable (y), consider removing outliers and possibly misclassified instances from your training data.
- Gaussian Distribution: Logistic regression is a linear algorithm (with a non-linear transform on output). It does assume a linear relationship between the input variables with the output. Data transforms of your input variables that better expose this linear relationship can result in a more accurate model. For example, you can use log, root, Box-Cox and other univariate transforms to better expose this relationship.
- Remove Correlated Inputs: Like linear regression, the model can overfit if you have multiple highly-correlated inputs. Consider calculating the pairwise correlations between all inputs and removing highly correlated inputs.
- Fail to Converge: It is possible for the expected likelihood estimation process that learns the coefficients to fail to converge. This can happen if there are many highly correlated inputs in your data or the data is very sparse (e.g. lots of zeros in your input data).
Major Problem with the Algorithm
Skewed class distributions significantly impact the performance of logistic regression, particularly in scenarios where class representation is imbalanced. Logistic regression tends to favor the majority class when one class substantially outweighs the other in instances. Consequently, it loses its ability to identify and predict occurrences in the minority class, resulting in reduced accuracy, precision, and recall, especially affecting the minority class of interest. Consider a medical diagnosis scenario where Logistic Regression is applied to predict a rare disease with only a 3% detection rate. Even if the algorithm predicts all patients as normal, it achieves a seemingly high 97% accuracy while failing to fulfill its actual purpose.
Moreover, adversarial attacks disrupt logistic regression’s performance by introducing subtle input data changes. These alterations can lead to erroneous predictions, diminishing model accuracy. Logistic regression’s vulnerability to minor input perturbations makes it susceptible to such attacks, compromising reliability, particularly in security-sensitive applications. Consider the example of spam email classification where you are using a logistic regression algorithm under the hood. Logistic regression, which is like an email filter, is vulnerable to subtle manipulations made by cunning spammers in their messages. These small alterations can confuse the filter, causing it to misclassify spam as legitimate emails and vice versa. As a consequence, the reliability of logistic regression in email filtering is compromised, emphasizing the necessity for advanced defenses and countermeasures against such threats.
Latest Approach to the Algorithm (2023)
Additionally, the paper “A Bayesian approach to predictive uncertainty” (2023) introduced a Bayesian approach to logistic regression, allowing for accurate classification along with quantifiable uncertainty estimates for each prediction. This study applied Bayesian logistic LASSO regression (BLLR) to predict acute care utilization (ACU) risk in cancer patients commencing chemotherapy using real-world electronic health record (EHR) data from over 8,000 patients. Bayesian logistic LASSO regression (BLLR) models outperform standard logistic LASSO regression, delivering superior predictive accuracy, well-calibrated estimations, and more informative uncertainty assessments.
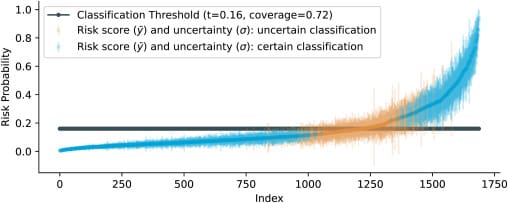
The figure above shows sorted final risk predictions (mean of the predictive distribution, y¯) with uncertainty range (standard deviation, ±σ). The predictions whose uncertainty does not exceed the decision threshold (certain classifications) are coloured blue, and those that do (uncertain classifications) are coloured orange. The dark gray line is the chosen classification threshold by researchers, and is at 0.16, the event rate. The ratio of certain predictions (coverage) with the Bayesian model turned out to be 0.72.
Updates in Well-known Frameworks for Logistic Regression
Notable updates have been observed in specialized libraries, most of which have focused on improved efficiency for the algorithm.
- TensorFlow 2.0: TensorFlow 2.0 and later versions have introduced an eager execution mode, which simplifies logistic regression model development and debugging.
- Scikit-learn: Scikit-learn now offers improved support for handling multi-class problems, making logistic regression more versatile in tackling complex classification tasks.
- Statsmodels: Statsmodels, another popular library, has enhanced its capabilities for statistical analysis and hypothesis testing, which can be invaluable for logistic regression-based inferential modeling.
- InterpretML: Tools like the InterpretML library now empower users to gain deeper insights and interpret the outcomes of logistic regression models, further enhancing their utility and interpretability.
Machine learning frameworks like PyTorch Lightning and TensorFlow Serving offer streamlined solutions for training and deploying logistic regression models, optimizing efficiency and scalability.
Logistic Regression: Versatility in Explainable AI and Low-Resource/Federated Environments
Logistic regression’s adaptability extends to the burgeoning field of Explainable AI (XAI), where interpretable models are essential for understanding and justifying AI-driven decisions. Logistic regression’s simplicity and clear parameter interpretations make it a valuable tool for creating transparent and interpretable models. Its ability to provide intuitive insights into feature importance and model output is highly advantageous in applications where transparency and trustworthiness are paramount, such as healthcare, finance, and legal domains.
Furthermore, logistic regression plays a vital role in low-resource and federated settings. In scenarios where data is limited or distributed across multiple sources, logistic regression’s lightweight computational requirements and efficient training make it an ideal choice. Its ability to offer reliable predictions while maintaining data privacy and preserving resource efficiency has positioned logistic regression as a foundational technique in addressing challenges in low-resource and federated learning environments.
Further Reading
There is a lot of material available on logistic regression. It is a favorite in may disciplines such as life sciences and economics.
Logistic Regression Resources
Checkout some of the books below for more details on the logistic regression algorithm.
- Generalized Linear Models
- Logistic Regression: A Primer
- Applied Logistic Regression
- Logistic Regression: A Self-Learning Text [PDF].
Logistic Regression in Machine Learning
For a machine learning focus (e.g. on making accurate predictions only), take a look at the coverage of logistic regression in some of the popular machine learning texts below:
- Artificial Intelligence: A Modern Approach, pages 725-727
- Machine Learning for Hackers, pages 178-182
- An Introduction to Statistical Learning: with Applications in R, pages 130-137
- The Elements of Statistical Learning: Data Mining, Inference, and Prediction, pages 119-128
- Applied Predictive Modeling, pages 282-287
If I were to pick one, I’d point to An Introduction to Statistical Learning. It’s an excellent book all round.
Summary
In this post you discovered the logistic regression algorithm for machine learning and predictive modeling. You covered a lot of ground and learned:
- What the logistic function is and how it is used in logistic regression.
- That the key representation in logistic regression are the coefficients, just like linear regression.
- That the coefficients in logistic regression are estimated using a process called maximum-likelihood estimation.
- Making predictions using logistic regression is so easy that you can do it in excel.
- That the data preparation for logistic regression is much like linear regression.
- Problem faced by the algorithm and latest solution
- Recent updates in machine learning and deep learning frameworks
- Logistic regression and XAI
- Logistic regression and federated learning
Do you have any questions about logistic regression or about this post?
Leave a comment and ask, I will do my best to answer.
Discover How Machine Learning Algorithms Work!
See How Algorithms Work in Minutes
...with just arithmetic and simple examples
Discover how in my new Ebook:
Master Machine Learning Algorithms
It covers explanations and examples of 10 top algorithms, like:
Linear Regression, k-Nearest Neighbors, Support Vector Machines and much more...
Finally, Pull Back the Curtain on
Machine Learning Algorithms
Skip the Academics. Just Results.


How to assign weights in logistic regression?
They are learned Ahmaf.
See this post:
https://machinelearningmastery.com/logistic-regression-tutorial-for-machine-learning/
Can you elaborate Logistic regression, how to learn b0 and b1 values from training data
Hi Shabir,
I provide a tutorial with arithmetic here:
https://machinelearningmastery.com/logistic-regression-tutorial-for-machine-learning/
I also provide a tutorial in Python here:
https://machinelearningmastery.com/implement-logistic-regression-stochastic-gradient-descent-scratch-python/
I hope that helps.
https://desireai.com/intro-to-machine-learning/
you can get more relevant data from it
how is e^(b0 + b1*X) / (1 + e^(b0 + b1*X)) a logistic function
Isn’t the hypothesis function in logistic regression g(transpose(theta)x) where g = 1/1+e^-x
Yes, you can rewrite the equation as:
To see how logistic regression works in practice, see this tutorial:
https://machinelearningmastery.com/logistic-regression-tutorial-for-machine-learning/
Hi Jason, Thanks for such an informative post.
I have a question which i am struggling with for some time now. Can you please help me with it.
Let’s say i want to do customer attrition prediction. Now customer attrition can happen anytime during an year. There are 2 ways i can think of setting up the problem.
1. Fix a reference data e.g. 1 Nov’16. Dependent variable (in observation period) calculated by considering customers who churned in next 3 months (Nov/Dec/Jan). Independent variables duration can be fixed between Nov’15-Oct’16 (1 yr) & variables such transaction in last 6 months can be created. (I think this is a better approach. Also makes more sense if i want to score the model and build campaigns)
2. Consider year 2016. For customers who churned in July’16 (observation period) consider Jan-June’16 as the duration for creating independent variables, for customer churned in Aug’16 consider Feb-July’16 for independent variable creation along with an indicator whether the customer had churned in last month or not (auto regression blind of case). Append this data row-wise, take a random sample from it for training and rest for testing. (here i feel dependent variables will have seasonality as variable created would have considered different months)
Can you please let me which of these is right (or if anyone is correct). This is will be helpful as i have not been able to figure this out.
Regards,
Rishabh
There are many ways to frame a predictive modeling problem.
I would suggest framing your problem as many ways as you can think of, train and evaluate models on each, then double down on the most promising one.
This post might help:
https://machinelearningmastery.com/how-to-define-your-machine-learning-problem/
Hello,
I am wondering on something. I see the idea of preparing the data on a lot of website, but not a lot of resource does explain how to clean data, I know it may seem so basic to you but considering there are some undergraduates or non-CSE people here to read this, can you give direction to us on those subjects?
Data cleaning is a hard topic to teach as it is so specific to the problem.
Generally, this post might help with general data preparation processes:
https://machinelearningmastery.com/how-to-prepare-data-for-machine-learning/
This post might help with feature engineering:
https://machinelearningmastery.com/discover-feature-engineering-how-to-engineer-features-and-how-to-get-good-at-it/
HI jason sir …i am working on hot weather effects human health ..like (skin diseases) ..i have two data sets i.e weather and patient data of skin diseases ,,after regressive study i found that ,as my data sets are small i plan to work Logistic regression algorithm with R..can u help to solve this i will b more graceful to u ..
This process will help you work through your predictive modeling problem systematically:
https://machinelearningmastery.com/start-here/#process
Hello! While studying for ML, I was just wondering how I can state differences between a normal logistic regression model and a deep learning logistic regression model which has two hidden layers. Let’s say five variables for x.
They are indeed very different. What do you mean “state the difference”? Apples and oranges?
Thank you for fast response. I was actually wondering formula for each. I know the normal logistic regression goes by, “ln(Y) = a + b1X1 + … +bnXn”. However, I was wondering a formula of a deep learning logistic regression model with two hidden layer (10 nodes each). I just want to know How I can express it as short version of formula.
Hi Dan, I would encourage you to switch to neural net terminology/topology when trying to describe hierarchical models. It is no longer a simple linear question.
Thanks again for your comment. How about a formula for a deeplearning model which has two hidden layers (10 nodes each) and five X variable and Y (the target value is binary). I know the difference between two models I mentioned earlier. I just want to express a deeplearning model in a mathematical way.
Normally the equations are described for a forward pass or back pass for a single node, not the whole network.
Thank you for fast response. I was actually wondering formula for each. I know the normal logistic regression goes by, “ln(Y) = a + b1X1 + … +bnXn”. However, I was wondering a formula of a deep learning logistic regression model with two hidden layer (10 nodes each). I just want to know How I can express it as short version of formula.
Hi. Please let me know how we can proceed if the distribution of the data is skewed- right skew.
Thank you.
Consider a power transform like a box-cox transform.
Hello sir, can you please explain why p=exp(b0+b1*x)/(exp(b0+b1*x)+1) is probability
Hi Jobayer,
I would recommend reading a textbook on the topic, such as “An Introduction to Statistical Learning” or “Elements of Statistical Learning”.
Hello Mr. Brownlee,
thank you for a very informative this very informative piece..
i am currently working on a paper in object detection algorithm…just wondering, how could i use logistics regression in my paper exactly?
I would not recommend it, consider a convolutional neural network:
https://machinelearningmastery.com/object-recognition-convolutional-neural-networks-keras-deep-learning-library/
A short video tutorial on Logistic Regression for beginners:
https://quickkt.com/tutorials/artificial-intelligence/machine-learning/logistic-regression-theory/
Thanks for sharing. Did it help?
In a binary classification problem, is there a good way to optimize the program to solve only for 1 (as opposed to optimizing for best predicting 1 and 0) – what I would like to do is predict as close as accurately as possible when 1 will be the case. (I do not care at all about 0 and if I miss a 1, that’s ok, but when it predicts a 1, I want it to be really confident – so I am trying to see if there is a good way to only solve for 1 (as opposed to 1 and 0)? Thanks.
Yes, in the literature we call this anomaly detection.
This post is best! Crisp yet clear!
Thank you, Sir!
THanks, I’m glad it helped.
Wonderful post. I have been trying to read up a book and it just kept getting convoluted despite having done a project using LR. Thanks for the sheer simplicity with which you have covered this.
I’m glad it helped.
Nice post..easy to understand..Thanks!
Thanks.
Thank you for your article!!!!!!!! A LOT OF HELP!!!
You’re welcome, I’m glad to hear that.
Hi Jason,
Thanks so much for the article and blog in general. It’s all been tremendously helpful as I’ve been diving into machine learning.
My question is on topic, but in a little different direction…
I’ve got a trained and tested logistic regression. I trust it as a predictor, but now I’ve got a set of people that I need to apply it to. Let’s say this is a group of ten people, and for each of them, I’ve run a logistic regression that outputs a probability that they will buy a pack of gum. So now I have ten probability outputs [0.83, 0.71, 0.63, 0.23, 0.25, 0.41, 0.53, 0.95, 0.12, 0.66]. (From this point on, I’m a little less sure about each successive sentence). I can sum them together and see that my most likely outcome is that I’ll sell 5.32 packs of gum. But I also want to know what the probability is that I sell 6 packs of gum or 5, or 4, or 9. I’d like to plot some sort of probability distribution for the number of packs of gum that I expect to sell to this whole group of people. I’ve got an error measure, so I can calculate a standard deviation and plot some sort of normal distribution, with 5.32 at the center, to show the probability of different outcomes, right?
I think all of that makes sense, but then it gets a little more complicated. I have some other people, with different features and a different classifier. I’m testing the same outcome (that they’ll buy a pack of gum), but these are people who are maybe already at the counter in my shop. I’ve got five of them and their probabilities are [0.93, 0.85, 0.75, 0.65, 0.97]. So, I’d expect the most likely outcome is that I would sell 4.15 packs of gum to this group of five. Great, but now I’ve got two different classifiers, with two different groups of people and two different error measures. I assume the most likely outcome is that I sell 9.47 packs of gum in total (5.32 from the first group, 4.15 from the second group). But how can I go about determining the likelihood that I sell 10 packs in total between the two groups? 12? 5? How can I come up with a normal distribution when I’ve got two different classifiers working on two different groups of people?
That is a massive comment. It sounds to me from a quick scan of your comment that you’re interested in a prediction interval:
https://en.wikipedia.org/wiki/Prediction_interval
Is that correct?
Hey Jason, your tutorials are amazing for beginners like me, thank you for explaining it systematically and in an easy manner.
Thanks, I’m glad they help.
Can you please tell me what the processing speed of logistic regression is? How does it compare to other predictive modeling types (like random forests or One-R)?
Thank you!
Perhaps you can write code to compare the execution time?
Hi Jason,
I have a question regarding the example you took here, where prediction of sex is made based on height.
With the logit function it is concluded that the p(male | height = 150cm) is close to 0. Using this information, what can I say about the p(female| height = 150cm) when I know that the output is classified as male or female?
Amazing detailed and still clear content, as usually 😉
Thanks.
Thank you so much it cleared many of my doubts
I’m happy to hear that.
Thank you for your article and the others! they are very helpfull for beginners like me
Thanks, I’m happy to hear that.
Thank you it is helpful for me
I’m happy to hear that it helped.
Jason, you are great! You can always explain very complex methodology in a layman way!
Thank you!
Thanks. I’m glad it helped.
Thank you for the informative post. I have a questions on determining the value of input variables that optimize the response of a logistic regression (probability of a primary event).
Assume the independent variables refers to treatment options, dependent variables refer to not-being-readmitted-to-hospital. The objective is to determine the most effective treatment options, more likely a combination of treatment options that maximize the probability of not-being-readmitted.
How would you suggest me to determine which options or combinations are the most effective?
Should I follow: 1) build a logistic regression model 2) with the coefficients figured out, assume maximizing prob, and then determine the value of independent variables? What’s a better way to find input values that optimize response variable?
Thank you.
Good question, perhaps treat it as an optimization problem with the fit model to seek the values that maximize the output.
Pls how did u get b0 as -100 and b1 as 0.6
I set it arbitrarily.
You can find coefficients for logistic regression using an optimization process, such as quadratic optimization or even gradient descent:
https://machinelearningmastery.com/implement-logistic-regression-stochastic-gradient-descent-scratch-python/
Hi Jason,
thank you vey much for sharing your knowledge in such an understandable way! This helps me a lot. However, I still struggle with a (maybe quite specific?) problem.
In the case I’m studying, the Probability of success is expected not to reach 100%. In fact, realistic probabilities range between 0 – a%. While a is unknown.
I believe in my case, I will need something like P(X) = a / (1 + e^(b + c*(X))
Applying the logit and ML approach to this however causes problems..
Do you maybe know how to solve this? What would be a good approach?
Or maybe logistic regression is not the best option to tackle this problem? Would another approach like Naive Bayes be a better alternative?
Thanks a lot in advance!
Regards, Maarten
Great question!
I would encourage you to re-post this question on math overflow, and get an answer from a real math person, I expect there is a way to constrain the model correctly for what you need and I don’t want to make something up and mislead you.
Hi Jason,
thanks for your helpful informations. those helped me a lot.
I am struggling with one question that I can’t quite understand yet. I saw some specialists and teachers say that the logistic regression makes no assumption about the distribution of the independent variables and they do not have to be normally distributed, linearly related or of equal variance within each group. how does it fit with your explanation of logestic regression? I hope you can help me understand that. thanks
here is a link that mentioned it:
http://userwww.sfsu.edu/efc/classes/biol710/logistic/logisticreg.htm
That does not match my understanding, perhaps talk to the owner/author of the material?
I asked them and am waiting for their respond
but meanwhile, here is another link
https://www.quora.com/Does-logistic-regression-require-independent-variables-to-be-normal-distributed
someone asked this question and some specialists answered that logistic regression doesn’t assum that your independent variable is normally distributed
Interesting, thanks.
this is what I found out from their answers: logistic or linear regression algorithms do assum that there is a linear relationship between your indepndent and dependent variables but they have no assumption about independent variables having any particular distribution. just if I transform my continuous indepent variables distribution to a normal distribution form it exposes this linear relationship a lot better.
what do you think? is it right?
Doesn’t match my understanding – at least as far as linear regression. There is no distribution when it comes to logistic regression, the target is binary.
Hi Jason, should the page number of the referenced book “The Elements of Statistical Learning: Data Mining, Inference, and Prediction” be 119-128?
Yes, thanks. Fixed.
Hi Jason,
Thank you for this detailed explanation/tutorial on Logistic Regression.
I have few queries related to Logistic Regression which I am not able to find answers over the internet or in books. It would be of great help if you could help me understand these uncleared questions.
1. Has Logit function (i.e. Logit equation LN(P/1-P)) being derived from Logistic Regression equation or its the other way around?
2. What is the purpose of Logit equation in logistic regression equation? How logit function is used in Logistic regression algorithm? Reason for asking this question will get clear after going through point no. 3 & 4.
3. Upon building a logistic regression model, we get model coefficients. When we substitute these model coefficients and respective predictor values into the
logistic regression equation, we get probability value of being default class (same as the values returned by predict()). Does this mean that estimated model coefficient values are determined based on the probability values (computed using logistic regression equation not logit equation) which will be inputed to the likelihood function to determine if it maximizes it or not? If this understanding is correct then, where the logit function is used in the entire process of model building.
4. Neither logit function is used during model building not during predicting the values. If this is the case then why do we give importance to logit function which is used to map probability values to real number values (ranging between -Inf to +Inf). Where exactly the logit function is used in the entire logistic regression model buidling process? Is it while estimating the model coefficients?
5. The model coefficient estimates that we see upon running summary(lr_model) are determined using linear form of logistic regression equation (logit equation) or the actual logistic regression equation?
Sorry, I don’t go into the derivation of the equations on this blog.
Perhaps try posting your questions on mathoverlow?
Log odds is the logit and not probit right ?
Log odds is the logit.
Hi everyone,
I have a question that I splitted my data as 80% train and 20% test. And I applied Gradient Boosting however, test score result is 1.0 . It comes to me a little bit strange. How could I infere this result?
Thank you.
Perhaps the problem is too simple/trivial?
If so, should I rely on the result, although it is very simple?I mean, Should I trust the results if I believe that I have correctly identified the problem, even though I received the test result too high?
If not, what is the way to get the problem out of too simple state? Increased number of columns and observations? Or something else?
Thank you dude.
Your goal is to design a test harness that allows the results to be trusted.
This means ensuring the training dataset is reliable, and using a technique such as k-fold cross validation:
https://machinelearningmastery.com/k-fold-cross-validation/
Hi Jason,
I have tried k-fold and the test accuracy still is around %98. So, can I now trust the results and use this model ?
(btw;
# of observation : 3000,
# of feature : 1131 ,
n component used in PCA = 20
)
Logistic regression’s result according to above info is train accuracy=%99 , test accuracy=%98.3
Thank you.
I believe so.
Updated** :
(btw;
# of observation : 3000,
# of feature : 1131 ,
cross validation* : 20
)
Have another question: My target column (y) type is object and it includes values as “A”, “B” and “C”. Should I convert it from object to Categorical as below;
y = pd.Categorical(y)
Or I should leave it as object.
Thank you.
It is a good idea to one hot encode categorical variables prior to modeling. More here:
https://machinelearningmastery.com/why-one-hot-encode-data-in-machine-learning/
Thank you
Hi Jason,
Thanks for the post! I was trying to solve binary image classification (e.g. horse or dog). As the image size (100 x 100) is large, can I use PCA first to reduce dimension or LG can handle that? What about co-linearity or highly correlated features? Which way would you recommend?
Thanks for the reply.
Perhaps try a range of models on the raw pixel data.
You will find nothing will beat a CNN model in general at this stage.
Hi
I am trying to apply quantization of fashion_mnist.
but i dont know the proper way how to quantize that model.
can you please help me on that?
Why do you want to apply quantization?
some theta and matrix parameters are there and that are FP32 and that i have to reduced to FP8
I don’t follow at all. What is FP32 and FP8?
floating point 32 & 8
below is the link for that example
https://nbviewer.jupyter.org/github/trekhleb/homemade-machine-learning/blob/master/notebooks/logistic_regression/multivariate_logistic_regression_fashion_demo.ipynb
In my case have a classification problem, is it right to say Logistic Regression is a Linear Model?
Yes.
Thanks
You’re welcome.
Hello, You’ve mentioned ‘Logistic regression models the probability of the default class (e.g. the first class).’ I couldn’t make out what Default / First class meant or how this gets defined. Please could you help me understand?
Yes, it comes back to a binomial probability distribution:
https://machinelearningmastery.com/discrete-probability-distributions-for-machine-learning/
I guess I submitted a little too fast! In my previous comment, I meant if there are two classes, how to determine which is considered the default or the first class
See the Bernoulli/Binomial here:
https://machinelearningmastery.com/discrete-probability-distributions-for-machine-learning/
Can u please provide any derivation to this, i cannot find it anywhere.?
ln(p(X) / 1 – p(X)) = b0 + b1 * X
Yes, see the “further reading” section of the tutorial.
I have started a course in udemy as Machine Learning using AzureML ,the instructor has explained about Logistic Regression but I was Unable to catch it.I wanted to explore more it then i visited the Wikipedia but I was getting there more new Words like ‘odd’ etc and I again was not able to read it further …
Then I came to this page …I really appriciate Your efforts to making such a easy way of understanding the MachineLearning Concept …It has made me more enthuasiastic about the Course …
Thank u very Much..
Thanks, hang in there!
Hello Jason, thanks for writing this informative post.
I have a question regarding the “default class” taken in binary classification by Logistic Regression. How actually does a Logistic Regression decide which Class to be taken as the reference for computing the odds?
Here in this post you mentioned somewhere in the start that the default class can be the “first class”, does that mean the first class that appears on row #1 of training dataset ??
There is one more post of yours, here: https://machinelearningmastery.com/logistic-regression-tutorial-for-machine-learning/
where it is mentioned that the default class is Class 0 !!!
So, essentially which class is taken default or as a baseline by Log.Regression model ? Could you please help me understand ?
Class 1 (class=1) is the default class, e.g. we are predicting the probability that an input belongs to class 1.
Hi Jason Brownlee thanks for sharing about logistic regression. It’s very useful for me.
Your tutorials have been awesome. On this topic, I have tried to implement SDG using L2 regularization without sklearn and my code keeps throwing errors of index to scalar variable? I there a way you can help if I can send you the snippet? Thanks
Perhaps try posting your code and error to stackoverflow.com
Very usefull article, thanks for sharing
Thanks!
this is very useful
Thanks!
Very usefull article, thanks for sharing
Thanks.
Thank you
You’re welcome!
You’re welcome!
Very usefull article, thanks for sharing
Thanks!
Excellent Topic , for Logistic Regression. Thank you so much.
You’re welcome.
Nice concepts it will be helpful or us.
Thanks.
Hi Jason,
Would like to know why high correlation in data leads to logistic regression fails to converge?
Thanks.
In general, if the input data are highly correlated, you run into the problem of collinearity. That will make the optimization result unstable.
Hi Jason,
also another question regarding why ‘highly correlated features lead to model overfit’? From my reading here : https://stats.stackexchange.com/questions/250376/feature-correlation-and-their-effect-of-logistic-regression
it seems correlated features would only bring WORSE LR performance. Please advise. Thanks.
Thanks for session ,very informative
Nice concepts it will be helpful or us.
Thanks. Glad you liked it.
Thanks for session ,very informative
Very useful article thanks for sharing
Hi Jason,
Excellent article on Logistic Regression.
I have a question : in the initial steps it is mentioned that :
p(X) = e^(b0 + b1*X) / (1 + e^(b0 + b1*X)) [ this I understood clearly]. But what I didn’t understand is :
taking the ln( natural logarithm on both sides) :
the simplified step is given as :
ln(p(X) / 1 – p(X)) = b0 + b1 * X
This I am not able to arrive at after looking at the simplification. Could you please explain how this equation is arrived at after simplification?
Krish
Hi Krishnamohan…The following resource should add clarity:
https://www.dummies.com/article/academics-the-arts/math/pre-calculus/how-to-solve-an-exponential-equation-by-taking-the-log-of-both-sides-167857/
Hi,
Can I ask how you are getting result for the fictitious height example in subheading section: Making Predictions with Logistic Regression and only that section.
I have read full article and if I manually follow calculations and plug them into a spreadsheet, they work fine, but when I try to do it for this example only, I cannot get the same output for y.
Example in text shows the following:
y = e^(b0 + b1*X) / (1 + e^(b0 + b1*X))
y = exp(-100 + 0.6*150) / (1 + EXP(-100 + 0.6*150))
y = 0.0000453978687
I am using EXP function in Excel to follow along for that example as per suggestion, but I don’t get y=0.0000453978687. For other examples and some other stats textbook examples I tested, they plug in fine as does everything else from this article, just that one example is not matching my output and I would like to understand why in case I’m just making some basic error.
Can I check what you or if anybody else gets that value – 0.0000453978687 – when plugging that fictitious example into Excel or just manually doing out the calculation? exp(-100 + 0.6*150) / (1 + EXP(-100 + 0.6*150))
Great article by the way.
Thanks in advance for your time,
Niall
Thank you for the feedback! We will review the subsection and related calculations. Hopefully others will weigh in on their results.
I loved the explanation! However, I think the following is confusing:
“we are modeling the probability that an input (X) belongs to the default class (Y=1), and we can write this formally as: P(X) = P(Y=1|X)”
The notation P(X) = P(Y=1|X) would imply that the probability of the occurrence of some feature X is equal to the probability class Y=1 given the occurrence of feature X. But this cannot be true. Maybe I am missing something simple.
Would love to know what you meant by P(X) = P(Y=1|X)
Hi Yuriy…Thank you for your feedback!