Logistic regression does not support imbalanced classification directly.
Instead, the training algorithm used to fit the logistic regression model must be modified to take the skewed distribution into account. This can be achieved by specifying a class weighting configuration that is used to influence the amount that logistic regression coefficients are updated during training.
The weighting can penalize the model less for errors made on examples from the majority class and penalize the model more for errors made on examples from the minority class. The result is a version of logistic regression that performs better on imbalanced classification tasks, generally referred to as cost-sensitive or weighted logistic regression.
In this tutorial, you will discover cost-sensitive logistic regression for imbalanced classification.
After completing this tutorial, you will know:
- How standard logistic regression does not support imbalanced classification.
- How logistic regression can be modified to weight model error by class weight when fitting the coefficients.
- How to configure class weight for logistic regression and how to grid search different class weight configurations.
Kick-start your project with my new book Imbalanced Classification with Python, including step-by-step tutorials and the Python source code files for all examples.
Let’s get started.
- Update Feb/2020: Fixed typo in weight calculation.
- Update Oct/2020: Fixed typo in description of balance ratio.

Cost-Sensitive Logistic Regression for Imbalanced Classification
Photo by Naval S, some rights reserved.
Tutorial Overview
This tutorial is divided into five parts; they are:
- Imbalanced Classification Dataset
- Logistic Regression for Imbalanced Classification
- Weighted Logistic Regression With Scikit-Learn
- Grid Search Weighted Logistic Regression
Imbalanced Classification Dataset
Before we dive into the modification of logistic regression for imbalanced classification, let’s first define an imbalanced classification dataset.
We can use the make_classification() function to define a synthetic imbalanced two-class classification dataset. We will generate 10,000 examples with an approximate 1:100 minority to majority class ratio.
|
1 2 3 4 |
... # define dataset X, y = make_classification(n_samples=10000, n_features=2, n_redundant=0, n_clusters_per_class=1, weights=[0.99], flip_y=0, random_state=2) |
Once generated, we can summarize the class distribution to confirm that the dataset was created as we expected.
|
1 2 3 4 |
... # summarize class distribution counter = Counter(y) print(counter) |
Finally, we can create a scatter plot of the examples and color them by class label to help understand the challenge of classifying examples from this dataset.
|
1 2 3 4 5 6 7 |
... # scatter plot of examples by class label for label, _ in counter.items(): row_ix = where(y == label)[0] pyplot.scatter(X[row_ix, 0], X[row_ix, 1], label=str(label)) pyplot.legend() pyplot.show() |
Tying this together, the complete example of generating the synthetic dataset and plotting the examples is listed below.
|
1 2 3 4 5 6 7 8 9 10 11 12 13 14 15 16 17 |
# Generate and plot a synthetic imbalanced classification dataset from collections import Counter from sklearn.datasets import make_classification from matplotlib import pyplot from numpy import where # define dataset X, y = make_classification(n_samples=10000, n_features=2, n_redundant=0, n_clusters_per_class=1, weights=[0.99], flip_y=0, random_state=2) # summarize class distribution counter = Counter(y) print(counter) # scatter plot of examples by class label for label, _ in counter.items(): row_ix = where(y == label)[0] pyplot.scatter(X[row_ix, 0], X[row_ix, 1], label=str(label)) pyplot.legend() pyplot.show() |
Running the example first creates the dataset and summarizes the class distribution.
We can see that the dataset has an approximate 1:100 class distribution with a little less than 10,000 examples in the majority class and 100 in the minority class.
|
1 |
Counter({0: 9900, 1: 100}) |
Next, a scatter plot of the dataset is created showing the large mass of examples for the majority class (blue) and a small number of examples for the minority class (orange), with some modest class overlap.
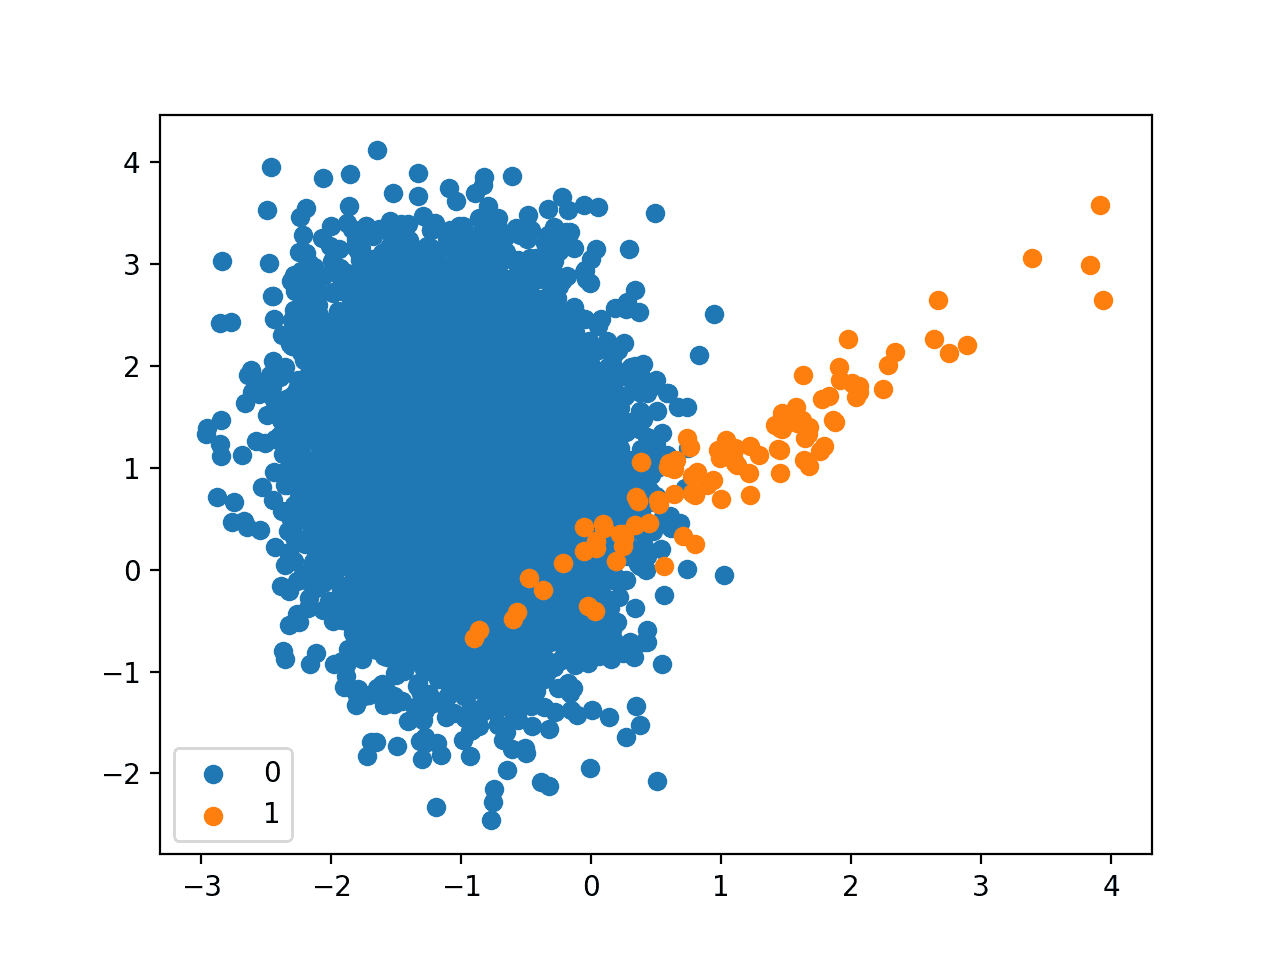
Scatter Plot of Binary Classification Dataset With 1 to 100 Class Imbalance
Next, we can fit a standard logistic regression model on the dataset.
We will use repeated cross-validation to evaluate the model, with three repeats of 10-fold cross-validation. The mode performance will be reported using the mean ROC area under curve (ROC AUC) averaged over repeats and all folds.
|
1 2 3 4 5 6 7 |
... # define evaluation procedure cv = RepeatedStratifiedKFold(n_splits=10, n_repeats=3, random_state=1) # evaluate model scores = cross_val_score(model, X, y, scoring='roc_auc', cv=cv, n_jobs=-1) # summarize performance print('Mean ROC AUC: %.3f' % mean(scores)) |
Tying this together, the complete example of evaluated standard logistic regression on the imbalanced classification problem is listed below.
|
1 2 3 4 5 6 7 8 9 10 11 12 13 14 15 16 17 |
# fit a logistic regression model on an imbalanced classification dataset from numpy import mean from sklearn.datasets import make_classification from sklearn.model_selection import cross_val_score from sklearn.model_selection import RepeatedStratifiedKFold from sklearn.linear_model import LogisticRegression # generate dataset X, y = make_classification(n_samples=10000, n_features=2, n_redundant=0, n_clusters_per_class=1, weights=[0.99], flip_y=0, random_state=2) # define model model = LogisticRegression(solver='lbfgs') # define evaluation procedure cv = RepeatedStratifiedKFold(n_splits=10, n_repeats=3, random_state=1) # evaluate model scores = cross_val_score(model, X, y, scoring='roc_auc', cv=cv, n_jobs=-1) # summarize performance print('Mean ROC AUC: %.3f' % mean(scores)) |
Running the example evaluates the standard logistic regression model on the imbalanced dataset and reports the mean ROC AUC.
Note: Your results may vary given the stochastic nature of the algorithm or evaluation procedure, or differences in numerical precision. Consider running the example a few times and compare the average outcome.
We can see that the model has skill, achieving a ROC AUC above 0.5, in this case achieving a mean score of 0.985.
|
1 |
Mean ROC AUC: 0.985 |
This provides a baseline for comparison for any modifications performed to the standard logistic regression algorithm.
Want to Get Started With Imbalance Classification?
Take my free 7-day email crash course now (with sample code).
Click to sign-up and also get a free PDF Ebook version of the course.
Logistic Regression for Imbalanced Classification
Logistic regression is an effective model for binary classification tasks, although by default, it is not effective at imbalanced classification.
Logistic regression can be modified to be better suited for logistic regression.
The coefficients of the logistic regression algorithm are fit using an optimization algorithm that minimizes the negative log likelihood (loss) for the model on the training dataset.
- minimize sum i to n -(log(yhat_i) * y_i + log(1 – yhat_i) * (1 – y_i))
This involves the repeated use of the model to make predictions followed by an adaptation of the coefficients in a direction that reduces the loss of the model.
The calculation of the loss for a given set of coefficients can be modified to take the class balance into account.
By default, the errors for each class may be considered to have the same weighting, say 1.0. These weightings can be adjusted based on the importance of each class.
- minimize sum i to n -(w0 * log(yhat_i) * y_i + w1 * log(1 – yhat_i) * (1 – y_i))
The weighting is applied to the loss so that smaller weight values result in a smaller error value, and in turn, less update to the model coefficients. A larger weight value results in a larger error calculation, and in turn, more update to the model coefficients.
- Small Weight: Less importance, less update to the model coefficients.
- Large Weight: More importance, more update to the model coefficients.
As such, the modified version of logistic regression is referred to as Weighted Logistic Regression, Class-Weighted Logistic Regression or Cost-Sensitive Logistic Regression.
The weightings are sometimes referred to as importance weightings.
Although straightforward to implement, the challenge of weighted logistic regression is the choice of the weighting to use for each class.
Weighted Logistic Regression with Scikit-Learn
The scikit-learn Python machine learning library provides an implementation of logistic regression that supports class weighting.
The LogisticRegression class provides the class_weight argument that can be specified as a model hyperparameter. The class_weight is a dictionary that defines each class label (e.g. 0 and 1) and the weighting to apply in the calculation of the negative log likelihood when fitting the model.
For example, a 1 to 1 weighting for each class 0 and 1 can be defined as follows:
|
1 2 3 4 |
... # define model weights = {0:1.0, 1:1.0} model = LogisticRegression(solver='lbfgs', class_weight=weights) |
The class weighing can be defined multiple ways; for example:
- Domain expertise, determined by talking to subject matter experts.
- Tuning, determined by a hyperparameter search such as a grid search.
- Heuristic, specified using a general best practice.
A best practice for using the class weighting is to use the inverse of the class distribution present in the training dataset.
For example, the class distribution of the training dataset is a 1:100 ratio for the minority class to the majority class. The inversion of this ratio could be used with 1 for the majority class and 100 for the minority class; for example:
|
1 2 3 4 |
... # define model weights = {0:1.0, 1:100.0} model = LogisticRegression(solver='lbfgs', class_weight=weights) |
We might also define the same ratio using fractions and achieve the same result; for example:
|
1 2 3 4 |
... # define model weights = {0:0.01, 1:1.0} model = LogisticRegression(solver='lbfgs', class_weight=weights) |
We can evaluate the logistic regression algorithm with a class weighting using the same evaluation procedure defined in the previous section.
We would expect that the class-weighted version of logistic regression to perform better than the standard version of logistic regression without any class weighting.
The complete example is listed below.
|
1 2 3 4 5 6 7 8 9 10 11 12 13 14 15 16 17 18 |
# weighted logistic regression model on an imbalanced classification dataset from numpy import mean from sklearn.datasets import make_classification from sklearn.model_selection import cross_val_score from sklearn.model_selection import RepeatedStratifiedKFold from sklearn.linear_model import LogisticRegression # generate dataset X, y = make_classification(n_samples=10000, n_features=2, n_redundant=0, n_clusters_per_class=1, weights=[0.99], flip_y=0, random_state=2) # define model weights = {0:0.01, 1:1.0} model = LogisticRegression(solver='lbfgs', class_weight=weights) # define evaluation procedure cv = RepeatedStratifiedKFold(n_splits=10, n_repeats=3, random_state=1) # evaluate model scores = cross_val_score(model, X, y, scoring='roc_auc', cv=cv, n_jobs=-1) # summarize performance print('Mean ROC AUC: %.3f' % mean(scores)) |
Running the example prepares the synthetic imbalanced classification dataset, then evaluates the class-weighted version of logistic regression using repeated cross-validation.
Note: Your results may vary given the stochastic nature of the algorithm or evaluation procedure, or differences in numerical precision. Consider running the example a few times and compare the average outcome.
The mean ROC AUC score is reported, in this case showing a better score than the unweighted version of logistic regression, 0.989 as compared to 0.985.
|
1 |
Mean ROC AUC: 0.989 |
The scikit-learn library provides an implementation of the best practice heuristic for the class weighting.
It is implemented via the compute_class_weight() function and is calculated as:
- n_samples / (n_classes * n_samples_with_class)
We can test this calculation manually on our dataset. For example, we have 10,000 examples in the dataset, 9900 in class 0, and 100 in class 1.
The weighting for class 0 is calculated as:
- weighting = n_samples / (n_classes * n_samples_with_class)
- weighting = 10000 / (2 * 9900)
- weighting = 10000 / 19800
- weighting = 0.05
The weighting for class 1 is calculated as:
- weighting = n_samples / (n_classes * n_samples_with_class)
- weighting = 10000 / (2 * 100)
- weighting = 10000 / 200
- weighting = 50
We can confirm these calculations by calling the compute_class_weight() function and specifying the class_weight as “balanced.” For example:
|
1 2 3 4 5 6 7 8 9 |
# calculate heuristic class weighting from sklearn.utils.class_weight import compute_class_weight from sklearn.datasets import make_classification # generate 2 class dataset X, y = make_classification(n_samples=10000, n_features=2, n_redundant=0, n_clusters_per_class=1, weights=[0.99], flip_y=0, random_state=2) # calculate class weighting weighting = compute_class_weight('balanced', [0,1], y) print(weighting) |
Running the example, we can see that we can achieve a weighting of about 0.5 for class 0 and a weighting of 50 for class 1.
These values match our manual calculation.
|
1 |
[ 0.50505051 50. ] |
The values also match our heuristic calculation above for inverting the ratio of the class distribution in the training dataset; for example:
- 0.5:50 == 1:100
We can use the default class balance directly with the LogisticRegression class by setting the class_weight argument to ‘balanced.’ For example:
|
1 2 3 |
... # define model model = LogisticRegression(solver='lbfgs', class_weight='balanced') |
The complete example is listed below.
|
1 2 3 4 5 6 7 8 9 10 11 12 13 14 15 16 17 |
# weighted logistic regression for class imbalance with heuristic weights from numpy import mean from sklearn.datasets import make_classification from sklearn.model_selection import cross_val_score from sklearn.model_selection import RepeatedStratifiedKFold from sklearn.linear_model import LogisticRegression # generate dataset X, y = make_classification(n_samples=10000, n_features=2, n_redundant=0, n_clusters_per_class=1, weights=[0.99], flip_y=0, random_state=2) # define model model = LogisticRegression(solver='lbfgs', class_weight='balanced') # define evaluation procedure cv = RepeatedStratifiedKFold(n_splits=10, n_repeats=3, random_state=1) # evaluate model scores = cross_val_score(model, X, y, scoring='roc_auc', cv=cv, n_jobs=-1) # summarize performance print('Mean ROC AUC: %.3f' % mean(scores)) |
Note: Your results may vary given the stochastic nature of the algorithm or evaluation procedure, or differences in numerical precision. Consider running the example a few times and compare the average outcome.
Running the example gives the same mean ROC AUC as we achieved by specifying the inverse class ratio manually.
|
1 |
Mean ROC AUC: 0.989 |
Grid Search Weighted Logistic Regression
Using a class weighting that is the inverse ratio of the training data is just a heuristic.
It is possible that better performance can be achieved with a different class weighting, and this too will depend on the choice of performance metric used to evaluate the model.
In this section, we will grid search a range of different class weightings for weighted logistic regression and discover which results in the best ROC AUC score.
We will try the following weightings for class 0 and 1:
- {0:100,1:1}
- {0:10,1:1}
- {0:1,1:1}
- {0:1,1:10}
- {0:1,1:100}
These can be defined as grid search parameters for the GridSearchCV class as follows:
|
1 2 3 4 |
... # define grid balance = [{0:100,1:1}, {0:10,1:1}, {0:1,1:1}, {0:1,1:10}, {0:1,1:100}] param_grid = dict(class_weight=balance) |
We can perform the grid search on these parameters using repeated cross-validation and estimate model performance using ROC AUC:
|
1 2 3 4 5 |
... # define evaluation procedure cv = RepeatedStratifiedKFold(n_splits=10, n_repeats=3, random_state=1) # define grid search grid = GridSearchCV(estimator=model, param_grid=param_grid, n_jobs=-1, cv=cv, scoring='roc_auc') |
Once executed, we can summarize the best configuration as well as all of the results as follows:
|
1 2 3 4 5 6 7 8 9 |
... # report the best configuration print("Best: %f using %s" % (grid_result.best_score_, grid_result.best_params_)) # report all configurations means = grid_result.cv_results_['mean_test_score'] stds = grid_result.cv_results_['std_test_score'] params = grid_result.cv_results_['params'] for mean, stdev, param in zip(means, stds, params): print("%f (%f) with: %r" % (mean, stdev, param)) |
Tying this together, the example below grid searches five different class weights for logistic regression on the imbalanced dataset.
We might expect that the heuristic class weighing is the best performing configuration.
|
1 2 3 4 5 6 7 8 9 10 11 12 13 14 15 16 17 18 19 20 21 22 23 24 25 26 27 28 |
# grid search class weights with logistic regression for imbalance classification from numpy import mean from sklearn.datasets import make_classification from sklearn.model_selection import GridSearchCV from sklearn.model_selection import RepeatedStratifiedKFold from sklearn.linear_model import LogisticRegression # generate dataset X, y = make_classification(n_samples=10000, n_features=2, n_redundant=0, n_clusters_per_class=1, weights=[0.99], flip_y=0, random_state=2) # define model model = LogisticRegression(solver='lbfgs') # define grid balance = [{0:100,1:1}, {0:10,1:1}, {0:1,1:1}, {0:1,1:10}, {0:1,1:100}] param_grid = dict(class_weight=balance) # define evaluation procedure cv = RepeatedStratifiedKFold(n_splits=10, n_repeats=3, random_state=1) # define grid search grid = GridSearchCV(estimator=model, param_grid=param_grid, n_jobs=-1, cv=cv, scoring='roc_auc') # execute the grid search grid_result = grid.fit(X, y) # report the best configuration print("Best: %f using %s" % (grid_result.best_score_, grid_result.best_params_)) # report all configurations means = grid_result.cv_results_['mean_test_score'] stds = grid_result.cv_results_['std_test_score'] params = grid_result.cv_results_['params'] for mean, stdev, param in zip(means, stds, params): print("%f (%f) with: %r" % (mean, stdev, param)) |
Running the example evaluates each class weighting using repeated k-fold cross-validation and reports the best configuration and the associated mean ROC AUC score.
Note: Your results may vary given the stochastic nature of the algorithm or evaluation procedure, or differences in numerical precision. Consider running the example a few times and compare the average outcome.
In this case, we can see that the 1:100 majority to minority class weighting achieved the best mean ROC score. This matches the configuration for the general heuristic.
It might be interesting to explore even more severe class weightings to see their effect on the mean ROC AUC score.
|
1 2 3 4 5 6 |
Best: 0.989077 using {'class_weight': {0: 1, 1: 100}} 0.982498 (0.016722) with: {'class_weight': {0: 100, 1: 1}} 0.983623 (0.015760) with: {'class_weight': {0: 10, 1: 1}} 0.985387 (0.013890) with: {'class_weight': {0: 1, 1: 1}} 0.988044 (0.010384) with: {'class_weight': {0: 1, 1: 10}} 0.989077 (0.006865) with: {'class_weight': {0: 1, 1: 100}} |
Further Reading
This section provides more resources on the topic if you are looking to go deeper.
Papers
- Logistic Regression in Rare Events Data, 2001.
- The Estimation of Choice Probabilities from Choice Based Samples, 1977.
Books
- Learning from Imbalanced Data Sets, 2018.
- Imbalanced Learning: Foundations, Algorithms, and Applications, 2013.
APIs
- sklearn.utils.class_weight.compute_class_weight API.
- sklearn.linear_model.LogisticRegression API.
- sklearn.model_selection.GridSearchCV API.
Summary
In this tutorial, you discovered cost-sensitive logistic regression for imbalanced classification.
Specifically, you learned:
- How standard logistic regression does not support imbalanced classification.
- How logistic regression can be modified to weight model error by class weight when fitting the coefficients.
- How to configure class weight for logistic regression and how to grid search different class weight configurations.
Do you have any questions?
Ask your questions in the comments below and I will do my best to answer.
Get a Handle on Imbalanced Classification!
Develop Imbalanced Learning Models in Minutes
...with just a few lines of python code
Discover how in my new Ebook:
Imbalanced Classification with Python
It provides self-study tutorials and end-to-end projects on:
Performance Metrics, Undersampling Methods, SMOTE, Threshold Moving, Probability Calibration, Cost-Sensitive Algorithms
and much more...


Jason, almost done from reading the book.
Really great piece of work!
One minor recommendation: I’d like to see more explanatory infographics of the algos.
Well done on your progress!
Great suggestion, thanks.
I would like to see the improvement on the precision and recall for the minor class.
Thanks, great suggestion.
Hello Jason,
a question about SVC and linearSVC.
What is the difference?
I’m trying a sentiment analysis with 1000 observations (750 training + 250 test).
Is it better to use SVC o linearSVC for the analysis?
What is the meaning of C hyperparameter in linearSVC (in simple words)?
I’ve found the C parameter is common also in other algorithms. The meaning is the same?
Thanks
SVC can do linear svc via a linear kernel. linear svc just uses the linear kernel and nothing else and is optimized for this use case – faster/more efficient.
More on C here:
https://machinelearningmastery.com/support-vector-machines-for-machine-learning/
Hi
Does you book cover example-dependent cost-sensitive classification?
No, just classes-based costs.
Thanks for the tutorial
You’re very welcome, I hope it helps you with your project!
Dear Jason Browniee,
Good morning.
Whren will you have the book in R.
Kind regards,
Macilane
No plans at this stage. My focus is Python given that it is the most popular language for machine learning at the moment.
“For example, we have 10,000 examples in the dataset, 9990 in class 0, and 100 in class 1.”
Wouldn’t be 9990-10 or 9900-100?
Good article, clear explanation
Thanks, fixed!
Could you please provide the code for “Counter”
NameError: name ‘Counter’ is not defined
Thank you
You must copy the full code example that includes the important statement.
Thank you for the great work. It was very helpful. I was looking to see how we can approach a specific problem both with classification and regression models? Let’s say I want to study the air temperature-soil temperature relation both with classification and regression models to get both the best fit and the decision boundary. Is there any article that can illustrate how steps will be different for these two approaches?
You’re welcome.
I don’t have an example, sorry.
Hello Jason,
Thanks for another great article.
I am assuming that the alternative option of combining over-sampling and under-sampling the dataset (instead of using the class weight) also applies to Logistic Regression.
Am I correct?
If I’m correct, would you recommend taking both approaches and compare results when faced with an imbalanced dataset?
Thank you.
Yes, you can resample the data instead of using a cost-sensitive classifier.
No, combining both approaches would not be helpful as the classes would be balanced after resampling. Nevertheless, experiment!!! Perhaps you will discover something unintuitive?
Hi,
Great article!
Can you please also add code regarding how to deploy this model on an unseen test dataset?
Thanks
You mean make a prediction, if so see this:
https://machinelearningmastery.com/make-predictions-scikit-learn/
Hi Jason,
Thanks for your tutorials. They motivated me to buy your book imbalanced classification with python.
I’m trying to apply this tutorial to a multilabel classification problem. I’m struggling to figure out how to correctly set the scoring metric on the cross_val_score method.
Any hint would be highly appreciated.
BR,
Mario
Thanks!
You can specify the metric you want to optimize to the cross_val_score function.
Can cost sensitive learning be done with logistic regression, decision trees and random forest in R?
Perhaps, I don’t know off hand sorry.
Thank you for this great article. It is so helpful!
I have a question for you.
Does the class, “sklearn.linear_model.LogisticRegression”, use maximum likelihood estimation and lbfgs to estimate parametars as a default model? If so, it means that the class of sklearn use lbfgs because we cannot use the analytic solution for minimizing the negative log likelihood loss?
I am sorry for my bad English.
You’re welcome.
Yes, it uses MLE and uses a second order optimization algorithm as there isn’t a stable analyical solution.
Thank you for your reply!
You’re welcome.
You mention in the beginning that
“Logistic regression does not support imbalanced classification directly.”
Do you have any theory or theoretical papers supporting this statement?
Think about how you compute the error score in logistic regression. Then you will see that imbalanced classification will skew toward to major class.
Thank you for all the comprehensive tutorials!
I was wondering if there is an option to do a logistic regression with robust standard errors for clustered data using sklearn?
My web search didn’t get me any results for sklearn (only for statsmodel and this has some other disadvantages).
I do have a dataset with observations which are derived from 15 study sites and it is assumed that the variance between observations within one study site is smaller than between study sites. Therefore we would like to compute robust standard errors taking the clusters (study sites) into account.
Does anybody know if this is possible with sklearn?
Hi Liz…There may be some helpful ideas here:
https://stackoverflow.com/questions/75814525/statsmodels-clustered-logit-model-with-robust-standard-errors