Linear regression is perhaps one of the most well known and well understood algorithms in statistics and machine learning.
In this post you will discover the linear regression algorithm, how it works and how you can best use it in on your machine learning projects. In this post you will learn:
Why linear regression belongs to both statistics and machine learning.
The many names by which linear regression is known.
The representation and learning algorithms used to create a linear regression model.
How to best prepare your data when modeling using linear regression.
You do not need to know any statistics or linear algebra to understand linear regression. This is a gentle high-level introduction to the technique to give you enough background to be able to use it effectively on your own problems.
Dec 2023 Update:
Some sections edited for clarity and explanation.
Added section Building the Linear Regression Model from Scratch.
Kick-start your project with my new book Master Machine Learning Algorithms, including step-by-step tutorials and the Excel Spreadsheet files for all examples.
Let’s get started.
Linear Regression for Machine Learning Photo by Nicolas Raymond, some rights reserved.
Isn’t Linear Regression from Statistics?
Before we dive into the details of linear regression, you may be asking yourself why we are looking at this algorithm.
Isn’t it a technique from statistics?
Machine learning, more specifically the field of predictive modeling is primarily concerned with minimizing the error of a model or making the most accurate predictions possible, at the expense of explainability. In applied machine learning we will borrow, reuse and steal algorithms from many different fields, including statistics and use them towards these ends.
As such, linear regression was developed in the field of statistics and is studied as a model for understanding the relationship between input and output numerical variables, but has been borrowed by machine learning. It is both a statistical algorithm and a machine learning algorithm.
Next, let’s review some of the common names used to refer to a linear regression model.
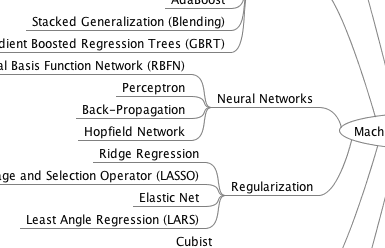
Get your FREE Algorithms Mind Map
Sample of the handy machine learning algorithms mind map.
I've created a handy mind map of 60+ algorithms organized by type.
Download it, print it and use it.
Also get exclusive access to the machine learning algorithms email mini-course.
Many Names of Linear Regression
When you start looking into linear regression, things can get very confusing.
The reason is because linear regression has been around for so long (more than 200 years). It has been studied from every possible angle and often each angle has a new and different name.
Linear regression is a linear model, e.g. a model that assumes a linear relationship between the input variables (x) and the single output variable (y). More specifically, that y can be calculated from a linear combination of the input variables (x).
When there is a single input variable (x), the method is referred to as simple linear regression. When there are multiple input variables, literature from statistics often refers to the method as multiple linear regression.
Different techniques can be used to prepare or train the linear regression equation from data, the most common of which is called Ordinary Least Squares. It is common to therefore refer to a model prepared this way as Ordinary Least Squares Linear Regression or just Least Squares Regression.
Now that we know some names used to describe linear regression, let’s take a closer look at the representation used.
Linear Regression Model Representation
Linear regression is an attractive model because the representation is so simple.
The representation is a linear equation that combines a specific set of input values (x) the solution to which is the predicted output for that set of input values (y). As such, both the input values (x) and the output value are numeric.
The linear equation assigns one scale factor to each input value or column, called a coefficient and represented by the capital Greek letter Beta (B). One additional coefficient is also added, giving the line an additional degree of freedom (e.g. moving up and down on a two-dimensional plot) and is often called the intercept or the bias coefficient.
For example, in a simple regression problem (a single x and a single y), the form of the model would be:
y = B0 + B1*x
In higher dimensions when we have more than one input (x), the line is called a plane or a hyper-plane. The representation therefore is the form of the equation and the specific values used for the coefficients (e.g. B0 and B1 in the above example).
It is common to talk about the complexity of a regression model like linear regression. This refers to the number of coefficients used in the model.
When a coefficient becomes zero, it effectively removes the influence of the input variable on the model and therefore from the prediction made from the model (0 * x = 0). This becomes relevant if you look at regularization methods that change the learning algorithm to reduce the complexity of regression models by putting pressure on the absolute size of the coefficients, driving some to zero.
Now that we understand the representation used for a linear regression model, let’s review some ways that we can learn this representation from data.
What is Linear Regression? Photo by Estitxu Carton, some rights reserved.
Linear Regression Learning the Model
Learning a linear regression model means estimating the values of the coefficients used in the representation with the data that we have available.
In this section, we will take a brief look at four techniques to prepare a linear regression model. This is not enough information to implement them from scratch, but enough to get a flavor of the computation and trade-offs involved.
There are many more techniques because the model is so well studied. Take note of Ordinary Least Squares because it is the most common method used in general. Also take note of Gradient Descent as it is the most common technique taught in machine learning classes.
1. Simple Linear Regression
With simple linear regression when we have a single input, we can use statistics to estimate the coefficients.
This requires that you calculate statistical properties from the data such as means, standard deviations, correlations and covariance. All of the data must be available to traverse and calculate statistics.
This is fun as an exercise in excel, but not really useful in practice.
2. Ordinary Least Squares
When we have more than one input we can use Ordinary Least Squares to estimate the values of the coefficients.
The Ordinary Least Squares procedure seeks to minimize the sum of the squared residuals. This means that given a regression line through the data we calculate the distance from each data point to the regression line, square it, and sum all of the squared errors together. This is the quantity that ordinary least squares seeks to minimize.
This approach treats the data as a matrix and uses linear algebra operations to estimate the optimal values for the coefficients. It means that all of the data must be available and you must have enough memory to fit the data and perform matrix operations.
It is unusual to implement the Ordinary Least Squares procedure yourself unless as an exercise in linear algebra. It is more likely that you will call a procedure in a linear algebra library. This procedure is very fast to calculate.
3. Gradient Descent
When there are one or more inputs you can use a process of optimizing the values of the coefficients by iteratively minimizing the error of the model on your training data.
This operation is called Gradient Descent and works by starting with random values for each coefficient. The sum of the squared errors are calculated for each pair of input and output values. A learning rate is used as a scale factor and the coefficients are updated in the direction towards minimizing the error. The process is repeated until a minimum sum squared error is achieved or no further improvement is possible.
When using this method, you must select a learning rate (alpha) parameter that determines the size of the improvement step to take on each iteration of the procedure.
Gradient descent is often taught using a linear regression model because it is relatively straightforward to understand. In practice, it is useful when you have a very large dataset either in the number of rows or the number of columns that may not fit into memory.
4. Regularization
There are extensions of the training of the linear model called regularization methods. These seek to both minimize the sum of the squared error of the model on the training data (using ordinary least squares) but also to reduce the complexity of the model (like the number or absolute size of the sum of all coefficients in the model).
Two popular examples of regularization procedures for linear regression are:
Lasso Regression: where Ordinary Least Squares is modified to also minimize the absolute sum of the coefficients (called L1 regularization).
Ridge Regression: where Ordinary Least Squares is modified to also minimize the squared absolute sum of the coefficients (called L2 regularization).
These methods are effective to use when there is collinearity in your input values and ordinary least squares would overfit the training data.
Now that you know some techniques to learn the coefficients in a linear regression model, let’s look at how we can use a model to make predictions on new data.
Making Predictions with Linear Regression
Given the representation is a linear equation, making predictions is as simple as solving the equation for a specific set of inputs.
Let’s make this concrete with an example. Imagine we are predicting weight (y) from height (x). Our linear regression model representation for this problem would be:
y = B0 + B1 * x1
or
weight =B0 +B1 * height
Where B0 is the bias coefficient and B1 is the coefficient for the height column. We use a learning technique to find a good set of coefficient values. Once found, we can plug in different height values to predict the weight.
For example, let’s use B0 = 0.1 and B1 = 0.5. Let’s plug them in and calculate the weight (in kilograms) for a person with a height of 182 centimeters.
weight = 0.1 + 0.5 * 182
weight = 91.1
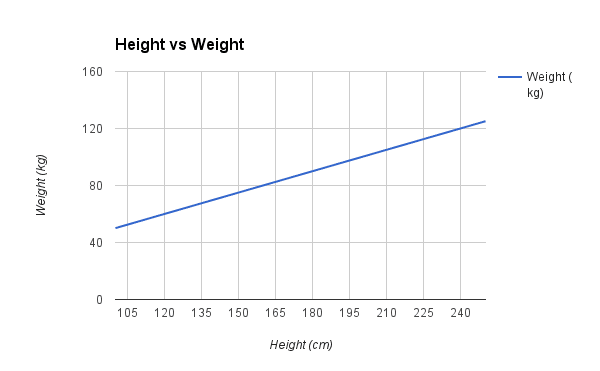
You can see that the above equation could be plotted as a line in two-dimensions. The B0 is our starting point regardless of what height we have. We can run through a bunch of heights from 100 to 250 centimeters and plug them to the equation and get weight values, creating our line.
Sample Height vs Weight Linear Regression
Now that we know how to make predictions given a learned linear regression model, let’s look at some rules of thumb for preparing our data to make the most of this type of model.
Preparing Data For Linear Regression
Linear regression has been studied at great length, and there is a lot of literature on how your data must be structured to make best use of the model.
As such, there is a lot of sophistication when talking about these requirements and expectations which can be intimidating. In practice, you can uses these rules more as rules of thumb when using Ordinary Least Squares Regression, the most common implementation of linear regression.
Try different preparations of your data using these heuristics and see what works best for your problem.
Linear Assumption. Linear regression assumes that the relationship between your input and output is linear. It does not support anything else. This may be obvious, but it is good to remember when you have a lot of attributes. You may need to transform data to make the relationship linear (e.g. log transform for an exponential relationship).
Remove Noise. Linear regression assumes that your input and output variables are not noisy. Consider using data cleaning operations that let you better expose and clarify the signal in your data. This is most important for the output variable and you want to remove outliers in the output variable (y) if possible.
Remove Collinearity. Linear regression will over-fit your data when you have highly correlated input variables. Consider calculating pairwise correlations for your input data and removing the most correlated.
Gaussian Distributions. Linear regression will make more reliable predictions if your input and output variables have a Gaussian distribution. You may get some benefit using transforms (e.g. log or BoxCox) on you variables to make their distribution more Gaussian looking.
Rescale Inputs: Linear regression will often make more reliable predictions if you rescale input variables using standardization or normalization.
The formula for a simple linear regression (with one independent variable) is:
Where:
y is the dependent variable (target),
x is the independent variable (feature),
m is the slope of the line (also called the weight or coefficient),
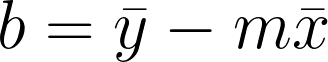
b is the y-intercept.
To find the values of m and b that minimize the error, we can use the Ordinary Least Squares method. The formulas for m and b in terms of the data points are:
Here is the Python implementation of the above formulas. We will use the Numpy library to create a training algorithm, prediction function, RMSE function, and sample data.
We will translate the equation to Python using Numpy functions and calculate the m and b.
We will also create a prediction and RMSE function for analyzing the model performance.
Once the basics of Numpy are understood, translating mathematical equations to Python code becomes easy.
1
2
3
4
5
6
7
8
9
10
11
12
13
14
15
16
17
18
19
20
21
22
23
24
25
26
27
28
29
30
31
32
33
34
35
36
37
38
39
40
41
42
import numpy asnp
# Function to calculate m and b
def linear_regression(X,y):
x_mean=np.mean(X)
y_mean=np.mean(y)
numerator=np.sum((X-x_mean)*(y-y_mean))
denominator=np.sum((X-x_mean)**2)
m=numerator/denominator
b=y_mean-(m *x_mean)
returnm,b
# Function to calculate prediction
def predict(X,m,b):
returnm *X+b
# Function to calculate RMSE
def rmse(y_true,y_pred):
returnnp.sqrt(np.mean((y_true-y_pred)**2))</prev>
<ol start="3">
<li>We will train our model by providing the sample data.
<li>Makeaprediction.
<li>By using the predicted values,calculate the RMSE metric.
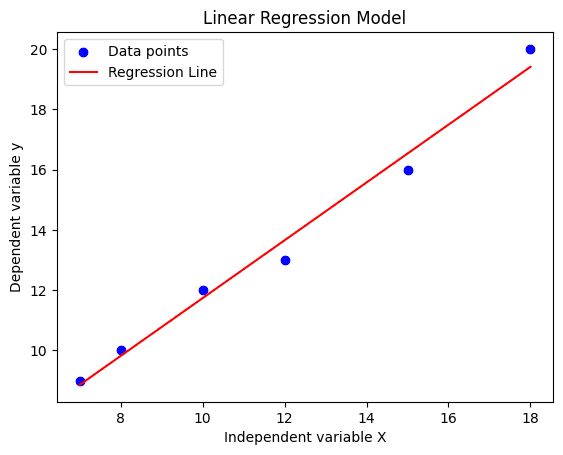
To better understand our results, we will visualize them using Matplotlib. We will create a scatter plot of the data points and a line plot of the predictions.
As we can see, our regression line is a perfect fit with minimum loss.
Further Reading
There’s plenty more out there to read on linear regression. Start using it before you do more reading, but when you want to dive deeper, below are some references you could use.
Machine Learning Books that Mention Linear Regression
These are some machine learning books that you might own or have access to that describe linear regression in the context of machine learning.
HI
Thanks for good article.
I have a doubt about Linear regression hypothesis.
I feel in single variable linear regression equationY= W0+W1*X+E, the error term E will always less than W1*X term. If E > W1*X them it means other variables have more influence on dependent variable Y.
Kindly, add and correct me if I am wrong.
hi Jason
This is article is good
This help me to complete linear regression project in machine learning
But still i feel bit confussing in linear algebra concept
Hi Jason, what if there is multiple values Y for each X. then finding one magical universal Y value for each X is nonsense isn’t it? Eg 10 different Y values for each X with big range on Y axis. It has probably meaning only if there is only on Y value for each X, or they more values that are close to each other. Because with multiple Y values you will never hit the correct Y in most cases. Isn’t then better just simple average value than trying to do some magic with linear regression?
Hi Jason, thank you for your reply. I just looked into Linear Regression a little bit more and now it is bit more clear to me. I have to improve my lacking mathematical and statistical (and of course also ML) skills. So it goes quite slowly :). When i was looking into linear equations recently i noticed there is same formula as here in LR (slope – intercept form) :). Quite surprising, but then the LR formula is more familiar to one. Thank you and best regards, and later i will look also into class label thing. Luky
Thank you so much Jason. I was looking for linear regression applied on datasets in weka to get a clear understanding. Could you please let me know where I can find them like how you explained the boston housing prices dataset.
Thanks for this good article! Please, I need some more help with a project I’m doing at university: I have to apply (nothing too difficult, I’m not an expert) a machine learning algorithm to a financial dataset, using R. I chose a linear regression where the daily price of the asset is the y and daily Open/High/Low are the x. I just used the command lm to fit, analysed the results and make the model predict the values. The variables are obviously correlated, and if I plot the original price on x and the predictions on y, the points proceed like a straight line. Can I conclude there’s a linear correlation between Price and Open/High/Low? Maybe it’s obvious, but I asking cause I’m not sure all this thing I did are correct.
Thank you again, regard from Italy 🙂
I really love your articles, very comprehensive yet simple to understand. I’m trying to wrap my head around machine learning and i’m watching tutorials on regression. So my question is, with a given data set, before i build the model, should i be doing feature extraction – using either forward selection or backward elimination or bidirectional elimination. After I get the features, that’s when i build the model, Ordinary least squares is used to build the model. Is my understanding correct? I’m looking for a sequence as to what is done first.
Thank you for the great article summarizing the major concepts. I just wanted to express my doubt about one thing. Are you sure that linear regression assumes Gaussian for the inputs? The inputs should only be giving information about the mean of the output distribution (which is the only Gaussian assumed). To express it in math terms:
Y = beta0 + beta1*X + eps
Since
eps ~ N(0,sigma)
Y|X ~ N(beta0 + beta1*X , sigma)
As you can see, there is no assumption on X. What matters is how representative our X is of the true population where X is sampled from, so that we can claim linearity of relationship between X and Y over a wide range of inputs.
Under the assumptions section of the first link…
“Weak exogeneity. This essentially means that the predictor variables x can be treated as fixed values, rather than random variables. This means, for example, that the predictor variables are assumed to be error-free—that is, not contaminated with measurement errors. Although this assumption is not realistic in many settings, dropping it leads to significantly more difficult errors-in-variables models.”
let’s assume I have three features A, B and C, while the weights are denoted by W. I form the following hypothesis,
hypothesis = bias + A*W1 + B*W2 + C*W3 + A^2*W4
is the above hypothesis correct? or do I need to make every feature 2nd order? like this,
hypothesis = bias + A*W1 + B*W2 + C*W3 + A^2*W4 + B^2*W5 + C^2*W6
please do provide reason as to why one or both are correct?
Correct me if I am wrong.. but all the methods to train/create/make/fit a model to a data set have to do with minimizing the sum of square errors function?
method 1 I believe is also minimizing the SSE but using statistics.
method 2 is minimizing the SSE
method 3 is minimizing the SSE for multi variable functions
method 4 is minimizing the SSE with an additional constraint
“linear” regression word terminology is often misused (due to language issues). For example I can use (for sure) linear regression to approach dependent variable (Y) of multinomial independents variables (x). How? adding more layers and ‘relu’ activation of the output layers, I calculated; cubic, quadratic and some other polynomials (Y=x^3, or Y = x^2, etc.).
But in case you want to be more “orthodox” or canonical, you simply added more features to your inputs, such as X`2 (as a new input feature from your current x feature), etc… So obviously the linear expression only mean that all the features are added (beta0 * x + beta1*X^2 +…) that is all the meaning of linear…so it can accomplish non-linear dependencies Y= f(x) dependencies. What about your opinion?
regards
thank you very much for all yours tutorials !
Hey ,
i wanted to ask which data set is the best and which one is the worst for linear regression ? and also if you could suggest a book or some articles about similar theoretical information on other algorithms like logistic regression and SVM.
Thanks
You wrote that linear regression considers “Normality of variables” as an assumption. But the above research work says that is a misconception and what is required is normality of residual errors. Can you please check
Hi, I have a liner line which satisfy the data, but problem is that I am having two different lines in one single graph, how to tackle such problem
I am unable to upload that graph here, can you provide me some other medium to share the graph I obtained
I have a question about linear model: say we have multiple variables and want to feed them to the linear model, I saw some people use all of them as the input and put them in the model simultaneously; I also saw some people every time just test and out one variable in the linear model, and run the model one by one for each variable. I am confused what is the differences between these two options, although both options can result in the p-value (the second one needs multiple correction) and coefficient, I suppose the results from these two methods are different. Could you explain to me please? Thank you in advance!
But , I got an error “x and y must be the same size” surely because X is a 3-d and y 1-d even if a flatten X , I’ll get an error.What I have to do to plot something like above ?
I do not particularly want to write this, however, as a PhD, you should be able to write both grammatically and mechanically correct English. Unfortunately, you very much need to work on writing mechanics (especially comma structure). I do appreciate your attempt to provide useful information, but from an academic standpoint the basic punctuation here is simply terrible. Do you not care about this? Sorry to be harsh, but not bothering to convey your ideas in a coherent form shows a lack of respect for your readers, our language, and your own thoughts. If you don’t show these kinds of respect, it is very unlikely you will get any in return from those who know better.
Just look at this paragraph and tell me you can’t see the major punctuation errors in both sentences. (In case you really don’t know, separating nonessential clauses with comma pairs is a fundamental rule of comma usage, and you are flatly ignoring it.) The whole article is like this:
“Machine learning, more specifically the field of predictive modeling [need comma] is primarily concerned with minimizing the error of a model or making the most accurate predictions possible, at the expense of explainability. In applied machine learning we will borrow, reuse and steal algorithms from many different fields, including statistics [need comma] and use them towards these ends.”
Obviously everyone makes mistakes, but repeated mistakes about something so basic show either a lack of understanding or complete disregard. I would really hope a PhD would strive not to descend to the level of high-school rambling that is unfortunately common on the web these days. If you choose to be an academic, fellow academics would certainly be grateful if you would try to maintain some intellectual rigour and not contribute to the degradation of our written language. If you have difficulty recognizing basic punctuation errors, you might read a book about it. Surely anyone who could make it through a doctoral program can do that.
Suppose I have a dataset where 3 of the features are highly correlated with approximately 0.8 or so. These features are also highly correlated with the target.
If I were to delete one of these features, I would solve the multicollinearity violation. However, would this not cause omitted-variable bias leading to endogeneity?
How do you balance between having no endogeneity and avoiding multicollinearity?
Thanks so much for the great article. Can I ask a question about the coefficients in regression? I’m trying to build a multivariate regression model and I’d like to actually model the coefficients or parameters with a set of known values. Is this doable? Something like y(u,v,t)=f0+f1(u, v, t)*x1+f2(u, v, t)*x2+…+fn(u,v,t)*xn+error term, where u, v, and t are known values and my goal is to find models f1, f2… fn to minimize the loss function.
Sorry if I haven’t made myself clear. Appreciate a lot for your help in advance!
Yes, if you have fixed values and unknown values, then you can use an optimization algorithm to find the unknown values that minimize the error. Gradient descent might be a good start.
Hey good article
Iam an electric engineer and in my papers I wanted to make Low density polyethylene with clay as electric insulation
I mad 7 samples between 0% to 15% clay rate
I have already did tests on it ( electric and mechanical)
I wanna use ML to determine the best clay rate between what I have made or even a rate in between that I didn’t make
Any tip what should start with
Thanks in advance
I only have one question: are those data assumptions a requirement for statistical linear regression that can be ignored on machine learning linear regression ? I’d say that in ml the only requirement to use this model is a linear relationship between input and output. I presume statistical requirements are ignored as consequence of focusing on predictability rather than explainability.
Thanks for the article. I have one question. what will be a good non linear algorithm to use when i have only two or less features? When i say non linear I donot mean polynomial. I do want my model to learn a particular pattern in my data. And this pattern looks like random signal.
You are asking for a parametric model or non-parametric model? Likely we want a parametric model because otherwise it is intractable. What it means is that, we assume something about the data (e.g., polynomial) and then estimate the parameters (e.g. coefficients of the polynomial). Without assuming anything, it is hard.
Hi , I am new to ML . And so I was going through the linear regression algorithm. And one thing I am feeling a doubt is in the cost function we are dividing the SSE by 1/2m . I understand that 1/2 will gets cancelled in calculation of parameters in Gradient descent but why 1/m is there for in cost function ??
Also if I will not include it then will it be okay or not ??
Hi, I am a fresher in ML. While going through the cost function of the linear regression I studied that the J(theta) = 1/2m summation(h(theta(i)) – y(i))^2
where m is the total no. of training examples
1/2 is taken to make the calculation easier??
My ques. here is that we are taking the summation of SSE and then dividing by the no of training examples (m).
So why are we doing the average by dividing by m??
Can’t we just calculate the summation of error terms(and do not divide by m) so now we have the total error that we have to minimize by finding the optimal values of theta and our job’s done ??
Please explain this in detail because i tried to found that at many places but didn’t found any satisfactory answer and also in lectures the professor also didn’t clarified this doubt. Some answered but this but could not able to justify that. I asked them what difference will it cause anyway??
Also attach some resources from where i can read about it more. Thank you.
After completing Salesforce online training, I am now learning Machine Learning. I found this article very helpful for me. My question is can I make use of ML with Salesforce?
Thank you for sharing this informative article on linear regression for machine learning. It’s an excellent resource for those who are new to machine learning and want to learn more about linear regression.
The article provides a clear and concise introduction to linear regression, explaining the concept in simple terms and providing examples to help readers understand the topic better. The author also covers the different types of linear regression models, including simple linear regression, multiple linear regression, and polynomial regression, which is helpful for readers who want to apply this technique to real-world problems.


HI
Thanks for good article.
I have a doubt about Linear regression hypothesis.
I feel in single variable linear regression equationY= W0+W1*X+E, the error term E will always less than W1*X term. If E > W1*X them it means other variables have more influence on dependent variable Y.
Kindly, add and correct me if I am wrong.
Hi Amit, I’m not sure what you mean.
The simple linear regression equation is:
If E>w1*x it does not mean any thing.In fact E is assumed to take any value between – infinite and + infinity
Thanks.
You’r welcome
y=mx+c
linear regression equation .
It’s the equation of a line. m be the slope, c is the constant.
That’s right. Thanks.
Hi Amith,Jason,
I think Amith trying to say that the ERROR regarding n linear regression is a part of linear equation?correct me ig I wrong
hi Jason
This is article is good
This help me to complete linear regression project in machine learning
But still i feel bit confussing in linear algebra concept
Hang in there.
Nice Explanation about Linear Regression.
Thanks.
Can someone please explain the time complexity for this algorithm?
The time complexity for training simple Linear regression is O(p^2n+p^3) and O(p) for predictions.
Thanks for sharing Joe.
Hi Jason, what if there is multiple values Y for each X. then finding one magical universal Y value for each X is nonsense isn’t it? Eg 10 different Y values for each X with big range on Y axis. It has probably meaning only if there is only on Y value for each X, or they more values that are close to each other. Because with multiple Y values you will never hit the correct Y in most cases. Isn’t then better just simple average value than trying to do some magic with linear regression?
If your problem is to predict a class label, then you can use multi-label classification to predict multiple y values for a given X.
Hi Jason, thank you for your reply. I just looked into Linear Regression a little bit more and now it is bit more clear to me. I have to improve my lacking mathematical and statistical (and of course also ML) skills. So it goes quite slowly :). When i was looking into linear equations recently i noticed there is same formula as here in LR (slope – intercept form) :). Quite surprising, but then the LR formula is more familiar to one. Thank you and best regards, and later i will look also into class label thing. Luky
Thank you so much Jason. I was looking for linear regression applied on datasets in weka to get a clear understanding. Could you please let me know where I can find them like how you explained the boston housing prices dataset.
Here is an example:
https://machinelearningmastery.com/regression-machine-learning-tutorial-weka/
Thanks for this good article! Please, I need some more help with a project I’m doing at university: I have to apply (nothing too difficult, I’m not an expert) a machine learning algorithm to a financial dataset, using R. I chose a linear regression where the daily price of the asset is the y and daily Open/High/Low are the x. I just used the command lm to fit, analysed the results and make the model predict the values. The variables are obviously correlated, and if I plot the original price on x and the predictions on y, the points proceed like a straight line. Can I conclude there’s a linear correlation between Price and Open/High/Low? Maybe it’s obvious, but I asking cause I’m not sure all this thing I did are correct.
Thank you again, regard from Italy 🙂
I have some help with time series here that may be useful:
https://machinelearningmastery.com/start-here/#timeseries
Hi,
I really love your articles, very comprehensive yet simple to understand. I’m trying to wrap my head around machine learning and i’m watching tutorials on regression. So my question is, with a given data set, before i build the model, should i be doing feature extraction – using either forward selection or backward elimination or bidirectional elimination. After I get the features, that’s when i build the model, Ordinary least squares is used to build the model. Is my understanding correct? I’m looking for a sequence as to what is done first.
Thanks,
Sam
Yes you can. Try with and without feature selection to ensure it gives a lift in skill.
Hi Jason!
Thank you for the great article summarizing the major concepts. I just wanted to express my doubt about one thing. Are you sure that linear regression assumes Gaussian for the inputs? The inputs should only be giving information about the mean of the output distribution (which is the only Gaussian assumed). To express it in math terms:
Y = beta0 + beta1*X + eps
Since
eps ~ N(0,sigma)
Y|X ~ N(beta0 + beta1*X , sigma)
As you can see, there is no assumption on X. What matters is how representative our X is of the true population where X is sampled from, so that we can claim linearity of relationship between X and Y over a wide range of inputs.
What do you think?
Thanks for the comment!
Yes, learn more here:
https://en.wikipedia.org/wiki/Linear_regression
https://en.wikipedia.org/wiki/Ordinary_least_squares
Under the assumptions section of the first link…
“Weak exogeneity. This essentially means that the predictor variables x can be treated as fixed values, rather than random variables. This means, for example, that the predictor variables are assumed to be error-free—that is, not contaminated with measurement errors. Although this assumption is not realistic in many settings, dropping it leads to significantly more difficult errors-in-variables models.”
Nice.
Hi,
in regression problem:
If I fitted a line in my data, that means there is a linear relationship between the value Y and other features.
Now, What else we can conclude. is there is a possibility that the features that have the high weights could have similarity with the value Y?
let’s assume I have three features A, B and C, while the weights are denoted by W. I form the following hypothesis,
hypothesis = bias + A*W1 + B*W2 + C*W3 + A^2*W4
is the above hypothesis correct? or do I need to make every feature 2nd order? like this,
hypothesis = bias + A*W1 + B*W2 + C*W3 + A^2*W4 + B^2*W5 + C^2*W6
please do provide reason as to why one or both are correct?
No, you have have a mix of normal and squared inputs.
I would recommend carefully experimenting to see what works best for your specific data.
Correct me if I am wrong.. but all the methods to train/create/make/fit a model to a data set have to do with minimizing the sum of square errors function?
method 1 I believe is also minimizing the SSE but using statistics.
method 2 is minimizing the SSE
method 3 is minimizing the SSE for multi variable functions
method 4 is minimizing the SSE with an additional constraint
am I incorrect?
method 1: https://en.wikipedia.org/wiki/Simple_linear_regression#Fitting_the_regression_line
following data for linear regression problem
X. Y
2104. 460
1416. 232
1534. 314
852. 178
Which of the following set if values will give minimum error from training sample
1. m=4,. c=300
2. m=5,. c=30
Is this a homework question?
which book is good to refer for learning the linear regression deeply??
Any good textbook on machine learning.
I list some books here:
https://machinelearningmastery.com/faq/single-faq/what-other-machine-learning-books-do-you-recommend
How or From Where i can get the value of B0 and B1?I am from the beginner levels .
An algorithm will estimate them, learn them from examples.
For example, an algorithm implemented and provided in a library like scikit-learn.
Hi jason,
Thanks.
“linear” regression word terminology is often misused (due to language issues). For example I can use (for sure) linear regression to approach dependent variable (Y) of multinomial independents variables (x). How? adding more layers and ‘relu’ activation of the output layers, I calculated; cubic, quadratic and some other polynomials (Y=x^3, or Y = x^2, etc.).
But in case you want to be more “orthodox” or canonical, you simply added more features to your inputs, such as X`2 (as a new input feature from your current x feature), etc… So obviously the linear expression only mean that all the features are added (beta0 * x + beta1*X^2 +…) that is all the meaning of linear…so it can accomplish non-linear dependencies Y= f(x) dependencies. What about your opinion?
regards
thank you very much for all yours tutorials !
Adding non-linear transforms of input variables to a linear model still means the model is linear. It is still a weighted sum of inputs.
You can choose where the complexity is managed, in the transforms or in the model.
OK. Thks
Nice article, Thank you so much, I am more interested in Machine Learning applications .Please give references like books or web links , Thank you
I have many examples of applications. What are you looking for exactly?
There is a mistake under “Making Predictions with Linear Regression”.
There should be 0.5 instead of 0.05 in “weight = 0.1 + 0.05 * 182”
Thanks, fixed.
hey can you please guide me for # training data with x and y, i.e., 1 dimensional data x and label y
which method is to be used??
Sorry, I don’t understand, can you please elaborate?
Hey ,
i wanted to ask which data set is the best and which one is the worst for linear regression ? and also if you could suggest a book or some articles about similar theoretical information on other algorithms like logistic regression and SVM.
Thanks
A dataset that has a linear relationship between inputs and outputs is a good fit for linear regression.
One that has a nonlinear relationship is probably a bad fit.
I have read the above article, it is good. Sir, How much knowledge one should have to implement Linear Regression algorithm from scratch?
No prior knowledge, go right ahead!
https://scholarworks.umass.edu/cgi/viewcontent.cgi?article=1308&context=pare
You wrote that linear regression considers “Normality of variables” as an assumption. But the above research work says that is a misconception and what is required is normality of residual errors. Can you please check
Sounds about right.
Hi, I have a liner line which satisfy the data, but problem is that I am having two different lines in one single graph, how to tackle such problem
I am unable to upload that graph here, can you provide me some other medium to share the graph I obtained
I think you are referring to multi-target or multi-output regression.
This might help:
https://scikit-learn.org/stable/modules/generated/sklearn.multioutput.MultiOutputRegressor.html
Hi Jason,
I have a question about linear model: say we have multiple variables and want to feed them to the linear model, I saw some people use all of them as the input and put them in the model simultaneously; I also saw some people every time just test and out one variable in the linear model, and run the model one by one for each variable. I am confused what is the differences between these two options, although both options can result in the p-value (the second one needs multiple correction) and coefficient, I suppose the results from these two methods are different. Could you explain to me please? Thank you in advance!
Typically all relevant variables are provided as input to the model and used to make a prediction.
I see, thank you Jason!
You’re welcome.
Hi Jason ,
i have a question about multiple linear regression.
Here is a part of my code :
from sklearn.model_selection import train_test_split
train_X,test_X,train_y,test_y = train_test_split(X,y,test_size = 0.33 ,random_state=42)
reg = LinearRegression()
model = reg.fit(train_X,train_y)
predictions = model.predict(test_X)
print(“r2_score : %.2f” % r2_score(test_y,predictions))
print(“Mean_squared_error : %.2f ” % mean_squared_error(test_y,predictions))
for i in range(0,3):
print(“model parameters : %.2f” % model.coef_[i])
print(“model intercept : %.2f” % model.intercept_)
plt.scatter(test_X.TV,test_y)
plt.plot(test_X.TV,predictions)
plt.show()
plt.scatter(test_X.radio,test_y)
plt.plot(test_X.radio,predictions)
plt.show()
plt.scatter(test_X.newspaper,test_y)
plt.plot(test_X.newspaper,predictions)
plt.show()
The problem is that I want to do this :
plt.scatter(test_X.TV,test_y)
plt.plot(test_X.TV,predictions)
plt.show()
But , I got an error “x and y must be the same size” surely because X is a 3-d and y 1-d even if a flatten X , I’ll get an error.What I have to do to plot something like above ?
Thanks for your help
Sorry, I don’t have the capacity to debug your code example, perhaps this will help:
https://machinelearningmastery.com/faq/single-faq/can-you-read-review-or-debug-my-code
In machine learning, do we need check assumptions in the training data or in the complete dataset? Thanks!
Ideally, yes, but sometimes we can achieve good/best performance if we ignore the requirements of the algorithm.
So, yes and no.
I do not particularly want to write this, however, as a PhD, you should be able to write both grammatically and mechanically correct English. Unfortunately, you very much need to work on writing mechanics (especially comma structure). I do appreciate your attempt to provide useful information, but from an academic standpoint the basic punctuation here is simply terrible. Do you not care about this? Sorry to be harsh, but not bothering to convey your ideas in a coherent form shows a lack of respect for your readers, our language, and your own thoughts. If you don’t show these kinds of respect, it is very unlikely you will get any in return from those who know better.
Just look at this paragraph and tell me you can’t see the major punctuation errors in both sentences. (In case you really don’t know, separating nonessential clauses with comma pairs is a fundamental rule of comma usage, and you are flatly ignoring it.) The whole article is like this:
“Machine learning, more specifically the field of predictive modeling [need comma] is primarily concerned with minimizing the error of a model or making the most accurate predictions possible, at the expense of explainability. In applied machine learning we will borrow, reuse and steal algorithms from many different fields, including statistics [need comma] and use them towards these ends.”
Obviously everyone makes mistakes, but repeated mistakes about something so basic show either a lack of understanding or complete disregard. I would really hope a PhD would strive not to descend to the level of high-school rambling that is unfortunately common on the web these days. If you choose to be an academic, fellow academics would certainly be grateful if you would try to maintain some intellectual rigour and not contribute to the degradation of our written language. If you have difficulty recognizing basic punctuation errors, you might read a book about it. Surely anyone who could make it through a doctoral program can do that.
Thanks for your candid feedback. Research scientists are humans too.
I hire a team of editors to review all new tutorials. Hopefully they are a higher standard.
i am very weak in maths and my background his marketing..how much time it will take me to learn the complex in linear regression.
You can start using it immediately via Weka:
https://machinelearningmastery.com/start-here/#weka
Hi Jason,
Suppose I have a dataset where 3 of the features are highly correlated with approximately 0.8 or so. These features are also highly correlated with the target.
If I were to delete one of these features, I would solve the multicollinearity violation. However, would this not cause omitted-variable bias leading to endogeneity?
How do you balance between having no endogeneity and avoiding multicollinearity?
Perhaps try deleting each variable in turn and evaluate the effect on the model. Use the combination that results in the best performing predictions.
Good article.
We should write y-hat in place of y in the regression equation, right? Because it is predicted.
Sure.
Hi Jason,
Thanks so much for the great article. Can I ask a question about the coefficients in regression? I’m trying to build a multivariate regression model and I’d like to actually model the coefficients or parameters with a set of known values. Is this doable? Something like y(u,v,t)=f0+f1(u, v, t)*x1+f2(u, v, t)*x2+…+fn(u,v,t)*xn+error term, where u, v, and t are known values and my goal is to find models f1, f2… fn to minimize the loss function.
Sorry if I haven’t made myself clear. Appreciate a lot for your help in advance!
Best,
Chengbi
You’re welcome.
Yes, if you have fixed values and unknown values, then you can use an optimization algorithm to find the unknown values that minimize the error. Gradient descent might be a good start.
can someone help me with the question
what is the name of class in which linear regression classifier is present in sklearn ?
Linear regression cannot be used for classification.
It is a “regression” algorithm used to predict a numerical value:
https://scikit-learn.org/stable/modules/generated/sklearn.linear_model.LinearRegression.html
A very good article, really useful
Thanks!
Good Article with nice information
Thanks.
Hey good article
Iam an electric engineer and in my papers I wanted to make Low density polyethylene with clay as electric insulation
I mad 7 samples between 0% to 15% clay rate
I have already did tests on it ( electric and mechanical)
I wanna use ML to determine the best clay rate between what I have made or even a rate in between that I didn’t make
Any tip what should start with
Thanks in advance
Thanks.
Perhaps this process will help you work through your project:
https://machinelearningmastery.com/start-here/#process
Good Article with nice information
Thanks.
There are many, many more cognitive bias types, but I’ll limit my article to these four most important ones.
Thanks.
nice information and knowledge
Thanks.
It is awesome training.
Thanks!
Hi Jason,
Thanks for the article.
I only have one question: are those data assumptions a requirement for statistical linear regression that can be ignored on machine learning linear regression ? I’d say that in ml the only requirement to use this model is a linear relationship between input and output. I presume statistical requirements are ignored as consequence of focusing on predictability rather than explainability.
Predictability comes first, if you can get better results by breaking the rules/assumpetions, then probably it.
NIce Explanation, Guys You can also out this blog on Linear Regression https://mindmajix.com/linear-regression
Thanks for sharing.
Really Good and informative training.
Thank you. Glad you like it.
thanks for sharing
Thank you. Hope you like it.
This is informative article thank you so much it will helpfull to me
Thanks for sharing joe
Hi Team,
Thanks for the article. I have one question. what will be a good non linear algorithm to use when i have only two or less features? When i say non linear I donot mean polynomial. I do want my model to learn a particular pattern in my data. And this pattern looks like random signal.
You are asking for a parametric model or non-parametric model? Likely we want a parametric model because otherwise it is intractable. What it means is that, we assume something about the data (e.g., polynomial) and then estimate the parameters (e.g. coefficients of the polynomial). Without assuming anything, it is hard.
I have gone through your article. Really this was an informative read. Please keep posting informative articles like this. Thank you.
Thanks. Glad you liked it.
Wonderful and Descriptive. Really good.
Hi , I am new to ML . And so I was going through the linear regression algorithm. And one thing I am feeling a doubt is in the cost function we are dividing the SSE by 1/2m . I understand that 1/2 will gets cancelled in calculation of parameters in Gradient descent but why 1/m is there for in cost function ??
Also if I will not include it then will it be okay or not ??
Hi…That factor helps establish an average.
okay and how will the average help??
please give a detailed explanation about this . also what problems occur when we’ll not include 1/m.
Hi, I am a fresher in ML. While going through the cost function of the linear regression I studied that the J(theta) = 1/2m summation(h(theta(i)) – y(i))^2
where m is the total no. of training examples
1/2 is taken to make the calculation easier??
My ques. here is that we are taking the summation of SSE and then dividing by the no of training examples (m).
So why are we doing the average by dividing by m??
Can’t we just calculate the summation of error terms(and do not divide by m) so now we have the total error that we have to minimize by finding the optimal values of theta and our job’s done ??
Please explain this in detail because i tried to found that at many places but didn’t found any satisfactory answer and also in lectures the professor also didn’t clarified this doubt. Some answered but this but could not able to justify that. I asked them what difference will it cause anyway??
Also attach some resources from where i can read about it more. Thank you.
I have gone through your article. Really this was an informative and useful. Please keep posting informative articles like this. Thank you.
Great feedback Ivy! Keep up the great work!
content is very helpful easy to understand
Thank you for the feedback Arpita!
Hello,
After completing Salesforce online training, I am now learning Machine Learning. I found this article very helpful for me. My question is can I make use of ML with Salesforce?
Any suggestion will highley be appreciated.
Hi James…Please elaborate more on your goals with machine learning models so that we may better assist you.
Nice Tips.
Thank you for your feedback and support Anny! We appreciate it!
Thank you for sharing this informative article on linear regression for machine learning. It’s an excellent resource for those who are new to machine learning and want to learn more about linear regression.
The article provides a clear and concise introduction to linear regression, explaining the concept in simple terms and providing examples to help readers understand the topic better. The author also covers the different types of linear regression models, including simple linear regression, multiple linear regression, and polynomial regression, which is helpful for readers who want to apply this technique to real-world problems.
Thank you Donald for the excellent feedback! We appreciate it.