Maybe they are too granular or not granular enough. The Pandas library in Python provides the capability to change the frequency of your time series data.
In this tutorial, you will discover how to use Pandas in Python to both increase and decrease the sampling frequency of time series data.
After completing this tutorial, you will know:
About time series resampling, the two types of resampling, and the 2 main reasons why you need to use them.
How to use Pandas to upsample time series data to a higher frequency and interpolate the new observations.
How to use Pandas to downsample time series data to a lower frequency and summarize the higher frequency observations.
Kick-start your project with my new book Time Series Forecasting With Python, including step-by-step tutorials and the Python source code files for all examples.
Let’s get started.
Update Dec/2016: Fixed definitions of upsample and downsample.
Updated Apr/2019: Updated the link to dataset.
How To Resample and Interpolate Your Time Series Data With Python Photo by sung ming whang, some rights reserved.
Resampling
Resampling involves changing the frequency of your time series observations.
Two types of resampling are:
Upsampling: Where you increase the frequency of the samples, such as from minutes to seconds.
Downsampling: Where you decrease the frequency of the samples, such as from days to months.
In both cases, data must be invented.
In the case of upsampling, care may be needed in determining how the fine-grained observations are calculated using interpolation. In the case of downsampling, care may be needed in selecting the summary statistics used to calculate the new aggregated values.
There are perhaps two main reasons why you may be interested in resampling your time series data:
Problem Framing: Resampling may be required if your data is not available at the same frequency that you want to make predictions.
Feature Engineering: Resampling can also be used to provide additional structure or insight into the learning problem for supervised learning models.
There is a lot of overlap between these two cases.
For example, you may have daily data and want to predict a monthly problem. You could use the daily data directly or you could downsample it to monthly data and develop your model.
A feature engineering perspective may use observations and summaries of observations from both time scales and more in developing a model.
Let’s make resampling more concrete by looking at a real dataset and some examples.
Stop learning Time Series Forecasting the slow way!
Take my free 7-day email course and discover how to get started (with sample code).
Click to sign-up and also get a free PDF Ebook version of the course.
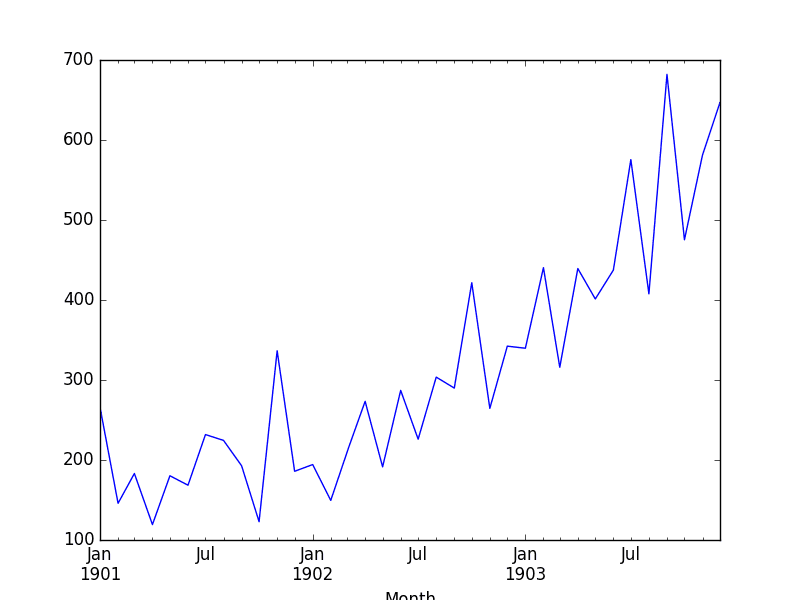
Shampoo Sales Dataset
This dataset describes the monthly number of sales of shampoo over a 3 year period.
The units are a sales count and there are 36 observations. The original dataset is credited to Makridakis, Wheelwright, and Hyndman (1998).
The timestamps in the dataset do not have an absolute year, but do have a month. We can write a custom date parsing function to load this dataset and pick an arbitrary year, such as 1900, to baseline the years from.
Below is a snippet of code to load the Shampoo Sales dataset using the custom date parsing function from read_csv().
Running this example loads the dataset and prints the first 5 rows. This shows the correct handling of the dates, baselined from 1900.
1
2
3
4
5
6
7
Month
1901-01-01 266.0
1901-02-01 145.9
1901-03-01 183.1
1901-04-01 119.3
1901-05-01 180.3
Name: Sales of shampoo over a three year period, dtype: float64
We also get a plot of the dataset, showing the rising trend in sales from month to month.
Plot of the Shampoo Sales Dataset
Upsample Shampoo Sales
The observations in the Shampoo Sales are monthly.
Imagine we wanted daily sales information. We would have to upsample the frequency from monthly to daily and use an interpolation scheme to fill in the new daily frequency.
The Pandas library provides a function called resample() on the Series and DataFrame objects. This can be used to group records when downsampling and making space for new observations when upsampling.
We can use this function to transform our monthly dataset into a daily dataset by calling resampling and specifying the preferred frequency of calendar day frequency or “D”.
Pandas is clever and you could just as easily specify the frequency as “1D” or even something domain specific, such as “5D.” See the further reading section at the end of the tutorial for the list of aliases that you can use.
Running this example prints the first 32 rows of the upsampled dataset, showing each day of January and the first day of February.
1
2
3
4
5
6
7
8
9
10
11
12
13
14
15
16
17
18
19
20
21
22
23
24
25
26
27
28
29
30
31
32
33
Month
1901-01-01 266.0
1901-01-02 NaN
1901-01-03 NaN
1901-01-04 NaN
1901-01-05 NaN
1901-01-06 NaN
1901-01-07 NaN
1901-01-08 NaN
1901-01-09 NaN
1901-01-10 NaN
1901-01-11 NaN
1901-01-12 NaN
1901-01-13 NaN
1901-01-14 NaN
1901-01-15 NaN
1901-01-16 NaN
1901-01-17 NaN
1901-01-18 NaN
1901-01-19 NaN
1901-01-20 NaN
1901-01-21 NaN
1901-01-22 NaN
1901-01-23 NaN
1901-01-24 NaN
1901-01-25 NaN
1901-01-26 NaN
1901-01-27 NaN
1901-01-28 NaN
1901-01-29 NaN
1901-01-30 NaN
1901-01-31 NaN
1901-02-01 145.9
We can see that the resample() function has created the rows by putting NaN values in the new values. We can see we still have the sales volume on the first of January and February from the original data.
Next, we can interpolate the missing values at this new frequency.
The Series Pandas object provides an interpolate() function to interpolate missing values, and there is a nice selection of simple and more complex interpolation functions. You may have domain knowledge to help choose how values are to be interpolated.
A good starting point is to use a linear interpolation. This draws a straight line between available data, in this case on the first of the month, and fills in values at the chosen frequency from this line.
Running this example, we can see interpolated values.
1
2
3
4
5
6
7
8
9
10
11
12
13
14
15
16
17
18
19
20
21
22
23
24
25
26
27
28
29
30
31
32
33
Month
1901-01-01 266.000000
1901-01-02 262.125806
1901-01-03 258.251613
1901-01-04 254.377419
1901-01-05 250.503226
1901-01-06 246.629032
1901-01-07 242.754839
1901-01-08 238.880645
1901-01-09 235.006452
1901-01-10 231.132258
1901-01-11 227.258065
1901-01-12 223.383871
1901-01-13 219.509677
1901-01-14 215.635484
1901-01-15 211.761290
1901-01-16 207.887097
1901-01-17 204.012903
1901-01-18 200.138710
1901-01-19 196.264516
1901-01-20 192.390323
1901-01-21 188.516129
1901-01-22 184.641935
1901-01-23 180.767742
1901-01-24 176.893548
1901-01-25 173.019355
1901-01-26 169.145161
1901-01-27 165.270968
1901-01-28 161.396774
1901-01-29 157.522581
1901-01-30 153.648387
1901-01-31 149.774194
1901-02-01 145.900000
Looking at a line plot, we see no difference from plotting the original data as the plot already interpolated the values between points to draw the line.
Shampoo Sales Interpolated Linear
Another common interpolation method is to use a polynomial or a spline to connect the values.
This creates more curves and can look more natural on many datasets. Using a spline interpolation requires you specify the order (number of terms in the polynomial); in this case, an order of 2 is just fine.
Running the example, we can first review the raw interpolated values.
1
2
3
4
5
6
7
8
9
10
11
12
13
14
15
16
17
18
19
20
21
22
23
24
25
26
27
28
29
30
31
32
33
Month
1901-01-01 266.000000
1901-01-02 258.630160
1901-01-03 251.560886
1901-01-04 244.720748
1901-01-05 238.109746
1901-01-06 231.727880
1901-01-07 225.575149
1901-01-08 219.651553
1901-01-09 213.957094
1901-01-10 208.491770
1901-01-11 203.255582
1901-01-12 198.248529
1901-01-13 193.470612
1901-01-14 188.921831
1901-01-15 184.602185
1901-01-16 180.511676
1901-01-17 176.650301
1901-01-18 173.018063
1901-01-19 169.614960
1901-01-20 166.440993
1901-01-21 163.496161
1901-01-22 160.780465
1901-01-23 158.293905
1901-01-24 156.036481
1901-01-25 154.008192
1901-01-26 152.209039
1901-01-27 150.639021
1901-01-28 149.298139
1901-01-29 148.186393
1901-01-30 147.303783
1901-01-31 146.650308
1901-02-01 145.900000
Reviewing the line plot, we can see more natural curves on the interpolated values.
Shampoo Sales Interpolated Spline
Generally, interpolation is a useful tool when you have missing observations.
Next, we will consider resampling in the other direction and decreasing the frequency of observations.
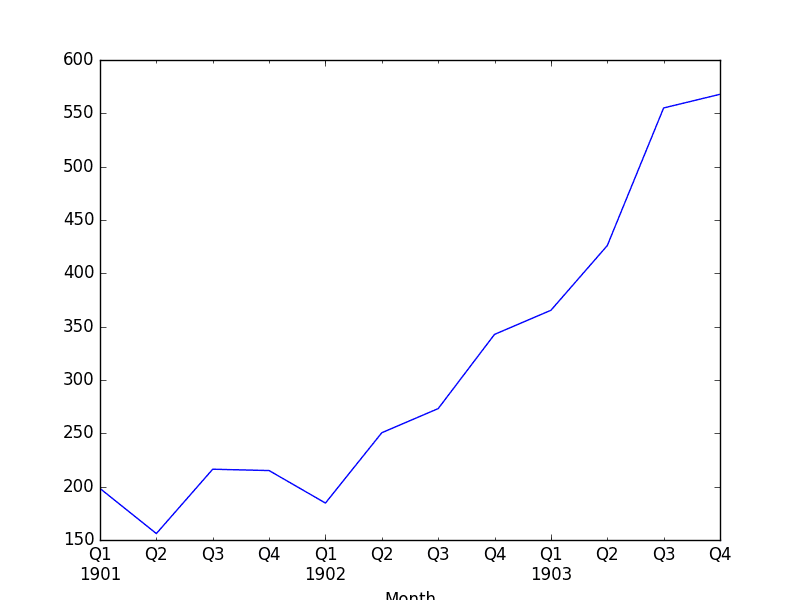
Downsample Shampoo Sales
The sales data is monthly, but perhaps we would prefer the data to be quarterly.
The year can be divided into 4 business quarters, 3 months a piece.
Instead of creating new rows between existing observations, the resample() function in Pandas will group all observations by the new frequency.
We could use an alias like “3M” to create groups of 3 months, but this might have trouble if our observations did not start in January, April, July, or October. Pandas does have a quarter-aware alias of “Q” that we can use for this purpose.
We must now decide how to create a new quarterly value from each group of 3 records. A good starting point is to calculate the average monthly sales numbers for the quarter. For this, we can use the mean() function.
Putting this all together, we get the following code example.
In this tutorial, you discovered how to resample your time series data using Pandas in Python.
Specifically, you learned:
About time series resampling and the difference and reasons between downsampling and upsampling observation frequencies.
How to upsample time series data using Pandas and how to use different interpolation schemes.
How to downsample time series data using Pandas and how to summarize grouped data.
Do you have any questions about resampling or interpolating time series data or about this tutorial?
Ask your questions in the comments and I will do my best to answer them.
Want to Develop Time Series Forecasts with Python?
(by the way, I assume it is _upsampled_, not upampled). I don’t understand why you need to put the mean if you are inserting NaNs. Wouldn’t it be sufficient just to write series.resample(‘D’)?
Jason, I have what’s hopefully a quick question that was prompted by the interpolation example you’ve given above.
I’ve been tasked with a monthly forecasting analysis. My original data is daily. If I aggregate it to month-level, this gives me only 24 usable observations so many models may struggle with that. It feels like I should be able to make more use of my richer, daily dataset for my problem.
I have heard somewhere (but can’t remember where or whether I imagined it!) that a workaround is to create “fake” monthly data by creating rolling sums say from 26th Dec to 26th January. So for December I would have 31 “fake months”, one starting on each day of December and ending on the corresponding day number in January. Is this a valid workaround for artificially increasing sample size in short time series for training models? I can see straight off the bat that autocorrelation is a massive issue but is it worth exploring or have I just dreamt that up.
Are there any other workarounds for working with short time series?
Perhaps the 24 obs provide sufficient information for making accurate forecasts.
I would advise you to develop and evaluate a suite of different models and focus on those representations that produce effective results.
Your idea of fake months seems useful only if it can expose more or different information to the learning algorithms not available by other means/representations.
I’d love to hear how you go with your forecast problem.
I have a timeseries data where I am using resample technique to downsample my data from 15 minute to 1 hour. The data is quite large ( values every 15 minutes for 1 year) so there are more than 30k rows in my original csv file.
I am using:
df[‘dt’] = pd.to_datetime(df[‘Date’] + ‘ ‘ + df[‘Time’])
df = df.set_index(‘dt’).resample(‘1H’)[‘KWH’].first().reset_index()
but after resampling I only get first day and last day correctly, all the intermediate values are filled with NAN. Can you help point what I might be doing wrong.
17 2016-01-01 17:00:00 4751.62 15.0 23.8 370.9
18 2016-01-01 18:00:00 4751.82 15.1 23.6 369.2
19 2016-01-01 19:00:00 4752.01 15.3 23.6 375.4
20 2016-01-01 20:00:00 4752.21 14.8 23.6 370.1
21 2016-01-01 21:00:00 4752.61 15.0 23.8 369.2
22 2016-01-01 22:00:00 4752.80 15.2 23.7 369.6
23 2016-01-01 23:00:00 4753.00 15.7 23.5 372.3
24 2016-01-02 00:00:00 NaN NaN NaN NaN
25 2016-01-02 01:00:00 NaN NaN NaN NaN
26 2016-01-02 02:00:00 NaN NaN NaN NaN
27 2016-01-02 03:00:00 NaN NaN NaN NaN
28 2016-01-02 04:00:00 NaN NaN NaN NaN
29 2016-01-02 05:00:00 NaN NaN NaN NaN
… … … … …
8034 2016-11-30 18:00:00 NaN NaN NaN NaN
8035 2016-11-30 19:00:00 NaN NaN NaN NaN
8036 2016-11-30 20:00:00 NaN NaN NaN NaN
8037 2016-11-30 21:00:00 NaN NaN NaN NaN
8038 2016-11-30 22:00:00 NaN NaN NaN NaN
8039 2016-11-30 23:00:00 NaN NaN NaN NaN
8040 2016-12-01 00:00:00 4811.96 14.8 24.8 364.3
8041 2016-12-01 01:00:00 4812.19 15.1 24.8 376.7
8042 2016-12-01 02:00:00 4812.42 15.1 24.7 373.1
8043 2016-12-01 03:00:00 4812.66 15.2 24.7 372.7
8044 2016-12-01 04:00:00 4812.89 14.9 24.7 370.9
Do you really think it makes sense to take monthly sales in January of 266 bottles of shampoo, then resample that to daily intervals and say you had sales of 266 bottles on the 1st Jan, 262.125806 bottles on the 2nd Jan ?
Instead of interpolating when resampling monthly sales to the daily interval, is there a function that would instead fill the daily values with the daily average sales for the month? This would be useful for data that represent aggregated values, where the sum of the dataset should remain constant regardless of the frequency… For example, if I need to upsample rainfall data, then the total rainfall needs to remain the same. Are there built-in functions that can do this?
Any pointers on how to do this? I essentially have a total monthly and an average daily for each month and need to interpolate daily values such that the total monthly is always honored. I haven’t had issue with the straight re-sampling and interpolating but have been spinning my wheels trying to honor the monthly totals.
Thanks for the input. If I place my avg mid month and interpolate it is close but not equal to avg * days in month. I was hoping to avoid a “stepped” plot and perhaps calculate an incremental increase/decrease per day for each month. I can manually make an example model in excel but lack the chops yet to pull off.
Thanks for a nice post. In my time series data, I have two feature columns i.e. Latitude and Longitude and index is datetime.
Since these GPS coordinates are captured at infrequent time intervals, I want to resample my data in the fixed time interval bin, for example: one GPS coordinate in every 5sec time interval.
I have a question regarding down sampling data from daily to weekly or monthly data,
If my data is multivariate time series for example it has a categorical variables and numeric variables, how can I do the down sampling for each column automatically, is there a simple way of doing this?
Can we use (if so, how) resampling to balance 2 unequal classes in the data? Example, in predicting stock price direction, the majority class will be “1” (price going up) and minority class will be “-1” (price going down). Problem is that the classifier may predict most or all labels as “1” and still have a high accuracy, thereby showing a bias towards the majority class.
Can you please tell how can i down sample my label data, label column only consists of 0 and 1with total length of 2 lac rows . I need to down sample this column at 20 hrtz means at 50ms .
Thanks! That was really helpful, but my problem is a bit different. I have data recorded at random time intervals and I need to interpolate values at 5-min timesteps, as shown below:
Hi ! I’m trying to get a percentual comparison of CPI between two years. In this particular case, I have data with columns:
‘Date’ (one date per week of year, for three years)
‘CPI’
and others that for this are not important.
The thing is I have to divide each CPI by its year-ago-value. For example, if I have the CPI of week 5 year 2010, I have to divide it by CPI of week 5 year 2009.
I’ve already managed to get the week of the year and year of each observation, but I can’t figure out how to get the observation needed, as they are both observations from the same data frame. Any help will be really appreciated.
So sorry. I thought I attached a part. This is a header of the data (not sure if it will do for “intimately familiarization” but hope it does clarify):
Thanks you for the helpful guide. I am currently working to interpolate daily stock returns from weekly returns. I know I have to keep the total cumulative return constant but I am still confused about the procedure. Could you give me some hints on how to write my function?
Sir, I’m regularly following your posts.It’s very informative.I really appreciate your efforts.
Now I’m working on a dataset having 6 months of daily fuel sale data from Feb 2018 to July 2018. In that dataset one complete month data for MAY is missing. I want to forecast daily fuel sale for august month.I have no idea how to deal with 1 missing month.Shall I do analysis with feb,mar,april data only or need to interpolate data for 1 month May.
It would be grateful if you give any suggestion on this problem.
Thanking you in advance sir..!!
Hi Jason,
Thanks a lot for the post!. Very helpful.
Had a question for you – I am trying to do a resampling by week for number of employees quitting the job. I have used mean() to aggregate the samples at the week level. And I am not sure how the mean is calculated in this case and why it would give me negative values. Any help here is much appreciated:
“Imagine we wanted daily sales information.” This suggests Python magically adds information which is not there. It is a bit misleading. If you do not have daily data you do not have it. It must be interpolated.
I’m tying to resample data(pands.DataFrame) but there is problem.
I have some time sequence data (it is stored in data frame) and tried to downsample the data using pandas resample(), but the interpolation obviously does not work.
The original data has a float type time sequence (data of 60 seconds at 0.0009 second intervals), but in order to specify the ‘rule’ of pandas resample (), I converted it to a date-time type time series.
(pd.to_datetime (df, unit = ‘s’, origin = pd.Timestamp (datetime.datetime.now ())))
Then I tried to downsample the time sequence data
(df = df.resample (‘ms’). Interpolate ())
However, it seems that too much information was lost from the original data.
I think that the form of the graph does not change so much, since the sampling frequency has only been changed from 1111.11 Hz to 1000 Hz.
(Actually quite a few information is lost.)
Do not you know the reason or solution of this problem?
I think that the rounding occurs when converting a time sequence from a float type to a date-time type, which may affect something the result.
(Warning For float arg, precision rounding might happen. To prevent unexpected behavior use a fixed-width exact type. https://pandas.pydata.org/pandas-docs/stable/reference/api/pandas.to_datetime.html)
For example, the correct input time of 2nd row should be 2019-02-02 12: 00: 25.0009, not 2019-02-02 12: 00: 25.000900030
and I think the correct output value of 2nd row(2019-02-02 12: 00: 25.001) should be about -0.0045(=- 0.005460 +(- 0.003701)/2) or neary -0.005, because output time 2019-02-02 12: 00: 25.001 is between 2019-02-02 12: 00: 25.000900030 and 2019-02-02 12: 00: 25.001800060.
Jason,
Thank you for replying.
I also think there is no doubt that information will be lost when we resample data. However, in this case, it is a problem that the outline of the graph clearly changed.
If we take data for 1 minute at sampling frequency 1111.11 Hz, the number of points obtained exceeds 60,000 points.
Even if we downsample it at 1000 Hz, the number of data we lost is at most around 6000 points.
However, when we plot the resampled data, the envelope of the graph will change clearly as if it were downsampled at 10 Hz.
As you can see from a part of the data I sent before, interpolation obviously does not work well and I do not know the cause and I am in trouble.
Do you know what causes this problem and how to deal with it?
I recommend designing experiments to help tease apart the cause of the issue, e.g. look at actual data values, and at the results of resampled data at different frequencies. Perhaps simple averaging over a large number of small values is causing the effect?
Perhaps question whether large changes matter for the problem you are solving?
Could you help me with interpolation methods that are available. Say the sales data is not the total sales till that day, but sales registered for a particular time period. e.g. i have sales of a week given, and the data is for 3 years. So, if i want to resample it to daily frequency, and then interpolate, i would want the week’s sale to be distributed in the days of the week.
I hope i am able to convey my problem, wherein linear interpolation is not the method i am looking for as the data is not about total sales till date but sales in a week
Yes, you could resample the series to daily. The daily values won’t be accurate, they will be something like an average of the weekly value divided by 7.
I have a very large dataset(>2 GB) with timestamp as one of the columns, looks like below.
2248444710306450
2248444710454040
2248444710596550
2248444710738800
2248444710880930
2248444711024970
2248444711166630
2248444711309100
2248444711459830
2248444711602180
2248444711743050
2248444712478090
2248444712521820
2248444712561980
2248444712600190
2248444712674360
2248444712712680
2248444712749870
2248444712788060
2248444712825010
2248444712863270
2248444712900350
2248444712938420
2248444713544750
2248444713586800
2248444713628480
I need to convert it to datetime and do downsampling to have observations per each ms now it is in ns.
Converting it with pd.to_datetime gave pandas._libs.tslib.OutOfBoundsDatetime: cannot convert input with unit ‘ms’
Can I downsample directly from the timestamp? Any help is much appreciated as I need to plot the data and build a model after I successfully plot and analyse the data.
Perhaps try loading the data progressively?
Perhaps try working with a small sample instead?
Perhaps try running the code on an AWS EC2 with lots of RAM?
How to Interpolate missing values in a time series with a seasonal cycle?
Dies scipy or pandas have any function for it? I can take mean of previous seasonal timestep and if it is ok then how it automatically detect its previous seasonal timesteps average?
I don’t know what I’m doing wrong but, I can’t replicate this tutorial. I had lots of trouble just loading the data and the first plot I obtained has nothing to do with yours ! I wasn’t able to go further than the ‘upsampled = series.resample(‘D’)’ part.
What type of interpolation can be used when the data is first increasing and then decreasing and then increasing with respect to time.
Because when I used the spline interpolation it missed my decreasing value and just made my data increasing with respect to time.
thank you very much for this detailed article. I have a question on upsampling of returns – when we convert weekly frequency to daily frequency, how is the logic determined? for example, if i have a weekly return of 7%, it should translate to a daily return of 1% when i interpolate. Extending it to your above example of shampoo sales, the monthly shampoo sales are in the range of ~200s. When this is converted to daily frequency using interpolation, the daily sales are also in the range of 200s! This does not seem intuitive, i would expect daily sales to be in the range of ~66 (200/30). Am i missing something here?
Hi Jason, great tutorial on resampling and interpolating, the best found so far, thank you.
I have a question: I run the “Upsample Shampoo Sales” code exactly as you have written it, though after running the code upsampled = series.resample(‘D’) , I get the following AttributeError: ‘DatetimeIndexResampler’ object has no attribute ‘head’
Any idea why this happens?
In addition, I have yearly data from 2008 to 2018 and I want to upsample to monthly data and then interpolate. Could you give me a hand on creating the definition function with the use of datetime.strptime? I am a beginner in Python. Thank you very much 🙂
I have a time-series where my data have different intervals (The difference between records is twenty-five minutes, other times is thirty minutes, and so on).
I have used a resample to make it with the same interval. Then I have used forward propagation for the missing values.
I have two case studies. I tested the model accuracy with this technique and without this technique. In the first case, the accuracy has improved, however, in the second case, the accuracy has dropped.
What could be the motive for the resampling is causing an accuracy drop (when compared to other models)? Could be for the fact that the resampling is creating more data and the model has more difficulty in generalized?
Thanks in advance, and sorry for some English misleading since it is not my first language.
Maybe I am getting this wrong but I used resampling on data that is intended to be used with an LSTM model.
So I had run the model before and after the resampling was done.
However, the model accuracy was worse with the resampling done. I had use resampling as a pre-processing method. I thought that with the resampling since my time-series have different intervals, the resampling method could help to improve the accuracy concerning a base model.
For example, the accuracy without resampling is 88%, and with resample is 63%. My doubt was because if one of the downsides of using resampling could be for the fact that the resampling is creating more data and the model has more difficulty in generalized?
Sorry to bother you, and again thanks for the response!
I have data for two days. What I want to do is resample the data for getting 20 values/second for the seconds that I have data. I don’t want to resample for the seconds that are not present in the data.
If I use :
df.set_index(‘datetime’).resample(‘5ms’).mean() ;
it resamples the whole dataset.
How can I resample only for the timestamp givenin the dataset?
I got the following error message running unsampled example above.
C:/Users/shr015/gbr_ts_anomoly/data/real/test.py:2: FutureWarning: The pandas.datetime class is deprecated and will be removed from pandas in a future version. Import from datetime module instead.
from pandas import datetime
Traceback (most recent call last):
File “C:\Program Files\JetBrains\PyCharm Community Edition 2020.2.2\plugins\python-ce\helpers\pydev\pydevd.py”, line 1448, in _exec
pydev_imports.execfile(file, globals, locals) # execute the script
File “C:\Program Files\JetBrains\PyCharm Community Edition 2020.2.2\plugins\python-ce\helpers\pydev\_pydev_imps\_pydev_execfile.py”, line 18, in execfile
exec(compile(contents+”\n”, file, ‘exec’), glob, loc)
File “C:/Users/shr015/gbr_ts_anomoly/data/real/test.py”, line 11, in
print(upsampled.head(32))
File “C:\Users\shr015\.conda\envs\deeplearning\lib\site-packages\pandas\core\resample.py”, line 115, in __getattr__
return object.__getattribute__(self, attr)
AttributeError: ‘DatetimeIndexResampler’ object has no attribute ‘head’
I have an hourly time series data and I want to resample it to hours so that I can have an observation for each hour of the day (since some days I only have 2 or 3 observations). But instead of getting NaN, I get zeroes. I also have a gap of about 3 months. When I do the interpolation, this gap is not filled. Do you have any suggestions?
Thank you so much for your tutorials, it helped me so much to understand deep learning concepts and workflow.
I am currently working on an economic prediction model, and I have a problem about the sampling rate of different indicators. For example, ‘Interest Rate’ would be sampled daily and ‘Inflation Rate’ would be sampled monthly and some datasets sampling annually, resulting in a lot of NaN values when these features were combined together at a daily sample rate.
I was wondering if there is any workaround for it? I couldn’t really find the answer online and books. Most of the tutorials online deals with NaNs that is in a small amount compared to the whole dataset while in my dataset, ‘Inflation’ column would be 90% NaNs if upsampled to a daily rate.
You could compare the performance of models on data that has a normalized frequency to a model that was fit on data with different frequency and see if it makes a big difference.
I have recording following EEG data format with 256hz but I need to downsample data to 120hz. I see index is showing like 0,1…,255,0,1,2,..255.0
I used df = df.sample(frac = 120) and it show similar pattern of original data. Is it okay for downsampling or Should I apply any other technique to get a better way of downsampling?
If the pattern you mentioned is a much lower frequency, the downsample will still preserve that. Not surprised! Why you want to downsample it and why you do not want to see the pattern after the downsample? Answering that might help you see what is the “better way”. Or, depends on your goal, may be downsample is not the best way to pre-process your data at all.
Thanks for your reply. I actually collected other sensor data where the sample rate is 120. So I need to downsample EEG data. I used df = df.sample(frac = 120) to downsample EEG data and pattern is similar to original data. I don’t know any other way to do it. If you know please let me know.
If you know what you’re looking for, you may use a different method for preprocessing. One trivial thing to me may be to do a Fourier transform and express the data in frequency domain rather than time domain, in case you know you’re looking for something in frequency. Just an example.
Hi,
I have two datasets that I want to use to build a predictive model using linear regression,, but I have a question about using resampling methods to reduce the size of the data from daily to monthly so that I can compare it to a monthly unemployment rate. The monthly unemployment rate is my response variable to be predicted. Is that a correct approach in building a predictive linear regression model?
Yes. Usually in this case, the resampling is done because you want to align the data frequency. For example, some of your independent variables are only monthly, hence it make sense to align everything to monthly.
Hi! What would be the best way to resample the data to a constant frequency, like 100 samples/sec. I have an irregular data. In Matlab, I used “resample(signal, timestamps,100,’spline’)”, to make the irregular data to a constant 100 samples/second using spline interpolation. What is the best equivalent way in python?
hello.
i have a question regarding downsampling, as in upsampling we see that the original values corresponding the timestamp are not changed and “nan” are inserted instead which can be interpolated later as desired. But in downsampling the original values are changed along with timestamp downsampled. for example a data set containing an instantaneous voltage at every particular minute and we want to resample our dataset for hourly data, after downsampling the timestamp is correct but the corresponding instantaneous voltages are no more the same but are changed to mean or some other function.
how can we recover the the original values for instantaneous quantities ? because these values are very important for further modelling.
I have a question regarding the efficiency or the speed of the interpolation in case of upsampling or an aggregate method in case of downsampling.
Is there a way that it can be computed parallely or speed up the process as i have large dataset, divided over many parquet files. Where each file –> sample has its own interpolation rate.
The way that i do it is looping over the files and then upsample or downsample based on what rate is associated with that sample and this is taking too much time
For detailes i need to upsample over 300,000 samples –> is there anyway to speed up the process ??
These are the data from a company’s financial reports, which were not available until 2010. I think gathering their quarterly reports is the farthest I can go. Can I still do the regression at this point?
What if the data is 2D arrays for each date (e.g. 4X10: 4 rows and 10 columns)? how do we read it into dataframes? Does the below work? and will the interpolation be done in 2D?
I have monthly tourist dataset(no. of tourist visiting a hill station), I want to upsample it on weekly basis. Can you suggest which technique would work best?


Kinda feel like you inverted upsampling and downsampling.
https://en.wikipedia.org/wiki/Upsampling
https://en.wikipedia.org/wiki/Decimation_(signal_processing)
Thanks Alex, fixed.
Hi,
in the upsample section, why did you write
upampled = series.resample(‘D’).mean()
(by the way, I assume it is _upsampled_, not upampled). I don’t understand why you need to put the mean if you are inserting NaNs. Wouldn’t it be sufficient just to write series.resample(‘D’)?
Hi David,
You are right, I’ve fixed up the examples.
Hello,
I think it is necessary to add “asfreq()”, i.e.:
upsampled = series.resample(‘D’).asfreq()
because in new versions of pandas resample is just a grouping operation and then you have to aggregate functions.
Hello Jason,
You didn’t!
Jason, I have what’s hopefully a quick question that was prompted by the interpolation example you’ve given above.
I’ve been tasked with a monthly forecasting analysis. My original data is daily. If I aggregate it to month-level, this gives me only 24 usable observations so many models may struggle with that. It feels like I should be able to make more use of my richer, daily dataset for my problem.
I have heard somewhere (but can’t remember where or whether I imagined it!) that a workaround is to create “fake” monthly data by creating rolling sums say from 26th Dec to 26th January. So for December I would have 31 “fake months”, one starting on each day of December and ending on the corresponding day number in January. Is this a valid workaround for artificially increasing sample size in short time series for training models? I can see straight off the bat that autocorrelation is a massive issue but is it worth exploring or have I just dreamt that up.
Are there any other workarounds for working with short time series?
Thanks!
Hi Carmen,
Perhaps the 24 obs provide sufficient information for making accurate forecasts.
I would advise you to develop and evaluate a suite of different models and focus on those representations that produce effective results.
Your idea of fake months seems useful only if it can expose more or different information to the learning algorithms not available by other means/representations.
I’d love to hear how you go with your forecast problem.
I have a timeseries data where I am using resample technique to downsample my data from 15 minute to 1 hour. The data is quite large ( values every 15 minutes for 1 year) so there are more than 30k rows in my original csv file.
I am using:
df[‘dt’] = pd.to_datetime(df[‘Date’] + ‘ ‘ + df[‘Time’])
df = df.set_index(‘dt’).resample(‘1H’)[‘KWH’].first().reset_index()
but after resampling I only get first day and last day correctly, all the intermediate values are filled with NAN. Can you help point what I might be doing wrong.
Onse resampled, you need to interpolate the missing data.
This is how my data looks before resampling :
24 01/01/16 06:00:04 4749.28 15.1 23.5 369.6 2016-01-01 06:00:04
25 01/01/16 06:15:04 4749.28 14.7 23.5 369.6 2016-01-01 06:15:04
26 01/01/16 06:30:04 4749.28 14.9 23.5 369.6 2016-01-01 06:30:04
27 01/01/16 06:45:04 4749.47 14.9 23.5 373.1 2016-01-01 06:45:04
28 01/01/16 07:00:04 4749.47 15.1 23.5 373.1 2016-01-01 07:00:04
29 01/01/16 07:15:04 4749.47 15.2 23.5 373.1 2016-01-01 07:15:04
… … … … … … …
2946 31/01/16 16:30:04 4927.18 15.5 24.4 373.1 2016-01-31 16:30:04
2947 31/01/16 16:45:04 4927.24 15.0 24.4 377.6 2016-01-31 16:45:04
2948 31/01/16 17:00:04 4927.30 15.2 24.4 370.5 2016-01-31 17:00:04
and this is how it looks after resampling:
df[‘dt’] = pd.to_datetime(df[‘Date’] + ‘ ‘ + df[‘Time’])
df = df.set_index(‘dt’).resample(‘1H’)[‘KWH’,’OCT’,’RAT’,’CO2′].first().reset_index()
17 2016-01-01 17:00:00 4751.62 15.0 23.8 370.9
18 2016-01-01 18:00:00 4751.82 15.1 23.6 369.2
19 2016-01-01 19:00:00 4752.01 15.3 23.6 375.4
20 2016-01-01 20:00:00 4752.21 14.8 23.6 370.1
21 2016-01-01 21:00:00 4752.61 15.0 23.8 369.2
22 2016-01-01 22:00:00 4752.80 15.2 23.7 369.6
23 2016-01-01 23:00:00 4753.00 15.7 23.5 372.3
24 2016-01-02 00:00:00 NaN NaN NaN NaN
25 2016-01-02 01:00:00 NaN NaN NaN NaN
26 2016-01-02 02:00:00 NaN NaN NaN NaN
27 2016-01-02 03:00:00 NaN NaN NaN NaN
28 2016-01-02 04:00:00 NaN NaN NaN NaN
29 2016-01-02 05:00:00 NaN NaN NaN NaN
… … … … …
8034 2016-11-30 18:00:00 NaN NaN NaN NaN
8035 2016-11-30 19:00:00 NaN NaN NaN NaN
8036 2016-11-30 20:00:00 NaN NaN NaN NaN
8037 2016-11-30 21:00:00 NaN NaN NaN NaN
8038 2016-11-30 22:00:00 NaN NaN NaN NaN
8039 2016-11-30 23:00:00 NaN NaN NaN NaN
8040 2016-12-01 00:00:00 4811.96 14.8 24.8 364.3
8041 2016-12-01 01:00:00 4812.19 15.1 24.8 376.7
8042 2016-12-01 02:00:00 4812.42 15.1 24.7 373.1
8043 2016-12-01 03:00:00 4812.66 15.2 24.7 372.7
8044 2016-12-01 04:00:00 4812.89 14.9 24.7 370.9
Do you really think it makes sense to take monthly sales in January of 266 bottles of shampoo, then resample that to daily intervals and say you had sales of 266 bottles on the 1st Jan, 262.125806 bottles on the 2nd Jan ?
No, it is just an example of how to use the API.
The domain/domain experts may indicate suitable resampling and interpolation schemes.
Instead of interpolating when resampling monthly sales to the daily interval, is there a function that would instead fill the daily values with the daily average sales for the month? This would be useful for data that represent aggregated values, where the sum of the dataset should remain constant regardless of the frequency… For example, if I need to upsample rainfall data, then the total rainfall needs to remain the same. Are there built-in functions that can do this?
Sure, you can do this. You will have to write some code though.
we just had an intern do this with rainfall data. it’s not too hard! thanks Jason for the helpful guide, this was just was i was searching for!
Glad to hear it!
Hi Jason,
Any pointers on how to do this? I essentially have a total monthly and an average daily for each month and need to interpolate daily values such that the total monthly is always honored. I haven’t had issue with the straight re-sampling and interpolating but have been spinning my wheels trying to honor the monthly totals.
The best you can do is (value / num days in month), unless you can get the original data.
Thanks for the input. If I place my avg mid month and interpolate it is close but not equal to avg * days in month. I was hoping to avoid a “stepped” plot and perhaps calculate an incremental increase/decrease per day for each month. I can manually make an example model in excel but lack the chops yet to pull off.
Mo# #Days CumDays AvgRate MoCum RateIncrease/Day
1 31 31 60 1860 3.75
2 28 59 125 3500 0.603448276
3 31 90 100 3100 -2.071659483
4 30 120 60 1800 -0.575813404
5 31 151 50 1550 -0.103169103
Mo Day CumDays DailyRate MoCumCheck
0 0 0 0 0
1 1 1 3.75 3.75
1 2 2 7.5 11.25
1 3 3 11.25 22.5
1 4 4 15 37.5
1 5 5 18.75 56.25
1 6 6 22.5 78.75
1 7 7 26.25 105
1 8 8 30 135
1 9 9 33.75 168.75
1 10 10 37.5 206.25
1 11 11 41.25 247.5
1 12 12 45 292.5
1 13 13 48.75 341.25
1 14 14 52.5 393.75
1 15 15 56.25 450
1 16 16 60 510
1 17 17 63.75 573.75
1 18 18 67.5 641.25
1 19 19 71.25 712.5
1 20 20 75 787.5
1 21 21 78.75 866.25
1 22 22 82.5 948.75
1 23 23 86.25 1035
1 24 24 90 1125
1 25 25 93.75 1218.75
1 26 26 97.5 1316.25
1 27 27 101.25 1417.5
1 28 28 105 1522.5
1 29 29 108.75 1631.25
1 30 30 112.5 1743.75
1 31 31 116.25 1860
2 1 32 116.8534483 116.8534483
2 2 33 117.4568966 234.3103448
2 3 34 118.0603448 352.3706897
2 4 35 118.6637931 471.0344828
2 5 36 119.2672414 590.3017241
2 6 37 119.8706897 710.1724138
2 7 38 120.4741379 830.6465517
2 8 39 121.0775862 951.7241379
2 9 40 121.6810345 1073.405172
2 10 41 122.2844828 1195.689655
2 11 42 122.887931 1318.577586
2 12 43 123.4913793 1442.068966
2 13 44 124.0948276 1566.163793
2 14 45 124.6982759 1690.862069
2 15 46 125.3017241 1816.163793
2 16 47 125.9051724 1942.068966
2 17 48 126.5086207 2068.577586
2 18 49 127.112069 2195.689655
2 19 50 127.7155172 2323.405172
2 20 51 128.3189655 2451.724138
2 21 52 128.9224138 2580.646552
2 22 53 129.5258621 2710.172414
2 23 54 130.1293103 2840.301724
2 24 55 130.7327586 2971.034483
2 25 56 131.3362069 3102.37069
2 26 57 131.9396552 3234.310345
2 27 58 132.5431034 3366.853448
2 28 59 133.1465517 3500
3 1 60 131.0748922 131.0748922
3 2 61 129.0032328 260.078125
3 3 62 126.9315733 387.0096983
3 4 63 124.8599138 511.8696121
…
Well done!
Hello Jason,
Thanks for a nice post. In my time series data, I have two feature columns i.e. Latitude and Longitude and index is datetime.
Since these GPS coordinates are captured at infrequent time intervals, I want to resample my data in the fixed time interval bin, for example: one GPS coordinate in every 5sec time interval.
Is there a way to do it?
Sounds like you could use a linear interpolation for time and something like linear for the spatial coordinates.
“something like linear for the spatial coordinates”, linear what actually?
Linear means a line/plane or a sum of inputs or weighted inputs (e.g. linear combination).
Hello Jason,
I have a question regarding down sampling data from daily to weekly or monthly data,
If my data is multivariate time series for example it has a categorical variables and numeric variables, how can I do the down sampling for each column automatically, is there a simple way of doing this?
Thanks in advance
You may need to do each column one at a time.
Hi Jason,
Can we use (if so, how) resampling to balance 2 unequal classes in the data? Example, in predicting stock price direction, the majority class will be “1” (price going up) and minority class will be “-1” (price going down). Problem is that the classifier may predict most or all labels as “1” and still have a high accuracy, thereby showing a bias towards the majority class.
Is there a way to fix this?
Yes, this post suggests some algorithms for balancing classes:
https://machinelearningmastery.com/tactics-to-combat-imbalanced-classes-in-your-machine-learning-dataset/
I don’t have material on balancing classes for sequence classification though.
Can you please tell how can i down sample my label data, label column only consists of 0 and 1with total length of 2 lac rows . I need to down sample this column at 20 hrtz means at 50ms .
hi im using the code below is this correct my data is a signal stored in a single row
from scipy import signal
resample_signal=scipy.signal.resample(x,256)
plt.plot(resample_signal)
I don’t know. If the plot looks good to you, then yes.
Thanks! That was really helpful, but my problem is a bit different. I have data recorded at random time intervals and I need to interpolate values at 5-min timesteps, as shown below:
Input:
——-
2018-01-01 00:04 | 10.00
2018-01-01 00:09 | 12.00
2018-01-01 00:12 | 10.00
2018-01-01 00:14 | 15.00
2018-01-01 00:18 | 20.00
The needed output:
————————
2018-01-01 00:00 | 08.40
2018-01-01 00:05 | 10.40
2018-01-01 00:10 | 11.90
2018-01-01 00:15 | 16.10
2018-01-01 00:20 | 21.50
Hope that is clear enough!
Really appreciate your help!
You might need to read up on the resample/interpolate API in order to customize the tool for this specific case.
Hi ! I’m trying to get a percentual comparison of CPI between two years. In this particular case, I have data with columns:
‘Date’ (one date per week of year, for three years)
‘CPI’
and others that for this are not important.
The thing is I have to divide each CPI by its year-ago-value. For example, if I have the CPI of week 5 year 2010, I have to divide it by CPI of week 5 year 2009.
I’ve already managed to get the week of the year and year of each observation, but I can’t figure out how to get the observation needed, as they are both observations from the same data frame. Any help will be really appreciated.
Sorry, I’m not intimately familiar with your dataset. I don’t know how I can help exactly.
So sorry. I thought I attached a part. This is a header of the data (not sure if it will do for “intimately familiarization” but hope it does clarify):
Date CPI
05-02-2010 211.0963582
12-02-2010 211.2421698
19-02-2010 211.2891429
26-02-2010 211.3196429
05-03-2010 211.3501429
12-03-2010 211.3806429
19-03-2010 211.215635
26-03-2010 211.0180424
02-04-2010 210.8204499
09-04-2010 210.6228574
16-04-2010 210.4887
23-04-2010 210.4391228
30-04-2010 210.3895456
Hello Jason,
Thanks you for the helpful guide. I am currently working to interpolate daily stock returns from weekly returns. I know I have to keep the total cumulative return constant but I am still confused about the procedure. Could you give me some hints on how to write my function?
Thanks
What problem are you having exactly? Do the examples not help?
can i solve this problem with LSTMs? and how to do that?
The LSTM can interpolate. You can train the model as a generator and use it to generate the next point given the prior input sequence.
Hi ,
How to take care of categorical variables while re-sampling.
Good question, persist them forward.
Sir, I’m regularly following your posts.It’s very informative.I really appreciate your efforts.
Now I’m working on a dataset having 6 months of daily fuel sale data from Feb 2018 to July 2018. In that dataset one complete month data for MAY is missing. I want to forecast daily fuel sale for august month.I have no idea how to deal with 1 missing month.Shall I do analysis with feb,mar,april data only or need to interpolate data for 1 month May.
It would be grateful if you give any suggestion on this problem.
Thanking you in advance sir..!!
Perhaps try modeling using on one or two prior months?
Perhaps try imputing?
Perhaps try methods that can handle missing data, e.g. Masking in LSTMs?
Hi Jason,
Thanks a lot for the post!. Very helpful.
Had a question for you – I am trying to do a resampling by week for number of employees quitting the job. I have used mean() to aggregate the samples at the week level. And I am not sure how the mean is calculated in this case and why it would give me negative values. Any help here is much appreciated:
Data before Resampling: (Index = date_series)
date_series company year first_day_of_week date_of_attendance attrition_count week
1/1/2018 2018 0 1
1/2/2018 AAA 2018 12/31/2017 1/2/2018 2 1
1/3/2018 AAA 2018 12/31/2017 1/3/2018 0 1
1/4/2018 AAA 2018 12/31/2017 1/4/2018 0 1
1/5/2018 AAA 2018 12/31/2017 1/5/2018 1 1
1/6/2018 AAA 2018 12/31/2017 1/6/2018 1 1
1/7/2018 AAA 2018 1/7/2018 1/7/2018 0 1
Code used for Resampling:
# Resampling to weekly frequency
df_week = df_test.resample(‘W’).mean()
Data after resampling:
week year attrition_count
1 2018 -0.554218343
That is odd, perhaps inspect the groups of data before calculating the mean to see exactly what is contributing?
Thanks for the article.
“Imagine we wanted daily sales information.” This suggests Python magically adds information which is not there. It is a bit misleading. If you do not have daily data you do not have it. It must be interpolated.
Thanks.
Hi Jason,
Thanks for the helpful post!
I’m tying to resample data(pands.DataFrame) but there is problem.
I have some time sequence data (it is stored in data frame) and tried to downsample the data using pandas resample(), but the interpolation obviously does not work.
The original data has a float type time sequence (data of 60 seconds at 0.0009 second intervals), but in order to specify the ‘rule’ of pandas resample (), I converted it to a date-time type time series.
(pd.to_datetime (df, unit = ‘s’, origin = pd.Timestamp (datetime.datetime.now ())))
Then I tried to downsample the time sequence data
(df = df.resample (‘ms’). Interpolate ())
However, it seems that too much information was lost from the original data.
I think that the form of the graph does not change so much, since the sampling frequency has only been changed from 1111.11 Hz to 1000 Hz.
(Actually quite a few information is lost.)
Do not you know the reason or solution of this problem?
I think that the rounding occurs when converting a time sequence from a float type to a date-time type, which may affect something the result.
(Warning For float arg, precision rounding might happen. To prevent unexpected behavior use a fixed-width exact type.
https://pandas.pydata.org/pandas-docs/stable/reference/api/pandas.to_datetime.html)
For example, the correct input time of 2nd row should be 2019-02-02 12: 00: 25.0009, not 2019-02-02 12: 00: 25.000900030
and I think the correct output value of 2nd row(2019-02-02 12: 00: 25.001) should be about -0.0045(=- 0.005460 +(- 0.003701)/2) or neary -0.005, because output time 2019-02-02 12: 00: 25.001 is between 2019-02-02 12: 00: 25.000900030 and 2019-02-02 12: 00: 25.001800060.
input
0 2019-02-02 12: 00: 25.000000000 – 0.007239
1 2019-02-02 12: 00: 25.000900030 – 0.005460
2 2019-02-02 12: 00: 25.001800060 – 0.003701
3 2019-02-02 12: 00: 25.002700090 – 0.001966
4 2019-02-02 12: 00: 25.003599882 – 0.000256
5 2019-02-02 12: 00: 25.004499912 0.001427
6 2019-02-02 12: 00: 25.005399942 0.003081
7 2019-02-02 12: 00: 25.006299973 0.004704
8 2019-02-02 12: 00: 25.007200003 0.006295
9 2019-02-02 12: 00: 25.008100033 0.007850
10 2019-02-02 12: 00: 25.009000063 0.009369
11 2019-02-02 12: 00: 25.009900093 0.010851
12 2019-02-02 12: 00: 25.010799885 0.012293
13 2019-02-02 12: 00: 25.011699915 0.013695
14 2019-02-02 12: 00: 25.012599945 0.015055
15 2019-02-02 12: 00: 25.013499975 0.016372
16 2019-02-02 12: 00: 25.014400005 0.017645
17 2019-02-02 12: 00: 25.015300035 0.018874
18 2019-02-02 12: 00: 25.016200066 0.020057
19 2019-02-02 12: 00: 25.017100096 0.021193
20 2019-02-02 12: 00: 25.017999887 0.022283
21 2019-02-02 12: 00: 25.018899918 0.023326
22 2019-02-02 12: 00: 25.019799948 0.024322
23 2019-02-02 12: 00: 25.020699978 0.025270
24 2019-02-02 12: 00: 25.021600008 0.026170
25 2019-02-02 12: 00: 25.022500038 0.027023
26 2019-02-02 12: 00: 25.023400068 0.027828
27 2019-02-02 12: 00: 25.024300098 0.028587
28 2019-02-02 12: 00: 25.025199890 0.029299
29 2019-02-02 12: 00: 25.026099920 0.029964
… … …
output
2019-02-02 12: 00: 25.000 – 0.007239
2019-02-02 12: 00: 25.001 – 0.007142
2019-02-02 12: 00: 25.002 – 0.007046
2019-02-02 12: 00: 25.003 – 0.006950
2019-02-02 12: 00: 25.004 – 0.006853
2019-02-02 12: 00: 25.005 – 0.006757
2019-02-02 12: 00: 25.006 – 0.006661
2019-02-02 12: 00: 25.007 – 0.006564
2019-02-02 12: 00: 25.008 – 0.006468
2019-02-02 12: 00: 25.009 – 0.006372
2019-02-02 12: 00: 25.010 – 0.006276
2019-02-02 12: 00: 25.011 – 0.006179
2019-02-02 12: 00: 25.012 – 0.006083
2019-02-02 12: 00: 25.013 – 0.005987
2019-02-02 12: 00: 25.014 – 0.005890
2019-02-02 12: 00: 25.015 – 0.005794
2019-02-02 12: 00: 25.016 – 0.005698
2019-02-02 12: 00: 25.017 – 0.005601
2019-02-02 12: 00: 25.018 – 0.005505
2019-02-02 12: 00: 25.019 – 0.005409
2019-02-02 12: 00: 25.020 – 0.005312
2019-02-02 12: 00: 25.021 – 0.005216
2019-02-02 12: 00: 25.022 – 0.005120
2019-02-02 12: 00: 25.023 – 0.005023
2019-02-02 12: 00: 25.024 – 0.004927
2019-02-02 12: 00: 25.025 – 0.004831
2019-02-02 12: 00: 25.026 – 0.004735
2019-02-02 12: 00: 25.027 – 0.004638
2019-02-02 12: 00: 25.028 – 0.004542
2019-02-02 12: 00: 25.029 – 0.004446
… …
It would be grateful if you give any suggestion on this problem.
Thanking you in advance !!
Information must be lost when you reduce the number of samples.
Perhaps try different math functions used when down sampling is performed?
Jason,
Thank you for replying.
I also think there is no doubt that information will be lost when we resample data. However, in this case, it is a problem that the outline of the graph clearly changed.
If we take data for 1 minute at sampling frequency 1111.11 Hz, the number of points obtained exceeds 60,000 points.
Even if we downsample it at 1000 Hz, the number of data we lost is at most around 6000 points.
However, when we plot the resampled data, the envelope of the graph will change clearly as if it were downsampled at 10 Hz.
As you can see from a part of the data I sent before, interpolation obviously does not work well and I do not know the cause and I am in trouble.
Do you know what causes this problem and how to deal with it?
Best regards.
Not without getting involved in your project.
I recommend designing experiments to help tease apart the cause of the issue, e.g. look at actual data values, and at the results of resampled data at different frequencies. Perhaps simple averaging over a large number of small values is causing the effect?
Perhaps question whether large changes matter for the problem you are solving?
Could you help me with interpolation methods that are available. Say the sales data is not the total sales till that day, but sales registered for a particular time period. e.g. i have sales of a week given, and the data is for 3 years. So, if i want to resample it to daily frequency, and then interpolate, i would want the week’s sale to be distributed in the days of the week.
I hope i am able to convey my problem, wherein linear interpolation is not the method i am looking for as the data is not about total sales till date but sales in a week
Yes, you could resample the series to daily. The daily values won’t be accurate, they will be something like an average of the weekly value divided by 7.
Hi Jason,
Could you please let us know your comment for below question.
How to treat highly correlated feature in multivariate time series.
Thanks
Perhaps model with and without the correlated series and compare results?
Thanks
I’m glad it helped.
Hi Jason,
I have a very large dataset(>2 GB) with timestamp as one of the columns, looks like below.
2248444710306450
2248444710454040
2248444710596550
2248444710738800
2248444710880930
2248444711024970
2248444711166630
2248444711309100
2248444711459830
2248444711602180
2248444711743050
2248444712478090
2248444712521820
2248444712561980
2248444712600190
2248444712674360
2248444712712680
2248444712749870
2248444712788060
2248444712825010
2248444712863270
2248444712900350
2248444712938420
2248444713544750
2248444713586800
2248444713628480
I need to convert it to datetime and do downsampling to have observations per each ms now it is in ns.
Converting it with pd.to_datetime gave pandas._libs.tslib.OutOfBoundsDatetime: cannot convert input with unit ‘ms’
Can I downsample directly from the timestamp? Any help is much appreciated as I need to plot the data and build a model after I successfully plot and analyse the data.
I have some ideas:
Perhaps try loading the data progressively?
Perhaps try working with a small sample instead?
Perhaps try running the code on an AWS EC2 with lots of RAM?
I have more suggestions here:
https://machinelearningmastery.com/faq/single-faq/how-to-i-work-with-a-very-large-dataset
How to Interpolate missing values in a time series with a seasonal cycle?
Dies scipy or pandas have any function for it? I can take mean of previous seasonal timestep and if it is ok then how it automatically detect its previous seasonal timesteps average?
Hmmm, you could model the seasonality with a polynomial, subtract it, resample each piece separately, then add back together.
Good sir,
I don’t know what I’m doing wrong but, I can’t replicate this tutorial. I had lots of trouble just loading the data and the first plot I obtained has nothing to do with yours ! I wasn’t able to go further than the ‘upsampled = series.resample(‘D’)’ part.
Sorry to hear that, what problem are you having exactly?
You have a mistake in your datetime code, fixed below
from pandas import read_csv
from pandas import datetime
from matplotlib import pyplot
def parser(x):
return datetime.strptime(x, ‘%Y-%m-%d’)
series = read_csv(‘s.csv’, header=0, parse_dates=[0], index_col=0, squeeze=True, date_parser=parser)
print(series.head())
series.plot()
pyplot.show()
Perhaps you downloaded a different version of the dataset?
I have a copy of it here:
https://raw.githubusercontent.com/jbrownlee/Datasets/master/shampoo.csv
You have always been my savior, Jason. You are literally helping me survive in my first full fledged ML project. Can’t thank you enough !!
Thanks, I’m really happy to hear that the tutorials are helpful!
HI Jason,
What type of interpolation can be used when the data is first increasing and then decreasing and then increasing with respect to time.
Because when I used the spline interpolation it missed my decreasing value and just made my data increasing with respect to time.
Perhaps fit a polynomial to the series and use that as a type of persistence model.
Thank you so much for your reply. can you suggest me any useful link for this.
Yes, I believe there is an example here:
https://machinelearningmastery.com/time-series-seasonality-with-python/
Hello,
thank you very much for this detailed article. I have a question on upsampling of returns – when we convert weekly frequency to daily frequency, how is the logic determined? for example, if i have a weekly return of 7%, it should translate to a daily return of 1% when i interpolate. Extending it to your above example of shampoo sales, the monthly shampoo sales are in the range of ~200s. When this is converted to daily frequency using interpolation, the daily sales are also in the range of 200s! This does not seem intuitive, i would expect daily sales to be in the range of ~66 (200/30). Am i missing something here?
Thanks in advance!
Shrija
I believe it uses a simple persistence.
For a more realistic transform, I believe a custom function/code will be required.
Thanks!
You’re welcome.
Hi Jason, great tutorial on resampling and interpolating, the best found so far, thank you.
I have a question: I run the “Upsample Shampoo Sales” code exactly as you have written it, though after running the code upsampled = series.resample(‘D’) , I get the following AttributeError: ‘DatetimeIndexResampler’ object has no attribute ‘head’
Any idea why this happens?
In addition, I have yearly data from 2008 to 2018 and I want to upsample to monthly data and then interpolate. Could you give me a hand on creating the definition function with the use of datetime.strptime? I am a beginner in Python. Thank you very much 🙂
Sorry to hear that. Perhaps this will help:
https://machinelearningmastery.com/faq/single-faq/why-does-the-code-in-the-tutorial-not-work-for-me
Sorry, I don’t have the capacity to write custom code for you.
series.index = series[:, 0]
upsampled = series.resample(‘D’)
Thank you sir for the nice explanation , but not able to download the csv file , please attach if possible.
The direct link is in the post:
https://raw.githubusercontent.com/jbrownlee/Datasets/master/shampoo.csv
Dear Jason,
Thank you for the post. One question if you have these two consecutive rows with only one value per hour:
Time Value
0:45 100
1:15 150
And you want to get the value at 1:00, that is, 125, can you do it with this solution?
Thanks
This is called linear interpolation.
You can do this using a library (e.g. above) or manually:
https://en.wikipedia.org/wiki/Linear_interpolation
Hi Dr., I have a doubt,
I have a time-series where my data have different intervals (The difference between records is twenty-five minutes, other times is thirty minutes, and so on).
I have used a resample to make it with the same interval. Then I have used forward propagation for the missing values.
I have two case studies. I tested the model accuracy with this technique and without this technique. In the first case, the accuracy has improved, however, in the second case, the accuracy has dropped.
What could be the motive for the resampling is causing an accuracy drop (when compared to other models)? Could be for the fact that the resampling is creating more data and the model has more difficulty in generalized?
Thanks in advance, and sorry for some English misleading since it is not my first language.
Accuracy? You mean lower error?
If you model at a lower temporal resolution, the problem is almost always simpler, and error will be lower.
Thanks very much for the response!
Maybe I am getting this wrong but I used resampling on data that is intended to be used with an LSTM model.
So I had run the model before and after the resampling was done.
However, the model accuracy was worse with the resampling done. I had use resampling as a pre-processing method. I thought that with the resampling since my time-series have different intervals, the resampling method could help to improve the accuracy concerning a base model.
For example, the accuracy without resampling is 88%, and with resample is 63%. My doubt was because if one of the downsides of using resampling could be for the fact that the resampling is creating more data and the model has more difficulty in generalized?
Sorry to bother you, and again thanks for the response!
You mean error, not accuracy right? Accuracy is invalid for regression:
https://machinelearningmastery.com/faq/single-faq/how-do-i-calculate-accuracy-for-regression
You may need to tune your model to the data:
https://machinelearningmastery.com/start-here/#better
Is it possible to downsample for a desired frequency (eg. 50Hz) with maintaining the same the signal shape with it details ? How to do so?
It depends on your data, but try it by specifying the preferred sampling frequency then plot the result.
I have dataset sampled at 200Hz.
-How to downsample the frequency at 50Hz?
what is the right line of code should I use?
Perhaps start with the example in the section “Downsample Shampoo Sales” and adapt for your needs.
user_id x y z
datetime
2018-12-16 09:13:04.335000+00:00 38.0 0.498 9.002 -5.038
2018-12-16 09:13:06.535000+00:00 38.0 0.344 9.385 -0.418
2018-12-16 09:13:06.605000+00:00 38.0 0.344 9.385 -0.418
2018-12-16 09:13:06.735000+00:00 38.0 -0.459 9.194 -0.828
2018-12-16 09:13:06.740000+00:00 38.0 -0.459 9.194 -0.828
2018-12-16 09:13:06.935000+00:00 38.0 -0.268 8.810 -0.690
2018-12-18 01:16:34.045000+00:00 38.0 1.417 3.639 9.133
2018-12-18 01:16:34.250000+00:00 38.0 1.570 3.371 9.116
2018-12-18 01:16:34.260000+00:00 38.0 1.570 3.371 9.116
2018-12-18 01:16:34.445000+00:00 38.0 1.570 4.405 9.008
2018-12-18 01:16:34.650000+00:00 38.0 -0.459 4.405 9.018
2018-12-18 01:16:34.655000+00:00 38.0 -0.459 4.405 9.018
2018-12-18 01:16:34.845000+00:00 38.0 -0.612 4.941 8.777
2018-12-18 01:16:35.045000+00:00 38.0 -0.612 4.750 8.582
2018-12-18 01:16:35.050000+00:00 38.0 -0.612 4.750 8.582
2018-12-18 01:16:35.245000+00:00 38.0 -0.344 4.788 8.567
This the short version of my dataset.
I have data for two days. What I want to do is resample the data for getting 20 values/second for the seconds that I have data. I don’t want to resample for the seconds that are not present in the data.
If I use :
df.set_index(‘datetime’).resample(‘5ms’).mean() ;
it resamples the whole dataset.
How can I resample only for the timestamp givenin the dataset?
Sorry, I don’t understand what you mean exactly. What do you mean by “only the timestamp given in the dataset” when resampling?
I got the following error message running unsampled example above.
C:/Users/shr015/gbr_ts_anomoly/data/real/test.py:2: FutureWarning: The pandas.datetime class is deprecated and will be removed from pandas in a future version. Import from datetime module instead.
from pandas import datetime
Traceback (most recent call last):
File “C:\Program Files\JetBrains\PyCharm Community Edition 2020.2.2\plugins\python-ce\helpers\pydev\pydevd.py”, line 1448, in _exec
pydev_imports.execfile(file, globals, locals) # execute the script
File “C:\Program Files\JetBrains\PyCharm Community Edition 2020.2.2\plugins\python-ce\helpers\pydev\_pydev_imps\_pydev_execfile.py”, line 18, in execfile
exec(compile(contents+”\n”, file, ‘exec’), glob, loc)
File “C:/Users/shr015/gbr_ts_anomoly/data/real/test.py”, line 11, in
print(upsampled.head(32))
File “C:\Users\shr015\.conda\envs\deeplearning\lib\site-packages\pandas\core\resample.py”, line 115, in __getattr__
return object.__getattribute__(self, attr)
AttributeError: ‘DatetimeIndexResampler’ object has no attribute ‘head’
Sorry to hear that, perhaps these tips will help:
https://machinelearningmastery.com/faq/single-faq/why-does-the-code-in-the-tutorial-not-work-for-me
Hey Jason,
I have an hourly time series data and I want to resample it to hours so that I can have an observation for each hour of the day (since some days I only have 2 or 3 observations). But instead of getting NaN, I get zeroes. I also have a gap of about 3 months. When I do the interpolation, this gap is not filled. Do you have any suggestions?
Thanks!
Maybe start with a working example from the tutorial, then adapt it for your needs?
Hi Jason,
Thank you so much for your tutorials, it helped me so much to understand deep learning concepts and workflow.
I am currently working on an economic prediction model, and I have a problem about the sampling rate of different indicators. For example, ‘Interest Rate’ would be sampled daily and ‘Inflation Rate’ would be sampled monthly and some datasets sampling annually, resulting in a lot of NaN values when these features were combined together at a daily sample rate.
I was wondering if there is any workaround for it? I couldn’t really find the answer online and books. Most of the tutorials online deals with NaNs that is in a small amount compared to the whole dataset while in my dataset, ‘Inflation’ column would be 90% NaNs if upsampled to a daily rate.
Thank you so much
You could compare the performance of models on data that has a normalized frequency to a model that was fit on data with different frequency and see if it makes a big difference.
Hi Jason,
I have recording following EEG data format with 256hz but I need to downsample data to 120hz. I see index is showing like 0,1…,255,0,1,2,..255.0
I used df = df.sample(frac = 120) and it show similar pattern of original data. Is it okay for downsampling or Should I apply any other technique to get a better way of downsampling?
Thanks
If the pattern you mentioned is a much lower frequency, the downsample will still preserve that. Not surprised! Why you want to downsample it and why you do not want to see the pattern after the downsample? Answering that might help you see what is the “better way”. Or, depends on your goal, may be downsample is not the best way to pre-process your data at all.
Thanks for your reply. I actually collected other sensor data where the sample rate is 120. So I need to downsample EEG data. I used df = df.sample(frac = 120) to downsample EEG data and pattern is similar to original data. I don’t know any other way to do it. If you know please let me know.
Why would you expect the data pattern is not similar after downsampling?
I did not expect anything. I’m just curious to know if any other way to do it.
If you know what you’re looking for, you may use a different method for preprocessing. One trivial thing to me may be to do a Fourier transform and express the data in frequency domain rather than time domain, in case you know you’re looking for something in frequency. Just an example.
Hi,
I have two datasets that I want to use to build a predictive model using linear regression,, but I have a question about using resampling methods to reduce the size of the data from daily to monthly so that I can compare it to a monthly unemployment rate. The monthly unemployment rate is my response variable to be predicted. Is that a correct approach in building a predictive linear regression model?
Yes. Usually in this case, the resampling is done because you want to align the data frequency. For example, some of your independent variables are only monthly, hence it make sense to align everything to monthly.
Thanks so much for your response!
Hi! What would be the best way to resample the data to a constant frequency, like 100 samples/sec. I have an irregular data. In Matlab, I used “resample(signal, timestamps,100,’spline’)”, to make the irregular data to a constant 100 samples/second using spline interpolation. What is the best equivalent way in python?
Thanks!
If you’re using pandas, there is a resample function too: https://pandas.pydata.org/docs/reference/api/pandas.DataFrame.resample.html
hello.
i have a question regarding downsampling, as in upsampling we see that the original values corresponding the timestamp are not changed and “nan” are inserted instead which can be interpolated later as desired. But in downsampling the original values are changed along with timestamp downsampled. for example a data set containing an instantaneous voltage at every particular minute and we want to resample our dataset for hourly data, after downsampling the timestamp is correct but the corresponding instantaneous voltages are no more the same but are changed to mean or some other function.
how can we recover the the original values for instantaneous quantities ? because these values are very important for further modelling.
Hi aman…The following resource should add clarity:
https://towardsdatascience.com/5-techniques-to-work-with-imbalanced-data-in-machine-learning-80836d45d30c
thank you for your quick response.
Hi James,
I have a question regarding the efficiency or the speed of the interpolation in case of upsampling or an aggregate method in case of downsampling.
Is there a way that it can be computed parallely or speed up the process as i have large dataset, divided over many parquet files. Where each file –> sample has its own interpolation rate.
The way that i do it is looping over the files and then upsample or downsample based on what rate is associated with that sample and this is taking too much time
For detailes i need to upsample over 300,000 samples –> is there anyway to speed up the process ??
Thanks in advance
Hi James,
I have a question regarding the minimum number of observations when doing regression and prediction analysis.
I have a dataset consisting of yearly data (ranging from 2010 to 2022, so it gives me 10 observations).
So, is it reasonable to upsampling the original dataset from yearly data to monthly data? And any downsides if doing so.
Thank you!
Hi Kuro…If possible, it would be beneficial to arrive at a dataset with as many data points in your series as possible.
These are the data from a company’s financial reports, which were not available until 2010. I think gathering their quarterly reports is the farthest I can go. Can I still do the regression at this point?
Thank you for your quick response!
Hi… This is very helpful. Thanks.
What if the data is 2D arrays for each date (e.g. 4X10: 4 rows and 10 columns)? how do we read it into dataframes? Does the below work? and will the interpolation be done in 2D?
2023-06-01: (4,10) array
2023-06-02: (4,10) array
2023-06-03: (4,10) array
Hi Sam…You are very welcome! The following may be of interest to you:
https://machinelearningmastery.com/understanding-the-design-of-a-convolutional-neural-network/
https://towardsdatascience.com/a-simple-2d-cnn-for-mnist-digit-recognition-a998dbc1e79a
I have monthly tourist dataset(no. of tourist visiting a hill station), I want to upsample it on weekly basis. Can you suggest which technique would work best?
Hi Ayush…The following resource may be of interest.
https://machinelearningmastery.com/implement-resampling-methods-scratch-python/