The Pandas library in Python provides excellent, built-in support for time series data.
Once loaded, Pandas also provides tools to explore and better understand your dataset.
In this post, you will discover how to load and explore your time series dataset.
After completing this tutorial, you will know:
How to load your time series dataset from a CSV file using Pandas.
How to peek at the loaded data and calculate summary statistics.
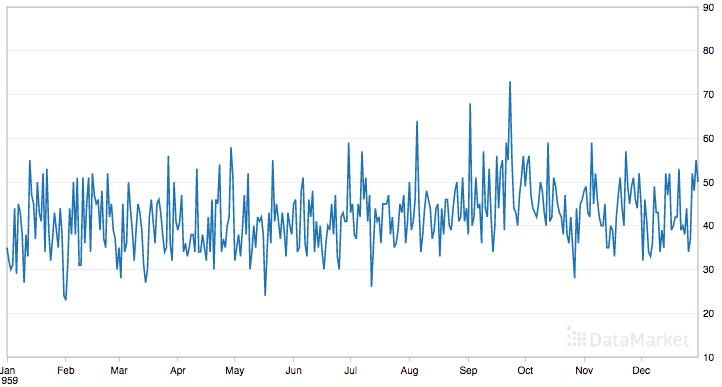
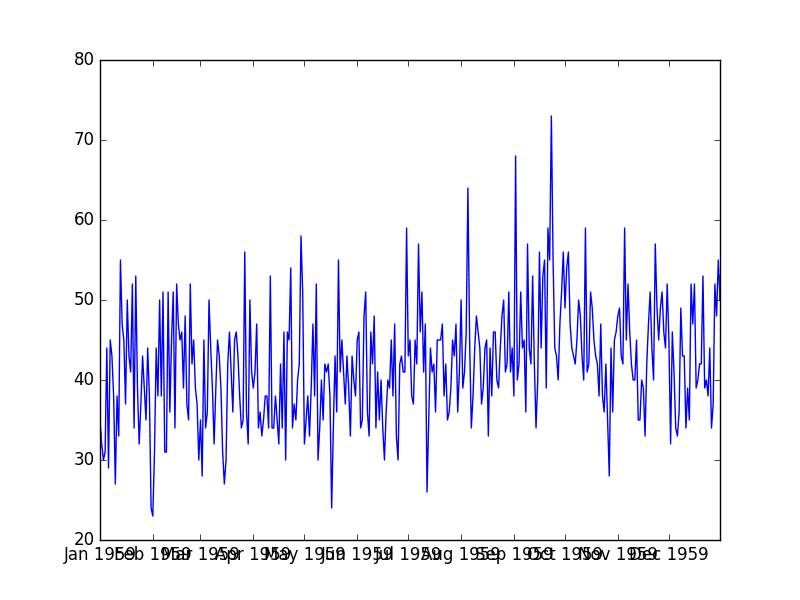
How to plot and review your time series data.
Kick-start your project with my new book Time Series Forecasting With Python, including step-by-step tutorials and the Python source code files for all examples.
Let’s get started.
Updated Apr/2019: Updated the link to dataset.
Update Aug/2019: Updated data loading to use new API.
Daily Female Births Dataset
In this post, we will use the Daily Female Births Dataset as an example.
This univariate time series dataset describes the number of daily female births in California in 1959.
The units are a count and there are 365 observations. The source of the dataset is credited to Newton (1988).
Pandas represented time series datasets as a Series.
A Series is a one-dimensional array with a time label for each row.
The series has a name, which is the column name of the data column.
You can see that each row has an associated date. This is in fact not a column, but instead a time index for value. As an index, there can be multiple values for one time, and values may be spaced evenly or unevenly across times.
The main function for loading CSV data in Pandas is the read_csv() function. We can use this to load the time series as a Series object, instead of a DataFrame, as follows:
We provide it a number of hints to ensure the data is loaded as a Series.
header=0: We must specify the header information at row 0.
parse_dates=[0]: We give the function a hint that data in the first column contains dates that need to be parsed. This argument takes a list, so we provide it a list of one element, which is the index of the first column.
index_col=0: We hint that the first column contains the index information for the time series.
squeeze=True: We hint that we only have one data column and that we are interested in a Series and not a DataFrame.
One more argument you may need to use for your own data is date_parser to specify the function to parse date-time values. In this example, the date format has been inferred, and this works in most cases. In those few cases where it does not, specify your own date parsing function and use the date_parser argument.
Running the example above prints the same output, but also confirms that the time series was indeed loaded as a Series object.
1
2
3
4
5
6
7
8
<class 'pandas.core.series.Series'>
Date
1959-01-01 35
1959-01-02 32
1959-01-03 30
1959-01-04 31
1959-01-05 44
Name: Daily total female births in California, 1959, dtype: int64
It is often easier to perform manipulations of your time series data in a DataFrame rather than a Series object.
In those situations, you can easily convert your loaded Series to a DataFrame as follows:
You can also use the tail() function to get the last n records of the dataset.
Number of Observations
Another quick check to perform on your data is the number of loaded observations.
This can help flush out issues with column headers not being handled as intended, and to get an idea on how to effectively divide up data later for use with supervised learning algorithms.
You can get the dimensionality of your Series using the size parameter.
Running this displays the 31 observations for the month of January in 1959.
1
2
3
4
5
6
7
8
9
10
11
12
13
14
15
16
17
18
19
20
21
22
23
24
25
26
27
28
29
30
31
32
Date
1959-01-01 35
1959-01-02 32
1959-01-03 30
1959-01-04 31
1959-01-05 44
1959-01-06 29
1959-01-07 45
1959-01-08 43
1959-01-09 38
1959-01-10 27
1959-01-11 38
1959-01-12 33
1959-01-13 55
1959-01-14 47
1959-01-15 45
1959-01-16 37
1959-01-17 50
1959-01-18 43
1959-01-19 41
1959-01-20 52
1959-01-21 34
1959-01-22 53
1959-01-23 39
1959-01-24 32
1959-01-25 37
1959-01-26 43
1959-01-27 39
1959-01-28 35
1959-01-29 44
1959-01-30 38
1959-01-31 24
This type of index-based querying can help to prepare summary statistics and plots while exploring the dataset.
Descriptive Statistics
Calculating descriptive statistics on your time series can help get an idea of the distribution and spread of values.
This may help with ideas of data scaling and even data cleaning that you can perform later as part of preparing your dataset for modeling.
The describe() function creates a 7 number summary of the loaded time series including mean, standard deviation, median, minimum, and maximum of the observations.
In this post, you discovered how to load and handle time series data using the Pandas Python library.
Specifically, you learned:
How to load your time series data as a Pandas Series.
How to peek at and calculate summary statistics of your time series data.
How to plot your time series data.
Do you have any questions about handling time series data in Python, or about this post?
Ask your questions in the comments below and I will do my best to answer.
Want to Develop Time Series Forecasts with Python?
Traceback (most recent call last):
File “/usr/lib/python2.7/site.py”, line 68, in
import os
File “/usr/lib/python2.7/os.py”, line 400, in
import UserDict
File “/usr/lib/python2.7/UserDict.py”, line 116, in
import _abcoll
File “/usr/lib/python2.7/_abcoll.py”, line 11, in
from abc import ABCMeta, abstractmethod
ValueError: could not convert string to float: ‘1959-12-31’
I found a way to change to datetime object then date2num to make it work, but I was curious why passing in the data as you did didn’t work for me? I’m using Python 3.
i am using python 3. so for plotting time series, i have to change index to date time index. otherwise “value error” exception occured. error occurred because index values are in string format and for plotting index values should be other than string. in our case, it should be in datetime format.
import matplotlib.pyplot as plt
plt.plot(pd.to_datetime(series.index),series.values)
plt.show()
Hi Jason, how might you set up time series data that is sparse and grouped.
Would any of these ideas work:
(1) Create averages as per the largest time span so as to eliminate any gaps
(2) Smooth out the gaps some how
Sorry to carry on but if you were trying to model ts data in an xgboost model and needed to predict the latest ts period how could you deal with a distinct lack of data in this period, would xgboost automatically handle this for us or would you advise on more traditional ts methods.
Thanks!
Went back to this tutorial why is it doing like this:
—————————————————————————
AttributeError Traceback (most recent call last)
in
—-> 1 series=Series.from_csv(‘daily-total-female-births.csv’,headers=0)
AttributeError: type object ‘Series’ has no attribute ‘from_csv’
This works well if you are on Python 2.7 then you will not run into trouble using the Series.from_csv(‘filename.csv’) or printing the statistical results by print(series.describe())
Be sure though that for matplotlib for an older version in Python 2.7 execute this early before the pyplot.plot():
from pandas.plotting import register_matplotlib_converters
register_matplotlib_converters()
With the following piece of code:
# Load birth data using read_csv
from pandas import read_csv
series = read_csv(‘daily-total-female-births-in-cal.csv’, header=0, parse_dates=[0], index_col=0, squeeze=True)
print(type(series))
print(series.head())
The returned type is a data frame and not a series. Do you have a suggestion?
And then I get a keyError ‘1959-01’ when I try to print the series. Any idea?
during lunch I corrected the code. My understanding is that your code is for Python 2.7. As I am running Python 3.7, it might explain why it is not working.
Below is the piece of code that works for me in Python 3.7.
Anyway thank you very much for your always helpful and well guided post.
Kind regards
Dominique
# Python version
import sys
print(‘Python: {}’.format(sys.version))
# Load birth data using read_csv
import pandas as pd
sr = pd.read_csv(‘daily-total-female-births.csv’, delimiter=’;’)
print(type(sr))
# Print the first few rows using the head() function.
print(f’\nThe type is: {type(sr)}’)
print(sr.head(10))
# Print the dimensions of the dataset using the size attribute.
print(f’\nSize is:{sr.Date.size}’)
# Query the dataset using a date-time string.
print(f’\nAll dates before March:’)
print(sr[sr.Date <= '1959-01-03'])
# Print summary statistics of the observations.
print(f'\nSummary:')
print(sr.describe())
# Data Visualization
from matplotlib import pyplot
Let’s say I read in some data like your example:
1959-01-04 31
1959-01-05 44
1959-01-06 29
or perhaps comma-separated values with hours, minutes and seconds as well.
But I have a function that accepts time only in the form of seconds since the 1970 epoch.
Is there a general method for converting the datetime column to seconds? I know how to convert a single value, but I want to convert thousands of values at once, and preferably not in a loop.
Thanks
Yes, I believe Python will represent datetimes internally as time from epoch and provide a function to retrieve the epoch time directly. I recommend checking the python or pandas API documentation for handling date-times.
I have actually spent hours with the Python and pandas documentation, and on browsing various forums, trying to work out how to do it. I was expecting it to be a trivial exercise, and probably the answer will turn out to be quite simple. The problem is, I come from a Matlab background, and am accustomed to working with arrays.. I have found about a dozen ways of converting to “seconds from epoch” for a single datetime value, but none of them accept more than a single input time. But, thanks anyway.
This is a deploymeny for LSTM model in flask python, the first column in the csv file I uploaded for prediction is the datetime, how to remain again the first column datatime after i have made prediction and download as a new csv file, Please share me some tips, its really stuck me for a while
app.py
from flask import Flask, make_response, request, render_template
import io
from io import StringIO
import csv
import pandas as pd
import numpy as np
import pickle
import os
from keras.models import load_model
from sklearn.preprocessing import MinMaxScaler
from statsmodels.tsa.arima_model import ARIMAResults
app = Flask(__name__)
@app.route(‘/’)
def form():
return “””
Let’s TRY to Predict..
Insert your CSV file and then download the Result
Predict
“””
@app.route(‘/transform’, methods=[“POST”])
def transform_view():
if request.method == ‘POST’:
f = request.files[‘data_file’]
if not f:
return “No file”
stream = io.StringIO(f.stream.read().decode(“UTF8”), newline=None)
csv_input = csv.reader(stream)
#print(“file contents: “, file_contents)
#print(type(file_contents))
print(csv_input)
for row in csv_input:
print(row)
stream.seek(0)
result = stream.read()
df = pd.read_csv(StringIO(result), usecols=[1])
# load the model from disk
model = load_model(‘model.h5’)
dataset = df.values
dataset = dataset.astype(‘float32′)
scaler = MinMaxScaler(feature_range=(0, 1))
dataset = scaler.fit_transform(dataset)
dataset = np.reshape(dataset, (dataset.shape[0], 1, dataset.shape[1]))
df = model.predict(dataset)
transform = scaler.inverse_transform(df)
df_predict = pd.DataFrame(transform, columns=[“predicted value”])


You may find this useful: https://github.com/blue-yonder/tsfresh
Thanks Vishal, I’d love to dive into this.
How can we extract a X and a Y from the series object, in regard to this tutorial?:
https://machinelearningmastery.com/5-step-life-cycle-neural-network-models-keras/
This post explains how to convert a time series to a supervised learning problem with X and y components:
https://machinelearningmastery.com/time-series-forecasting-supervised-learning/
This post in the section titled “Transform Time Series to Supervised Learning” gives you the Python code:
https://machinelearningmastery.com/time-series-forecasting-long-short-term-memory-network-python/
when I use print(series[‘1959-01’]), it gave me key error.
Sorry, I have not seen this.
Confirm you have the correct data, perhaps open the CSV file in a text editor and confirm you have no footer.
Consider printing all of the loaded data to see that it is indeed loaded as expected.
Let me know how you go.
I got the same problem, looks like it’s not parsed as Date format, but I have no idea how to convert it.
I figured it out. The problem was due to that I forgot to remove the footer information of the csv file.
Glad to hear it.
Hi, removing the tail by hand is not a good option if you had loads of files like this. Is there a way to handle this automatically with pandas?
Error when run the first snippet of code 🙁
Traceback (most recent call last):
File “/usr/lib/python2.7/site.py”, line 68, in
import os
File “/usr/lib/python2.7/os.py”, line 400, in
import UserDict
File “/usr/lib/python2.7/UserDict.py”, line 116, in
import _abcoll
File “/usr/lib/python2.7/_abcoll.py”, line 11, in
from abc import ABCMeta, abstractmethod
I’m sorry to hear that. It looks like your environment might not be setup.
This tutorial will help:
https://machinelearningmastery.com/setup-python-environment-machine-learning-deep-learning-anaconda/
I’m getting an error when using pyplot(series):
ValueError: could not convert string to float: ‘1959-12-31’
I found a way to change to datetime object then date2num to make it work, but I was curious why passing in the data as you did didn’t work for me? I’m using Python 3.
I am getting the below error while.
FileNotFoundError: File b’daily-total-female-births-in-cal.csv’ does not exist
You need to download the dataset and place it in the same directory as your code.
i am using python 3. so for plotting time series, i have to change index to date time index. otherwise “value error” exception occured. error occurred because index values are in string format and for plotting index values should be other than string. in our case, it should be in datetime format.
import matplotlib.pyplot as plt
plt.plot(pd.to_datetime(series.index),series.values)
plt.show()
or you can do
series.plot()
plt.show()
Thanks.
Thanks. this saved from huge confusion
I wrote code as below:
from pandas import read_csv
from matplotlib import pyplot
from sklearn.metrics import mean_squared_error
from math import sqrt
series = read_csv(‘daily_births.csv’, header=0, index_col=0, parse_dates=True, squeeze=True)
#series = read_csv(‘daily_births.csv’, header=0, index_col=0)
series.plot()
pyplot.show()
print(‘——————————————————————–‘)
predictions = []
actual = series.values[1:]
print(actual)
print(actual[363])
print(‘——————————————————————–‘)
rmse = sqrt(mean_squared_error(actual, predictions))
print(rmse)
There was an error: ValueError: Found input variables with inconsistent numbers of samples: [364, 0]. Please help
Perhaps double check the shape of your data?
Hi Jason, how might you set up time series data that is sparse and grouped.
Would any of these ideas work:
(1) Create averages as per the largest time span so as to eliminate any gaps
(2) Smooth out the gaps some how
Sorry to carry on but if you were trying to model ts data in an xgboost model and needed to predict the latest ts period how could you deal with a distinct lack of data in this period, would xgboost automatically handle this for us or would you advise on more traditional ts methods.
Thanks!
I would recommend brainstorming as many different framings of the problem as possible and test each to see what worked.
Went back to this tutorial why is it doing like this:
—————————————————————————
AttributeError Traceback (most recent call last)
in
—-> 1 series=Series.from_csv(‘daily-total-female-births.csv’,headers=0)
AttributeError: type object ‘Series’ has no attribute ‘from_csv’
The error suggest that perhaps your version of Pandas is not up to date?
Tried visiting the website for Pandas Series but its down? Had to change this to:
series = pd.read_csv(‘daily-total-female-births.csv’, header=0)
now that works!
Happy to hear that.
This works well if you are on Python 2.7 then you will not run into trouble using the Series.from_csv(‘filename.csv’) or printing the statistical results by print(series.describe())
Be sure though that for matplotlib for an older version in Python 2.7 execute this early before the pyplot.plot():
from pandas.plotting import register_matplotlib_converters
register_matplotlib_converters()
Thanks for the note.
Also some bit of modification from series to dataframe conversion here:
import pandas as pd
dataframe =pd.DataFrame(series)
Hi Jason,
With the following piece of code:
# Load birth data using read_csv
from pandas import read_csv
series = read_csv(‘daily-total-female-births-in-cal.csv’, header=0, parse_dates=[0], index_col=0, squeeze=True)
print(type(series))
print(series.head())
The returned type is a data frame and not a series. Do you have a suggestion?
And then I get a keyError ‘1959-01’ when I try to print the series. Any idea?
Thanks for help,
Kind regards,
Dominique
thanks,
Dominique
I can confirm the code works correctly.
Here is the dataset:
https://raw.githubusercontent.com/jbrownlee/Datasets/master/daily-total-female-births.csv
Here is help copy-pasting the code:
https://machinelearningmastery.com/faq/single-faq/how-do-i-copy-code-from-a-tutorial
Hi Jason,
during lunch I corrected the code. My understanding is that your code is for Python 2.7. As I am running Python 3.7, it might explain why it is not working.
Below is the piece of code that works for me in Python 3.7.
Anyway thank you very much for your always helpful and well guided post.
Kind regards
Dominique
# Python version
import sys
print(‘Python: {}’.format(sys.version))
# Load birth data using read_csv
import pandas as pd
sr = pd.read_csv(‘daily-total-female-births.csv’, delimiter=’;’)
print(type(sr))
# Print the first few rows using the head() function.
print(f’\nThe type is: {type(sr)}’)
print(sr.head(10))
# Print the dimensions of the dataset using the size attribute.
print(f’\nSize is:{sr.Date.size}’)
# Query the dataset using a date-time string.
print(f’\nAll dates before March:’)
print(sr[sr.Date <= '1959-01-03'])
# Print summary statistics of the observations.
print(f'\nSummary:')
print(sr.describe())
# Data Visualization
from matplotlib import pyplot
sr.plot()
pyplot.show()
The code as-is in the tutorials works with python 2 and 3 without change.
I’m happy to hear you fixed your problem.
Let’s say I read in some data like your example:
1959-01-04 31
1959-01-05 44
1959-01-06 29
or perhaps comma-separated values with hours, minutes and seconds as well.
But I have a function that accepts time only in the form of seconds since the 1970 epoch.
Is there a general method for converting the datetime column to seconds? I know how to convert a single value, but I want to convert thousands of values at once, and preferably not in a loop.
Thanks
Yes, I believe Python will represent datetimes internally as time from epoch and provide a function to retrieve the epoch time directly. I recommend checking the python or pandas API documentation for handling date-times.
I have actually spent hours with the Python and pandas documentation, and on browsing various forums, trying to work out how to do it. I was expecting it to be a trivial exercise, and probably the answer will turn out to be quite simple. The problem is, I come from a Matlab background, and am accustomed to working with arrays.. I have found about a dozen ways of converting to “seconds from epoch” for a single datetime value, but none of them accept more than a single input time. But, thanks anyway.
Sorry to hear that John. I’m eager to help, but I don’t know the API call off the top of my head.
Perhaps try posting your question to stackoverflow.com
Good idea, I will do that. Thanks
You’re welcome.
This is a deploymeny for LSTM model in flask python, the first column in the csv file I uploaded for prediction is the datetime, how to remain again the first column datatime after i have made prediction and download as a new csv file, Please share me some tips, its really stuck me for a while
app.py
from flask import Flask, make_response, request, render_template
import io
from io import StringIO
import csv
import pandas as pd
import numpy as np
import pickle
import os
from keras.models import load_model
from sklearn.preprocessing import MinMaxScaler
from statsmodels.tsa.arima_model import ARIMAResults
app = Flask(__name__)
@app.route(‘/’)
def form():
return “””
Let’s TRY to Predict..
Insert your CSV file and then download the Result
Predict
“””
@app.route(‘/transform’, methods=[“POST”])
def transform_view():
if request.method == ‘POST’:
f = request.files[‘data_file’]
if not f:
return “No file”
stream = io.StringIO(f.stream.read().decode(“UTF8”), newline=None)
csv_input = csv.reader(stream)
#print(“file contents: “, file_contents)
#print(type(file_contents))
print(csv_input)
for row in csv_input:
print(row)
stream.seek(0)
result = stream.read()
df = pd.read_csv(StringIO(result), usecols=[1])
# load the model from disk
model = load_model(‘model.h5’)
dataset = df.values
dataset = dataset.astype(‘float32′)
scaler = MinMaxScaler(feature_range=(0, 1))
dataset = scaler.fit_transform(dataset)
dataset = np.reshape(dataset, (dataset.shape[0], 1, dataset.shape[1]))
df = model.predict(dataset)
transform = scaler.inverse_transform(df)
df_predict = pd.DataFrame(transform, columns=[“predicted value”])
response = make_response(df_predict.to_csv(index = True , encoding=’utf8’))
response.headers[“Content-Disposition”] = “attachment; filename=result.csv”
return response
if __name__ == “__main__”:
app.run(debug=True, port = 9000, host = “localhost”)
You can update your model with new data by saving it, loading it and continuing the training with the new file.
This may give you ideas:
https://machinelearningmastery.com/update-lstm-networks-training-time-series-forecasting/