Black and white images are single matrix of pixels, whereas color images have a separate array of pixel values for each color channel, such as red, green, and blue.
Pixel values are often unsigned integers in the range between 0 and 255. Although these pixel values can be presented directly to neural network models in their raw format, this can result in challenges during modeling, such as in the slower than expected training of the model.
Instead, there can be great benefit in preparing the image pixel values prior to modeling, such as simply scaling pixel values to the range 0-1 to centering and even standardizing the values.
In this tutorial, you will discover image data for modeling with deep learning neural networks.
After completing this tutorial, you will know:
How to normalize pixel values to a range between zero and one.
How to center pixel values both globally across channels and locally per channel.
How to standardize pixel values and how to shift standardized pixel values to the positive domain.
Kick-start your project with my new book Deep Learning for Computer Vision, including step-by-step tutorials and the Python source code files for all examples.
Let’s get started.
Tutorial Overview
This tutorial is divided into four parts; they are:
Sample Image
Normalize Pixel Values
Center Pixel Values
Standardize Pixel Values
Want Results with Deep Learning for Computer Vision?
Take my free 7-day email crash course now (with sample code).
Click to sign-up and also get a free PDF Ebook version of the course.
Sample Image
We need a sample image for testing in this tutorial.
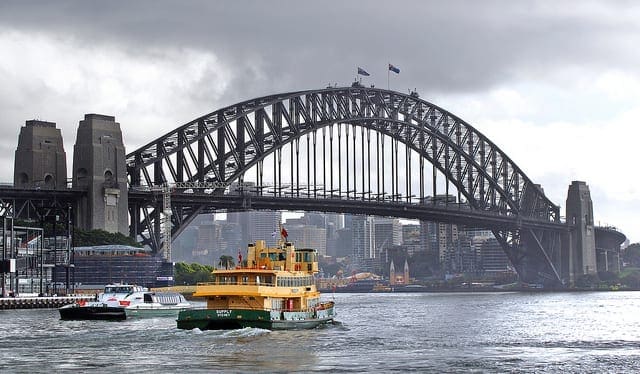
We will use a photograph of the Sydney Harbor Bridge taken by “Bernard Spragg. NZ” and released under a permissive license.
Sydney Harbor Bridge taken by “Bernard Spragg. NZ” Some rights reserved.
Download the photograph and place it into your current working directory with the filename “sydney_bridge.jpg“.
The example below will load the image, display some properties about the loaded image, then show the image.
This example and the rest of the tutorial assumes that you have the Pillow Python library installed.
1
2
3
4
5
6
7
8
9
10
# load and show an image with Pillow
from PIL import Image
# load the image
image=Image.open('sydney_bridge.jpg')
# summarize some details about the image
print(image.format)
print(image.mode)
print(image.size)
# show the image
image.show()
Running the example reports the format of the image, which is JPEG, and the mode, which is RGB for the three color channels.
Next, the size of the image is reported, showing 640 pixels in width and 374 pixels in height.
1
2
3
JPEG
RGB
(640, 374)
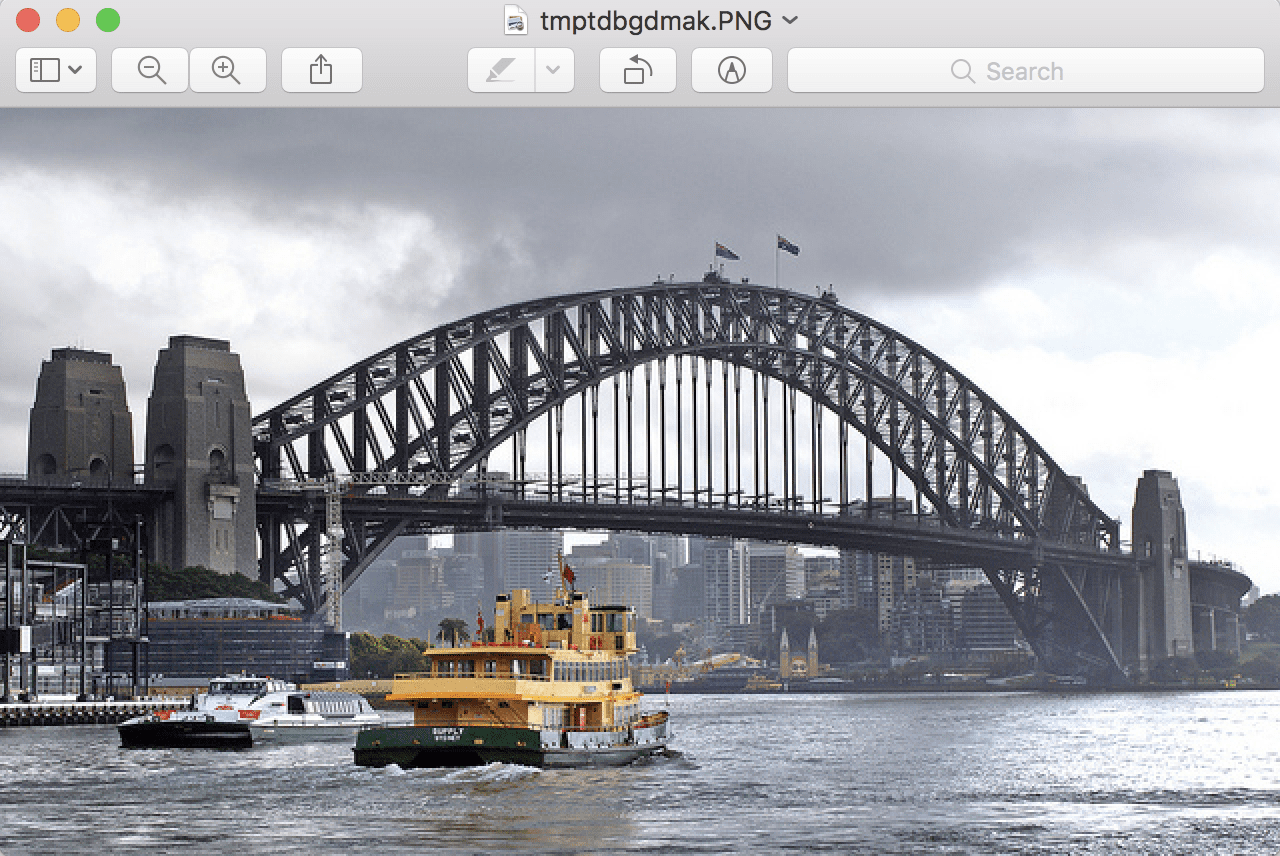
The image is then previewed using the default application for showing images on your workstation.
The Sydney Harbor Bridge Photograph Loaded From File
Normalize Pixel Values
For most image data, the pixel values are integers with values between 0 and 255.
Neural networks process inputs using small weight values, and inputs with large integer values can disrupt or slow down the learning process. As such it is good practice to normalize the pixel values so that each pixel value has a value between 0 and 1.
It is valid for images to have pixel values in the range 0-1 and images can be viewed normally.
This can be achieved by dividing all pixels values by the largest pixel value; that is 255. This is performed across all channels, regardless of the actual range of pixel values that are present in the image.
The example below loads the image and converts it into a NumPy array. The data type of the array is reported and the minimum and maximum pixels values across all three channels are then printed. Next, the array is converted to the float data type before the pixel values are normalized and the new range of pixel values is reported.
Running the example prints the data type of the NumPy array of pixel values, which we can see is an 8-bit unsigned integer.
The min and maximum pixel values are printed, showing the expected 0 and 255 respectively. The pixel values are normalized and the new minimum and maximum of 0.0 and 1.0 are then reported.
1
2
3
Data Type: uint8
Min: 0.000, Max: 255.000
Min: 0.000, Max: 1.000
Normalization is a good default data preparation that can be performed if you are in doubt as to the type of data preparation to perform.
It can be performed per image and does not require the calculation of statistics across the training dataset, as the range of pixel values is a domain standard.
Center Pixel Values
A popular data preparation technique for image data is to subtract the mean value from the pixel values.
This approach is called centering, as the distribution of the pixel values is centered on the value of zero.
Centering can be performed before or after normalization. Centering the pixels then normalizing will mean that the pixel values will be centered close to 0.5 and be in the range 0-1. Centering after normalization will mean that the pixels will have positive and negative values, in which case images will not display correctly (e.g. pixels are expected to have value in the range 0-255 or 0-1). Centering after normalization might be preferred, although it might be worth testing both approaches.
Centering requires that a mean pixel value be calculated prior to subtracting it from the pixel values. There are multiple ways that the mean can be calculated; for example:
Per image.
Per mini-batch of images (under stochastic gradient descent).
Per training dataset.
The mean can be calculated for all pixels in the image, referred to as a global centering, or it can be calculated for each channel in the case of color images, referred to as local centering.
Global Centering: Calculating and subtracting the mean pixel value across color channels.
Local Centering: Calculating and subtracting the mean pixel value per color channel.
Per-image global centering is common because it is trivial to implement. Also common is per mini-batch global or local centering for the same reason: it is fast and easy to implement.
In some cases, per-channel means are pre-calculated across an entire training dataset. In this case, the image means must be stored and used both during training and any inference with the trained models in the future. For example, the per-channel pixel means calculated for the ImageNet training dataset are as follows:
ImageNet Training Dataset Means: [0.485, 0.456, 0.406]
For models trained on images centered using these means that may be used for transfer learning on new tasks, it can be beneficial or even required to normalize images for the new task using the same means.
Let’s look at a few examples.
Global Centering
The example below calculates a global mean across all three color channels in the loaded image, then centers the pixel values using the global mean.
Running the example, we can see that the mean pixel value is about 152.
Once centered, we can confirm that the new mean for the pixel values is 0.0 and that the new data range is negative and positive around this mean.
1
2
3
4
Mean: 152.149
Min: 0.000, Max: 255.000
Mean: -0.000
Min: -152.149, Max: 102.851
Local Centering
The example below calculates the mean for each color channel in the loaded image, then centers the pixel values for each channel separately.
Note that NumPy allows us to specify the dimensions over which a statistic like the mean, min, and max are calculated via the “axis” argument. In this example, we set this to (0,1) for the width and height dimensions, which leaves the third dimension or channels. The result is one mean, min, or max for each of the three channel arrays.
Also note that when we calculate the mean that we specify the dtype as ‘float64‘; this is required as it will cause all sub-operations of the mean, such as the sum, to be performed with 64-bit precision. Without this, the sum will be performed at lower resolution and the resulting mean will be wrong given the accumulated errors in the loss of precision, in turn meaning the mean of the centered pixel values for each channel will not be zero (or a very small number close to zero).
1
2
3
4
5
6
7
8
9
10
11
12
13
14
15
16
17
18
# example of per-channel centering (subtract mean)
from numpy import asarray
from PIL import Image
# load image
image=Image.open('sydney_bridge.jpg')
pixels=asarray(image)
# convert from integers to floats
pixels=pixels.astype('float32')
# calculate per-channel means and standard deviations
Running the example first reports the mean pixels values for each channel, as well as the min and max values for each channel. The pixel values are centered, then the new means and min/max pixel values across each channel are reported.
We can see that the new mean pixel values are very small numbers close to zero and the values are negative and positive values centered on zero.
This distribution may be present per image, per mini-batch of images, or across the training dataset and globally or per channel.
As such, there may be benefit in transforming the distribution of pixel values to be a standard Gaussian: that is both centering the pixel values on zero and normalizing the values by the standard deviation. The result is a standard Gaussian of pixel values with a mean of 0.0 and a standard deviation of 1.0.
As with centering, the operation can be performed per image, per mini-batch, and across the entire training dataset, and it can be performed globally across channels or locally per channel.
Standardization may be preferred to normalization and centering alone and it results in both zero-centered values of small input values, roughly in the range -3 to 3, depending on the specifics of the dataset.
For consistency of the input data, it may make more sense to standardize images per-channel using statistics calculated per mini-batch or across the training dataset, if possible.
Let’s look at some examples.
Global Standardization
The example below calculates the mean and standard deviation across all color channels in the loaded image, then uses these values to standardize the pixel values.
1
2
3
4
5
6
7
8
9
10
11
12
13
14
15
16
# example of global pixel standardization
from numpy import asarray
from PIL import Image
# load image
image=Image.open('sydney_bridge.jpg')
pixels=asarray(image)
# convert from integers to floats
pixels=pixels.astype('float32')
# calculate global mean and standard deviation
mean,std=pixels.mean(),pixels.std()
print('Mean: %.3f, Standard Deviation: %.3f'%(mean,std))
# global standardization of pixels
pixels=(pixels-mean)/std
# confirm it had the desired effect
mean,std=pixels.mean(),pixels.std()
print('Mean: %.3f, Standard Deviation: %.3f'%(mean,std))
Running the example first calculates the global mean and standard deviation pixel values, standardizes the pixel values, then confirms the transform by reporting the new global mean and standard deviation of 0.0 and 1.0 respectively.
1
2
Mean: 152.149, Standard Deviation: 70.642
Mean: -0.000, Standard Deviation: 1.000
Positive Global Standardization
There may be a desire to maintain the pixel values in the positive domain, perhaps so the images can be visualized or perhaps for the benefit of a chosen activation function in the model.
A popular way of achieving this is to clip the standardized pixel values to the range [-1, 1] and then rescale the values from [-1,1] to [0,1].
The example below updates the global standardization example to demonstrate this additional rescaling.
1
2
3
4
5
6
7
8
9
10
11
12
13
14
15
16
17
18
19
20
21
22
# example of global pixel standardization shifted to positive domain
from numpy import asarray
from numpy import clip
from PIL import Image
# load image
image=Image.open('sydney_bridge.jpg')
pixels=asarray(image)
# convert from integers to floats
pixels=pixels.astype('float32')
# calculate global mean and standard deviation
mean,std=pixels.mean(),pixels.std()
print('Mean: %.3f, Standard Deviation: %.3f'%(mean,std))
# global standardization of pixels
pixels=(pixels-mean)/std
# clip pixel values to [-1,1]
pixels=clip(pixels,-1.0,1.0)
# shift from [-1,1] to [0,1] with 0.5 mean
pixels=(pixels+1.0)/2.0
# confirm it had the desired effect
mean,std=pixels.mean(),pixels.std()
print('Mean: %.3f, Standard Deviation: %.3f'%(mean,std))
Running the example first reports the global mean and standard deviation pixel values; the pixels are standardized then rescaled.
Next, the new mean and standard deviation are reported of about 0.5 and 0.3 respectively and the new minimum and maximum values are confirmed of 0.0 and 1.0.
1
2
3
Mean: 152.149, Standard Deviation: 70.642
Mean: 0.510, Standard Deviation: 0.388
Min: 0.000, Max: 1.000
Local Standardization
The example below calculates the mean and standard deviation of the loaded image per-channel, then uses these statistics to standardize the pixels separately in each channel.
1
2
3
4
5
6
7
8
9
10
11
12
13
14
15
16
17
18
# example of per-channel pixel standardization
from numpy import asarray
from PIL import Image
# load image
image=Image.open('sydney_bridge.jpg')
pixels=asarray(image)
# convert from integers to floats
pixels=pixels.astype('float32')
# calculate per-channel means and standard deviations
means=pixels.mean(axis=(0,1),dtype='float64')
stds=pixels.std(axis=(0,1),dtype='float64')
print('Means: %s, Stds: %s'%(means,stds))
# per-channel standardization of pixels
pixels=(pixels-means)/stds
# confirm it had the desired effect
means=pixels.mean(axis=(0,1),dtype='float64')
stds=pixels.std(axis=(0,1),dtype='float64')
print('Means: %s, Stds: %s'%(means,stds))
Running the example first calculates and reports the means and standard deviation of the pixel values in each channel.
The pixel values are then standardized and statistics are re-calculated, confirming the new zero-mean and unit standard deviation.
This section lists some ideas for extending the tutorial that you may wish to explore.
Develop Function. Develop a function to scale a provided image, using arguments to choose the type of preparation to perform,
Projection Methods. Investigate and implement data preparation methods that remove linear correlations from the pixel data, such as PCA and ZCA.
Dataset Statistics. Select and update one of the centering or standardization examples to calculate statistics across an entire training dataset, then apply those statistics when preparing image data for training or inference.
If you explore any of these extensions, I’d love to know.
Further Reading
This section provides more resources on the topic if you are looking to go deeper.
It provides self-study tutorials on topics like: classification, object detection (yolo and rcnn), face recognition (vggface and facenet), data preparation and much more...
Finally Bring Deep Learning to your Vision Projects
Thanks Jason !. very interesting for people, as me, that we do not have so much experience in image preprocessing!
Anyway I think this knowledge impact on transfer learning using keras applications such as VGG16, VGG19, NASNetL, etc. due to the fact that these images applications (‘imagenet’) required specific image preprocessing in order to use the full pre-trained weights, models, etc.
Particularly I means these Keras Apps came with specific library module, for example:
from keras.applications.vgg16 import preprocess_input
So my question is, do you know what specific preprocessing input images perform these applications (used for transfer learning) related to the ones you explained here in this post? what happened if you do not apply this preprocess_input module but apply e.g. the ones you show here, can be catastrophic essay or just less performing ?
Yes, if the input layers of a pre-trained model are used, such as a vgg-16, then the input data must be prepared in the same way as training data, and this is the job of the preprocess functions provided with each model.
Often it is very simple, such as per-channel pixel centering and reshape to the right size.
I have many posts schedule that cover this when using transfer learning – I can’t wait!
Hello. I can’t understand how to get 0-1 range with about 0,5 mean when doing normalize after centering. I’ve got the negative values also as doing first normalize and then centering. I decided that maybe it was meant to do min-max scaling after centering but then values returns like default normalized. Could you please explain to me this?
You can center first, to have pos/negative values around 0, then normalize and use the same scale value for the upper and lower bound, e.g. -5,5 or -3,3 – ensuring the scaling is symmetrical. This will give the new range 0-1 and a mean of 0.5.
Thank you Jason, but I see that in your examples, whether you’re doing standardization or normalization, you’re using the image own data, like the image mean or standard deviation. In this case the standardization will be different within the training set examples and for the test set as well. Am I wrong?
I have a (open) question: what do you think we should do when feeding a 3D volume to, for instance, a CNN? I’m asking since we’re working with medical imaging data and our input is a gray scale 3D volume of shape, e.g. (50, 50, 50).
Do you know of any recommended pre-processing technique in this case?
Should we standardize slice per slice, or should we use the mean and std of the whole volume?
I tried to save the 0-1 range image and ended up saving a black image? Is it possible to save the image and display it where the intensity range is in between 0-1?
import SimpleITK as sitk
from pylab import *
img= sitk.ReadImage(“1.2.826.0.1.3680043.9.3218.1.1.2695005.4962.1510228559379.3567.0.dcm”)
#img = sitk.ReadImage(“N:/OPTIMAM_ORIGINAL_new/OPTIMAM_DB/image_db/sharing/omi-db/images/demd1343/1.2.826.0.1.3680043.9.3218.1.1.3822746.1025.1511356299887.6499.0/1.2.826.0.1.3680043.9.3218.1.1.3822746.1025.1511356299887.6540.0.dcm”)
#img= sitk.ReadImage(“1.2.826.0.1.3680043.9.3218.1.1.3822746.1025.1511356299887.6540.0.dcm”)
# rescale intensity range from [-1000,1000] to [0,255]
img = sitk.IntensityWindowing(img, 0, 4096,0,255)
I am trying to save the image where the grayscale is represented from 0-1. How to do it in python? When I convert the image to Uint8 and save it to DHH, the grayscale image range from 0-255. I have managed to display the image with grayscale range 0-1, using command : plt.imshow(nda, cmap=plt.get_cmap(‘gray’)); where nda is a numpy array of float64. But when I tried to saved the nda with Uiint8, naturally I get black image as Uint8 ranges is from 0-255. I am wondering what is a possible way to save the image as grayscale with values ranging from 0 to 1.
Hi! I’ve got a question that i suspect has it’s answer strongly tied to this topic.
Say I have some data ranging in the [0, 6] interval. Most of the samples are 2D arrays (you can think of them as images 100×5) with half of the values being 0. When I extract the mean all the 0 values will become maybe -3, and start to be relevant in the learning process, whereas I want the neural net to focus on the positive values and somehow discard these null zones.
Will positive global standardization help in this case?
How do all these things play out with ReLU function? Is ReLU supposed to actually discard the negative values in this case?
Are there any other solutions to this problem?
A good analogy is with images where you have cats and dogs on grass and the network consider them to be the same thing by learning the grass background instead of the particular features.
Great job! May I ask whether there are some preprocessing strategies for different image sizes? I have a 3D image set, where their width and height vary largely (22-129, 183-329) and their length keeps the same. Is there any suggestion for image size normalization? Thanks in advance!
hello sir please I’m finding it difficult to understand normalization in this sense, I have some questions: how can I download the images after normalization and is it possible to normalize a data set of 100 images at once?
.
Doing ( pixels – mean )/std over all pixel val gives mean = 0 for Global Standardization.
pixels = r + g + b pixel
So
r_ pixel = all r channel pixels.
.
So if both are pixel distributions then subtracting them by mean and div by std must bring there mean to zero.
.
THEN
Why doesn’t the mean after doing Local Standardization come to [0, 0, 0] ?
Hello! In the case of apply normalization and centering, should the approach normalizes the images taking the max pixel value of the whole dataset or only the local max (by every image, which could be different of 255)?
Am currently doing a project on skin lesions involving 2 classes. One of the classes can’t be categorized as a perfect 0. However, the other class can be predicted as a perfect 1. Does it have to do with the mean pixel value?
If so, how do I get the mean pixel value across my dataset?
If you just want to find the mean pixel value, you reference to the code “pixels.mean()” only you need to first load all images into a 3D numpy array “pixels”
Thanks Jason for the article. I am a bit curious about usage of the term normalizing in the first section of the article. My understanding is that getting the values between 0-1 from 0-255 is actually scaling and not normalizing. Normalizing would mean to change the type of distribution e.g a standard distribution by something like x – m/std. Any thoughts on that


Thanks Jason !. very interesting for people, as me, that we do not have so much experience in image preprocessing!
Anyway I think this knowledge impact on transfer learning using keras applications such as VGG16, VGG19, NASNetL, etc. due to the fact that these images applications (‘imagenet’) required specific image preprocessing in order to use the full pre-trained weights, models, etc.
Particularly I means these Keras Apps came with specific library module, for example:
from keras.applications.vgg16 import preprocess_input
So my question is, do you know what specific preprocessing input images perform these applications (used for transfer learning) related to the ones you explained here in this post? what happened if you do not apply this preprocess_input module but apply e.g. the ones you show here, can be catastrophic essay or just less performing ?
Excellent question!
Yes, if the input layers of a pre-trained model are used, such as a vgg-16, then the input data must be prepared in the same way as training data, and this is the job of the preprocess functions provided with each model.
Often it is very simple, such as per-channel pixel centering and reshape to the right size.
I have many posts schedule that cover this when using transfer learning – I can’t wait!
Hello. I can’t understand how to get 0-1 range with about 0,5 mean when doing normalize after centering. I’ve got the negative values also as doing first normalize and then centering. I decided that maybe it was meant to do min-max scaling after centering but then values returns like default normalized. Could you please explain to me this?
You can center first, to have pos/negative values around 0, then normalize and use the same scale value for the upper and lower bound, e.g. -5,5 or -3,3 – ensuring the scaling is symmetrical. This will give the new range 0-1 and a mean of 0.5.
Thank you Jason, but I see that in your examples, whether you’re doing standardization or normalization, you’re using the image own data, like the image mean or standard deviation. In this case the standardization will be different within the training set examples and for the test set as well. Am I wrong?
Correct.
Hi Jason and thank you for the post!
I have a (open) question: what do you think we should do when feeding a 3D volume to, for instance, a CNN? I’m asking since we’re working with medical imaging data and our input is a gray scale 3D volume of shape, e.g. (50, 50, 50).
Do you know of any recommended pre-processing technique in this case?
Should we standardize slice per slice, or should we use the mean and std of the whole volume?
Thanks a lot in advance!
Sorry, I don’t have tutorials on that case.
Hello Jason!
I’m finding difficulty on the topic ‘Normalize Pixel Values’.
I followed your code and got the same result as below.
Data Type: uint8
Min: 0.000, Max: 255.000
Min: 0.000, Max: 1.000
Now, I want to save the changes to the file.
Is there anyway to do this?
I tried with as below but the saved file is still in 0-255 range.
image = Image.open(filename.png) //open file
…
…
image.save(filename.png) // save file
Yes, see this:
https://machinelearningmastery.com/how-to-save-a-numpy-array-to-file-for-machine-learning/
I tried to save the 0-1 range image and ended up saving a black image? Is it possible to save the image and display it where the intensity range is in between 0-1?
import SimpleITK as sitk
from pylab import *
img= sitk.ReadImage(“1.2.826.0.1.3680043.9.3218.1.1.2695005.4962.1510228559379.3567.0.dcm”)
#img = sitk.ReadImage(“N:/OPTIMAM_ORIGINAL_new/OPTIMAM_DB/image_db/sharing/omi-db/images/demd1343/1.2.826.0.1.3680043.9.3218.1.1.3822746.1025.1511356299887.6499.0/1.2.826.0.1.3680043.9.3218.1.1.3822746.1025.1511356299887.6540.0.dcm”)
#img= sitk.ReadImage(“1.2.826.0.1.3680043.9.3218.1.1.3822746.1025.1511356299887.6540.0.dcm”)
# rescale intensity range from [-1000,1000] to [0,255]
img = sitk.IntensityWindowing(img, 0, 4096,0,255)
# convert 16-bit pixels to 8-bit
img = sitk.Cast(img, sitk.sitkUInt8)
nda = sitk.GetArrayFromImage(img)[0,:,:]
# confirm pixel range is 0-255
ALLOW_THREADS()print(‘Data Type: %s’ % nda.dtype)
print(‘Min: %.3f, Max: %.3f’ % (nda.min(), nda.max()))
# convert from integers to floats
pixels = nda.astype(‘float32’)
# normalize to the range 0-1
pixels /= 255.0
# confirm the normalization
print(‘Min: %.3f, Max: %.3f’ % (pixels.min(), pixels.max()))
#imshow(img)
sitk.WriteImage(img, “000005.png”)
Yes, pixel values can be either 0-1 or 0-255, both are valid.
Sorry, I don’t have the capacity to debug your code:
https://machinelearningmastery.com/faq/single-faq/can-you-read-review-or-debug-my-code
I am trying to save the image where the grayscale is represented from 0-1. How to do it in python? When I convert the image to Uint8 and save it to DHH, the grayscale image range from 0-255. I have managed to display the image with grayscale range 0-1, using command : plt.imshow(nda, cmap=plt.get_cmap(‘gray’)); where nda is a numpy array of float64. But when I tried to saved the nda with Uiint8, naturally I get black image as Uint8 ranges is from 0-255. I am wondering what is a possible way to save the image as grayscale with values ranging from 0 to 1.
I’m not sure of the cause of your fault, sorry.
Perhaps try posting your code and error on stackoverflow.
Hi! I’ve got a question that i suspect has it’s answer strongly tied to this topic.
Say I have some data ranging in the [0, 6] interval. Most of the samples are 2D arrays (you can think of them as images 100×5) with half of the values being 0. When I extract the mean all the 0 values will become maybe -3, and start to be relevant in the learning process, whereas I want the neural net to focus on the positive values and somehow discard these null zones.
Will positive global standardization help in this case?
How do all these things play out with ReLU function? Is ReLU supposed to actually discard the negative values in this case?
Are there any other solutions to this problem?
A good analogy is with images where you have cats and dogs on grass and the network consider them to be the same thing by learning the grass background instead of the particular features.
I think you want to use a masking layer:
https://keras.io/layers/core/
Great job! May I ask whether there are some preprocessing strategies for different image sizes? I have a 3D image set, where their width and height vary largely (22-129, 183-329) and their length keeps the same. Is there any suggestion for image size normalization? Thanks in advance!
Smaller is faster.
Thanks!
You’re welcome.
sir , when i run this code
# example of per-channel pixel standardization
from numpy import asarray
from PIL import Image
# load image
image = Image.open(‘sydney_bridge.jpg’)
pixels = asarray(image)
# convert from integers to floats
pixels = pixels.astype(‘float32′)
# calculate per-channel means and standard deviations
means = pixels.mean(axis=(0,1), dtype=’float64′)
stds = pixels.std(axis=(0,1), dtype=’float64’)
print(‘Means: %s, Stds: %s’ % (means, stds))
# per-channel standardization of pixels
pixels = (pixels – means) / stds
# confirm it had the desired effect
means = pixels.mean(axis=(0,1), dtype=’float64′)
stds = pixels.std(axis=(0,1), dtype=’float64′)
print(‘Means: %s, Stds: %s’ % (means, stds))
I only get two values,like
Means: 128.90747832983968, Stds: 62.30103035552067
Means: 1.2235509834827096e-07, Stds: 1.0000000181304383
what about the third value ……i import 3 channel image…and only got this …
Sorry to hear that, this may help:
https://machinelearningmastery.com/faq/single-faq/why-does-the-code-in-the-tutorial-not-work-for-me
hello sir please I’m finding it difficult to understand normalization in this sense, I have some questions: how can I download the images after normalization and is it possible to normalize a data set of 100 images at once?
Yes, you can save images after the pixels have been scale.d
Yes, you should scale all of the images in the dataset.
how we can do that please
The same way as a single image.
.
Doing ( pixels – mean )/std over all pixel val gives mean = 0 for Global Standardization.
pixels = r + g + b pixel
So
r_ pixel = all r channel pixels.
.
So if both are pixel distributions then subtracting them by mean and div by std must bring there mean to zero.
.
THEN
Why doesn’t the mean after doing Local Standardization come to [0, 0, 0] ?
It does, the values are essentially zero.
Hello! In the case of apply normalization and centering, should the approach normalizes the images taking the max pixel value of the whole dataset or only the local max (by every image, which could be different of 255)?
Thanks!
Either approach can be used.
Perhaps try both and discover what works best for your model/dataset.
Hi Jason,
Based on this post, is it better to use a mere standardization without normalization and centering? What are the pros and cons?
Thanks
It really depends on the data and model.
My advice is to start with standardization, but consider evaluating each data prep method and ise what works best for your data and model.
Hi Jason,
Am currently doing a project on skin lesions involving 2 classes. One of the classes can’t be categorized as a perfect 0. However, the other class can be predicted as a perfect 1. Does it have to do with the mean pixel value?
If so, how do I get the mean pixel value across my dataset?
Thanks
Not sure as I can’t see your skin lesion picture. But machine learning usually do not have 100% accuracy and there is precision-recall trade off: https://machinelearningmastery.com/roc-curves-and-precision-recall-curves-for-classification-in-python/
If you just want to find the mean pixel value, you reference to the code “pixels.mean()” only you need to first load all images into a 3D numpy array “pixels”
Thanks Jason for the article. I am a bit curious about usage of the term normalizing in the first section of the article. My understanding is that getting the values between 0-1 from 0-255 is actually scaling and not normalizing. Normalizing would mean to change the type of distribution e.g a standard distribution by something like x – m/std. Any thoughts on that
Hi VJ…The following may help add clarity:
https://machinelearningmastery.com/normalize-standardize-time-series-data-python/
How to save pixels after normalizing? I want to take them to training after that..Any solution, please?
Hi Ze…You may find the following discussion helpful:
https://stackoverflow.com/questions/62783984/how-to-normalize-pixel-values-in-an-image-and-save-it