Weka has a large number of regression algorithms available on the platform.
The large number of machine learning algorithms supported by Weka is one of the biggest benefits of using the platform.
In this post you will discover how to use top regression machine learning algorithms in Weka.
After reading this post you will know:
- About 5 top regression algorithms supported by Weka.
- How to use regression machine learning algorithms for predictive modeling in Weka.
- About the key configuration options of regression algorithms in Weka.
Kick-start your project with my new book Machine Learning Mastery With Weka, including step-by-step tutorials and clear screenshots for all examples.
Let’s get started.

How To Use Regression Machine Learning Algorithms in Weka
Photo by solarisgirl, some rights reserved.
Regression Algorithms Overview
We are going to take a tour of 5 top regression algorithms in Weka.
Each algorithm that we cover will be briefly described in terms of how it works, key algorithm parameters will be highlighted and the algorithm will be demonstrated in the Weka Explorer interface.
The 5 algorithms that we will review are:
- Linear Regression
- k-Nearest Neighbors
- Decision Tree
- Support Vector Machines
- Multi-Layer Perceptron
These are 5 algorithms that you can try on your regression problem as a starting point.
A standard machine learning regression problem will be used to demonstrate each algorithm.
Specifically, the Boston House Price Dataset. Each instance describes the properties of a Boston suburb and the task is to predict the house prices in thousands of dollars. There are 13 numerical input variables with varying scales describing the properties of suburbs. You can learn more about this dataset on the UCI Machine Learning Repository.
Start the Weka Explorer:
- Open the Weka GUI Chooser.
- Click the “Explorer” button to open the Weka Explorer.
- Load the Boston house price dataset from the housing.arff file.
- Click “Classify” to open the Classify tab.
Let’s start things off by looking at the linear regression algorithm.
Need more help with Weka for Machine Learning?
Take my free 14-day email course and discover how to use the platform step-by-step.
Click to sign-up and also get a free PDF Ebook version of the course.
Linear Regression
Linear regression only supports regression type problems.
It works by estimating coefficients for a line or hyperplane that best fits the training data. It is a very simple regression algorithm, fast to train and can have great performance if the output variable for your data is a linear combination of your inputs.
It is good idea to evaluate linear regression on your problem before moving onto more complex algorithms in case it performs well.
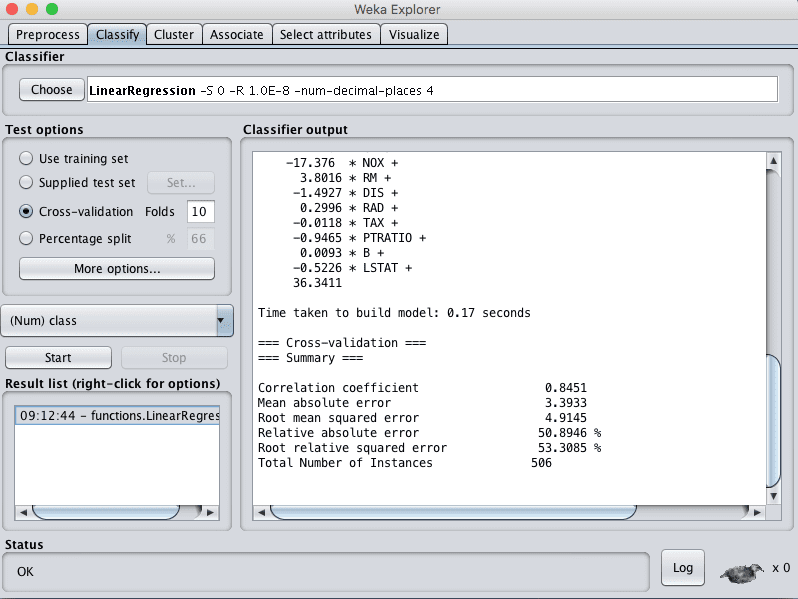
Choose the linear regression algorithm:
- Click the “Choose” button and select “LinearRegression” under the “functions” group.
- Click on the name of the algorithm to review the algorithm configuration.
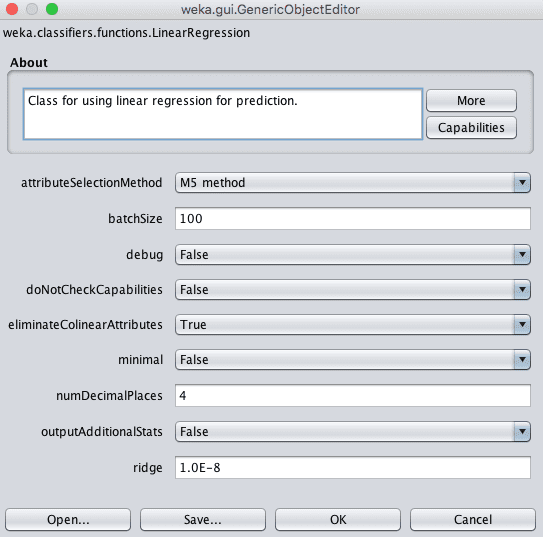
Weka Configuration of Linear Regression
The performance of linear regression can be reduced if your training data has input attributes that are highly correlated. Weka can detect and remove highly correlated input attributes automatically by setting eliminateColinearAttributes to True, which is the default.
Additionally, attributes that are unrelated to the output variable can also negatively impact performance. Weka can automatically perform feature selection to only select those relevant attributes by setting the attributeSelectionMethod. This is enabled by default and can be disabled.
Finally, the Weka implementation uses a ridge regularization technique in order to reduce the complexity of the learned model. It does this by minimizing the square of the absolute sum of the learned coefficients, which will prevent any specific coefficient from becoming too large (a sign of complexity in regression models).
- Click “OK” to close the algorithm configuration.
- Click the “Start” button to run the algorithm on the Boston house price dataset.
You can see that with the default configuration that linear regression achieves an RMSE of 4.9.
Weka Results for Linear Regression
k-Nearest Neighbors
The k-nearest neighbors algorithm supports both classification and regression. It is also called kNN for short. It works by storing the entire training dataset and querying it to locate the k most similar training patterns when making a prediction.
As such, there is no model other than the raw training dataset and the only computation performed is the querying of the training dataset when a prediction is requested.
It is a simple algorithm, but one that does not assume very much about the problem other than that the distance between data instances is meaningful in making predictions. As such, it often achieves very good performance.
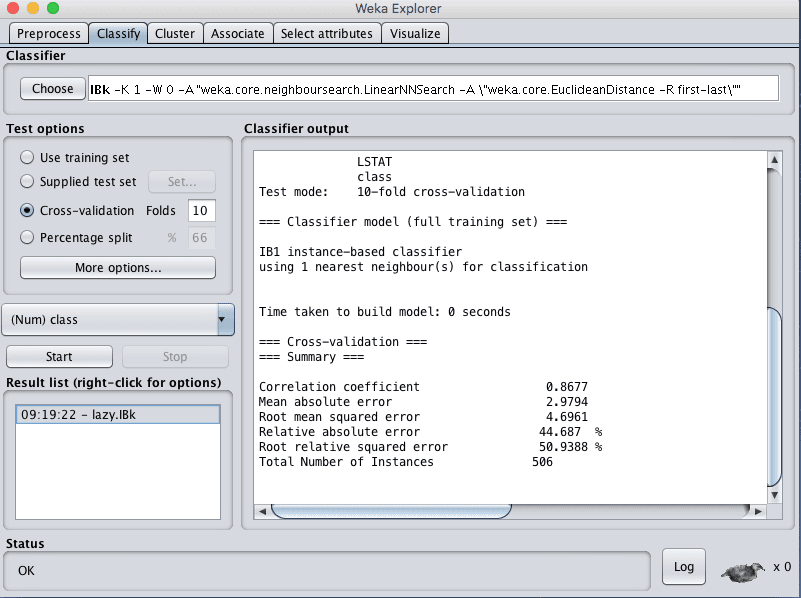
When making predictions on regression problems, KNN will take the mean of the k most similar instances in the training dataset. Choose the KNN algorithm:
- Click the “Choose” button and select “IBk” under the “lazy” group.
- Click on the name of the algorithm to review the algorithm configuration.
In Weka KNN is called IBk which stands for Instance Based k.

Weka k-Nearest Neighbors Configuration
The size of the neighborhood is controlled by the k parameter. For example, if set to 1, then predictions are made using the single most similar training instance to a given new pattern for which a prediction is requested. Common values for k are 3, 7, 11 and 21, larger for larger dataset sizes. Weka can automatically discover a good value for k using cross validation inside the algorithm by setting the crossValidate parameter to True.
Another important parameter is the distance measure used. This is configured in the nearestNeighbourSearchAlgorithm which controls the way in which the training data is stored and searched. The default is a LinearNNSearch. Clicking the name of this search algorithm will provide another configuration window where you can choose a distanceFunction parameter. By default, Euclidean distance is used to calculate the distance between instances, which is good for numerical data with the same scale. Manhattan distance is good to use if your attributes differ in measures or type.
It is a good idea to try a suite of different k values and distance measures on your problem and see what works best.
- Click “OK” to close the algorithm configuration.
- Click the “Start” button to run the algorithm on the Boston house price dataset.
You can see that with the default configuration that KNN algorithm achieves an RMSE of 4.6.
Weka Regression Results for the k-Nearest Neighbors Algorithm
Decision Tree
Decision trees can support classification and regression problems.
Decision trees are more recently referred to as Classification And Regression Trees or CART. They work by creating a tree to evaluate an instance of data, start at the root of the tree and moving town to the leaves (roots because the tree is drawn with an inverted prospective) until a prediction can be made. The process of creating a decision tree works by greedily selecting the best split point in order to make predictions and repeating the process until the tree is a fixed depth.
After the tree is construct, it is pruned in order to improve the model’s ability to generalize to new data.
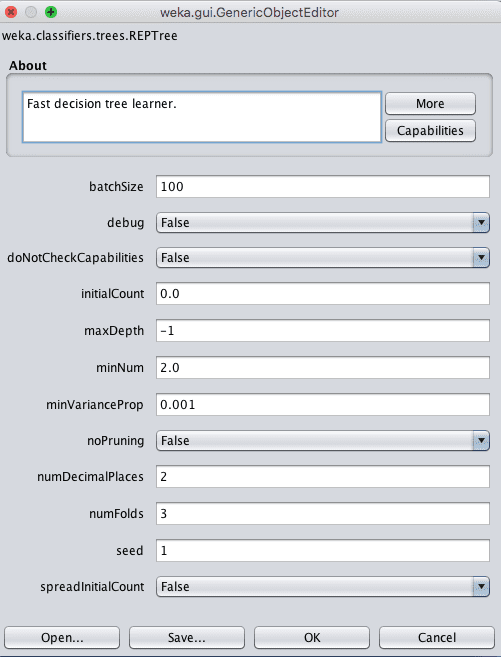
Choose the decision tree algorithm:
- Click the “Choose” button and select “REPTree” under the “trees” group.
- Click on the name of the algorithm to review the algorithm configuration.
Weka Configuration for Decision Tree Algorithm
The depth of the tree is defined automatically, but can specify a depth in the maxDepth attribute.
You can also choose to turn off pruning by setting the noPruning parameter to True, although this may result in worse performance.
The minNum parameter defines the minimum number of instances supported by the tree in a leaf node when constructing the tree from the training data.
- Click “OK” to close the algorithm configuration.
- Click the “Start” button to run the algorithm on the Boston house price dataset.
You can see that with the default configuration that decision tree algorithm achieves an RMSE of 4.8.
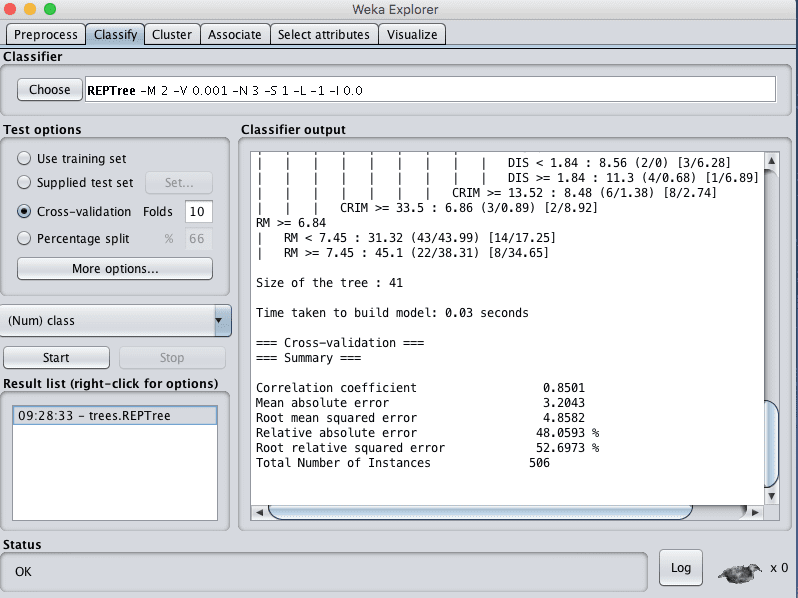
Weka Regression Results for the Decision Tree Algorithm
Support Vector Regression
Support Vector Machines were developed for binary classification problems, although extensions to the technique have been made to support multi-class classification and regression problems. The adaptation of SVM for regression is called Support Vector Regression or SVR for short.
SVM was developed for numerical input variables, although will automatically convert nominal values to numerical values. Input data is also normalized before being used.
Unlike SVM that finds a line that best separates the training data into classes, SVR works by finding a line of best fit that minimizes the error of a cost function. This is done using an optimization process that only considers those data instances in the training dataset that are closest to the line with the minimum cost. These instances are called support vectors, hence the name of the technique.
In almost all problems of interest, a line cannot be drawn to best fit the data, therefore a margin is added around the line to relax the constraint, allowing some bad predictions to be tolerated but allowing a better result overall.
Finally, few datasets can be fit with just a straight line. Sometimes a line with curves or even polygonal regions need to be marked out. This is achieved by projecting the data into a higher dimensional space in order to draw the lines and make predictions. Different kernels can be used to control the projection and the amount of flexibility.
Choose the SVR algorithm:
- Click the “Choose” button and select “SMOreg” under the “function” group.
- Click on the name of the algorithm to review the algorithm configuration.
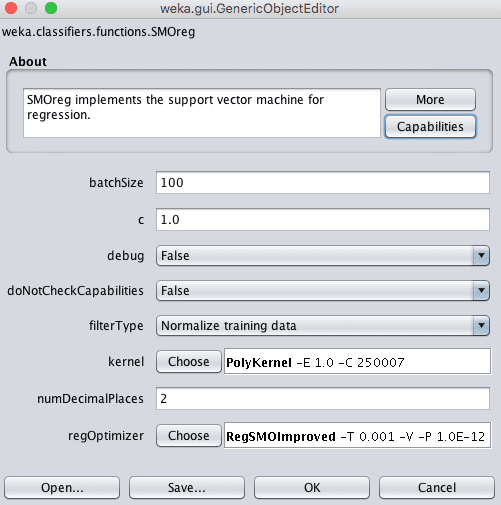
Weka Configuration for the Support Vector Regression Algorithm
The C parameter, called the complexity parameter in Weka controls how flexible the process for drawing the line to fit the data can be. A value of 0 allows no violations of the margin, whereas the default is 1.
A key parameter in SVM is the type of Kernel to use. The simplest kernel is a Linear kernel that separates data with a straight line or hyperplane. The default in Weka is a Polynomial Kernel that will fit the data using a curved or wiggly line, the higher the polynomial, the more wiggly (the exponent value).
The Polynomial Kernel has a default exponent of 1, which makes it equivalent to a linear kernel. A popular and powerful kernel is the RBF Kernel or Radial Basis Function Kernel that is capable of learning closed polygons and complex shapes to fit the training data.
It is a good idea to try a suite of different kernels and C (complexity) values on your problem and see what works best.
- Click “OK” to close the algorithm configuration.
- Click the “Start” button to run the algorithm on the Boston house price dataset.
You can see that with the default configuration that SVR algorithm achieves an RMSE of 5.1.
Weka Regression Results for the Support Vector Regression Algorithm
Multi-Layer Perceptron
The Multi-Layer Perceptron algorithms supports both regression and classification problems.
It is also called artificial neural networks or simply neural networks for short.
Neural networks are a complex algorithm to use for predictive modeling because there are so many configuration parameters that can only be tuned effectively through intuition and a lot of trial and error.
It is an algorithm inspired by a model of biological neural networks in the brain where small processing units called neurons are organized into layers that if configured well are capable of approximating any function. In classification we are interested in approximating the underlying function to best discriminate between classes. In regression problems we are interested in approximating a function that best fits the real value output.
Choose the Multi-Layer Perceptron algorithm:
- Click the “Choose” button and select “MultilayerPerceptron” under the “function” group.
- Click on the name of the algorithm to review the algorithm configuration.
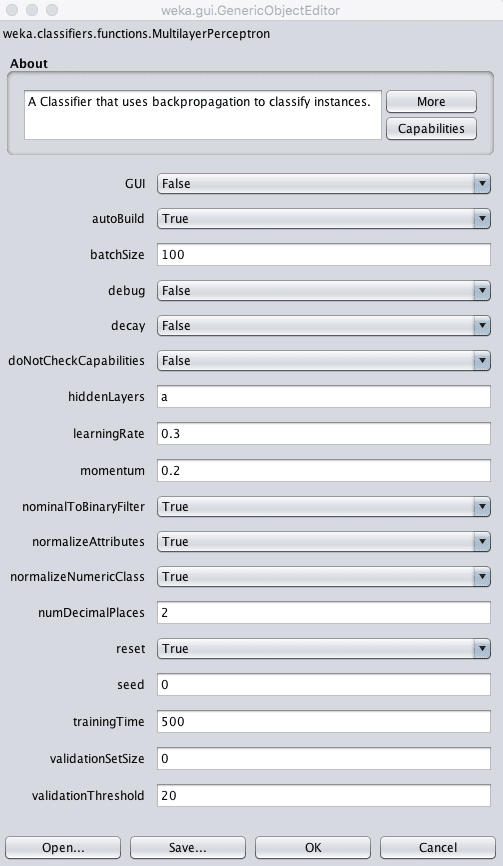
Weka Configuration for the Multi-Layer Perceptron Algorithm
You can manually specify the structure of the neural network that is used by the model, but this is not recommended for beginners.
The default will automatically design the network and train it on your dataset. The default will create a single hidden layer network. You can specify the number of hidden layers in the hiddenLayers parameter, set to automatic “a” by default.
You can also use a GUI to design the network structure. This can be fun, but it is recommended that you use the GUI with a simple train and test split of your training data, otherwise you will be asked to design a network for each of the 10 folds of cross validation.

Weka GUI Designer for the Multi-Layer Perceptron Algorithm
You can configure the learning process by specifying how much to update the model each epoch by setting the learning rate. common values are small such as values between 0.3 (the default) and 0.1.
The learning process can be further tuned with a momentum (set to 0.2 by default) to continue updating the weights even when no changes need to be made, and a decay (set decay to True) which will reduce the learning rate over time to perform more learning at the beginning of training and less at the end.
- Click “OK” to close the algorithm configuration.
- Click the “Start” button to run the algorithm on the Boston house price dataset.
You can see that with the default configuration that Multi-Layer Perceptron algorithm achieves an RMSE of 4.7.
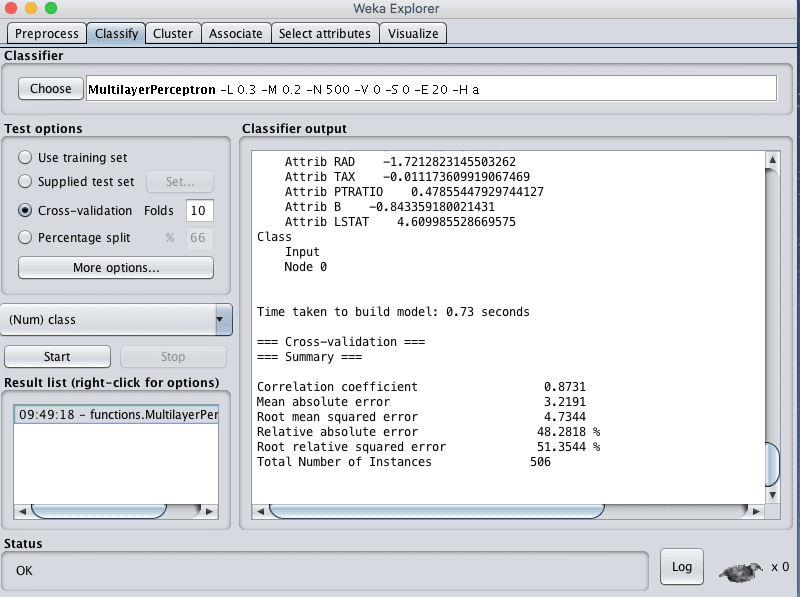
Weka Regression Results Multi-Layer Perceptron Algorithm
Summary
In this post you discovered regression algorithms in Weka.
Specifically you learned:
- About 5 top regression algorithms you can use for predictive modeling.
- How to run regression algorithms in Weka.
- About key configuration options for regression algorithms in Weka.
Do you have any questions about regression algorithms in Weka or about this post? Ask your questions in the comments and I will do my best to answer.
Discover Machine Learning Without The Code!
Develop Your Own Models in Minutes
...with just a few a few clicks
Discover how in my new Ebook:
Machine Learning Mastery With Weka
Covers self-study tutorials and end-to-end projects like:
Loading data, visualization, build models, tuning, and much more...
Finally Bring The Machine Learning To Your Own Projects
Skip the Academics. Just Results.


Hi Jason,
Very appreciate for your hard work on this webpages. I really learn a lot about WEKA from you 😉
Here I have a question about the interpretations of outputs. As we know, the values of both “Mean absolute error” and “Root mean squared error” are expected to be lower which indicates a better value.
However, in my case, “Relative absolute error” and “Root relative squared error” are greater than 100%!!! Is it possible? Are both lower values good as well as MAE/RMSE?
Thank you very much
Thanks Allen.
Generally, I would advise you to use Root Mean Square Error, it is just a well understood and well used metric. Only venture out to other measures if the requirements of your problem/domain/etc. force you.
Thank you for your reply, Jason.
Can we say “Relative absolute error” and “Root relative squared error” not the important indicators for regression? Or we just overlook them even if they are greater than 100%?
Hi Jason,
first of all i want to thank you for these Online Tutorials. They are very useful for me.
My question on this article is: How can you say that these are the top 5 Algortihms? Why not some others? Can you give a statement/reference or something?
Thank you very much
These are just algorithms I recommend applying on a problem to get a feeling for what might work and what might not.
It is good to have diversity of algorithm types to help flush out answers to this question.
In general, we cannot know which algorithm will perform best on our problem. If we did, we probably would not need machine learning – we would just solve our problem. That being said, the more you know about your data, the more ideas you get that a given algorithm type or representation might work better than others – but these are just heuristics.
Jason, is there a way to set the regularization parameter for the mutlilayer perceptron? This is a fairly common thing to do to make sure the network does not overfit your training data and generalizes well to new data. I’ve been looking in the options for the MultilayerPerceptron class on the Weka Javadoc and I can’t find anything. Any ideas? Thanks for writing this article!
Hi Dan,
It looks like this implementation does not have regularization.
Linear Regression Model
Time taken to build model: 0.04 seconds
=== Evaluation on test set ===
Time taken to test model on supplied test set: 0.02 seconds
=== Summary ===
Correlation coefficient 0.7914
Mean absolute error 0.3449
Root mean squared error 0.4511
Relative absolute error 53.6479 %
Root relative squared error 61.1281 %
Total Number of Instances 84
Ignored Class Unknown Instances 16
how can i interpret this pls
Consider just looking at the RMSE (root mean squared error), it is an error that has the same scale as your output variable.
i don’t understand what u mean by RMSE (root mean squared error), it is an error that has the same scale as your output variable. pls can you explain further am new on weka and i need this prediction for my research work thanks man
You can learn more about RMSE here:
https://en.wikipedia.org/wiki/Root-mean-square_deviation
thanks man, with the added data this what i get. Am sorry to bother you, with the Linear regression output, is this prediction reliable or not?
Test mode:evaluate on training data
=== Classifier model (full training set) ===
Linear Regression Model
question22a =
0.2423 * qualification +
0.2505 * question5 +
-0.13 * question6 +
-0.1356 * question7 +
-0.1561 * question8a +
-0.0983 * question10a +
0.3403 * question14b +
0.3004 * question16a +
-0.4492 * question16b +
-0.1079 * question17a +
0.1564 * question18a +
-0.1771 * question19b +
-0.2994 * question20b +
0.6329 * question21a +
0.3278 * question22b +
0.5585
Time taken to build model: 0.01 seconds
=== Evaluation on training set ===
=== Summary ===
Correlation coefficient 0.8079
Mean absolute error 0.3358
Root mean squared error 0.4201
Relative absolute error 53.2933 %
Root relative squared error 58.9348 %
Total Number of Instances 88
Ignored Class Unknown Instances 12
Consider reviewing the RMSE (root mean squared error), it has the same units as the variable you are predicting.
A skillful RMSE is domain specific, I cannot answer this for you.
Can i have more details of decision trees for regression such as buildiing a model, cross validation and prediction.
I am really appreciate your work. I have actually one question. I work out over linear regression by using data set which gives me appropriate result which i also compared with Ms Excel regression over same data set . The result was same.
Now I want to apply multiple regression. Is Weka Support multiple regression?
Because I search in weka and as well as google but unfortunately i don’t see any appropriate response.
Yes, weka supports multiple regression, e.g. multiple input features and one output feature.
Hello Jason,
I need to apply the models trained in WEKA in a c++ project. Is that possible? If so, how do you suggest that I do it?
Thanks in advance,
Rita
Perhaps you can call the Java API from cpp?
Hi Jason, thank you a lot for your nice writing.
My question is, where can I see the regression coefficient for any these methods?
The algorithms find the coefficients for you.
Thank you a lot Prof.Jason..
You’re welcome.
Dear Dr. Jason;
How I can export the regression results in Weka to other formats such as TIFF, ASC-II for visualization in a map.
Many thanks
Pham
This post shows you how to save a Weka model:
https://machinelearningmastery.com/save-machine-learning-model-make-predictions-weka/
how to start my first weather forecasting using weka work
This process will guide you:
https://machinelearningmastery.com/start-here/#process
Dear,
how can I know the value of Spearman and Kendall (correlation coefficient) from classification model?
and the correlation coefficient measure in regression model equal to the accuracy in the classification model?
We cannot calculate these correlation measures for class predictions.
It may be an appropriate measure for predictions on a regression problem.
Hi Dr.Jason
If I want to apply linear regression in WEKA
and I have dataset contains the following attributes: (p1,p2,p3,c1,c2,c3.. etc.)
I want choose ONE variable, ex: p3 to be the output result of p1 and p2
Also c3 to be result of both c1, c2 .
Can I do that? If yes, tell me how please. Because I worked on many hypothesis and I want the correlation coefficient for two variable as an output in one variable.
I’m not sue Weka is flexible enough for this, sorry.
=== Classifier model (full training set) ===
Linear Regression Model
consumption unit =
0.735 * WIFI unit +
0.9777 * Application unit +
0.9278 * GPS +
0.9922 * Calls unit +
111.7584 * battery life=2,3 +
360.8313 * battery life=3 +
23.4648
Time taken to build model: 0.02 seconds
=== Cross-validation ===
=== Summary ===
Correlation coefficient 0.9989
Mean absolute error 77.0165
Root mean squared error 310.2879
Relative absolute error 1.7131 %
Root relative squared error 4.6261 %
Total Number of Instances 366
Ignored Class Unknown Instances 1
why the MSE & RMSE is large in my the regression??
Some ideas:
Perhaps the problem is challenging?
Perhaps the model is a poor fit?
Many thanks, Jason for this wonderful exposition. Please, may I know which of these model treated is best, in relation the used data set? I mean, in terms of the RMSE values you, which result is better? The smaller or bigger?
Hi Olayinka…The following resource may be of interest to you:
https://machinelearningmastery.com/compare-performance-machine-learning-algorithms-weka/
can I apply more regression algorithm in same classifier ??
You can apply multiple regression algorithms for the same regression problem.
Hello Jason,
thank you for your articles, they re always of a good help 🙂
What abour Normalized Absolute Error (NAE) for regression models?
How do we interpret it? How do we make comparisons using it? And what could be a reason for a different ranking of the same models using RMSE and NAE?
Thank you in advance!
NAE is the absolute error divided by the error made if the average would have been predicted.
I don’t know about it, sorry.
I’ve not heard of NAE, sorry.
Hello Professor Jason,
I want to ask: can I know the CPU and/or RAM usage of producing some classification model using weka?
Best Regards,
Amneh.
I don’t know sorry, it will depend on the size of the dataset I guess.
Along with RMSE, does Correlation coefficient is justified to compare the results?
It can be very useful.
Does number of Rules affect the performance of model?
I suspect it will at some point, e.g. very large scale.
Hello Mr. Jason,
I’m very new to Weka and trying to use multilayer perceptron to predict incident duration.
categorical attribute already coded using unique integer in the dataset. Somehow it predict only one value for all test instances, like below :
Time taken to build model: 190.3 seconds
=== Predictions on test split ===
inst#,actual,predicted,error
1,6.57,6.087,-0.483
2,18.6,6.087,-12.513
3,6.45,6.087,-0.363
4,5.68,6.087,0.407
5,1.42,6.087,4.667
6,6.73,6.087,-0.643
7,7,6.087,-0.913
8,11.07,6.087,-4.983
9,5.9,6.087,0.187
10,65.18,6.087,-59.093
…
What did i do wrong?
Each input will have one output, and they are ordered by the order of the samples.
But i check all my test data, it only predict one value which is 6.087 in my case. It’s not normal isn’t it?
Yes that is not a good model. Perhaps try other models?
Hi Jasón. Thanks a lot for your outstanding work here.
I have a question. I want to perform imputation of a dataset that contains multiple instances of
15 features.
I’ve decided to use 15 multilayer perceptron (1 for each feature). To train each one i set up the feature to impute as the class, execute the buildclassifier method in java using the dataset and stored the resulting trained machine in a hash to latter impute any further not-seen instance.
When this instance arrives I take the MLP corresponding to the feature to impute and do it. To avoid wrong imputations I’ve decided to use a MICE- like technique that first performs basic filtering imputation of the whole instance and then uses each machine to impute original missing values.
Is the one art of selecting different machines by training them setting the class in each feature a good technique?
Thanks a lot!
Good question, typically we have to play the scientist and test a suite of methods in order to discover what works well for a given dataset.
I explain more here:
https://machinelearningmastery.com/faq/single-faq/what-algorithm-config-should-i-use
Thanks!!!
This is what I’m trying to do!
Great!
hai jason
I am getting a nominal output e.g:(>4,<4) for input glucose values.
how can I get numeric values e.g(3.4,4.5) for these what should i change in arff
Yes perhaps try that?
Thanks for the experiment, why are we using default setting, can it be changed if yes, when can it be applied.
The defaults work well.
Yes, you can change the settings and try and improve model performance.
This is a great guide to Weka. Many thanks!
I am trying to predict the next one or two vectors (4-7 dims) from a stack of 100 or so. Any thoughts on which tool will be best to start with?
Many thanks!
I recommend testing a suite of methods and use controlled experiments to discover what works best.
Thanks, Jason. My question was intended to ask about analyzing vectors rather than scalars. Any thoughts appreciated.
I’m not sure if weka supports multi-output regression, sorry.
Jason,
Thank you so much for all of the work you are putting into this. I have been reading your tutorials and buying your books, they are great resources!
I do have a question because there doesn’t seem to be much out there for Multiple Linear Regression in Weka. Would you consider doing a tutorial on performing a Multiple Linear Regression? My biggest issue is the Weka format for training data with the different categories I am trying to incorporate. Do you recommend wide data (converting category to one-hot)? Or tall data where we concatenate the training data with a third column for category?
Thank you again!
Thanks Keith!
Great suggestion, thanks.
I think Weka will perform the basic data prep like scaling and one hot encoding for you. Not sure about categorical inputs, perhaps try it and see?
Where I get
Weka GUI Designer for the Multi-Layer Perceptron Algorithm
Regards
jose
Also What and How do prediction with ANN
Well done!
This tutorial will show you how to make predictions with a model in Weka:
https://machinelearningmastery.com/save-machine-learning-model-make-predictions-weka/
Hi Jason,
Thank you for your explanation, I appreciate your work.
I have a question related to predication for a neural network using Weka, if I want to predict a specific class.
I need to make it as an output if I am not wrong.
However, when I did that the output of RMSE still the same even with different cycles (increase or decrease).
Can you clarify why I obtained the same result or output?
Best regards,
Sara.
Thanks.
It wounds like you are using an MLP on a regression problem. Perhaps change your dataset to a classification problem in order to be able to predict a class label.
Thanks Jason for your replay, I have another question.
If I am training the data for regression a specific class using MLP, do I need to set a ValidationSize in the parameter or I can leave it as 0?
Even with I train 50% of the data, 20% for validation and 30% for testing.
What is ValidationSize?
It is a parameter in MLP which refers to the validation set size in the data.
It is probably used for early stopping.
A larger validation set is a good idea, although you must ensure you use/spend enough data on training the model. Some experimentation may be required.
Thanks Jason,
Can you clarify the difference between two classifiers (MP5 & MLP)
for numeric prediction?
M5P is a decision tree based algorithm I believe.
MLP (multi-layer perceptron) is a neural net.
M5P*
Hello Jason,
thanks for your help with such kind of tutorials, can you clarify to me the difference between mean absolute error and relative absolute error?
and which one is better than another to consider?
Yes, this will help:
https://en.wikipedia.org/wiki/Approximation_error
Use a metric that best captures what is important to you/stakeholders about the model.
Hello Jason
Thank you very much for the articles and tutorials, they are really helpful.
I am using MLPRegressor on Weka, but there is hardly any information about it online. How is it any different from MLP and how does it work?
If you know where I can look for some more information, it would be greatly appreciated.
Thanks
Bora
It is an MLP (multilayer perceptron – a neural net). You can configure it for your regression problem.
Many thanks, Jason for this wonderful exposition. Please, may I know which of these model treated is best, in relation to the used data set? I mean, in terms of the RMSE values, which result is better? The smaller or bigger?
Hi Olayinka…You are very welcome! The following resource will add clarity:
https://machinelearningmastery.com/compare-performance-machine-learning-algorithms-weka/
I have created two models : One of Linear regression using m5,greedy and noattribute selection methods and Second one is Decision Stump , for numeric prediction .First I prepared model using 10-fold cross validation on fit data and then used those trained models on unseen test data . I have received all statistical indicators like correlation coefficient, root mean squared error(RMSE), root absolute error and all. My question is how can I compare these models. And how can I predict which model is better than other . I am new to WeKa tool. So I also don’t know how to interpret those parameters portaryed as a result in the weka tool.
Hi Pahul…Comparing models in Weka, a popular suite of machine learning software written in Java, involves several steps. Here’s a general guide on how to do it:
1. **Prepare Your Data**: Before you begin, ensure your data is in a format that Weka can read, typically ARFF, CSV, or a database through JDBC. Your dataset should be properly preprocessed, including handling missing values, feature selection, and normalization if necessary.
2. **Open Weka Explorer**: Start Weka and open the Explorer interface. This is the most common interface used for experimenting with different algorithms on your data.
3. **Load Your Dataset**: Go to the ‘Preprocess’ tab in the Explorer. Click ‘Open file…’ to load your dataset. Make sure your data is correctly loaded and attributes are properly recognized.
4. **Configure and Run Models**:
– Switch to the ‘Classify’ tab. Here, you can select different algorithms to build your models.
– Choose a classifier from the list. Weka includes a wide variety of algorithms, from simple ones like decision trees to more complex ones like neural networks or support vector machines.
– For each model, you can configure its parameters. Click the classifier name to open its configuration window. Adjusting these parameters can significantly affect model performance.
– Run each model separately by clicking ‘Start’. You can evaluate models using different methods like cross-validation or using a separate test set.
5. **Analyze the Results**:
– Each model’s performance is displayed in the output window. Pay attention to metrics like accuracy, precision, recall, F-measure, ROC area, etc., depending on your specific problem.
– For a more detailed analysis, you can view the confusion matrix, which shows the number of correct and incorrect predictions for each class.
6. **Comparing Models**:
– To compare models, you need to look at their performance metrics and decide which metrics are most important for your problem. For example, in some cases, accuracy might be key, while in others, precision and recall are more important.
– Make notes of each model’s performance and compare them manually.
7. **Statistical Tests (Optional)**:
– For a more rigorous comparison, you can use statistical tests. Weka provides options for this in the ‘Experimenter’ interface.
– In the Experimenter, you can set up a series of experiments with different algorithms and datasets, and then perform statistical tests (like paired t-tests) to see if there are significant differences in their performance.
8. **Conclusion**:
– Decide which model performs best based on your comparison and the requirements of your task.
– Remember that the best model is not always the one with the highest accuracy. Consider other factors like interpretability, speed, and complexity.
9. **Documentation and Reporting**:
– It’s good practice to document the process and results for future reference or reporting. Include details about the datasets, model configurations, and performance metrics.
This is a general overview, and the specific steps might vary depending on the complexity of your data and the models you are comparing. Weka’s user-friendly interface makes it relatively straightforward to perform these tasks, even for those who are new to machine learning.
Good day,
My project is on image processing on lung cancer detection using hybrid dual CNN framework using OCNN classifier and localization i need site that i can use GUI to train, validate and test my project.
Thank you Sir
Hi Mohammed…Please elaborate on your question so that we may better assist you.