Weka makes a large number of classification algorithms available.
The large number of machine learning algorithms available is one of the benefits of using the Weka platform to work through your machine learning problems.
In this post you will discover how to use 5 top machine learning algorithms in Weka.
After reading this post you will know:
About 5 top machine learning algorithms that you can use on your classification problems.
How to use 5 top classification algorithms in Weka.
The key configuration parameters for 5 top classification algorithms.
Kick-start your project with my new book Machine Learning Mastery With Weka, including step-by-step tutorials and clear screenshots for all examples.
Let’s get started.
How To Use Classification Machine Learning Algorithms in Weka Photo by Don Graham, some rights reserved.
Classification Algorithm Tour Overview
We are going to take a tour of 5 top classification algorithms in Weka.
Each algorithm that we cover will be briefly described in terms of how it works, key algorithm parameters will be highlighted and the algorithm will be demonstrated in the Weka Explorer interface.
The 5 algorithms that we will review are:
Logistic Regression
Naive Bayes
Decision Tree
k-Nearest Neighbors
Support Vector Machines
These are 5 algorithms that you can try on your classification problem as a starting point.
A standard machine learning classification problem will be used to demonstrate each algorithm. Specifically, the Ionosphere binary classification problem. This is a good dataset to demonstrate classification algorithms because the input variables are numeric and all have the same scale the problem only has two classes to discriminate.
Each instance describes the properties of radar returns from the atmosphere and the task is to predict whether or not there is structure in the ionosphere or not. There are 34 numerical input variables of generally the same scale. You can learn more about this dataset on the UCI Machine Learning Repository. Top results are in the order of 98% accuracy.
Start the Weka Explorer:
Open the Weka GUI Chooser.
Click the “Explorer” button to open the Weka Explorer.
Load the Ionosphere dataset from the data/ionosphere.arff file.
Click “Classify” to open the Classify tab.
Need more help with Weka for Machine Learning?
Take my free 14-day email course and discover how to use the platform step-by-step.
Click to sign-up and also get a free PDF Ebook version of the course.
Logistic Regression
Logistic regression is a binary classification algorithm.
It assumes the input variables are numeric and have a Gaussian (bell curve) distribution. This last point does not have to be true, as logistic regression can still achieve good results if your data is not Gaussian. In the case of the Ionosphere dataset, some input attributes have a Gaussian-like distribution, but many do not.
The algorithm learns a coefficient for each input value, which are linearly combined into a regression function and transformed using a logistic (s-shaped) function. Logistic regression is a fast and simple technique, but can be very effective on some problems.
The logistic regression only supports binary classification problems, although the Weka implementation has been adapted to support multi-class classification problems.
Choose the logistic regression algorithm:
Click the “Choose” button and select “Logistic” under the “functions” group.
Click on the name of the algorithm to review the algorithm configuration.
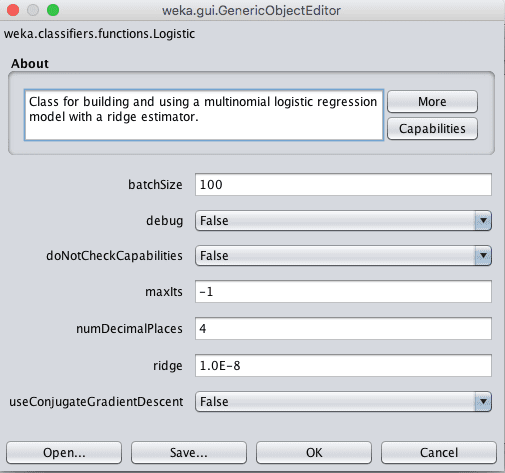
Weka Configuration for the Logistic Regression Algorithm
The algorithm can run for a fixed number of iterations (maxIts), but by default will run until it is estimated that the algorithm has converged.
The implementation uses a ridge estimator which is a type of regularization. This method seeks to simplify the model during training by minimizing the coefficients learned by the model. The ridge parameter defines how much pressure to put on the algorithm to reduce the size of the coefficients. Setting this to 0 will turn off this regularization.
Click “OK” to close the algorithm configuration.
Click the “Start” button to run the algorithm on the Ionosphere dataset.
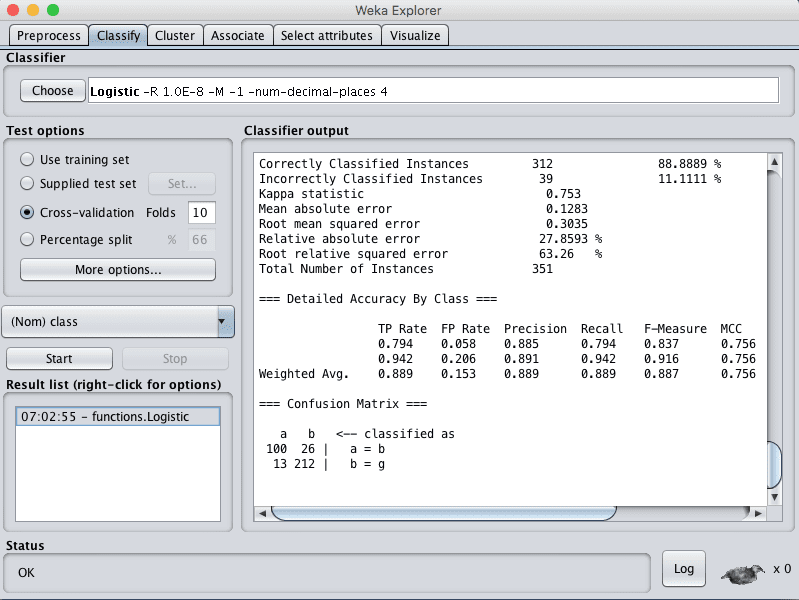
You can see that with the default configuration that logistic regression achieves an accuracy of 88%.
Weka Classification Results for the Logistic Regression Algorithm
Naive Bayes
Naive Bayes is a classification algorithm. Traditionally it assumes that the input values are nominal, although it numerical inputs are supported by assuming a distribution.
Naive Bayes uses a simple implementation of Bayes Theorem (hence naive) where the prior probability for each class is calculated from the training data and assumed to be independent of each other (technically called conditionally independent).
This is an unrealistic assumption because we expect the variables to interact and be dependent, although this assumption makes the probabilities fast and easy to calculate. Even under this unrealistic assumption, Naive Bayes has been shown to be a very effective classification algorithm.
Naive Bayes calculates the posterior probability for each class and makes a prediction for the class with the highest probability. As such, it supports both binary classification and multi-class classification problems.
Choose the Naive Bayes algorithm:
Click the “Choose” button and select “NaiveBayes” under the “bayes” group.
Click on the name of the algorithm to review the algorithm configuration.
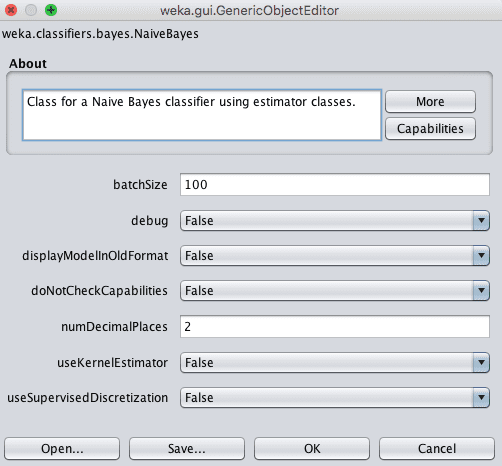
Weka Configuration for the Naive Bayes Algorithm
By default a Gaussian distribution is assumed for each numerical attributes.
You can change the algorithm to use a kernel estimator with the useKernelEstimator argument that may better match the actual distribution of the attributes in your dataset. Alternately, you can automatically convert numerical attributes to nominal attributes with the useSupervisedDiscretization parameter.
Click “OK” to close the algorithm configuration.
Click the “Start” button to run the algorithm on the Ionosphere dataset.
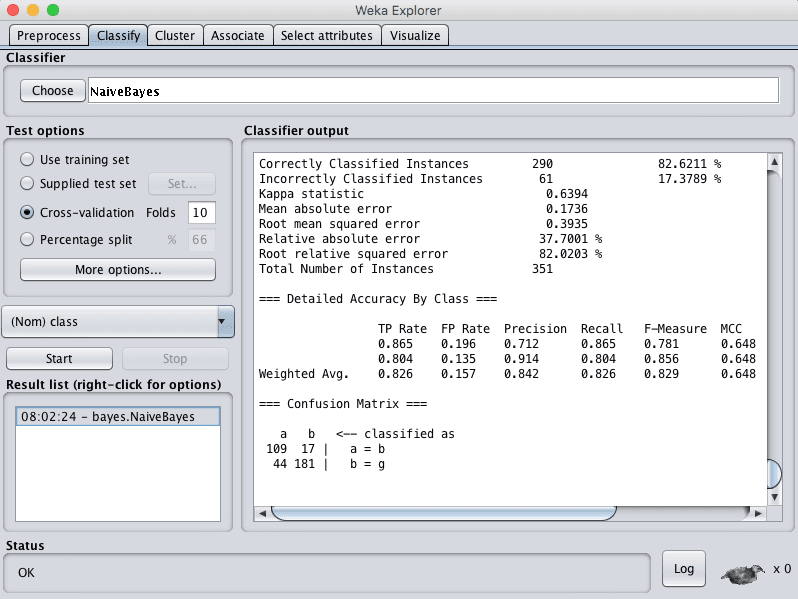
You can see that with the default configuration that Naive Bayes achieves an accuracy of 82%.
Weka Classification Results for the Naive Bayes Algorithm
There are a number of other flavors of naive bayes algorithms that you could work with.
Decision Tree
Decision trees can support classification and regression problems.
Decision trees are more recently referred to as Classification And Regression Trees (CART). They work by creating a tree to evaluate an instance of data, start at the root of the tree and moving town to the leaves (roots) until a prediction can be made. The process of creating a decision tree works by greedily selecting the best split point in order to make predictions and repeating the process until the tree is a fixed depth.
After the tree is constructed, it is pruned in order to improve the model’s ability to generalize to new data.
Choose the decision tree algorithm:
Click the “Choose” button and select “REPTree” under the “trees” group.
Click on the name of the algorithm to review the algorithm configuration.
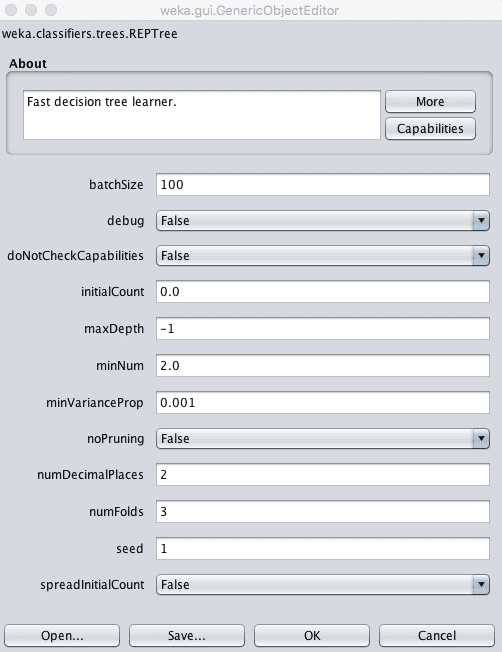
Weka Configuration for the Decision Tree Algorithm
The depth of the tree is defined automatically, but a depth can be specified in the maxDepth attribute.
You can also choose to turn of pruning by setting the noPruning parameter to True, although this may result in worse performance.
The minNum parameter defines the minimum number of instances supported by the tree in a leaf node when constructing the tree from the training data.
Click “OK” to close the algorithm configuration.
Click the “Start” button to run the algorithm on the Ionosphere dataset.
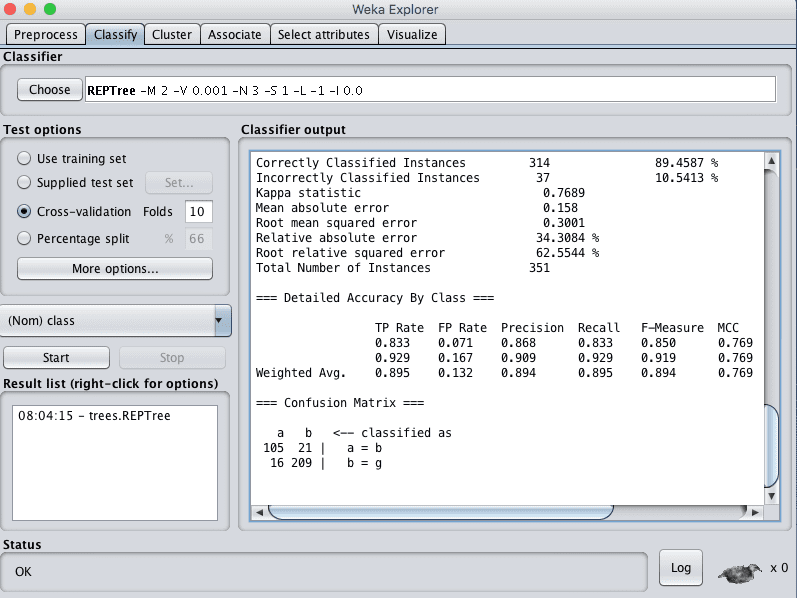
You can see that with the default configuration that the decision tree algorithm achieves an accuracy of 89%.
Weka Classification Results for the Decision Tree Algorithm
Another more advanced decision tree algorithm that you can use is the C4.5 algorithm, called J48 in Weka.
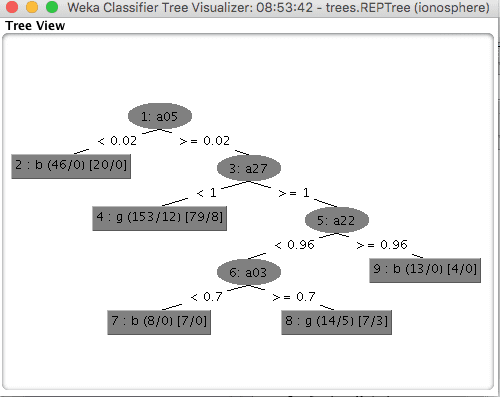
You can review a visualization of a decision tree prepared on the entire training data set by right clicking on the “Result list” and clicking “Visualize Tree”.
Weka Visualization of a Decision Tree
k-Nearest Neighbors
The k-nearest neighbors algorithm supports both classification and regression. It is also called kNN for short.
It works by storing the entire training dataset and querying it to locate the k most similar training patterns when making a prediction. As such, there is no model other than the raw training dataset and the only computation performed is the querying of the training dataset when a prediction is requested.
It is a simple algorithm, but one that does not assume very much about the problem other than that the distance between data instances is meaningful in making predictions. As such, it often achieves very good performance.
When making predictions on classification problems, KNN will take the mode (most common class) of the k most similar instances in the training dataset.
Choose the k-Nearest Neighbors algorithm:
Click the “Choose” button and select “IBk” under the “lazy” group.
Click on the name of the algorithm to review the algorithm configuration.
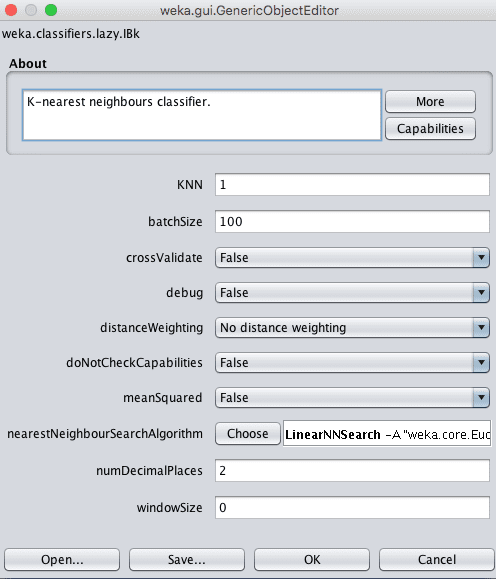
Weka Configuration for the k-Nearest Neighbors Algorithm
The size of the neighborhood is controlled by the k parameter.
For example, if k is set to 1, then predictions are made using the single most similar training instance to a given new pattern for which a prediction is requested. Common values for k are 3, 7, 11 and 21, larger for larger dataset sizes. Weka can automatically discover a good value for k using cross validation inside the algorithm by setting the crossValidate parameter to True.
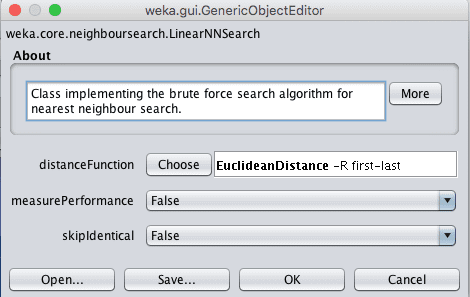
Another important parameter is the distance measure used. This is configured in the nearestNeighbourSearchAlgorithm which controls the way in which the training data is stored and searched.
The default is a LinearNNSearch. Clicking the name of this search algorithm will provide another configuration window where you can choose a distanceFunction parameter. By default, Euclidean distance is used to calculate the distance between instances, which is good for numerical data with the same scale. Manhattan distance is good to use if your attributes differ in measures or type.
Weka Configuration for the Search Algorithm in the k-Nearest Neighbors Algorithm
It is a good idea to try a suite of different k values and distance measures on your problem and see what works best.
Click “OK” to close the algorithm configuration.
Click the “Start” button to run the algorithm on the Ionosphere dataset.
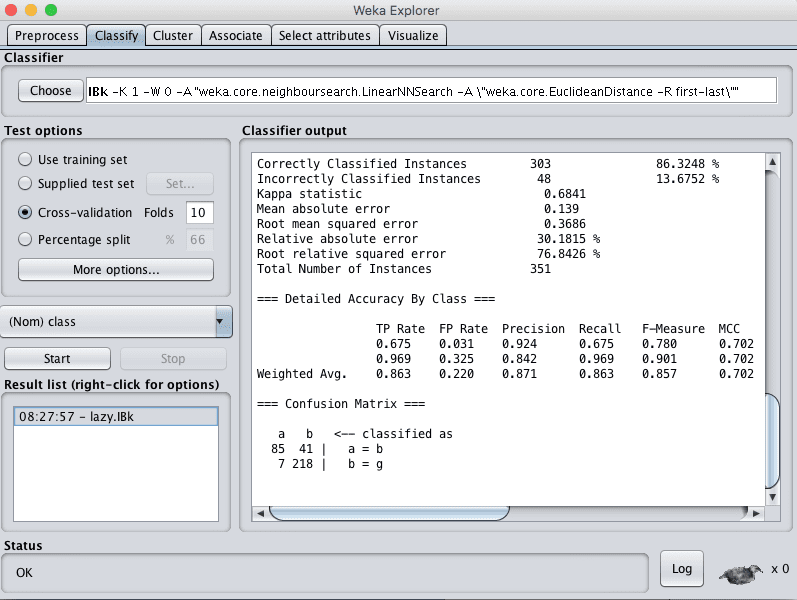
You can see that with the default configuration that the kNN algorithm achieves an accuracy of 86%.
Weka Classification Results for k-Nearest Neighbors
Support Vector Machines
Support Vector Machines were developed for binary classification problems, although extensions to the technique have been made to support multi-class classification and regression problems. The algorithm is often referred to as SVM for short.
SVM was developed for numerical input variables, although will automatically convert nominal values to numerical values. Input data is also normalized before being used.
SVM work by finding a line that best separates the data into the two groups. This is done using an optimization process that only considers those data instances in the training dataset that are closest to the line that best separates the classes. The instances are called support vectors, hence the name of the technique.
In almost all problems of interest, a line cannot be drawn to neatly separate the classes, therefore a margin is added around the line to relax the constraint, allowing some instances to be misclassified but allowing a better result overall.
Finally, few datasets can be separated with just a straight line. Sometimes a line with curves or even polygonal regions need to be marked out. This is achieved with SVM by projecting the data into a higher dimensional space in order to draw the lines and make predictions. Different kernels can be used to control the projection and the amount of flexibility in separating the classes.
Choose the SVM algorithm:
Click the “Choose” button and select “SMO” under the “function” group.
Click on the name of the algorithm to review the algorithm configuration.
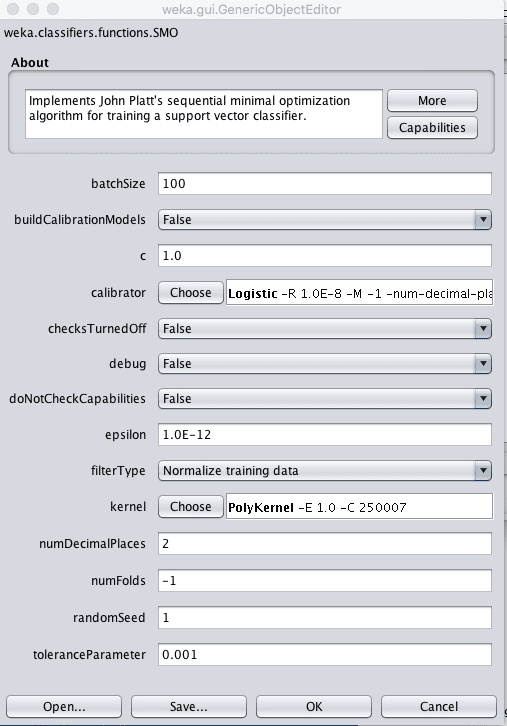
SMO refers to the specific efficient optimization algorithm used inside the SVM implementation, which stands for Sequential Minimal Optimization.
Weka Configuration for the Support Vector Machines Algorithm
The C parameter, called the complexity parameter in Weka controls how flexible the process for drawing the line to separate the classes can be. A value of 0 allows no violations of the margin, whereas the default is 1.
A key parameter in SVM is the type of Kernel to use. The simplest kernel is a Linear kernel that separates data with a straight line or hyperplane. The default in Weka is a Polynomial Kernel that will separate the classes using a curved or wiggly line, the higher the polynomial, the more wiggly (the exponent value).
A popular and powerful kernel is the RBF Kernel or Radial Basis Function Kernel that is capable of learning closed polygons and complex shapes to separate the classes.
It is a good idea to try a suite of different kernels and C (complexity) values on your problem and see what works best.
Click “OK” to close the algorithm configuration.
Click the “Start” button to run the algorithm on the Ionosphere dataset.
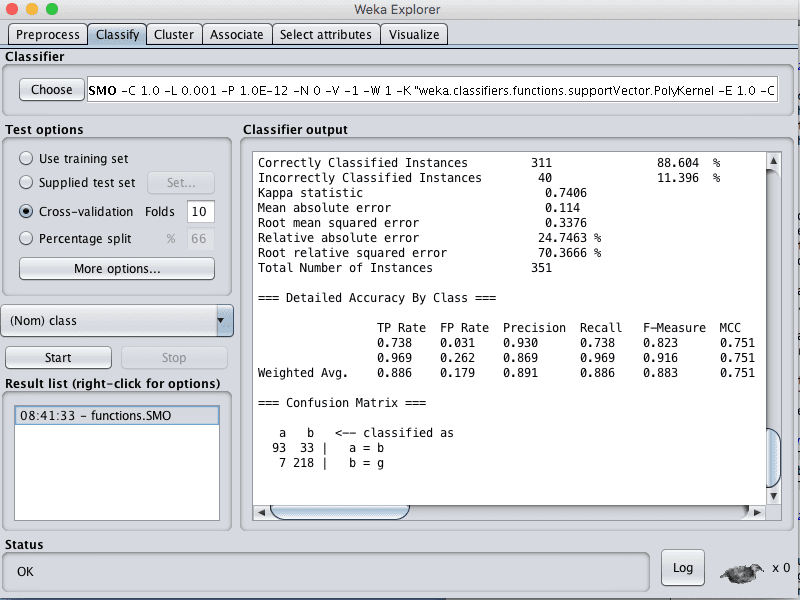
You can see that with the default configuration that the SVM algorithm achieves an accuracy of 88%.
Weka Classification Results for the Support Vector Machine Algorithm
Summary
In this post you discovered how to use top classification machine learning algorithms in Weka.
Specifically, you learned:
5 top classification algorithms you can try on your own problems.
The key configuration parameters to tune for each algorithm.
How to use each algorithm in Weka.
Do you have any questions about classification algorithms in Weka or about this post? Ask your questions in the comments and I will do my best to answer.
hi thanks for the blog. i just want to know if i apply all these algorithms and get result, how can i compare them to see the best one for my data set ?
thanks !
1. Performance. What is the measure that best captures what you want from a model, find the model or models that achieve the best scores on that measure.
2. Complexity. We want the simplest model that performs well. This is good for things like maintainability, explainability, updatability, etc.
You want to bake-off all of the algorithms and all of the data representations you can possibly think of, and pick the “best” using these two criteria. At least as a starting point.
Very helpful. I have question how do we know that we have to select only these 5 algorithms?Why did you choose only these 5 algorithms out of many algorithms ?
Very helpful. I have question: how can we apply Naive Bayes and SVM on mixed data set such as Credit Approval Data Set from UCI ,because both of them can not handle numerical and nominal data set directly.
Hi. This was very informative. I have a question here. Just like we visualize the tree structure in J48 algorithm, or any tree based algorithm, to visualize the model, how can we visualize models like logistic regression, k-nearest neighbors, etc. – basically, a non – tree based algorithm? I wish to visualize the pattern for training and testing sets.
Model selection involves not only skill, but also the broader concerns of the problem.
The difference between model skills may or may not be significance. Statistical significance tests may be used to help tease out whether the difference in skill is real.
For example, we often prefer simpler models over more complex models.
Stakeholders may also prefer models with a specific form.
Thanks for this useful article , i have a question in the confusion matrix which is, how can i get in weka how the algorithm confused make the right classifier, means the classifiers can predict that these 500 instances belong to class a and the other 50 instances predicted that they belong to class b although the actual it should belong to class a
Hello Jason. Thanks for this. i have a question. How I can compare the classifications (e.g. SVM vs MLP). I though to understand their agreement using e.g. the Adjusted Rand Index. But I do not understand how to extract the classification of each case (instance) in the various classification processes. Can you help me with that? Thanks in adance.
Hi Jason, Your blog is really useful and the way of explaining the topics is easy to understand, Could you please also write a article on AIC and BIC.
1. On which algorithms it can be used ?
2. Whether it is compared across different algorithms or different models of same algorithms ?
3. Which one to consider AIC/BIC or RMSE/Accuracy ?
Looking forward for the post.
I have a question on how to used the four kernels in SVM. I didn’t found option for Linear and Sigmoid kernels. How to configure the setting for different kernel?
I did this on a dataset and I found the accuracy and percentage of Best classifier are same for the SVM and decision technique as well as same confusion matrix for Decision Tree and SVM. So, in this situation, how you choose the best classifier ?
Hello. Thanks to the training, it was very informative. How can we compare all these algorithms together? What part do we need to zoom in to compare answers? And how do I save results?
In fact, I saw your posts that were about uploading and saving, but when we save it when we want to reload, the shape and input changes and doesn’t show the percentage.
I used this 5 algorithms in weka and get results. but in my result i want to comparison all the algorithms and see which algorithms work correctly and better in all of my result. what i do?
Hi Jason, great post. Glad you are still replying in 2020.
A question, is it possible to ensemble two different classifiers in Weka just like we could do in other programming languages like Python?
Appreciated!
Hi Jason, Very good tutorial to start with. Could you please let me know which algorithm is suitable for classification of text data where there will be around 70-90 different classes?
Look forward for your response.
Thanks
Hai dear Jason, i like your explanation.. it is easy to understand.
I run my own data using LR, KNN, J48, NB and SVM using weka and python follow your tutorial. But i dont get the same result of accuracy for both platform (weka vs python). can i know why?
LDA algorithm not able to run in weka is it?but in python it have.
and one more thing, why python not 100%v predict in the confusion matrix. but in weka i can see 100% of the data is predicted although both used 10 fold cross validation.
One is not better than the other, they are different. You must choose the technique that you believe you can trust for your predictive modeling project.
Hi sir
very good explanation in classification.Can you please hep me out with any resources to FURIA CLASSIFICATION in python…..it is working out in weka but not able to work with weka.classifiers.rules.FURIA in python
Dear Jason,
Thank you for this article.
Do you have any idea how to test my structural model using WEKA?
I have 7 primary constructs in my model and each construct has at least 7 indicators. and I am seeking to predict perceived intention to use using these constructs.


hi thanks for the blog. i just want to know if i apply all these algorithms and get result, how can i compare them to see the best one for my data set ?
thanks !
Great question malik.
Model selection often comes down to 2 things:
1. Performance. What is the measure that best captures what you want from a model, find the model or models that achieve the best scores on that measure.
2. Complexity. We want the simplest model that performs well. This is good for things like maintainability, explainability, updatability, etc.
You want to bake-off all of the algorithms and all of the data representations you can possibly think of, and pick the “best” using these two criteria. At least as a starting point.
Does that help?
very helpful!!!
I’m glad to hear that.
sir, after installing R plug- in in weka . Explorer tab not working and MLR package update again and again . Only zero R is working.
I don’t know sorry. Perhaps try posting on the weka user group?
hi. 🙂
i would like to ask what is this “0.02” which split the tree? i mean it’s not the median, nor arithmetic avarage.
Thanks 🙂
Generally, specific values are used as split points in decision trees.
Can I have a question, on what basis are this “specific values” selected?
Great question.
You can learn more about how CART works here:
https://machinelearningmastery.com/classification-and-regression-trees-for-machine-learning/
Very helpful, thank you…..
I’m glad you found it useful Ann!
Very helpful. I have question how do we know that we have to select only these 5 algorithms?Why did you choose only these 5 algorithms out of many algorithms ?
Choose any algorithms you wish.
Very helpful. I have question: how can we apply Naive Bayes and SVM on mixed data set such as Credit Approval Data Set from UCI ,because both of them can not handle numerical and nominal data set directly.
Both naive bayes and SVM can handle real valued inputs, you could transform the data into this standard form.
hi Jason
how do i add a new classifier algorithm in Weka?
Sorry, I do not have an example of this.
Hi. This was very informative. I have a question here. Just like we visualize the tree structure in J48 algorithm, or any tree based algorithm, to visualize the model, how can we visualize models like logistic regression, k-nearest neighbors, etc. – basically, a non – tree based algorithm? I wish to visualize the pattern for training and testing sets.
Generally, we don’t. Instead, we use proxies for visualization such as skill scores like accuracy or RMSE.
Thanks a lot
Hi. How to use own algorithm in svm using Weka? Help me. Thank you in advance.
Sorry, I don’t have an example of implementing a custom algorithm in Weka.
Hello! please help me with the summary about logistic regression in weka like you did that with svm, naive etc.
What is the problem exactly?
I had a question. May i know for the below result, which is the best model? Which parameter did i need to consider?
J48 66.0651%(correctly classifier) 0.4584(RMSE) 0.3217 (kappa) 0.707(ROC) 0.12(time taken)
SMO 66.0967%(correctly classifier) 0.5823(RMSE) 0.3222 (kappa) 0.661(ROC) 100.08(time taken)
Model selection involves not only skill, but also the broader concerns of the problem.
The difference between model skills may or may not be significance. Statistical significance tests may be used to help tease out whether the difference in skill is real.
For example, we often prefer simpler models over more complex models.
Stakeholders may also prefer models with a specific form.
Hi Jason,
Thanks for this useful article , i have a question in the confusion matrix which is, how can i get in weka how the algorithm confused make the right classifier, means the classifiers can predict that these 500 instances belong to class a and the other 50 instances predicted that they belong to class b although the actual it should belong to class a
This tutorial shows how to make predictions on new data:
https://machinelearningmastery.com/save-machine-learning-model-make-predictions-weka/
Hello Jason. Thanks for this. i have a question. How I can compare the classifications (e.g. SVM vs MLP). I though to understand their agreement using e.g. the Adjusted Rand Index. But I do not understand how to extract the classification of each case (instance) in the various classification processes. Can you help me with that? Thanks in adance.
This post shows how to make predictions in Weka:
https://machinelearningmastery.com/save-machine-learning-model-make-predictions-weka/
Hi Jason, Your blog is really useful and the way of explaining the topics is easy to understand, Could you please also write a article on AIC and BIC.
1. On which algorithms it can be used ?
2. Whether it is compared across different algorithms or different models of same algorithms ?
3. Which one to consider AIC/BIC or RMSE/Accuracy ?
Looking forward for the post.
Thanks for the suggestions!
Hello Jason!
I have a question on how to used the four kernels in SVM. I didn’t found option for Linear and Sigmoid kernels. How to configure the setting for different kernel?
In the configuration for SVM you can choose the kernel, then click on the kernel to change its configuration.
Please, where is the linear kernel in SVM?
Change the configuration for “kernel” and select linear.
hello, what classifier can you suggest that works best with 2 attributes having real data (numeric)?
Try a suite of methods to see what works best for your specific dataset, this may help:
https://machinelearningmastery.com/faq/single-faq/what-algorithm-config-should-i-use
Hey Hello,
Thanks for the basic tutorial.
I did this on a dataset and I found the accuracy and percentage of Best classifier are same for the SVM and decision technique as well as same confusion matrix for Decision Tree and SVM. So, in this situation, how you choose the best classifier ?
Good question. I recommend choosing the simplest/least complex method.
Perhaps the decision tree is less complex than SVM.
How can we use weka classify sensitive data?
What is “sensitive data”?
Dear Sir, well work. my Question is that how we can say that these are top algorithms?
secondly, which one show best result out of the above 5 ?
I recommend testing a suite of algorithms on your problem and discover what works best on your specific dataset.
Jason – What is the best way to create a graphs of the individual algorithms over time in Weka? Like a learning curve.
Sorry, I don’t have an example of learning curves in Weka.
Thanks for the tutorial.
For the decision tree example, can you explain the values that are printed out on the leaves?
Thanks
Great question.
I’m not sure off hand, perhaps check the Weka user manual:
https://machinelearningmastery.com/help-with-weka/
Hello. Thanks to the training, it was very informative. How can we compare all these algorithms together? What part do we need to zoom in to compare answers? And how do I save results?
You can use the Weka experimenter to compare many algorithms on your dataset, get started here:
https://machinelearningmastery.com/start-here/#weka
In fact, I saw your posts that were about uploading and saving, but when we save it when we want to reload, the shape and input changes and doesn’t show the percentage.
Sorry, I don’t follow, can you elaborate please?
How do I copy the output of the algorithm into Weka software, so how do I save the algorithm and find the percentage of each algorithm in the output?
Sorry, I don’t follow, can you please elaborate?
How do I store the outputs of the algorithm? I mean, the classifier output part, how do I store the answer that shows?
Perhaps select all text, copy to clipboard, paste in a text editor?
I used this 5 algorithms in weka and get results. but in my result i want to comparison all the algorithms and see which algorithms work correctly and better in all of my result. what i do?
You can use the experimenter:
https://machinelearningmastery.com/compare-performance-machine-learning-algorithms-weka/
How is use to Weka tool
Here are some tutorials:
https://machinelearningmastery.com/start-here/#weka
hey dear jason, please Compare the results of the five algorithms used and conclude them. thx you
Thanks for the suggestion.
I mean, help me get this out, I want to Compare the results of the five algorithms used and conclude them.and I should be thankful to you
You can follow this tutorial and adapt it for your needs:
https://machinelearningmastery.com/regression-machine-learning-tutorial-weka/
Specifically, I mean you put this out of this dataset
Hi Jason, great post. Glad you are still replying in 2020.
A question, is it possible to ensemble two different classifiers in Weka just like we could do in other programming languages like Python?
Appreciated!
Thanks!
Yes, you can use voting or stacking.
Hi Jason, Very good tutorial to start with. Could you please let me know which algorithm is suitable for classification of text data where there will be around 70-90 different classes?
Look forward for your response.
Thanks
Test a suite of algorithms and discover what works well for your specific dataset.
CNNs for text classification do very well.
Hai dear Jason, i like your explanation.. it is easy to understand.
I run my own data using LR, KNN, J48, NB and SVM using weka and python follow your tutorial. But i dont get the same result of accuracy for both platform (weka vs python). can i know why?
LDA algorithm not able to run in weka is it?but in python it have.
and one more thing, why python not 100%v predict in the confusion matrix. but in weka i can see 100% of the data is predicted although both used 10 fold cross validation.
i really need your opinion on this..
thank you.
We can expect different results, see this:
https://machinelearningmastery.com/faq/single-faq/why-do-i-get-different-results-each-time-i-run-the-code
tq so much dear jason..i got it well..
You’re welcome.
can you explain what is the difference using cross-validation and traniing_test data? which one is better?
You can learn about k-fold cross-validation here:
https://machinelearningmastery.com/k-fold-cross-validation/
You can learn about train/test split here:
https://machinelearningmastery.com/train-test-split-for-evaluating-machine-learning-algorithms/
One is not better than the other, they are different. You must choose the technique that you believe you can trust for your predictive modeling project.
If you’re unsure, use cross-validation.
thank you very much.it helps me a lot.
You’re welcome.
Very useful. Thanks!
You’re welcome.
Nice tutorial!!!
What is the difference between testing data and training data
Training data is used to fit the model, testing data is used to evaluate a fit model.
Hi sir
very good explanation in classification.Can you please hep me out with any resources to FURIA CLASSIFICATION in python…..it is working out in weka but not able to work with weka.classifiers.rules.FURIA in python
Hi Sakthi…The following is a great resource for Furia classification:
https://citeseerx.ist.psu.edu/viewdoc/download?doi=10.1.1.447.2303&rep=rep1&type=pdf
Dear Jason,
Thank you for this article.
Do you have any idea how to test my structural model using WEKA?
I have 7 primary constructs in my model and each construct has at least 7 indicators. and I am seeking to predict perceived intention to use using these constructs.
Hi Akon…You may find the following helpful:
https://machinelearningmastery.com/estimate-performance-machine-learning-algorithms-weka/
Loving the write-ups!
Thank you Jerry for your support and feedback!