Machine learning is a field of study and is concerned with algorithms that learn from examples.
Classification is a task that requires the use of machine learning algorithms that learn how to assign a class label to examples from the problem domain. An easy to understand example is classifying emails as “spam” or “not spam.”
There are many different types of classification tasks that you may encounter in machine learning and specialized approaches to modeling that may be used for each.
In this tutorial, you will discover different types of classification predictive modeling in machine learning.
After completing this tutorial, you will know:
- Classification predictive modeling involves assigning a class label to input examples.
- Binary classification refers to predicting one of two classes and multi-class classification involves predicting one of more than two classes.
- Multi-label classification involves predicting one or more classes for each example and imbalanced classification refers to classification tasks where the distribution of examples across the classes is not equal.
Kick-start your project with my new book Machine Learning Mastery With Python, including step-by-step tutorials and the Python source code files for all examples.
Let’s get started.

Types of Classification in Machine Learning
Photo by Rachael, some rights reserved.
Tutorial Overview
This tutorial is divided into five parts; they are:
- Classification Predictive Modeling
- Binary Classification
- Multi-Class Classification
- Multi-Label Classification
- Imbalanced Classification
Classification Predictive Modeling
In machine learning, classification refers to a predictive modeling problem where a class label is predicted for a given example of input data.
Examples of classification problems include:
- Given an example, classify if it is spam or not.
- Given a handwritten character, classify it as one of the known characters.
- Given recent user behavior, classify as churn or not.
From a modeling perspective, classification requires a training dataset with many examples of inputs and outputs from which to learn.
A model will use the training dataset and will calculate how to best map examples of input data to specific class labels. As such, the training dataset must be sufficiently representative of the problem and have many examples of each class label.
Class labels are often string values, e.g. “spam,” “not spam,” and must be mapped to numeric values before being provided to an algorithm for modeling. This is often referred to as label encoding, where a unique integer is assigned to each class label, e.g. “spam” = 0, “no spam” = 1.
There are many different types of classification algorithms for modeling classification predictive modeling problems.
There is no good theory on how to map algorithms onto problem types; instead, it is generally recommended that a practitioner use controlled experiments and discover which algorithm and algorithm configuration results in the best performance for a given classification task.
Classification predictive modeling algorithms are evaluated based on their results. Classification accuracy is a popular metric used to evaluate the performance of a model based on the predicted class labels. Classification accuracy is not perfect but is a good starting point for many classification tasks.
Instead of class labels, some tasks may require the prediction of a probability of class membership for each example. This provides additional uncertainty in the prediction that an application or user can then interpret. A popular diagnostic for evaluating predicted probabilities is the ROC Curve.
There are perhaps four main types of classification tasks that you may encounter; they are:
- Binary Classification
- Multi-Class Classification
- Multi-Label Classification
- Imbalanced Classification
Let’s take a closer look at each in turn.
Binary Classification
Binary classification refers to those classification tasks that have two class labels.
Examples include:
- Email spam detection (spam or not).
- Churn prediction (churn or not).
- Conversion prediction (buy or not).
Typically, binary classification tasks involve one class that is the normal state and another class that is the abnormal state.
For example “not spam” is the normal state and “spam” is the abnormal state. Another example is “cancer not detected” is the normal state of a task that involves a medical test and “cancer detected” is the abnormal state.
The class for the normal state is assigned the class label 0 and the class with the abnormal state is assigned the class label 1.
It is common to model a binary classification task with a model that predicts a Bernoulli probability distribution for each example.
The Bernoulli distribution is a discrete probability distribution that covers a case where an event will have a binary outcome as either a 0 or 1. For classification, this means that the model predicts a probability of an example belonging to class 1, or the abnormal state.
Popular algorithms that can be used for binary classification include:
- Logistic Regression
- k-Nearest Neighbors
- Decision Trees
- Support Vector Machine
- Naive Bayes
Some algorithms are specifically designed for binary classification and do not natively support more than two classes; examples include Logistic Regression and Support Vector Machines.
Next, let’s take a closer look at a dataset to develop an intuition for binary classification problems.
We can use the make_blobs() function to generate a synthetic binary classification dataset.
The example below generates a dataset with 1,000 examples that belong to one of two classes, each with two input features.
|
1 2 3 4 5 6 7 8 9 10 11 12 13 14 15 16 17 18 19 20 21 |
# example of binary classification task from numpy import where from collections import Counter from sklearn.datasets import make_blobs from matplotlib import pyplot # define dataset X, y = make_blobs(n_samples=1000, centers=2, random_state=1) # summarize dataset shape print(X.shape, y.shape) # summarize observations by class label counter = Counter(y) print(counter) # summarize first few examples for i in range(10): print(X[i], y[i]) # plot the dataset and color the by class label for label, _ in counter.items(): row_ix = where(y == label)[0] pyplot.scatter(X[row_ix, 0], X[row_ix, 1], label=str(label)) pyplot.legend() pyplot.show() |
Running the example first summarizes the created dataset showing the 1,000 examples divided into input (X) and output (y) elements.
The distribution of the class labels is then summarized, showing that instances belong to either class 0 or class 1 and that there are 500 examples in each class.
Next, the first 10 examples in the dataset are summarized, showing the input values are numeric and the target values are integers that represent the class membership.
|
1 2 3 4 5 6 7 8 9 10 11 12 13 14 |
(1000, 2) (1000,) Counter({0: 500, 1: 500}) [-3.05837272 4.48825769] 0 [-8.60973869 -3.72714879] 1 [1.37129721 5.23107449] 0 [-9.33917563 -2.9544469 ] 1 [-11.57178593 -3.85275513] 1 [-11.42257341 -4.85679127] 1 [-10.44518578 -3.76476563] 1 [-10.44603561 -3.26065964] 1 [-0.61947075 3.48804983] 0 [-10.91115591 -4.5772537 ] 1 |
Finally, a scatter plot is created for the input variables in the dataset and the points are colored based on their class value.
We can see two distinct clusters that we might expect would be easy to discriminate.
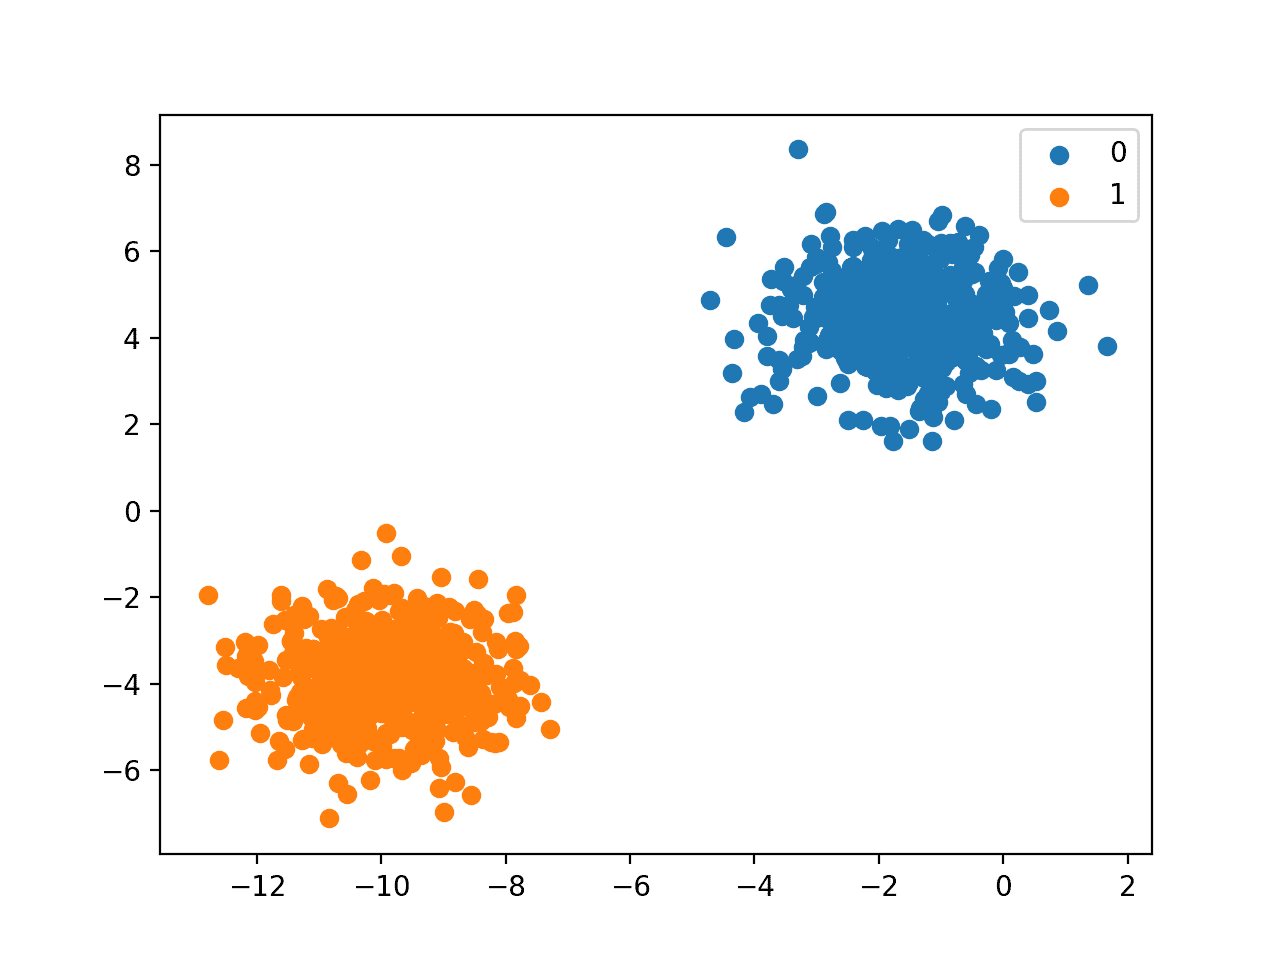
Scatter Plot of Binary Classification Dataset
Multi-Class Classification
Multi-class classification refers to those classification tasks that have more than two class labels.
Examples include:
- Face classification.
- Plant species classification.
- Optical character recognition.
Unlike binary classification, multi-class classification does not have the notion of normal and abnormal outcomes. Instead, examples are classified as belonging to one among a range of known classes.
The number of class labels may be very large on some problems. For example, a model may predict a photo as belonging to one among thousands or tens of thousands of faces in a face recognition system.
Problems that involve predicting a sequence of words, such as text translation models, may also be considered a special type of multi-class classification. Each word in the sequence of words to be predicted involves a multi-class classification where the size of the vocabulary defines the number of possible classes that may be predicted and could be tens or hundreds of thousands of words in size.
It is common to model a multi-class classification task with a model that predicts a Multinoulli probability distribution for each example.
The Multinoulli distribution is a discrete probability distribution that covers a case where an event will have a categorical outcome, e.g. K in {1, 2, 3, …, K}. For classification, this means that the model predicts the probability of an example belonging to each class label.
Many algorithms used for binary classification can be used for multi-class classification.
Popular algorithms that can be used for multi-class classification include:
- k-Nearest Neighbors.
- Decision Trees.
- Naive Bayes.
- Random Forest.
- Gradient Boosting.
Algorithms that are designed for binary classification can be adapted for use for multi-class problems.
This involves using a strategy of fitting multiple binary classification models for each class vs. all other classes (called one-vs-rest) or one model for each pair of classes (called one-vs-one).
- One-vs-Rest: Fit one binary classification model for each class vs. all other classes.
- One-vs-One: Fit one binary classification model for each pair of classes.
Binary classification algorithms that can use these strategies for multi-class classification include:
- Logistic Regression.
- Support Vector Machine.
Next, let’s take a closer look at a dataset to develop an intuition for multi-class classification problems.
We can use the make_blobs() function to generate a synthetic multi-class classification dataset.
The example below generates a dataset with 1,000 examples that belong to one of three classes, each with two input features.
|
1 2 3 4 5 6 7 8 9 10 11 12 13 14 15 16 17 18 19 20 21 |
# example of multi-class classification task from numpy import where from collections import Counter from sklearn.datasets import make_blobs from matplotlib import pyplot # define dataset X, y = make_blobs(n_samples=1000, centers=3, random_state=1) # summarize dataset shape print(X.shape, y.shape) # summarize observations by class label counter = Counter(y) print(counter) # summarize first few examples for i in range(10): print(X[i], y[i]) # plot the dataset and color the by class label for label, _ in counter.items(): row_ix = where(y == label)[0] pyplot.scatter(X[row_ix, 0], X[row_ix, 1], label=str(label)) pyplot.legend() pyplot.show() |
Running the example first summarizes the created dataset showing the 1,000 examples divided into input (X) and output (y) elements.
The distribution of the class labels is then summarized, showing that instances belong to class 0, class 1, or class 2 and that there are approximately 333 examples in each class.
Next, the first 10 examples in the dataset are summarized showing the input values are numeric and the target values are integers that represent the class membership.
|
1 2 3 4 5 6 7 8 9 10 11 12 13 14 |
(1000, 2) (1000,) Counter({0: 334, 1: 333, 2: 333}) [-3.05837272 4.48825769] 0 [-8.60973869 -3.72714879] 1 [1.37129721 5.23107449] 0 [-9.33917563 -2.9544469 ] 1 [-8.63895561 -8.05263469] 2 [-8.48974309 -9.05667083] 2 [-7.51235546 -7.96464519] 2 [-7.51320529 -7.46053919] 2 [-0.61947075 3.48804983] 0 [-10.91115591 -4.5772537 ] 1 |
Finally, a scatter plot is created for the input variables in the dataset and the points are colored based on their class value.
We can see three distinct clusters that we might expect would be easy to discriminate.

Scatter Plot of Multi-Class Classification Dataset
Multi-Label Classification
Multi-label classification refers to those classification tasks that have two or more class labels, where one or more class labels may be predicted for each example.
Consider the example of photo classification, where a given photo may have multiple objects in the scene and a model may predict the presence of multiple known objects in the photo, such as “bicycle,” “apple,” “person,” etc.
This is unlike binary classification and multi-class classification, where a single class label is predicted for each example.
It is common to model multi-label classification tasks with a model that predicts multiple outputs, with each output taking predicted as a Bernoulli probability distribution. This is essentially a model that makes multiple binary classification predictions for each example.
Classification algorithms used for binary or multi-class classification cannot be used directly for multi-label classification. Specialized versions of standard classification algorithms can be used, so-called multi-label versions of the algorithms, including:
- Multi-label Decision Trees
- Multi-label Random Forests
- Multi-label Gradient Boosting
Another approach is to use a separate classification algorithm to predict the labels for each class.
Next, let’s take a closer look at a dataset to develop an intuition for multi-label classification problems.
We can use the make_multilabel_classification() function to generate a synthetic multi-label classification dataset.
The example below generates a dataset with 1,000 examples, each with two input features. There are three classes, each of which may take on one of two labels (0 or 1).
|
1 2 3 4 5 6 7 8 9 |
# example of a multi-label classification task from sklearn.datasets import make_multilabel_classification # define dataset X, y = make_multilabel_classification(n_samples=1000, n_features=2, n_classes=3, n_labels=2, random_state=1) # summarize dataset shape print(X.shape, y.shape) # summarize first few examples for i in range(10): print(X[i], y[i]) |
Running the example first summarizes the created dataset showing the 1,000 examples divided into input (X) and output (y) elements.
Next, the first 10 examples in the dataset are summarized showing the input values are numeric and the target values are integers that represent the class label membership.
|
1 2 3 4 5 6 7 8 9 10 11 12 |
(1000, 2) (1000, 3) [18. 35.] [1 1 1] [22. 33.] [1 1 1] [26. 36.] [1 1 1] [24. 28.] [1 1 0] [23. 27.] [1 1 0] [15. 31.] [0 1 0] [20. 37.] [0 1 0] [18. 31.] [1 1 1] [29. 27.] [1 0 0] [29. 28.] [1 1 0] |
Imbalanced Classification
Imbalanced classification refers to classification tasks where the number of examples in each class is unequally distributed.
Typically, imbalanced classification tasks are binary classification tasks where the majority of examples in the training dataset belong to the normal class and a minority of examples belong to the abnormal class.
Examples include:
- Fraud detection.
- Outlier detection.
- Medical diagnostic tests.
These problems are modeled as binary classification tasks, although may require specialized techniques.
Specialized techniques may be used to change the composition of samples in the training dataset by undersampling the majority class or oversampling the minority class.
Examples include:
Specialized modeling algorithms may be used that pay more attention to the minority class when fitting the model on the training dataset, such as cost-sensitive machine learning algorithms.
Examples include:
- Cost-sensitive Logistic Regression.
- Cost-sensitive Decision Trees.
- Cost-sensitive Support Vector Machines.
Finally, alternative performance metrics may be required as reporting the classification accuracy may be misleading.
Examples include:
- Precision.
- Recall.
- F-Measure.
Next, let’s take a closer look at a dataset to develop an intuition for imbalanced classification problems.
We can use the make_classification() function to generate a synthetic imbalanced binary classification dataset.
The example below generates a dataset with 1,000 examples that belong to one of two classes, each with two input features.
|
1 2 3 4 5 6 7 8 9 10 11 12 13 14 15 16 17 18 19 20 21 |
# example of an imbalanced binary classification task from numpy import where from collections import Counter from sklearn.datasets import make_classification from matplotlib import pyplot # define dataset X, y = make_classification(n_samples=1000, n_features=2, n_informative=2, n_redundant=0, n_classes=2, n_clusters_per_class=1, weights=[0.99,0.01], random_state=1) # summarize dataset shape print(X.shape, y.shape) # summarize observations by class label counter = Counter(y) print(counter) # summarize first few examples for i in range(10): print(X[i], y[i]) # plot the dataset and color the by class label for label, _ in counter.items(): row_ix = where(y == label)[0] pyplot.scatter(X[row_ix, 0], X[row_ix, 1], label=str(label)) pyplot.legend() pyplot.show() |
Running the example first summarizes the created dataset showing the 1,000 examples divided into input (X) and output (y) elements.
The distribution of the class labels is then summarized, showing the severe class imbalance with about 980 examples belonging to class 0 and about 20 examples belonging to class 1.
Next, the first 10 examples in the dataset are summarized showing the input values are numeric and the target values are integers that represent the class membership. In this case, we can see that most examples belong to class 0, as we expect.
|
1 2 3 4 5 6 7 8 9 10 11 12 13 14 |
(1000, 2) (1000,) Counter({0: 983, 1: 17}) [0.86924745 1.18613612] 0 [1.55110839 1.81032905] 0 [1.29361936 1.01094607] 0 [1.11988947 1.63251786] 0 [1.04235568 1.12152929] 0 [1.18114858 0.92397607] 0 [1.1365562 1.17652556] 0 [0.46291729 0.72924998] 0 [0.18315826 1.07141766] 0 [0.32411648 0.53515376] 0 |
Finally, a scatter plot is created for the input variables in the dataset and the points are colored based on their class value.
We can see one main cluster for examples that belong to class 0 and a few scattered examples that belong to class 1. The intuition is that datasets with this property of imbalanced class labels are more challenging to model.
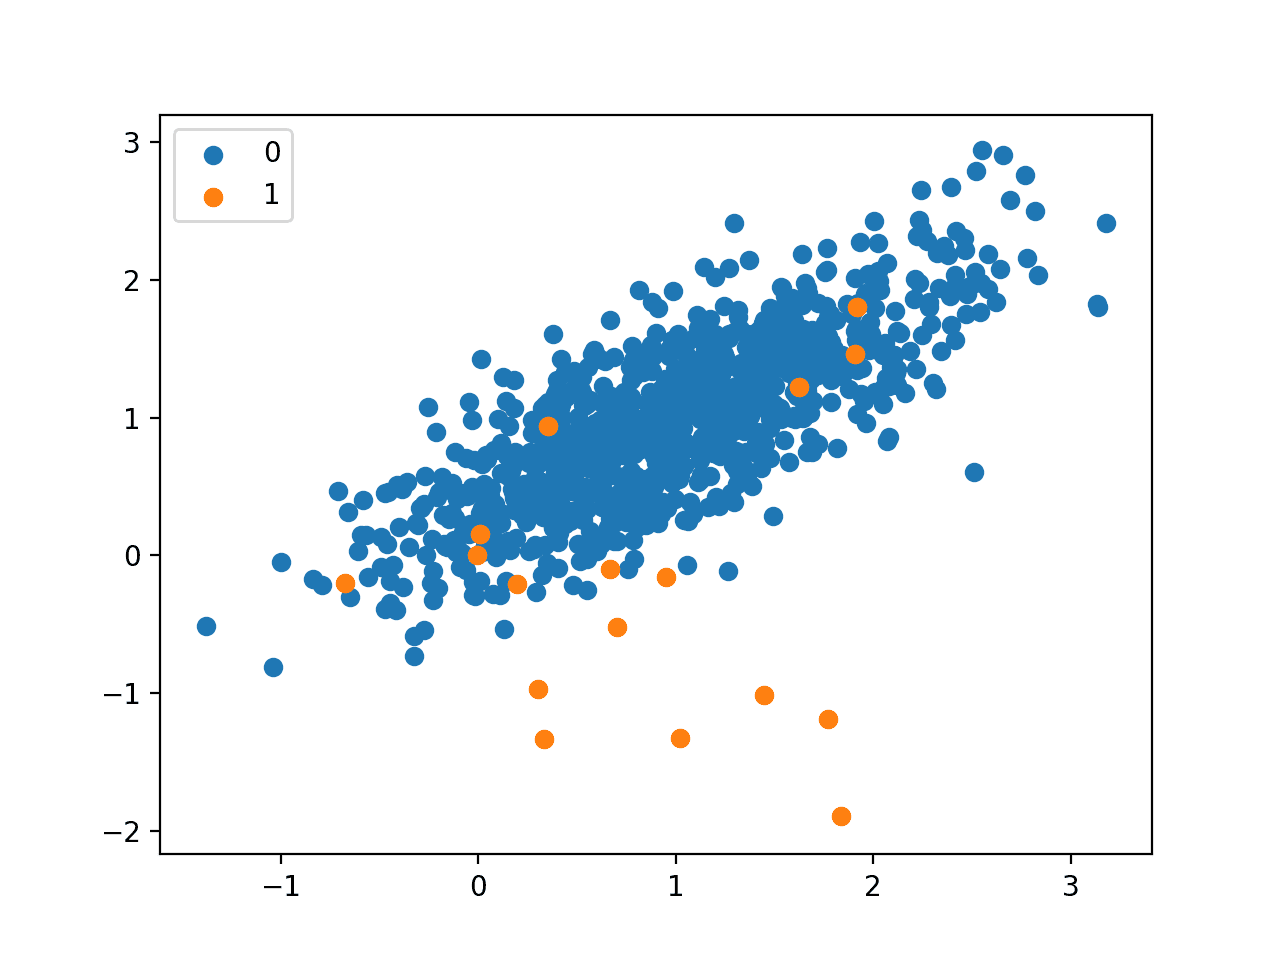
Scatter Plot of Imbalanced Binary Classification Dataset
Further Reading
This section provides more resources on the topic if you are looking to go deeper.
- Statistical classification, Wikipedia.
- Binary classification, Wikipedia.
- Multiclass classification, Wikipedia.
- Multi-label classification, Wikipedia.
- Multiclass and multilabel algorithms, scikit-learn API.
Summary
In this tutorial, you discovered different types of classification predictive modeling in machine learning.
Specifically, you learned:
- Classification predictive modeling involves assigning a class label to input examples.
- Binary classification refers to predicting one of two classes and multi-class classification involves predicting one of more than two classes.
- Multi-label classification involves predicting one or more classes for each example and imbalanced classification refers to classification tasks where the distribution of examples across the classes is not equal.
Do you have any questions?
Ask your questions in the comments below and I will do my best to answer.
Discover Fast Machine Learning in Python!
Develop Your Own Models in Minutes
...with just a few lines of scikit-learn code
Learn how in my new Ebook:
Machine Learning Mastery With Python
Covers self-study tutorials and end-to-end projects like:
Loading data, visualization, modeling, tuning, and much more...
Finally Bring Machine Learning To
Your Own Projects
Skip the Academics. Just Results.


Your contents are awesome sir!!!
Thanks!
Sir,
Thank you for explaining it so clearly which is easy to understand.
Regards
Dear Jason May God Bless you is there any way for extracting formula or equation from multivariate many variables regression using machine learning
We can use a model to infer a formula, not extract one.
ML is not required, just use a regression model.
Hi Jason,
To follow up your answer to this question, I have a stupid question: what is the difference between ML that is applied on regression problems and regression models? This question confused me sometimes, your answers will be highly appreciated!
None.
A dataset that requires a numerical prediction is a regression problem.
An algorithm that is fit on a regression dataset is a regression algorithm.
A model fit using a regression algorithm is a regression model.
Does that help?
Thank you Jason, it is helpful! Then I have another question: how about linear mixed models? I know that it can be used for regression problems, can it also be used in ML? If so, I did not see its application in ML a lot, maybe I am masked.
Sorry, I don’t have tutorials on the topic.
Sorry Jason I Forget to tell you I mean Non linear regression using python Thankyou very much
Sure.
Thank you!
very useful article to me.
I’m happy to hear that!
Hi, thanks for your great content. Recently I tried transfer learning methods to learn clothing style from a dataset with about 5 thousand images and 20 class. My classes have a really imbalanced data, for example for a class I have a thousand images and for the 19 other it’s about 4 thousand images. I tried weighting the classes but when it comes to predicting, The midel prediction is always between 2 classes and never got the other classes in result. Is there any other method better than weighting my classes ? Or any opinion do you have why it is working like that ?
Instead of weighting, you may also try resampling the data. But if your result is between 2 classes, why is that a problem if that is correct? If you want to see the prediction score for all 20 classes, I am guessing if you need to do something on the post-processing part to convert the model output into the style you wanted.
Thanks you for this wonderful work sir
Thanks. Glad you like it.
Hi Jason
Thank you for the tutorial.
Per your tutorial, for multi-class classification,
Binary classification algorithms that can use One-vs-Rest, and One-vs-One for multi-class classification include:
Logistic Regression.
Support Vector Machine.
1). Do you have a Logistic Regression code example applying these two strategies?
2). In your tutorial “Your First Machine Learning Project in Python Step-By-Step”, you used Logistic Regression and SVC to predict Iris data which is a multi-class classification. Why didn’t you apply one of the strategies, One-vs-Rest, and One-vs-One?
3). Do you have a tutorial or code example for Multi-Label Classification?
https://machinelearningmastery.com/machine-learning-in-python-step-by-step/
Thanks,
Sophia
Very useful ml article thank you sir
Thanks.
Very nicely structured ! Thanks for this.
Thanks!
Hi Jason,
I have a classification problem, i.e. refining the results of the algorithm. Essentially, my KNN classification algorithm delivers a fine result of a list of articles in a csv file that I want to work with. Those classified with a ‘yes’ are relevant, those with ‘no’ are not.
I use a euclidean distance and get a list of items. The final result delivers a list of 10 (or whatever k-value I apply). Basically, I view the distance as a rank.
QUESTION:
How can best project a list of relevant items to proceed with? – i.e. how do I potentially loop the first list results of perhaps 8 yes and 2 no (when k=10)?
I guess I won’t have to pre-process text again as well as I do not have to run a TD-IDF. I did try simply to run a k=998 (correponding to the total list of entries in the data load) remove all, and then remove all the articles carrying a ‘no’. That would keep the distance unaffected, but is that the right way to go? I’d imagine that I had to train data once again, and I am not sure how to orchestrate that loop. Any help is appreciated.
Thx, Jens
A typo sneaked in…
I did try simply to run a k=998 (correponding to the total list of entries in the data load) remove all, and then remove all the articles carrying a ‘no’. Should say:
I did try simply to run a k=998 (correponding to the total list of entries in the data load), and then remove all the articles carrying a ‘no’.
Sorry, I don’t follow. Perhaps try posting on stackoverflow or perhaps you can boil your question down?
And One class, Jason? where can we put the concept?
Outlier detection (i.e. fundamentally different), otherwise binary classification.
Hi Jason,
Thank you for this great article! It helped me a lot.
What kind of classification is Question Answering or specifically Span Extraction? The case where the model has to select the start and end indices within a paragraph. Is it a multi class classification? You wrote “Problems that involve predicting a sequence of words, such as text translation models, may also be considered a special type of multi-class classification. Each word in the sequence of words to be predicted involves a multi-class classification where the size of the vocabulary defines the number of possible classes that may be predicted and could be tens or hundreds of thousands of words in size.” Is it the same for span extraction problems?
Thank you in advance!
Question answering is sequence generation – not classification. I don’t know what span extraction is.
https://machinelearningmastery.com/sequence-prediction-problems-learning-lstm-recurrent-neural-networks/
Thank you for the quick response!
The definition of span extraction is “Given the context C, which consists of n tokens, that is C = {t1, t2, … , tn}, and the question Q, the span extraction task requires extracting the continuous subsequence A = {ti, ti+1, … , ti+k}(1 <= i <= i + k <= n) from context C as the correct answer to question Q by learning the function F such that A = F(C,Q)."
It´s the SQuAD task. BiDAF, QANet and other models calculate a probability for each word in the given Context for being the start and end of the answer. They use the cross entropy loss which is used for classification. Thats why I´m confused. I dont get what the classes in this case would be? start and end?
I dont see span extraction as a sequence generation problem? No words are predicted/generated but only the start and end calculated. Am I wrong?
Thanks.
Thank you for the nice article! It helped me a lot!
You’re welcome.
HI Jason,
Very nice post! You mentioned that some algorithms which are originally designed to be applied on binary classification but can also be applied on multi-class classification, e.g. logistic regression and SVM. I have two questions about this:
(1) Could you elaborate a bit what does it mean with their extension? It is the modification for the algorithm itself or you mean the source code for the corresponding packages? As users, do we need to do extra things if we want to use logistic regression and SVM for multi-class classification?
(2) Actually I tried both of logistic regression and SVM on multi-class classification, but it seems only SVM works (I was trying them in R), but it showed the error stating that logistic regression can only be used for binary classification. Is it true or maybe I did something wrong?
Thank you very much in advance!
Thanks.
Often we can use a OVR to adapt binary to multi-class classification, here are examples:
https://machinelearningmastery.com/one-vs-rest-and-one-vs-one-for-multi-class-classification/
Thank you Jason!
You’re welcome.
Hi Jason!! I am starting with Machine Learning and your tutorials are the best! Thank you very much for sharing your knowledge.
I would like if you could solve this question for me:
I have a dataset with chemical properties of water. Using some of these properties I have created a new column with the classification label: “clean water” and “not clean water”. For example, I have used limits of presence in the water of “Calcium”, “pH” and “electrical conductivity” to classify if the water is clean or not.
My question is if I can use the Classification Supervised Learning to predict this output variable that I have created (clean water or not) using as input variables the same properties that I have used to calculate it (“Calcium”, “pH” and “conductivity”). electrical “). Or if I could predict the tag using other properties that I haven’t used to create it.
I don’t know if it is possible to use supervised classification learning on a label that is dependent on the input variables?
I think Regression Supervised Learning cannot be used to predict a variable that is dependent on the others (if it was created from an equation using the other variables), is that correct?
It sounds like classification:
https://machinelearningmastery.com/faq/single-faq/what-is-the-difference-between-classification-and-regression
Perhaps develop a prototype model and test whether it is possible to model the problem as classification.
Jason,
I teach the basics of data analytics to accounting majors. Your examples are invaluable! Great work.
Thanks Richard!
Good stuff, thank you
You’re welcome!
Dear Dr Jason,
Thank you for your time.
Under the heading “Binary Classification”, there are 20 lines of code.
Of particular interest is line 19:
Yes I have seen the documentation at
https://matplotlib.org/3.2.1/api/_as_gen/matplotlib.pyplot.scatter.html
Its first line says scatterplot(x, y)
Question please:
why do you plot one feature of X against another feature of X? That is X[row_ix,0] versus X[row_ix,1] instead of X versus Y?
I know it is something obvious, but the “penny has not dropped” yet.
Or put it another way, why plot one feature against another feature?
Thank you,
Anthony of Sydney
A scatter plot plots one variable against another, by definition.
In that example we are plotting column 0 vs column 1 for each class.
Dear Dr Jason,
Thank you for the reply especially that a scatter plot is a plot of one variable against another variable, rather than an X variable against a Y variable.
My question is: given that a plot of one variable against another variable, I would like the precise definition of what a plot of X1 (say) against X2 means versus a plot of X1 versus Y.
Put another way, what information do get when plotting an X variable against another X variable? Correlation? How far apart X1 and X2 is?
Thank you,
Anthony of Sydney
A scatter plot shows the relationship between two variables, e.g. how they relate as the values change.
E.g. it can help see correlations if they both change in the same direction, e.g. positive.
Dear Dr Jason,
An additional question please:
In your examples you did plots of one feature of X versus another feature of X.
What do you do if you have more than two features and you wish to plot the one feature against the other. Example, there are four features in iris data. Do you have to plot 4C2 = 6 scatter plots? If you had 10 features that is 10C2 = 45 plots?
Thank you,
Anthony of Sydney,
You can create multiple pair-wise scatter plots, there’s an example here:
https://machinelearningmastery.com/predictive-model-for-the-phoneme-imbalanced-classification-dataset/
Dear Dr Jason,
First thank you. And thank you for averting me to the scatter_matrix at https://machinelearningmastery.com/predictive-model-for-the-phoneme-imbalanced-classification-dataset/,
I had a look at the scatter_matrix procedure used to display multi-plots of pairwise scatter plots of one X variable against another X variable.
There is so much information contained in multiple pairwise plots.
Question – what is your advice on interpreting multiple pairwise relationships please?
Thank you.
Anthony of Sydney
I have much on this, perhaps see this as a first step:
https://machinelearningmastery.com/machine-learning-in-python-step-by-step/
And this:
https://machinelearningmastery.com/how-to-use-correlation-to-understand-the-relationship-between-variables/
Dear Dr Jason,
Thank you, you’re tops.
I had a further examination of scatter_matrix from pandas.plotting import scatter_matrix
I experimented with plotting all pairwise scatter plots of X
Having experimented with pairwise comparisons of all features of X, the scatter_matrix has a deficiency in that unlike pyplot’s scatter, you cannot plot by class label as in the above blog.
Here is the code for the scatter matrix of iris data.
Conclusions:
* scatter_matrix allows all pairwise scatter plots of variables.
* scatter matrix requires as input a dataframe structure rather than a matrix.
* BUT scatter_matrix does not allow you to plot variables according to the classification labels defined in y – these are setosa, virginicum and versicolor.
Todo – using pyplot’s subplots in order to display all pairwise X features displayed according to y’s categories.
Thank you,
Anthony of Sydney
Yes, believe the seaborn version allows pairwise scatter plots by class label. I have a post on this written and scheduled.
Dear Dr Jason,
Thank you for advising of a forthcoming post on pairwise scatter plots by class label. Look forward to that.
To reiterate, I would like to have scatterplots with legends based on class label as exemplified in this page. I would like to extend this to all pairwise comparisons of X by class label.
There is a scatterplot matrix by class label at https://machinelearningmastery.com/predictive-model-for-the-phoneme-imbalanced-classification-dataset/ BUT the different colours indicating class labels don’t show the class labels legend in each plot.
Also the problem I have with scatter matrix, is if you have 4 variables of X, say variables 1,2,3,4, the possible pairings are (1,2), (2,1), (1,3), (3,1), (1,4),(4,1), (2,3), (3,2), (2,4), (4,2) and (3,4) and (4,3) = 12 plots.
But you don’t need duplicate plots. you can get the minimum plots with are (1,2), (1,3), (1,4), (2,3), (2,4), (3,4). = 4C2 = 6.
The seaborn method at the bottom of https://seaborn.pydata.org/generated/seaborn.scatterplot.html confuses me with one variable label on the top, one variable label on the bottom and one variable label on the left then a legend on the right.
Thank you,
Anthony of Sydney.
Dear Dr Jason,
I have found something close to what I want which is at
https://seaborn.pydata.org/examples/scatterplot_matrix.html. It does pairwise scatter plots of X with a legend on the extreme right of the plot.
Conclusions:
* all pairwise plots of X can be achieved showing the legend by class, y. Much easier to use than scatter_matrix, and possibly easier than making your own algorithm to plot all pairwise plots of X.
* the pairplot function requires a DataFrame object. The DataFrame’s file is a csv file, either downloaded from a server by seaborn’s inbuilt load(‘file’) where ‘file’ OR panda’s read_csv.
* if your data is in another form such as a matrix, you can convert the matrix to a DataFrame file.
* As a matter of my own taste, the seaborn’s graphics look aesthetically more pleasing than pyplot’s graphics, Though you need pyplot’s show() function to display the graphic.
* Again as a matter of personal tastes, I’d rather have 4C2 plots consisting of (1,2), (1,3), (1,4), (2,3), (2,4) and (3,4) than seaborn’s or panda’s scatter_matrix which plot 2*4C2 plots such as (1,2), (2,1), (1,3),(3,1), (1,4), (4,1), (2,3), (3,2), (3,4) and (4,3).
Thank you,
Anthony of Sydney
Nice work.
Great article! Just found a typo under the heading ‘imbalanced classification’: it should be oversampling the minority class.
Thanks! Fixed.
Thanks a lot
Good theoretical explanation sir
Thanks!
Sir , What if I have a dataset which needs two classification
I mean , if I a have dataset like
Independent variables –A,
dependent var –1 and another is dependent var –2 which is dependent on dependent var –1
how can I solve this problem?
sorry for my bad English…
Sounds like a multi-target prediction problem.
Perhaps start by modeling two separate prediction problems, one for each target.
I want to classify the results of binary classification once again. What method should I use?
What do you mean classify the results of a binary classification?
If you mean feed the output of the model as input to another model, like a stacking ensemble, then this may help:
https://machinelearningmastery.com/stacking-ensemble-machine-learning-with-python/
Thank you for the article.
You’re welcome.
Hi Jason,
How can I find your book?
Thanks,
You can see the full catalog of 19 books and book bundles here:
https://machinelearningmastery.com/products/
This is indeed a very useful article. Thanks for sharing. Can you kindly make one such article defining if and how we can apply different data oversampling and undersampling techniques, including SMOTE on text data (for example sentiment analysis dataset, binary classification)
Thanks!
I don’t think those classical methods are appropriate for text, perhaps you can check the literature for text data augmentation methods?
Thanks!
Can you attach an example to the visualization of the multi-label problem?
Something like a scatter plot with pie markers…
No, it does not visualize well.
There is an example here that may help;
https://machinelearningmastery.com/multi-label-classification-with-deep-learning/
Dear Dr Jason,
My reference is the last figure, which is a scatterplot of the data.
Orange dots = y outcome = 1, blue dots = y outcome ==0
I wanted to predict what happens when X = all features where y == 1.
I expected mainly yhat to be mainly something like this:
QUESTION PLEASE: I expected that yhat to be mainly 1s like the orange dots == y == 1 amongst the blue dots == y = 1. Only got 30% of values to predict 1s.
Any way to improve the predictability of the model?
Thank you,
Anthony of Sydney
Perhaps you can model it as an imbalanced classification project:
https://machinelearningmastery.com/start-here/#imbalanced
Dear Dr Jason,
Thank you again for this.
Thank you for the summary reference at https://machinelearningmastery.com/start-here/#imbalanced.
As a result, I went to cost sensitive logistic regression at https://machinelearningmastery.com/cost-sensitive-logistic-regression/.
Here is the combined code in order to predict yhat.
Results: Depending on how I set up the make_classification synthetic data, I managed to get accuracy of yhat/actual(y) of between 76% and 100%.
Results II: Even where there is considerable overlap between X where y == 0 and where y==1, I managed to get 100% prediction between yhat/actual(y).
Here is the program:
Here is the printed output:
Other results,
n_clusters_per_class = 1, flip_y = 0.05, AUC = 0.699, predicted/actual*100=100%
n_clusters_per_class = 1, flip_y = 0, AUC = 0.993, predicted/actual*100=100%
Conclusions:
* This is not the be all and end all of logistic regression and taking account of imbalanced.
* Just because an AUC=0.7 but prediction rate = 100% may well mean false positive results in yhat.
* When using the model,
X, y = make_classification(n_samples=10000, n_features=2, n_informative=2, n_redundant=0, n_classes=2, n_clusters_per_class=1, weights=[0.99,0.01], random_state=1)
The result was AUC = 0.819 and yhat/actual(y)*100=74%
Conclusion of conclusion: It is possible to predict whether y = 0 or y = 1 with considerable overlap between X where y == 0 and y == 1.with cost sensitive logistic regression. However it depends on the nature of the data in each group.
Thank you,
Anthony of Sydney
Nice work!
Generally accuracy is a bad metric for imbalanced datasets:
https://machinelearningmastery.com/tour-of-evaluation-metrics-for-imbalanced-classification/
Note that AUC is not a rate or percentage.
Dear Dr Jason,
Further to the Logistic Regression, I did a DecisionTreeClassifier and a GridSearchCV inspired by https://machinelearningmastery.com/cost-sensitive-decision-trees-for-imbalanced-classification/.
They were with the original set of data
The code:
The results are:
A decision tree classifier with class weights {‘class_weight’: {0: 1, 1: 1}} produced the highest AUC of 88% compared to a simple decision tree classifier of 80%.
Comparing this with cost sensitive LogisticRegression 99.3%.
Again the results were for a particular synthetic data set described above.
Conclusion: Just because the AUC result for cost-sensitive logistic regression was the highest, It does not mean that cost-sensitve Logistic Regression is the ultimate bees knees model.
It depends on the data.
Thank you,
Anthony of Sydney
Nice work!
Dear Dr Jason,
My best result used the SMOTE LogisticRegression.
Here is the code:
Results:
Using SMOTE DecisionTreeClassifier
Using SMOTE LogisticRegression
Of all the models tested, SMOTE with LogisticRegression produced mean AUC of 0.996.
Predicting, where X_things is X where y==1, we predict this back into the pipeline model to get the following predictions:
Conclusion, SMOTE LogisticRegression performed the best with AUC = 0.996 producing 100% predictions.
Conclusion: This is not the be-all-and-end-all of models. Model accuracy depends on the data.
Conclusion: We can predict whether the outcome y = 0 or y = 1 when there is significant overlap in the data.
Thank you,
Anthony of Sydney
Nice work!
Hi Dear Dr Jason,
Thank you for the article.
I have a dataset and I found out with this article that my dataset consists of several categories (Multi-Class Classification).
The dataset is noiseless and has label independence.
Now, I have a question
How can I find out what kind of algorithm is best for classifying this data set?
Good question, this will help:
https://machinelearningmastery.com/faq/single-faq/what-algorithm-config-should-i-use
> # Load libraries
import pandas as pd import numpy as np from pandas import read_csv from pandas.plotting import scatter_matrix from
> matplotlib import pyplot from sklearn.model_selection import
> train_test_split from sklearn.model_selection import cross_val_score
>
> dataset1 = pd.read_csv(“mirai_dataset.csv”)
> dataset2 = pd.read_csv(“mirai_labels.csv”)
>
> dataset = pd.concat([dataset1, dataset2], axis=1)
>
>
> import os import numpy as np from sklearn import metrics from
> scipy.stats import zscore
>
> def expand_categories(values):
> result = []
> s = values.value_counts()
> t = float(len(values))
> for v in s.index:
> result.append(“{}:{}%”.format(v,round(100*(s[v]/t),2)))
> return “[{}]”.format(“,”.join(result))
> def analyze(dataset):
> print()
> cols = dataset2.values
> total = float(len(dataset))
>
> print(“{} rows”.format(int(total)))
> for col in cols:
> uniques = dataset[col].unique()
> unique_count = len(uniques)
> if unique_count>100:
> print(“** {}:{} ({}%)”.format(col,unique_count,int(((unique_count)/total)*100)))
> else:
> print(“** {}:{}”.format(col,expand_categories(dataset[col])))
> expand_categories(dataset[col])
>
>
> **# Analyze KDD-99 analyze(dataset)**
>
>
> KeyError: “None of [Int64Index([0], dtype=’int64′)] are in the
> [columns]
Hi all,
I am trying to load the dataset including their label CSV file and I am trying to analyze the data and train with the classification model. can someone provide me some suggestions to visualize the dataset and train the dataset using the classification model. Also, the dataset is for mirai attack and will be used for intrusion detection system so the data starts with benign and then some point with the attack.
This is a common question that I answer here:
https://machinelearningmastery.com/faq/single-faq/can-you-read-review-or-debug-my-code
https://archive.ics.uci.edu/ml/machine-learning-databases/00516/mirai/
Here is the link to the dataset I am using…thanks in advance
Sorry, I am not familiar with that dataset, I cannot give you good off-the-cuff advice.
Can you work on this use case… ans let me know how would you implement it..?
I need to predict which customers are going to not pay the amount considering their previous payment pattern.
In this use case take a sample of 100 customers , (let me know what data you need )
Perhaps this process will help:
https://machinelearningmastery.com/start-here/#process
hi
please we can deduce graphs from the classification data ?
What do you mean by “graphs from data”?
Thanks for the tutorial. I have morphology data consists of 20 measured variables (like length, weight, …the whole organism body). For example, species 1, species 2, species 3, species 4 were found in the same genera and I took 20 measured variables. my question is how to classify based on their similarities?
Do you have label for the species? If so, just try to fit a classification model and see how it looks like. It may or may not work well and you will need to try a different model (e.g., different kernel of SVM). There is an example of iris classification in this post, that might help you start: https://machinelearningmastery.com/get-your-hands-dirty-with-scikit-learn-now/
I was about to leave this field ,then your website came and everything changed…..Thank you..!
I am happy you found it useful. Thank you.
Extremely nice article, thank you. I had a question – I am working on developing a model which ha s continuous output (continuous risk of target event) varying with time. The target label however is 0/ 1 as to whether the event happended or did not happen over a certain time (say 1 year). When it comes to validating, we see In many cases, at 1 year, the riskprediction from the model is high and yet there is no event recorded. So looks like the prediction is wrong. However, if we look at data past 1 year, we see pretty soon after 1 year the event happens. So the AUROC calculated at 1 year is mis-representative because the event got right censored. Is there a way to create a regression model out of data where the target label is more suited for classification?
Do you think you can re-label your data to make a count of event happened in next 6 month, and use this count as output instead of whether it happened on the same day?
hi
for multi-class classification, what ratio is considered as imbalanced? is 3:1:1 considered imbalanced? and also is there any article for imbalanced dataset for multi-class? so far i only found for binary classification
thanks
Strictly speaking, anything not 1:1 is imbalanced. But different algorithms may have different impact due to the imbalanced dataset. My thought process would be to consider your metric (e.g., accuracy? F1? MSE?) and how severe the imbalance may skew the metric.
Hello Adrian,
Thank you for the awesome content and I have a question on multi-label classification, Hope you can answer it.
What will happen if the new data comes and it does not belong it any class (classes defined during training)? How does the model going to react? Will it classify the data with its existing class?
I want, if the new data does not belong to any class then the model should not classify it. How can I implement this while making the model=
A trained model is what it can do as you designed it. You have to think about how to deal with the new class. Options are to retrain the model (which you need a full dataset), or modify a model by making an ensemble.
very well explained content.
Thanks!
In classification, the eventual goal is to predict the class labels of previously unseen data records that have unknown class labels. On the other hand, a great deal of classification task involves processing a training set, that has the answers already. Why is it important to utilize a training set with already given answers during this process?
Hi Rob…This type of learning is called “supervised learning”. The following will hopefully clarify:
https://machinelearningmastery.com/supervised-and-unsupervised-machine-learning-algorithms/
May not bother you, but you could ask them to at least give you credits if they’re going to take your article
hi sir, can we use multinomial Naive Bayes for multiclass classification? if yes why we should? and how?
Hi Sheetal…You may find the following resource of interest:
https://www.mygreatlearning.com/blog/multiclass-classification-explained/
I have a question would like to categorize mobile money customers not only based on transactional value what will be the best way to do it, some of the features include employment status, source of income(binary), geographical area.
Thank you
Hi Russel…You may wish to consider clustering algorithms:
https://machinelearningmastery.com/clustering-algorithms-with-python/
How can I make this presentation on this topic?
Machine learning (classifications)
Hi Mafeng…Please rephrase and/or clarify your question so that we may better assist you.
Really love your content James. I have a quick question: If I were to perform a Multi-Class Classification and if the dataset I am about to use contains more than 2 features, how can I modify the Multi-Class Classification you posted? I have tried 3 features of make_blobs() and the result of the plot seems to be less accurate than 2 feature make_blob() dataset
Thank you for the feedback Hyungtaek! The following resource may add clarity:
https://machinelearningmastery.com/multi-label-classification-with-deep-learning/
Hello, thanks for the post.
Can i use neural network for multi classification e.g. Normal hypertension, pre-hypertension and hypertension.
Hi Denis…It is very possible. Please describe your source data and the goals of your model so that we can better assist you.
I have a data set where the columns are list1,list2,list3 and final
list 1, list2,list3 contains a list of items with confidence score in there as a tupe and final list will have the final item name based on the list1,list2,list3.
the final values is one of the value from list1, list2, list3
No what ML model and how to use that model to train on this dataset and to predict the final value for the new records
that will have list1,list2,list3 values.
example :
list 1 list2 list3 final
1 [{“bike”:0.89},{“cycle:0.76}] [{“scooty”:0.90}] [{“2 Weeler”:0.80}] [Bike]
Hi Ashish…To address your problem, we need to train a model that predicts the final item based on the lists provided (
list1,list2,list3). Given the structure of your data, we can approach this as a classification problem where the features are the lists of items with confidence scores, and the target is thefinalvalue.Here’s a step-by-step approach:
### Step 1: Preprocess the Data
We need to convert the lists of items with confidence scores into a format suitable for machine learning models. One approach is to create a feature vector for each item in the lists, representing the confidence scores.
### Step 2: Feature Extraction
Extract features from
list1,list2, andlist3by creating a fixed-size vector for each list. This vector can be constructed by summing or averaging the confidence scores for each unique item across all lists.### Step 3: Model Training
Choose a classification model (e.g., Logistic Regression, Random Forest, XGBoost) to train on the extracted features and the
finalcolumn.### Step 4: Prediction
Use the trained model to predict the final value for new records.
Here’s an example using Python and the
scikit-learnlibrary:pythonimport pandas as pd
from sklearn.model_selection import train_test_split
from sklearn.ensemble import RandomForestClassifier
from sklearn.preprocessing import MultiLabelBinarizer
from sklearn.pipeline import make_pipeline
from sklearn.compose import ColumnTransformer
from sklearn.feature_extraction import DictVectorizer
# Sample Data
data = {
'list1': [[{'bike': 0.89}, {'cycle': 0.76}]],
'list2': [[{'scooty': 0.90}]],
'list3': [[{'2 Wheeler': 0.80}]],
'final': ['bike']
}
df = pd.DataFrame(data)
# Feature Extraction Function
def extract_features(df):
mlb = MultiLabelBinarizer()
def flatten_list(lst):
return {k: v for d in lst for k, v in d.items()}
list1_features = pd.DataFrame(df['list1'].apply(flatten_list).tolist()).fillna(0)
list2_features = pd.DataFrame(df['list2'].apply(flatten_list).tolist()).fillna(0)
list3_features = pd.DataFrame(df['list3'].apply(flatten_list).tolist()).fillna(0)
features = pd.concat([list1_features, list2_features, list3_features], axis=1).fillna(0)
return features
# Extract Features
X = extract_features(df)
y = df['final']
# Split the Data
X_train, X_test, y_train, y_test = train_test_split(X, y, test_size=0.2, random_state=42)
# Train a Model
model = RandomForestClassifier()
model.fit(X_train, y_train)
# Predict
y_pred = model.predict(X_test)
# Evaluate
from sklearn.metrics import accuracy_score
print('Accuracy:', accuracy_score(y_test, y_pred))
# Function to Predict New Records
def predict_final(list1, list2, list3, model):
new_df = pd.DataFrame({'list1': [list1], 'list2': [list2], 'list3': [list3]})
new_X = extract_features(new_df)
return model.predict(new_X)
# Example Prediction
list1 = [{'bike': 0.89}, {'cycle': 0.76}]
list2 = [{'scooty': 0.90}]
list3 = [{'2 Wheeler': 0.80}]
prediction = predict_final(list1, list2, list3, model)
print('Predicted Final Value:', prediction)
### Explanation:
1. **Data Preparation:**
– We define a function
extract_featuresto convert the lists of dictionaries into a flat dataframe where each column represents an item and the value represents the confidence score.2. **Feature Extraction:**
– The
extract_featuresfunction processes thelist1,list2, andlist3columns and concatenates the resulting dataframes.3. **Model Training:**
– We use a
RandomForestClassifierto train on the extracted features.4. **Prediction:**
– The function
predict_finalallows you to predict the final value for new records by processing the input lists and using the trained model.This approach can be adapted and expanded based on the specifics of your dataset and requirements. The key is to ensure that the feature extraction process captures the relevant information from the input lists effectively.