Clustering or cluster analysis is an unsupervised learning problem.
It is often used as a data analysis technique for discovering interesting patterns in data, such as groups of customers based on their behavior.
There are many clustering algorithms to choose from and no single best clustering algorithm for all cases. Instead, it is a good idea to explore a range of clustering algorithms and different configurations for each algorithm.
In this tutorial, you will discover how to fit and use top clustering algorithms in python.
After completing this tutorial, you will know:
Clustering is an unsupervised problem of finding natural groups in the feature space of input data.
There are many different clustering algorithms and no single best method for all datasets.
How to implement, fit, and use top clustering algorithms in Python with the scikit-learn machine learning library.
Kick-start your project with my new book Machine Learning Mastery With Python, including step-by-step tutorials and the Python source code files for all examples.
Let’s get started.
Clustering Algorithms With Python Photo by Lars Plougmann, some rights reserved.
Tutorial Overview
This tutorial is divided into three parts; they are:
Clustering
Clustering Algorithms
Examples of Clustering Algorithms
Library Installation
Clustering Dataset
Affinity Propagation
Agglomerative Clustering
BIRCH
DBSCAN
K-Means
Mini-Batch K-Means
Mean Shift
OPTICS
Spectral Clustering
Gaussian Mixture Model
Clustering
Cluster analysis, or clustering, is an unsupervised machine learning task.
It involves automatically discovering natural grouping in data. Unlike supervised learning (like predictive modeling), clustering algorithms only interpret the input data and find natural groups or clusters in feature space.
Clustering techniques apply when there is no class to be predicted but rather when the instances are to be divided into natural groups.
A cluster is often an area of density in the feature space where examples from the domain (observations or rows of data) are closer to the cluster than other clusters. The cluster may have a center (the centroid) that is a sample or a point feature space and may have a boundary or extent.
These clusters presumably reflect some mechanism at work in the domain from which instances are drawn, a mechanism that causes some instances to bear a stronger resemblance to each other than they do to the remaining instances.
Clustering can be helpful as a data analysis activity in order to learn more about the problem domain, so-called pattern discovery or knowledge discovery.
For example:
The phylogenetic tree could be considered the result of a manual clustering analysis.
Separating normal data from outliers or anomalies may be considered a clustering problem.
Separating clusters based on their natural behavior is a clustering problem, referred to as market segmentation.
Clustering can also be useful as a type of feature engineering, where existing and new examples can be mapped and labeled as belonging to one of the identified clusters in the data.
Evaluation of identified clusters is subjective and may require a domain expert, although many clustering-specific quantitative measures do exist. Typically, clustering algorithms are compared academically on synthetic datasets with pre-defined clusters, which an algorithm is expected to discover.
Clustering is an unsupervised learning technique, so it is hard to evaluate the quality of the output of any given method.
Many algorithms use similarity or distance measures between examples in the feature space in an effort to discover dense regions of observations. As such, it is often good practice to scale data prior to using clustering algorithms.
Central to all of the goals of cluster analysis is the notion of the degree of similarity (or dissimilarity) between the individual objects being clustered. A clustering method attempts to group the objects based on the definition of similarity supplied to it.
Some clustering algorithms require you to specify or guess at the number of clusters to discover in the data, whereas others require the specification of some minimum distance between observations in which examples may be considered “close” or “connected.”
As such, cluster analysis is an iterative process where subjective evaluation of the identified clusters is fed back into changes to algorithm configuration until a desired or appropriate result is achieved.
The scikit-learn library provides a suite of different clustering algorithms to choose from.
A list of 10 of the more popular algorithms is as follows:
Affinity Propagation
Agglomerative Clustering
BIRCH
DBSCAN
K-Means
Mini-Batch K-Means
Mean Shift
OPTICS
Spectral Clustering
Mixture of Gaussians
Each algorithm offers a different approach to the challenge of discovering natural groups in data.
There is no best clustering algorithm, and no easy way to find the best algorithm for your data without using controlled experiments.
In this tutorial, we will review how to use each of these 10 popular clustering algorithms from the scikit-learn library.
The examples will provide the basis for you to copy-paste the examples and test the methods on your own data.
We will not dive into the theory behind how the algorithms work or compare them directly. For a good starting point on this topic, see:
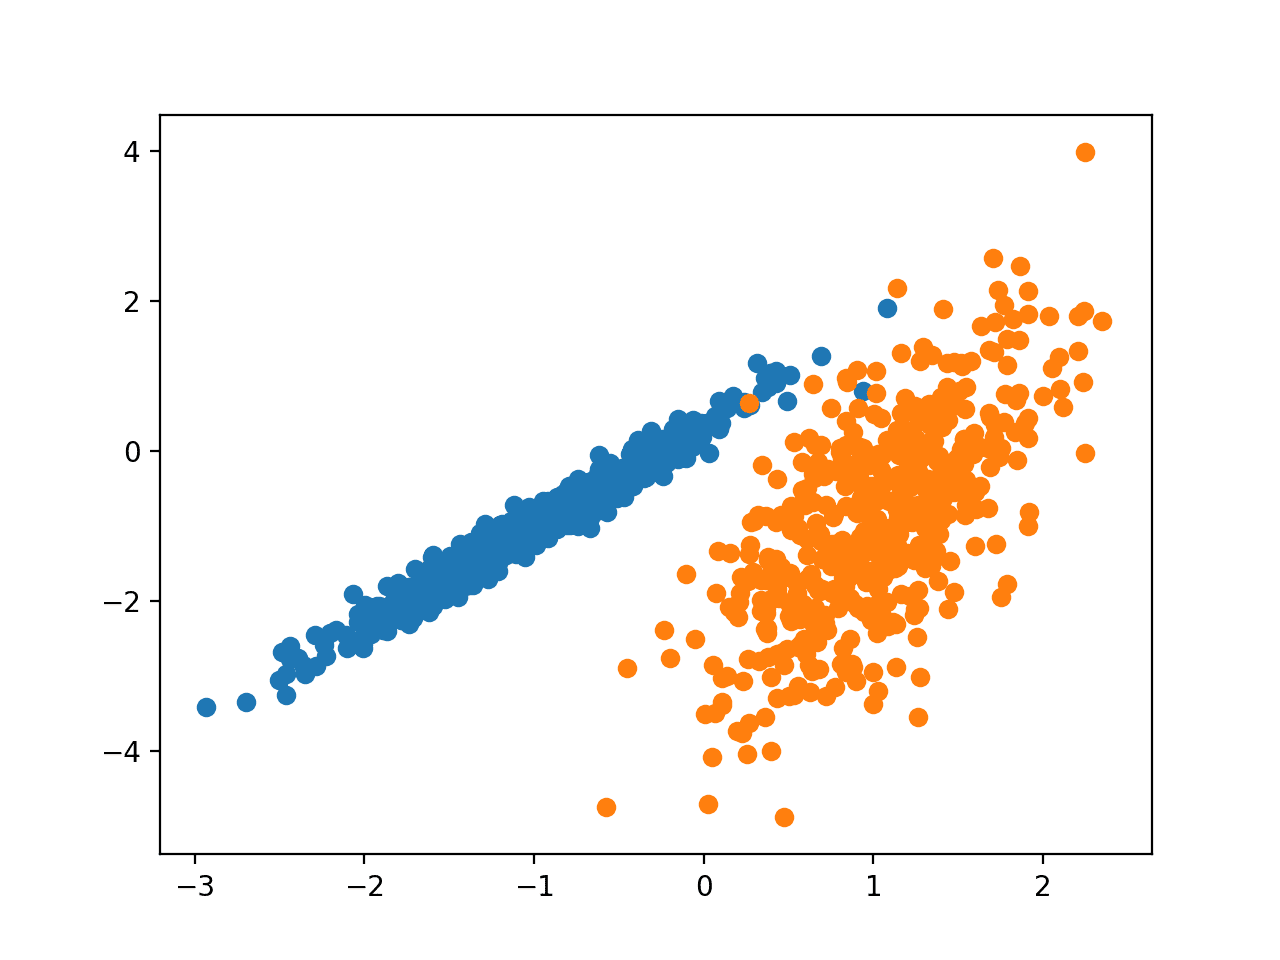
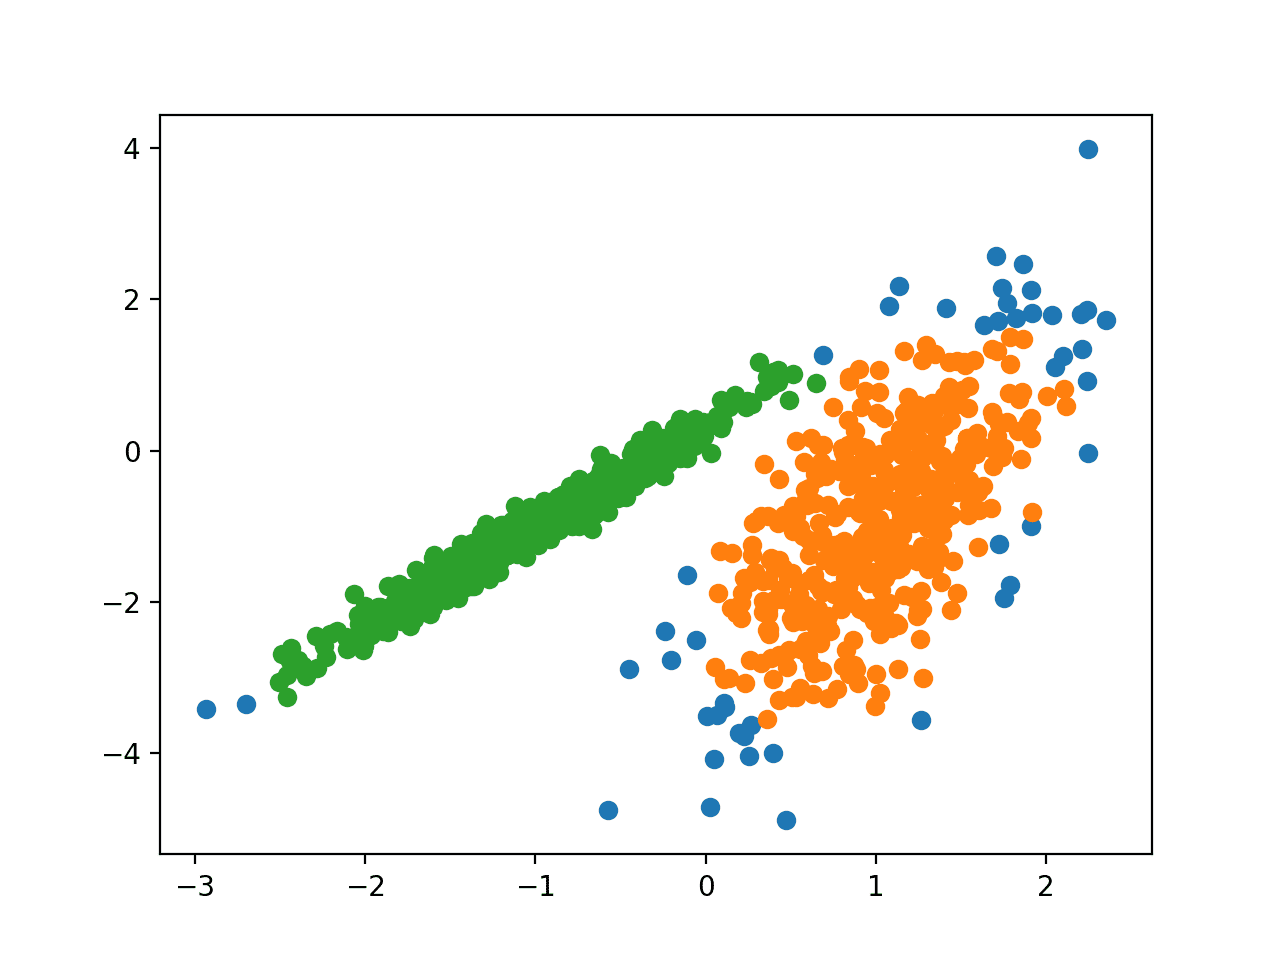
The dataset will have 1,000 examples, with two input features and one cluster per class. The clusters are visually obvious in two dimensions so that we can plot the data with a scatter plot and color the points in the plot by the assigned cluster. This will help to see, at least on the test problem, how “well” the clusters were identified.
The clusters in this test problem are based on a multivariate Gaussian, and not all clustering algorithms will be effective at identifying these types of clusters. As such, the results in this tutorial should not be used as the basis for comparing the methods generally.
An example of creating and summarizing the synthetic clustering dataset is listed below.
Running the example creates the synthetic clustering dataset, then creates a scatter plot of the input data with points colored by class label (idealized clusters).
We can clearly see two distinct groups of data in two dimensions and the hope would be that an automatic clustering algorithm can detect these groupings.
Scatter Plot of Synthetic Clustering Dataset With Points Colored by Known Cluster
Next, we can start looking at examples of clustering algorithms applied to this dataset.
I have made some minimal attempts to tune each method to the dataset.
Can you get a better result for one of the algorithms?
Let me know in the comments below.
Affinity Propagation
Affinity Propagation involves finding a set of exemplars that best summarize the data.
We devised a method called “affinity propagation,” which takes as input measures of similarity between pairs of data points. Real-valued messages are exchanged between data points until a high-quality set of exemplars and corresponding clusters gradually emerges
It is implemented via the AffinityPropagation class and the main configuration to tune is the “damping” set between 0.5 and 1, and perhaps “preference.”
# create scatter plot for samples from each cluster
forcluster inclusters:
# get row indexes for samples with this cluster
row_ix=where(yhat==cluster)
# create scatter of these samples
pyplot.scatter(X[row_ix,0],X[row_ix,1])
# show the plot
pyplot.show()
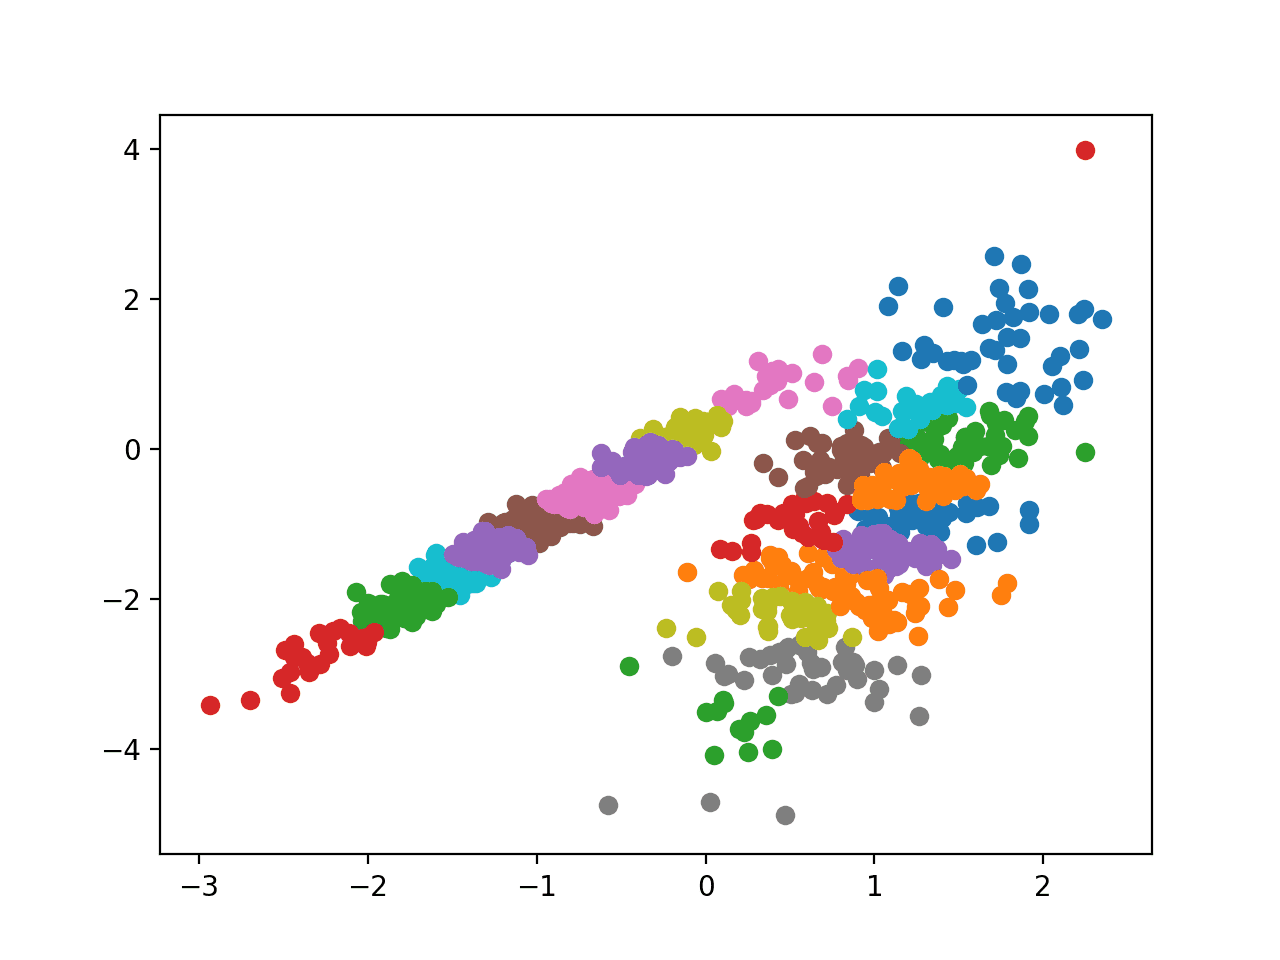
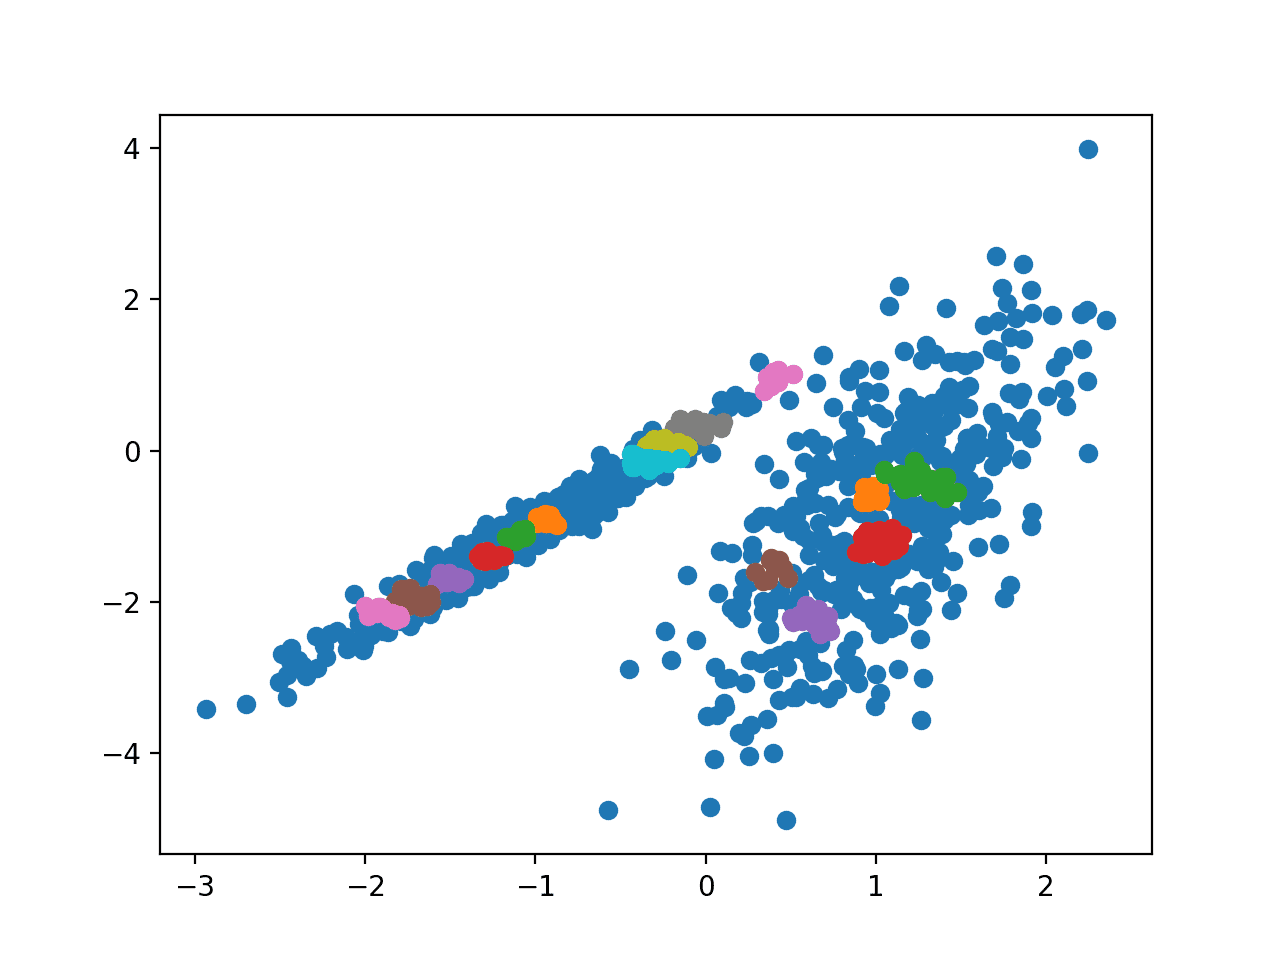
Running the example fits the model on the training dataset and predicts a cluster for each example in the dataset. A scatter plot is then created with points colored by their assigned cluster.
In this case, I could not achieve a good result.
Scatter Plot of Dataset With Clusters Identified Using Affinity Propagation
Agglomerative Clustering
Agglomerative clustering involves merging examples until the desired number of clusters is achieved.
It is a part of a broader class of hierarchical clustering methods and you can learn more here:
It is implemented via the AgglomerativeClustering class and the main configuration to tune is the “n_clusters” set, an estimate of the number of clusters in the data, e.g. 2.
The complete example is listed below.
1
2
3
4
5
6
7
8
9
10
11
12
13
14
15
16
17
18
19
20
21
22
# agglomerative clustering
from numpy import unique
from numpy import where
from sklearn.datasets import make_classification
from sklearn.cluster import AgglomerativeClustering
# create scatter plot for samples from each cluster
forcluster inclusters:
# get row indexes for samples with this cluster
row_ix=where(yhat==cluster)
# create scatter of these samples
pyplot.scatter(X[row_ix,0],X[row_ix,1])
# show the plot
pyplot.show()
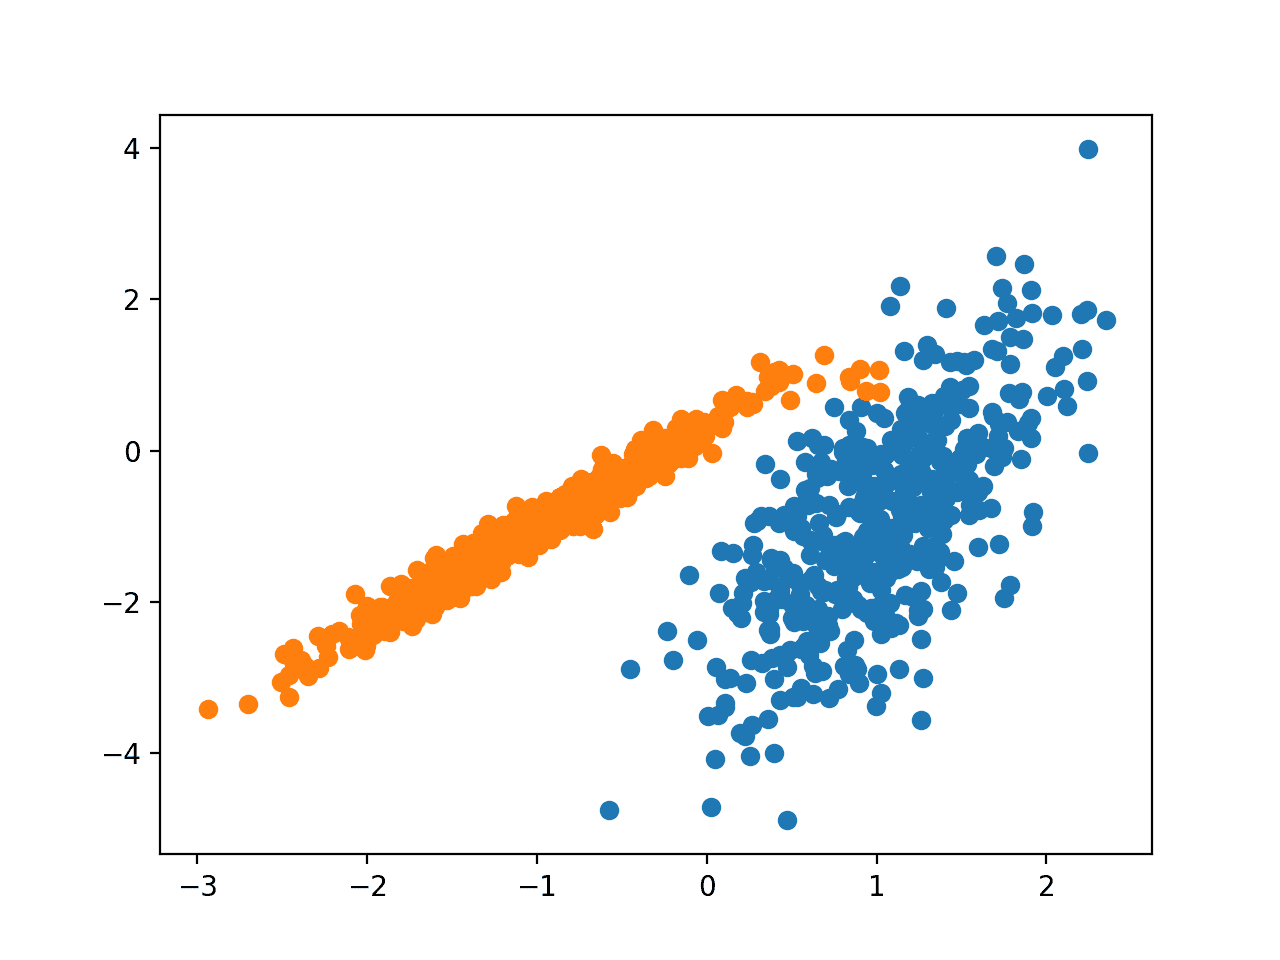
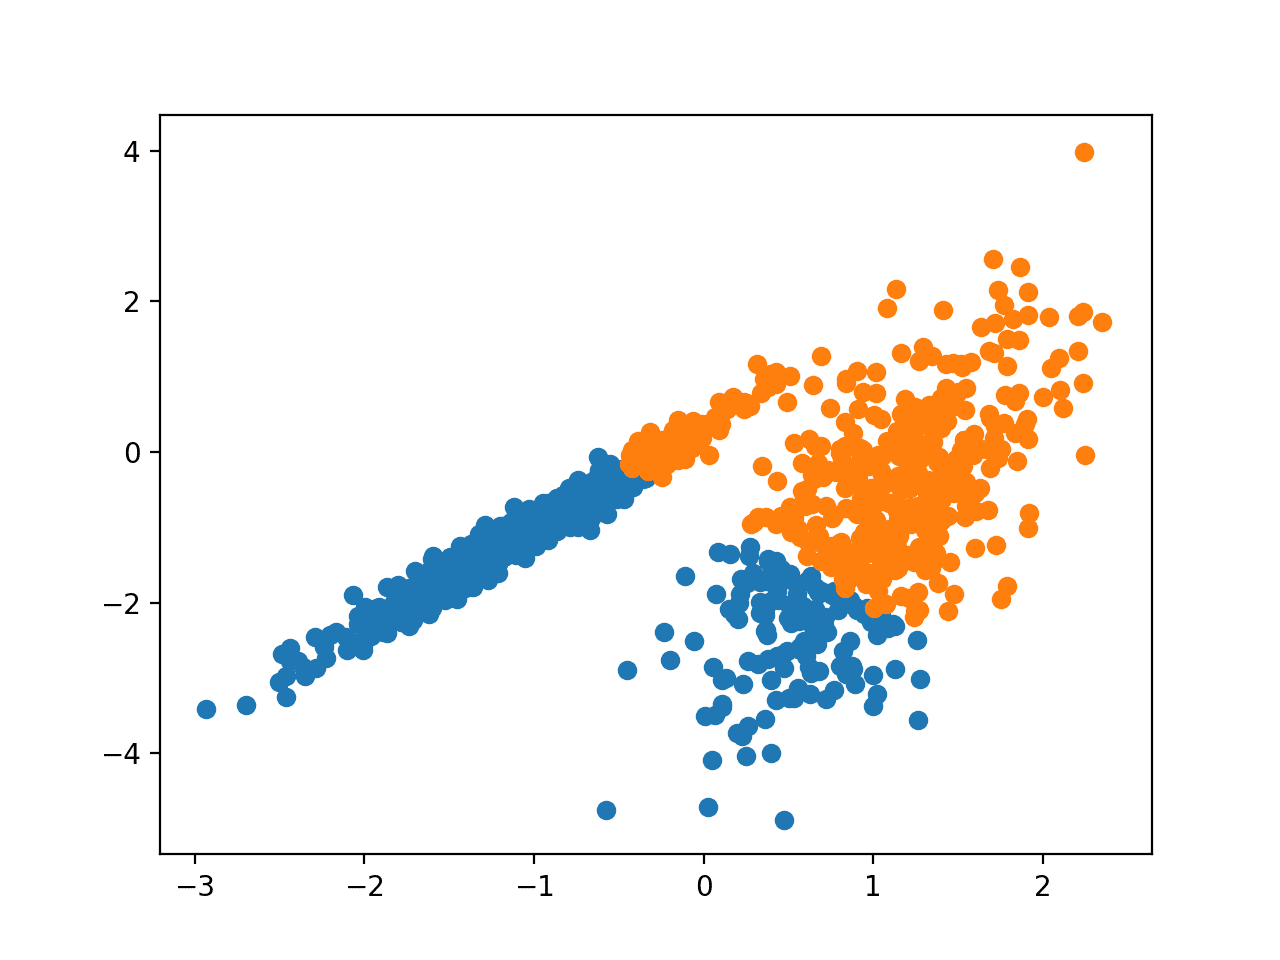
Running the example fits the model on the training dataset and predicts a cluster for each example in the dataset. A scatter plot is then created with points colored by their assigned cluster.
In this case, a reasonable grouping is found.
Scatter Plot of Dataset With Clusters Identified Using Agglomerative Clustering
BIRCH
BIRCH Clustering (BIRCH is short for Balanced Iterative Reducing and Clustering using
Hierarchies) involves constructing a tree structure from which cluster centroids are extracted.
BIRCH incrementally and dynamically clusters incoming multi-dimensional metric data points to try to produce the best quality clustering with the available resources (i. e., available memory and time constraints).
It is implemented via the Birch class and the main configuration to tune is the “threshold” and “n_clusters” hyperparameters, the latter of which provides an estimate of the number of clusters.
# create scatter plot for samples from each cluster
forcluster inclusters:
# get row indexes for samples with this cluster
row_ix=where(yhat==cluster)
# create scatter of these samples
pyplot.scatter(X[row_ix,0],X[row_ix,1])
# show the plot
pyplot.show()
Running the example fits the model on the training dataset and predicts a cluster for each example in the dataset. A scatter plot is then created with points colored by their assigned cluster.
In this case, an excellent grouping is found.
Scatter Plot of Dataset With Clusters Identified Using BIRCH Clustering
DBSCAN
DBSCAN Clustering (where DBSCAN is short for Density-Based Spatial Clustering of Applications with Noise) involves finding high-density areas in the domain and expanding those areas of the feature space around them as clusters.
… we present the new clustering algorithm DBSCAN relying on a density-based notion of clusters which is designed to discover clusters of arbitrary shape. DBSCAN requires only one input parameter and supports the user in determining an appropriate value for it
# create scatter plot for samples from each cluster
forcluster inclusters:
# get row indexes for samples with this cluster
row_ix=where(yhat==cluster)
# create scatter of these samples
pyplot.scatter(X[row_ix,0],X[row_ix,1])
# show the plot
pyplot.show()
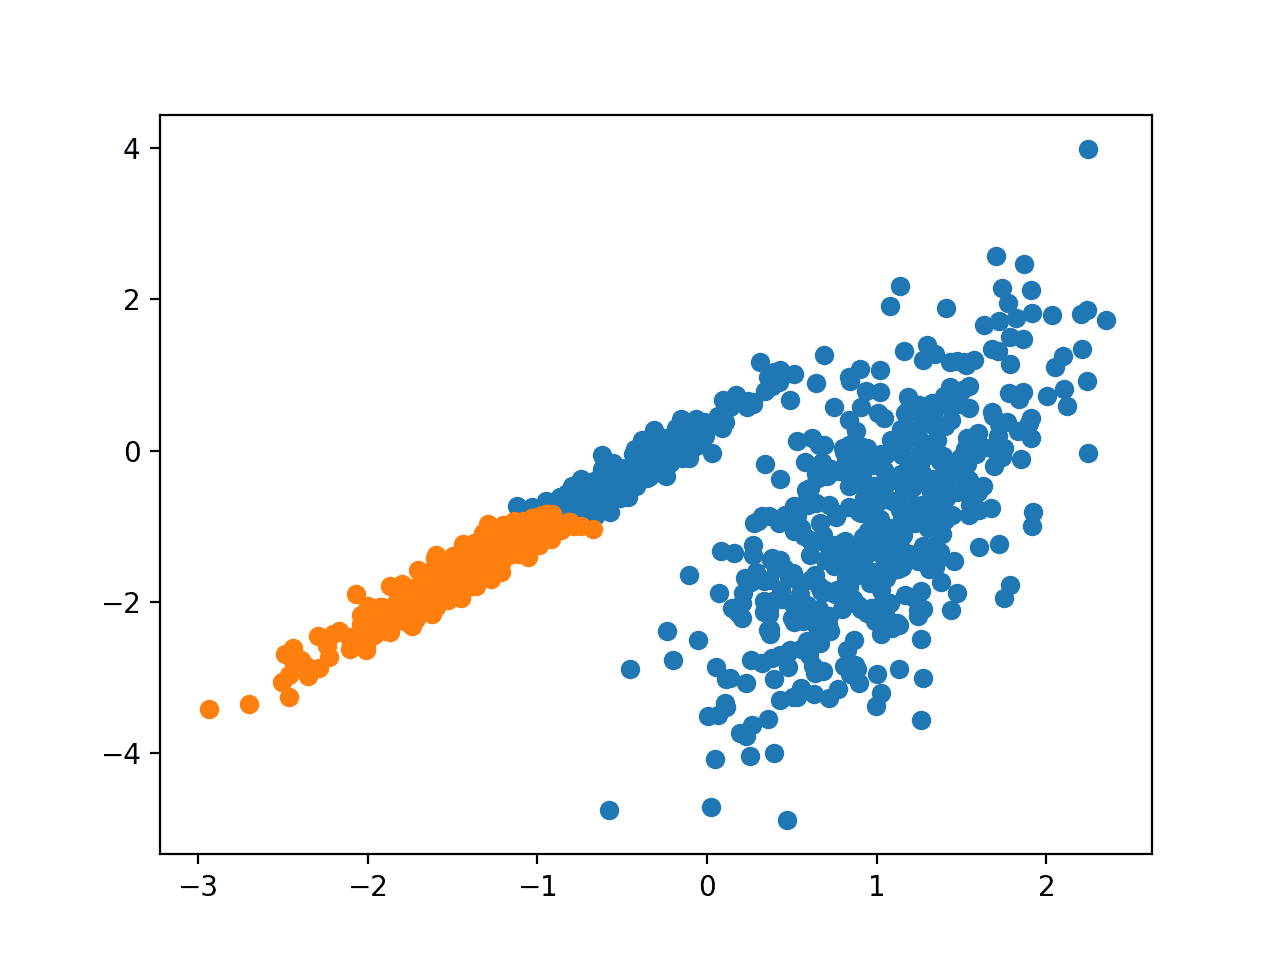
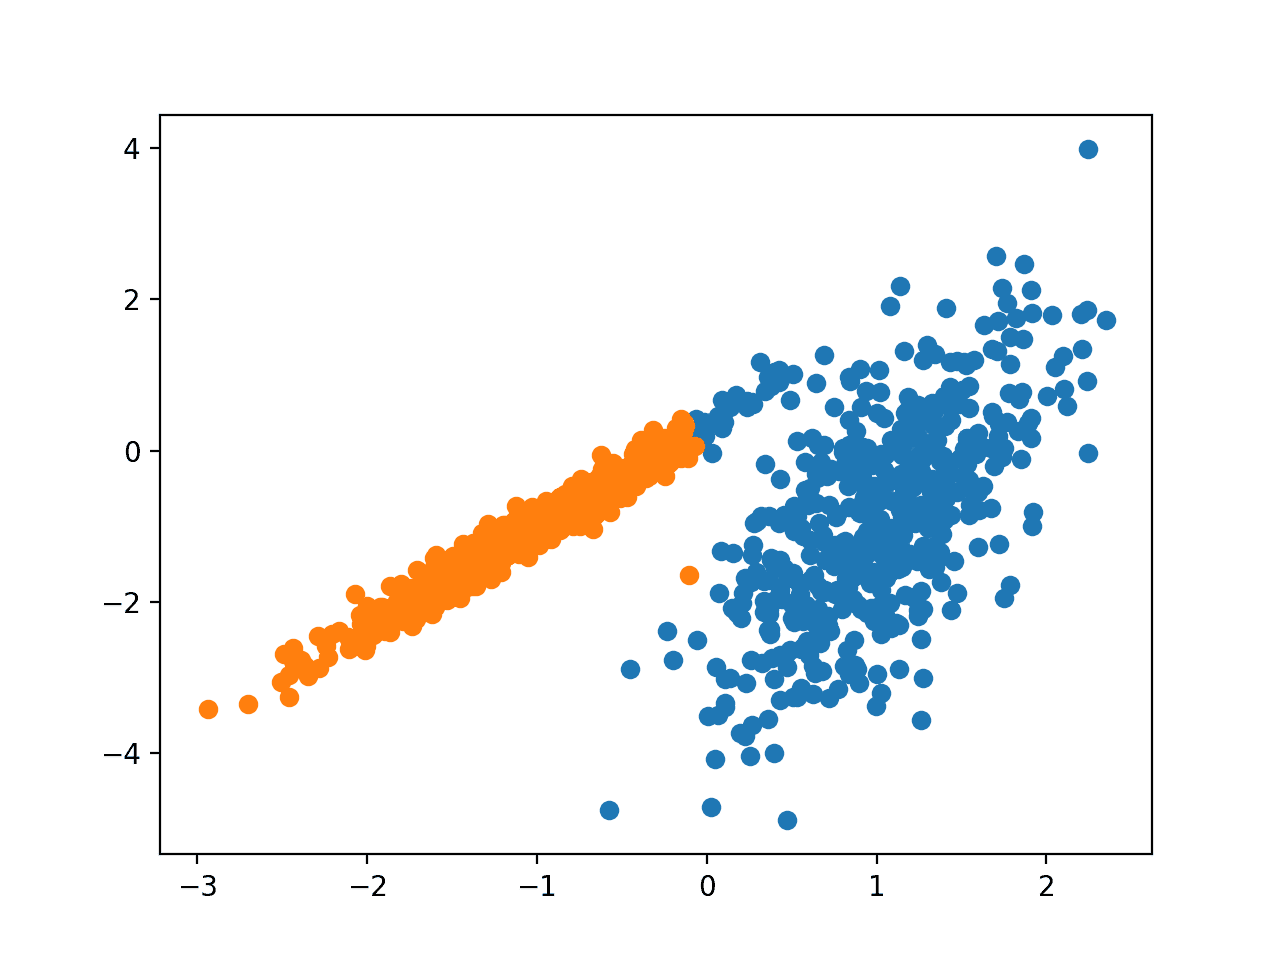
Running the example fits the model on the training dataset and predicts a cluster for each example in the dataset. A scatter plot is then created with points colored by their assigned cluster.
In this case, a reasonable grouping is found, although more tuning is required.
Scatter Plot of Dataset With Clusters Identified Using DBSCAN Clustering
K-Means
K-Means Clustering may be the most widely known clustering algorithm and involves assigning examples to clusters in an effort to minimize the variance within each cluster.
The main purpose of this paper is to describe a process for partitioning an N-dimensional population into k sets on the basis of a sample. The process, which is called ‘k-means,’ appears to give partitions which are reasonably efficient in the sense of within-class variance.
It is implemented via the KMeans class and the main configuration to tune is the “n_clusters” hyperparameter set to the estimated number of clusters in the data.
# create scatter plot for samples from each cluster
forcluster inclusters:
# get row indexes for samples with this cluster
row_ix=where(yhat==cluster)
# create scatter of these samples
pyplot.scatter(X[row_ix,0],X[row_ix,1])
# show the plot
pyplot.show()
Running the example fits the model on the training dataset and predicts a cluster for each example in the dataset. A scatter plot is then created with points colored by their assigned cluster.
In this case, a reasonable grouping is found, although the unequal equal variance in each dimension makes the method less suited to this dataset.
Scatter Plot of Dataset With Clusters Identified Using K-Means Clustering
Mini-Batch K-Means
Mini-Batch K-Means is a modified version of k-means that makes updates to the cluster centroids using mini-batches of samples rather than the entire dataset, which can make it faster for large datasets, and perhaps more robust to statistical noise.
… we propose the use of mini-batch optimization for k-means clustering. This reduces computation cost by orders of magnitude compared to the classic batch algorithm while yielding significantly better solutions than online stochastic gradient descent.
It is implemented via the MiniBatchKMeans class and the main configuration to tune is the “n_clusters” hyperparameter set to the estimated number of clusters in the data.
# create scatter plot for samples from each cluster
forcluster inclusters:
# get row indexes for samples with this cluster
row_ix=where(yhat==cluster)
# create scatter of these samples
pyplot.scatter(X[row_ix,0],X[row_ix,1])
# show the plot
pyplot.show()
Running the example fits the model on the training dataset and predicts a cluster for each example in the dataset. A scatter plot is then created with points colored by their assigned cluster.
In this case, a result equivalent to the standard k-means algorithm is found.
Scatter Plot of Dataset With Clusters Identified Using Mini-Batch K-Means Clustering
Mean Shift
Mean shift clustering involves finding and adapting centroids based on the density of examples in the feature space.
We prove for discrete data the convergence of a recursive mean shift procedure to the nearest stationary point of the underlying density function and thus its utility in detecting the modes of the density.
# create scatter plot for samples from each cluster
forcluster inclusters:
# get row indexes for samples with this cluster
row_ix=where(yhat==cluster)
# create scatter of these samples
pyplot.scatter(X[row_ix,0],X[row_ix,1])
# show the plot
pyplot.show()
Running the example fits the model on the training dataset and predicts a cluster for each example in the dataset. A scatter plot is then created with points colored by their assigned cluster.
In this case, a reasonable set of clusters are found in the data.
Scatter Plot of Dataset With Clusters Identified Using Mean Shift Clustering
OPTICS
OPTICS clustering (where OPTICS is short for Ordering Points To Identify the Clustering Structure) is a modified version of DBSCAN described above.
We introduce a new algorithm for the purpose of cluster analysis which does not produce a clustering of a data set explicitly; but instead creates an augmented ordering of the database representing its density-based clustering structure. This cluster-ordering contains information which is equivalent to the density-based clusterings corresponding to a broad range of parameter settings.
# create scatter plot for samples from each cluster
forcluster inclusters:
# get row indexes for samples with this cluster
row_ix=where(yhat==cluster)
# create scatter of these samples
pyplot.scatter(X[row_ix,0],X[row_ix,1])
# show the plot
pyplot.show()
Running the example fits the model on the training dataset and predicts a cluster for each example in the dataset. A scatter plot is then created with points colored by their assigned cluster.
In this case, I could not achieve a reasonable result on this dataset.
Scatter Plot of Dataset With Clusters Identified Using OPTICS Clustering
Spectral Clustering
Spectral Clustering is a general class of clustering methods, drawn from linear algebra.
A promising alternative that has recently emerged in a number of fields is to use spectral methods for clustering. Here, one uses the top eigenvectors of a matrix derived from the distance between points.
It is implemented via the SpectralClustering class and the main Spectral Clustering is a general class of clustering methods, drawn from linear algebra. to tune is the “n_clusters” hyperparameter used to specify the estimated number of clusters in the data.
# create scatter plot for samples from each cluster
forcluster inclusters:
# get row indexes for samples with this cluster
row_ix=where(yhat==cluster)
# create scatter of these samples
pyplot.scatter(X[row_ix,0],X[row_ix,1])
# show the plot
pyplot.show()
Running the example fits the model on the training dataset and predicts a cluster for each example in the dataset. A scatter plot is then created with points colored by their assigned cluster.
In this case, reasonable clusters were found.
Scatter Plot of Dataset With Clusters Identified Using Spectra Clustering Clustering
Gaussian Mixture Model
A Gaussian mixture model summarizes a multivariate probability density function with a mixture of Gaussian probability distributions as its name suggests.
It is implemented via the GaussianMixture class and the main configuration to tune is the “n_clusters” hyperparameter used to specify the estimated number of clusters in the data.
# create scatter plot for samples from each cluster
forcluster inclusters:
# get row indexes for samples with this cluster
row_ix=where(yhat==cluster)
# create scatter of these samples
pyplot.scatter(X[row_ix,0],X[row_ix,1])
# show the plot
pyplot.show()
Running the example fits the model on the training dataset and predicts a cluster for each example in the dataset. A scatter plot is then created with points colored by their assigned cluster.
In this case, we can see that the clusters were identified perfectly. This is not surprising given that the dataset was generated as a mixture of Gaussians.
Scatter Plot of Dataset With Clusters Identified Using Gaussian Mixture Clustering
Further Reading
This section provides more resources on the topic if you are looking to go deeper.
For K means, what order do the colors go in? For example, if K = 1 then its blue, if K = 2 its orange, if K = 3 its green, what are the colors for K = 4 and K = 5? (I did k means with k = 5). Thank you so much!
Thank you for the quick and clear introduction to clustering.
I was wantering if there is a way to chose a clustering algorithm rather than another when approaching a clustering problem.
I would say that is a matter of the problem. And maybe dataset visualization helps to decide which algorithm to pick. However, I was thinking if there are some suggestions to keep in mind when choosing the algorithm.
in addition:
1- How can we visualize high dimensional data in order to understand if there is a behind structure? (I am thinking to reduce dimesionality with PCA to 2D/3D, and then draw the original axis in this new representation, but is anyway quite hard).
2- How can we chose the algorithm for different dataset size (from very small to very big)?
1- How can we visualize high dimensional data in order to understand if there is a behind structure? (I am thinking to reduce dimesionality with PCA to 2D/3D, and then draw the original axis in this new representation, but is anyway quite hard).
Ans: Please try seaborn python package to visualize high dimensional data (upto 7). this package is very efficient. Of course, you may reduce dimensions and try seaborn together.
2- How can we chose the algorithm for different dataset size (from very small to very big)?
Ans: the bigger is the better 🙂 However, you may need a domain expert to evaluate the results. Because, although you can think that one result is perfect visually (as discussed above), it is not always the best. Lets take the visual result of OPTICS (see above). Maybe some cancer tissues are hidden inside a big part?
Typically the complexity of the algorithm will play a part, e.g. choose faster algorithms for large dataset or work with a sample of the data instead of all of it.
Thank you to both for the kind answers. I really appreaciate that.
Regarding the answers:
1- I tryied using seaborn in different ways to visualize high dimensional data. I found pair plot useful for understanding the every feature distribution as well as the distribution over every couple of features. Do you have any other suggestions?
Mainfold approach is something I still haven’t used yet, since I do not know so well the theory behind it (maybe a suggestion for the next post ;)). However, I will try both with t-SNE, and the quite new UMAP.
2- Thank you for the hint. The problem I am working on is on a complete unsupervised dataset. The idea was to drive some evaluations, starting from the results of the clustering. Means that every clustering algorithm could be used for the first clustering approach. The expert working with me were not completely able to provide some additional informations on the structure of the data (even if the final decision will be binary, the items we are analizing can have different feature structure – reason why I was clustering with > 2 clusters). At the end, I decided to apply a GMM, select a bounch of items for each cluster, and ask for an evaluation on those. Once this evaluation will be ready, I will try to evaluate the clusters based on this limited amount of labels, trying to optimize both the algorithm and the hyperparameters.
How to apply the code to my data instead of the make_classification dataset. What changes do I need to do to define my x, y and what changes in the for loop. I have three columns (two variables x,y in the first two columns and one variable in the third column (Z) that I want to color the x,y values with Z values)
Jason, this was a very well illustrated post on clustering algos.
I was wondering if you could uncover the math behind each of these algos. That would be great to understand their internals.
Just a quick question. If we want to find similar behaving consumer products, for example, in skin care. There are over 200 SKUs and we want to find products based on their sales, discounts paid out, channels, regions, etc , how would we go about applying these clustering algorithms? Can they be applied?. Because visualizing clusters would be challenging and secondly, how to set up the task with multiple attributes out of which some are categorical?
Hi Jason.
I have a dataset containing 50000 vectors with 512 dimensions. what is the best and the fastest method to cluster them?
Thank you for your interesting post.
Thank you for this, so thorough, and I plan to study closely! At the moment tho, I am looking for information on the best approach to use for a data set that includes about 2k observations and 30 binary (0/1) features, and want to solve for the best fitting number of clusters. Grateful for any tips!
Most clustering algorithms require specifying “n_clusters” parameter or some threshold equivalent. While working with 2D/3D data, it is easy to visually supervise this parameter, but in more dimensions it may be problematic. Do you know how to approach this if we don’t have a clue how many clusters are to be expected?
Regards!
hi sir ,
i am trying to find sequence clustering of hmm’s with different time scales .
i am trying to implementing this paper -https://papers.nips.cc/paper/1217-clustering-sequences-with-hidden-markov-models.pdf
i have doubt in 2.1 section ,plz help me how should i proceed??
I need help with what X I should use as input in kmeans.fit(). I want to generate a 3D plot of K-Means clusters using the first three principal components because the original feature space is high-dimensional (n features = 34!). This is my plot:
The code below shows how I normalized and mapped X to the PCs. Which clustering results, y_kmeans or y_kmeans_pca should I use? X_pca is not 0-1 bound. Or should I normalize X_pca first and use kmeans.fit_predict(X_pca_normlized) instead?
My question is not about creating a 3d plot. My question is, if I want to visualize clustering of high-dimension data, what X input should I apply to kmeans.fit(): 1) normalized X values, principal components, or normalized principal components since some PCs have range -1 to 1, some have range -2 to 2. Thanks!
Thank you very much Jason, it’s always a pleasure to read you, For DBSCAN, it is also present in the identification of outliers and anomalies, on the other hand its complexity increases with the size of the database. what do you think
Hi Jason, Nice article. I have a question. Is there a clustering algorithm that cluster data based on a hyperparameter “number of point in every cluster”. For instance if I have 200 data point and set number of points in each cluster 10, model give me 20 cluster that each has 10 data point. I would be appreciated if you help me with that.
Hi Pouyan, did you find any clustering algorithm for that purpose? I am also looking for a good clustering method to evenly clustering my 2D coordinates data. THanks.
Thank you for this post. The number of features of points in data set is large. Each point is a vector with perhaps as many as fifty elements. Which clustering algorithm is best for this problem?
Hi Jason,
Should the data we used for kmeans clustering be normalized? or is it ok if the dataset has outliers? Could you explain a bit why normalization is/is not important ? or if you have a tutorial on it can you let me know please? thanks
Really appreciate your work for the knowledge dissemination.
I have problem regarding the pattern identification. My problem is pattern identification of time-frequency representation (spectrogram) of Gravitational wave time series data. The pattern identification was done by using the curve fitting however, I want to identify trend or pattern on the spectrogram by a clustering method.
Please explain me what is the best clustering method for that?
Thanks.
First thank you for vulgarizing ML so well. It is great to avoid the bottom up burden of math and theory.
I have read a lot about clustering and also utilized different approaches to experiment. Clustering algorithms are useful and efficient but the question is about understanding the defined clusters characteristics. I used to plot features on radar charts or boxplots to try to understand but it get things unreadable when it comes to large datasets features numbers.
Is there a tool to visualize features importance for clusters?
Dear Sir/Miss,
I am using python language and like to apply deep learning algorithm on medical data. However, I am new to python and don’t know which algorithm would be suitable to apply for data clustering. I am looking for algorithm that does not need input parameters and cluster the data. I would be so thankful if anyone could guide me and mention me any suitable algorithm that would be good for such type clustering. Looking forward to hearing from you soon.
Thanks,
Hassan
first where should i get data set of different different field
second which parameter i should calculate to measure clustering algorithm performance.
i am going to implement all the clustering algorithm in python so i required large data set and which parameter i should calculate as a result of each algorithm so that i can compare with all algorithm performance.
I got 16 GB RAM on my pc and working with less data is not an option for me. I tried using Dask library but no success. I will look for another way or upgrade RAM to 64 GB.
Thanks for article by the way.
Thanks for taking the time to write a great article (as well as many others that are extremely helpful).
I have two questions:
-Is there a way to cluster with constraints? For example, if we were clustering products that are ordered together, is there a way to not allow certain product attributes to appear in the same cluster together?
-Can a cluster maximum be set based on a numerical field (i.e. a cluster cannot exceed a total sum (all products) of X amount of sales units).
After attaining a good clustering, how do we interpret the results? It is easy if there are only 2 dimensions. But, once there are more than two, how do we find out the differences in the features of the individual clusters?
For example,
cluster 1 – median age 30, weight 50kg, employed, healthy
cluster 2 – median age 30, weight 50kg, unemployed, unhealthy
cluster 3 – mecian age 55, weight 65kg, employed, unhealthy
How do we tease out these information after clustering?
I imagine it will be more difficult to interpret clustering after dimensionality reduction, but would you happen to have an advice to facilitate the interpretation of results?
A fantastic guide to clustering. Do you know of a method to extract some kind of feature importance scores, i.e. outputting which features are important in clustering the data?
you saved my life (and my time) with your website! Congratulations!!!
I have some questions:
1) I found only this tutorial about Clustering Algorithms on your page. Are there any tutorials (+code) about Unsupervised Learning?
2) if there are no other tutorials, I would like you to suggest me one of Your Books about that. Is there any about Clustering? If not, could you suggest me another book or site with code snippets like this?
Depends on what do you want to do, you need to convert images into a vector and then cluster based on the vector. I can give you some idea on how to do this: Use an autoencoder to generate such vectors, count the color of pixels and hence a 256-grayscale image will produce a 256-dimensional vector, apply some image processing techniques such as edge detection and express the edges as lengths and slopes, etc.
X = dataset.values[:,0:2]
y = dataset.values[:,3]
# Explore Data
print(dataset.shape)
print(dataset.head(10))
print(dataset.describe())
print(dataset.dtypes)
# create scatter plot for samples from each class
for class_value in range(3):
# get row indexes for samples with this class
row_ix = where(y == class_value)
# create scatter of these samples
pyplot.scatter(X[row_ix, 0], X[row_ix, 3])
# show the plot
pyplot.show()
I’m getting this error :
Traceback (most recent call last):
File “C:/Users/USER/pythonProject/main.py”, line 44, in
The Gaussian Mixture Model from sklearn has only one 1-dimensional variance variable per the whole cluster space induced by the distance metric. But what if one has clusters where their variance varies across the dimensions: think of one cluster as a horizontal oval and the other cluster as the vertical oval. Then sklearn implementation would not capture these concepts well.
Do you know of any standard library that considers the variance across each dimension of the cluster?
hi iam raju i want partially related multi task clustering python project and i have some doubts what tools used in that project and purpose of project and responsibilities of project
Solve the following clustering problem using a fuzzy c-means clustering algorithm. Write appropriate assumptions wherever necessary. (Given: No. of objects: 5, No. of clusters: 2 and data points x,y for each object in the below table). Write all the steps for the algorithm in detail as you solve for at least two iterations.
A – 10, 15
B – 15, 15
C – 25, 25
D – 50, 60
E – 65, 65
can someone please help me solve the above question?
Hello, I’m looking for a way to cluster numerous data about covid-19 cases to identify hotspot areas and to categorize them to three different level; to mild covid-19 level, moderate covid 19 level, and severe covid 19 level.
Am I on the right path about learning data clustering algorithm? Second question is, I think the Spectral and the K-Mean algorithm are the algorithms that fits into my needs. What do you think about it?
You are very welcome John! Please specify some of the goals in more detail and we can provide some suggestions to help get you moving in the right direction.
“Hello, I’m looking for a way to cluster numerous data about covid-19 cases to identify hotspot areas and to categorize them to three different level; to mild covid-19 level, moderate covid 19 level, and severe covid 19 level.”
My question is which is the best algorithm for my goal and why? I’m still pretty much stuck on this matter. Thank you so much.


")


Thanks as always!
You’re welcome Richard!
For K means, what order do the colors go in? For example, if K = 1 then its blue, if K = 2 its orange, if K = 3 its green, what are the colors for K = 4 and K = 5? (I did k means with k = 5). Thank you so much!
Hi DK…You may find the following resource insightful:
https://towardsdatascience.com/understanding-k-means-clustering-in-machine-learning-6a6e67336aa1
Thank you for this illustrative post Jason.
You’re very welcome Paul!
Good post
Thanks!
Excellent Tutorial. Thanks for the hard work.
Thanks.
Dear Jason,
Thank you for the quick and clear introduction to clustering.
I was wantering if there is a way to chose a clustering algorithm rather than another when approaching a clustering problem.
I would say that is a matter of the problem. And maybe dataset visualization helps to decide which algorithm to pick. However, I was thinking if there are some suggestions to keep in mind when choosing the algorithm.
in addition:
1- How can we visualize high dimensional data in order to understand if there is a behind structure? (I am thinking to reduce dimesionality with PCA to 2D/3D, and then draw the original axis in this new representation, but is anyway quite hard).
2- How can we chose the algorithm for different dataset size (from very small to very big)?
Kind Regards,
Marco
You’re welcome.
Often a performance metric that is meaningful to your project is used and optimized:
https://scikit-learn.org/stable/modules/classes.html#clustering-metrics
1- How can we visualize high dimensional data in order to understand if there is a behind structure? (I am thinking to reduce dimesionality with PCA to 2D/3D, and then draw the original axis in this new representation, but is anyway quite hard).
Ans: Please try seaborn python package to visualize high dimensional data (upto 7). this package is very efficient. Of course, you may reduce dimensions and try seaborn together.
2- How can we chose the algorithm for different dataset size (from very small to very big)?
Ans: the bigger is the better 🙂 However, you may need a domain expert to evaluate the results. Because, although you can think that one result is perfect visually (as discussed above), it is not always the best. Lets take the visual result of OPTICS (see above). Maybe some cancer tissues are hidden inside a big part?
Yes, see the manifold learning methods:
https://scikit-learn.org/stable/modules/manifold.html
Typically the complexity of the algorithm will play a part, e.g. choose faster algorithms for large dataset or work with a sample of the data instead of all of it.
Thank you to both for the kind answers. I really appreaciate that.
Regarding the answers:
1- I tryied using seaborn in different ways to visualize high dimensional data. I found pair plot useful for understanding the every feature distribution as well as the distribution over every couple of features. Do you have any other suggestions?
Mainfold approach is something I still haven’t used yet, since I do not know so well the theory behind it (maybe a suggestion for the next post ;)). However, I will try both with t-SNE, and the quite new UMAP.
2- Thank you for the hint. The problem I am working on is on a complete unsupervised dataset. The idea was to drive some evaluations, starting from the results of the clustering. Means that every clustering algorithm could be used for the first clustering approach. The expert working with me were not completely able to provide some additional informations on the structure of the data (even if the final decision will be binary, the items we are analizing can have different feature structure – reason why I was clustering with > 2 clusters). At the end, I decided to apply a GMM, select a bounch of items for each cluster, and ask for an evaluation on those. Once this evaluation will be ready, I will try to evaluate the clusters based on this limited amount of labels, trying to optimize both the algorithm and the hyperparameters.
Really thank you for you support
I like pca, sammons mapping, som, tsne and a few others.
Good luck!
Just saw this blog post and one of your old replies came to my mind:
https://machinelearningmastery.com/supervised-and-unsupervised-machine-learning-algorithms/#comment-409461
Thank you as always.
Great!
How to apply the code to my data instead of the make_classification dataset. What changes do I need to do to define my x, y and what changes in the for loop. I have three columns (two variables x,y in the first two columns and one variable in the third column (Z) that I want to color the x,y values with Z values)
Load the data from a CSV file:
https://machinelearningmastery.com/load-machine-learning-data-python/
thank you very much.
i applied for my data
https://www.kaggle.com/abdulmeral/10-models-for-clustering
Well done!
Illustrious and informative post
Thanks!
Well demonstrated. Thank you
Thanks!
Jason, this was a very well illustrated post on clustering algos.
I was wondering if you could uncover the math behind each of these algos. That would be great to understand their internals.
Thanks.
Yes, see the referenced papers for each method.
Have you ever considered Latent Class Analysis (LCA). I know its been there for long, but not very popular. Thanks!
No, what is it?
I saw it referenced as the state of the art in customer segmentation in marketing analytics (mike grigsby) but there’s no scitkit implementation
Thanks for sharing.
Latent Class Analysis (LCA) is a model for clustering categorical
data.
Thanks for letting me know Jose, not sure I am familiar with it off the cuff.
Thanks.
You’re welcome.
Thanks again for a wonderful post Jason.
Just a quick question. If we want to find similar behaving consumer products, for example, in skin care. There are over 200 SKUs and we want to find products based on their sales, discounts paid out, channels, regions, etc , how would we go about applying these clustering algorithms? Can they be applied?. Because visualizing clusters would be challenging and secondly, how to set up the task with multiple attributes out of which some are categorical?
Evaluating clusters is very hard – it makes me dislike the whole topic because it becomes subjective.
You can use metrics:
https://scikit-learn.org/stable/modules/classes.html#clustering-metrics
Or use a subject matter expert to review the clusters.
You should check out HDBScan: https://hdbscan.readthedocs.io/en/latest/how_hdbscan_works.html
Thanks for sharing!
Hi Jason.
I have a dataset containing 50000 vectors with 512 dimensions. what is the best and the fastest method to cluster them?
Thank you for your interesting post.
Each method has a different tradeoff. Perhaps compare a few methods directly.
Thank you for this, so thorough, and I plan to study closely! At the moment tho, I am looking for information on the best approach to use for a data set that includes about 2k observations and 30 binary (0/1) features, and want to solve for the best fitting number of clusters. Grateful for any tips!
Perhaps try a suite of methods and see which produces clusters you think match your expectations.
Most clustering algorithms require specifying “n_clusters” parameter or some threshold equivalent. While working with 2D/3D data, it is easy to visually supervise this parameter, but in more dimensions it may be problematic. Do you know how to approach this if we don’t have a clue how many clusters are to be expected?
Regards!
No, sorry. This is subjective nature of the methods makes me deeply dislike using clustering in practice.
hi sir ,
i am trying to find sequence clustering of hmm’s with different time scales .
i am trying to implementing this paper -https://papers.nips.cc/paper/1217-clustering-sequences-with-hidden-markov-models.pdf
i have doubt in 2.1 section ,plz help me how should i proceed??
Sorry, I cannot help you with this. Perhaps try posting on cross-validated.
Thanks for such an lucid article over clustering…
You’re welcome!
You have discussed little amount of unsupervised methods like clustering.
No, I tend to focus on supervised learning.
can u please help me with vertex based clustering(based on jaccard simillarity)..
Thanks for the suggestion, perhaps I will write about it in the future.
Hey,
I need help with what X I should use as input in kmeans.fit(). I want to generate a 3D plot of K-Means clusters using the first three principal components because the original feature space is high-dimensional (n features = 34!). This is my plot:
https://github.com/tuttoaposto/OpenSource/blob/master/Derm_Clustering/Derm_3D_KMeans.png
The code below shows how I normalized and mapped X to the PCs. Which clustering results, y_kmeans or y_kmeans_pca should I use? X_pca is not 0-1 bound. Or should I normalize X_pca first and use kmeans.fit_predict(X_pca_normlized) instead?
Code:
X_normalized = MinMaxScaler().fit_transform(X)
pca = PCA(n_components=3).fit(X_normalized)
X_pca = pca.transform(X_normalized)
kmeans = KMeans(n_clusters=6, random_state=0)
# assign a cluster to each example
y_kmeans_pca= kmeans.fit_predict(X_pca)
# assign a cluster to each example
y_kmeans= kmeans.predict(X_normalized)
Thank you!
Sorry, I cannot help you create a 3d plot, I don’t have a tutorial on this topic.
My question is not about creating a 3d plot. My question is, if I want to visualize clustering of high-dimension data, what X input should I apply to kmeans.fit(): 1) normalized X values, principal components, or normalized principal components since some PCs have range -1 to 1, some have range -2 to 2. Thanks!
Regardless of the number of dimensions of your data, you would use k-means in generally the same way, e.g. call model.fit() and pass all input data.
Yes, it is a good idea to scale input data first, e.g. normalize or standardize the inputs.
hello sir,
i want to make new algorithm for clustering to overcome disadvantage of all algorithm can you guide?
i want to make new algorithm for efficient and robust clustering.
This sounds like a research project, I recommend talking to your research advisor about it.
Thank you very much Jason, it’s always a pleasure to read you, For DBSCAN, it is also present in the identification of outliers and anomalies, on the other hand its complexity increases with the size of the database. what do you think
Sounds reasonable.
Can you also please share some implementation about Fuzzy c-means clustering _
Thank you for the suggestion.
It seems that the author of the following article tried to make use of the example code from this article, although adding some bugs in the process:
https://www.freecodecamp.org/news/8-clustering-algorithms-in-machine-learning-that-all-data-scientists-should-know/
Many people rip off my posts. It sucks!
Google knows and punishes the copies severely in the search results.
Thanks for this review. Very useful and handy.
You’re welcome.
Hi Jason,
I need to group articles based on 23 discontinuous features. How can I display the articles belonging to each cluster ?
Thanks in advance.
Perhaps cluster the data, then write a for loop and an if statement to sort all documents by assigned cluster.
Hello,
Nice summary 🙂 It looks like the eps value for OPTICS was set a bit low.
Thanks Erik.
Hi Jason, Nice article. I have a question. Is there a clustering algorithm that cluster data based on a hyperparameter “number of point in every cluster”. For instance if I have 200 data point and set number of points in each cluster 10, model give me 20 cluster that each has 10 data point. I would be appreciated if you help me with that.
Thanks.
There may be, I’m not sure off the cuff sorry. Perhaps you can configure one of the above methods in this way.
Hi Pouyan, did you find any clustering algorithm for that purpose? I am also looking for a good clustering method to evenly clustering my 2D coordinates data. THanks.
Thank you so much Jason, it’s very handy and useful, saved the link, I am sure I will revisit this post.
You’re welcome.
Thank you for this post. The number of features of points in data set is large. Each point is a vector with perhaps as many as fifty elements. Which clustering algorithm is best for this problem?
You’re welcome.
We cannot know. I recommend testing a suite of algorithms and evaluate them using a metric, choose the one that gives the best score on your dataset.
Hi Jason,
Should the data we used for kmeans clustering be normalized? or is it ok if the dataset has outliers? Could you explain a bit why normalization is/is not important ? or if you have a tutorial on it can you let me know please? thanks
Try with and without noramlization and compare the results, use whatever works best for you.
Try with and without outlier removal on your dataset and compare results, use whatever works best for you.
More on normalization (minmaxscaler):
https://machinelearningmastery.com/standardscaler-and-minmaxscaler-transforms-in-python/
Hi Jason,
Really appreciate your work for the knowledge dissemination.
I have problem regarding the pattern identification. My problem is pattern identification of time-frequency representation (spectrogram) of Gravitational wave time series data. The pattern identification was done by using the curve fitting however, I want to identify trend or pattern on the spectrogram by a clustering method.
Please explain me what is the best clustering method for that?
Thanks.
Thank you.
Sorry, I don’t have tutorials on clustering for time series, but I hope to write about the topic in the future.
I am thinking to do a kmodes algorithm for my project. Do you have any idea on how to do and save it by pickle?
This may help you save your model:
https://machinelearningmastery.com/save-load-machine-learning-models-python-scikit-learn/
Hello Jason,
First thank you for vulgarizing ML so well. It is great to avoid the bottom up burden of math and theory.
I have read a lot about clustering and also utilized different approaches to experiment. Clustering algorithms are useful and efficient but the question is about understanding the defined clusters characteristics. I used to plot features on radar charts or boxplots to try to understand but it get things unreadable when it comes to large datasets features numbers.
Is there a tool to visualize features importance for clusters?
Than k you for help.
Is there a tool to
You’re welcome.
Perhaps you can use pair-wise scatter plots and color points by assigned cluster?
Dear Sir/Miss,
I am using python language and like to apply deep learning algorithm on medical data. However, I am new to python and don’t know which algorithm would be suitable to apply for data clustering. I am looking for algorithm that does not need input parameters and cluster the data. I would be so thankful if anyone could guide me and mention me any suitable algorithm that would be good for such type clustering. Looking forward to hearing from you soon.
Thanks,
Hassan
Not sure deep learning would be the best tool for clustering.
Perhaps try a few algorithms and a few configurations for each and see what works well for your dataset.
Hello sir,
i have 2 questions
first where should i get data set of different different field
second which parameter i should calculate to measure clustering algorithm performance.
i am going to implement all the clustering algorithm in python so i required large data set and which parameter i should calculate as a result of each algorithm so that i can compare with all algorithm performance.
Sorry, I don’t understand your first question, can you please rephrase or elaborate?
This can help you with evaluating clustering algorithms:
https://machinelearningmastery.com/faq/single-faq/how-do-i-evaluate-a-clustering-algorithm
Dear sir,
how to measure clustering algorithm performance? which parameter should consider?
Good question, I answer it here:
https://machinelearningmastery.com/faq/single-faq/how-do-i-evaluate-a-clustering-algorithm
model.fit(X)
Unable to allocate 1.42 TiB for an array with shape (442458, 442458) and data type float64
Help please 🙂
Perhaps work with less data?
Perhaps run on a machine with more RAM?
I got 16 GB RAM on my pc and working with less data is not an option for me. I tried using Dask library but no success. I will look for another way or upgrade RAM to 64 GB.
Thanks for article by the way.
Progressing loading of data into memory is perhaps the path forward.
Thanks for advice. I will also try it.
You’re welcome.
I am new to python. How do I insert my own dataset into the examples?
This will help you load a dataset:
https://machinelearningmastery.com/load-machine-learning-data-python/
Thanks for taking the time to write a great article (as well as many others that are extremely helpful).
I have two questions:
-Is there a way to cluster with constraints? For example, if we were clustering products that are ordered together, is there a way to not allow certain product attributes to appear in the same cluster together?
-Can a cluster maximum be set based on a numerical field (i.e. a cluster cannot exceed a total sum (all products) of X amount of sales units).
You’re welcome.
I suspect that both are possible with custom code. I don’t have much on clustering, sorry.
Thanks Jason
Let me try it out first.
Thank you for this blog?
After attaining a good clustering, how do we interpret the results? It is easy if there are only 2 dimensions. But, once there are more than two, how do we find out the differences in the features of the individual clusters?
For example,
cluster 1 – median age 30, weight 50kg, employed, healthy
cluster 2 – median age 30, weight 50kg, unemployed, unhealthy
cluster 3 – mecian age 55, weight 65kg, employed, unhealthy
How do we tease out these information after clustering?
I imagine it will be more difficult to interpret clustering after dimensionality reduction, but would you happen to have an advice to facilitate the interpretation of results?
Thank you!
That is the great problem with clustering. I find it all too subjective!
Perhaps this will help:
https://machinelearningmastery.com/faq/single-faq/how-do-i-evaluate-a-clustering-algorithm
Impressive guide on Clustering Algorithms With Python must-read blog for those wanting to gain some knowledge in clustering algorithms
Thanks.
Thank you Mr. Jason for this great tutorial!
You’re welcome.
Hi Jason,
A fantastic guide to clustering. Do you know of a method to extract some kind of feature importance scores, i.e. outputting which features are important in clustering the data?
THanks!
No, sorry.
Hi Jason!
you saved my life (and my time) with your website! Congratulations!!!
I have some questions:
1) I found only this tutorial about Clustering Algorithms on your page. Are there any tutorials (+code) about Unsupervised Learning?
2) if there are no other tutorials, I would like you to suggest me one of Your Books about that. Is there any about Clustering? If not, could you suggest me another book or site with code snippets like this?
I will be grateful!
Thank you in Advance!
Sofia
There is a tutorial on clustering here: https://machinelearningmastery.com/clustering-algorithms-with-python/
Clustering is one way of doing unsupervised learning. What specific topics you would otherwise be interested in unsupervised learning?
How to perform clustering of images?
Depends on what do you want to do, you need to convert images into a vector and then cluster based on the vector. I can give you some idea on how to do this: Use an autoencoder to generate such vectors, count the color of pixels and hence a 256-grayscale image will produce a 256-dimensional vector, apply some image processing techniques such as edge detection and express the edges as lengths and slopes, etc.
Hello,
can we incorporate the code used in the classification tutorials (such as normalization, PCA analysis, etc), in the above code?
thank you!
Why not? Indeed it is quite common to apply PCA to transform/reduce dims before applying cluster.
Hello Jason, I have a question…
I’ve programmed these:
# Dependencies
import pandas as pd
from numpy import where
from matplotlib import pyplot
# Load Data
names = [“Frequency”,”Comments Count”,”Likes Count”,”Text nwords”]
dataset = pd.read_csv(“Posts.csv”, encoding=”utf-8″, sep=”;”, delimiter=None,
names=names, delim_whitespace=False,
header=0, engine=”python”)
X = dataset.values[:,0:2]
y = dataset.values[:,3]
# Explore Data
print(dataset.shape)
print(dataset.head(10))
print(dataset.describe())
print(dataset.dtypes)
X,y = dataset(n_samples=100, n_features=4, n_informative=4, n_redundant=0, n_clusters_per_class=1, random_state=4)
# create scatter plot for samples from each class
for class_value in range(3):
# get row indexes for samples with this class
row_ix = where(y == class_value)
# create scatter of these samples
pyplot.scatter(X[row_ix, 0], X[row_ix, 3])
# show the plot
pyplot.show()
I’m getting this error :
Traceback (most recent call last):
File “C:/Users/USER/pythonProject/main.py”, line 44, in
X,y = dataset(n_samples=100, n_features=4, n_informative=4, n_redundant=0, n_clusters_per_class=1, random_state=4)
TypeError: ‘DataFrame’ object is not callable
Any ideas? What can I do?
I think the problem is about the #load data.. How can I insert my own dataset?
Maybe I confuse the Dataset (as a variable) with the Dataset as a function.
Thank you in advance!!
Sofia
This is a common question that I answer here:
https://machinelearningmastery.com/faq/single-faq/can-you-read-review-or-debug-my-code
which of your books is about clustering?
None at this stage, perhaps in the future.
Thank you, Jason, for this tutorial.
The Gaussian Mixture Model from sklearn has only one 1-dimensional variance variable per the whole cluster space induced by the distance metric. But what if one has clusters where their variance varies across the dimensions: think of one cluster as a horizontal oval and the other cluster as the vertical oval. Then sklearn implementation would not capture these concepts well.
Do you know of any standard library that considers the variance across each dimension of the cluster?
It should not be. See sklearn’s example for a 2D case, which you can see the ovals: https://scikit-learn.org/stable/auto_examples/mixture/plot_gmm_pdf.html
hi iam raju i want partially related multi task clustering python project and i have some doubts what tools used in that project and purpose of project and responsibilities of project
Solve the following clustering problem using a fuzzy c-means clustering algorithm. Write appropriate assumptions wherever necessary. (Given: No. of objects: 5, No. of clusters: 2 and data points x,y for each object in the below table). Write all the steps for the algorithm in detail as you solve for at least two iterations.
A – 10, 15
B – 15, 15
C – 25, 25
D – 50, 60
E – 65, 65
can someone please help me solve the above question?
Hello!
How do I insert my own dataset (csv) into the examples?
In this tutorial you use the make_classification() function to create a test binary classification dataset, not a csv file.
This : https://machinelearningmastery.com/load-machine-learning-data-python/ is not very helpful for me… Any idea?
Thank you in Advance
make classification is to fabricate data, while if you have data in CSV, you just need to read it. The easiest way is to use pandas’ read_csv() function. See here for an example: https://machinelearningmastery.com/quick-and-dirty-data-analysis-with-pandas/
Hello Jason !!!!
I’m trying to find python implementation for Dynamic Bayesian networks (DBN).
I need to use them in ICP -intracranial pressure monitoring- to process some time series
signals and recognize clusters.
Is there any python implementation available that you may know ????
Thanks in advance.
Alejandro.
Hi Alejandro…Please see the following:
https://machinelearningmastery.com/introduction-to-bayesian-networks-with-jhonatan-de-souza-oliveira/
https://machinelearningmastery.com/introduction-to-bayesian-belief-networks/
https://machinelearningmastery.com/what-is-bayesian-optimization/
thanks for the valuable information
You are very welcome Gowripriya!
Hi. Is there any way to cluster vectors (of numbers) by their similarity?
Hi Storm,
Please explain further what you are trying to do?
Regards,
Hello, I’m looking for a way to cluster numerous data about covid-19 cases to identify hotspot areas and to categorize them to three different level; to mild covid-19 level, moderate covid 19 level, and severe covid 19 level.
Am I on the right path about learning data clustering algorithm? Second question is, I think the Spectral and the K-Mean algorithm are the algorithms that fits into my needs. What do you think about it?
Hi John N…I see no issue with your goal and approach.
I hope to get a reply soon. Thank you so much
Thank you John N!
Hello James, I appreciate your response!
What do you think is the best algorithm for my goal and why? Thank you so much
You are very welcome John! Please specify some of the goals in more detail and we can provide some suggestions to help get you moving in the right direction.
Here is the reference for my previous reply,
“Hello, I’m looking for a way to cluster numerous data about covid-19 cases to identify hotspot areas and to categorize them to three different level; to mild covid-19 level, moderate covid 19 level, and severe covid 19 level.”
My question is which is the best algorithm for my goal and why? I’m still pretty much stuck on this matter. Thank you so much.
Thanks for a clear tutorial on clustering!
You are very welcome! We appreciate the feedback and support!
Thank you so much for the clear tutorial and I would like to know if you have a tutorial for ensemble clustering
Hi Malek…You may find the following of interest:
https://machinelearningmastery.com/ensemble-learning-books/
will data normalization before clustering help ?
Hi Reaya…It certainly may help. The following resource provides more recommendations to improve performance via data preparation:
https://machinelearningmastery.com/data-preparation-for-machine-learning-7-day-mini-course/