Time series forecasting with LSTMs directly has shown little success.
This is surprising as neural networks are known to be able to learn complex non-linear relationships and the LSTM is perhaps the most successful type of recurrent neural network that is capable of directly supporting multivariate sequence prediction problems.
A recent study performed at Uber AI Labs demonstrates how both the automatic feature learning capabilities of LSTMs and their ability to handle input sequences can be harnessed in an end-to-end model that can be used for drive demand forecasting for rare events like public holidays.
In this post, you will discover an approach to developing a scalable end-to-end LSTM model for time series forecasting.
After reading this post, you will know:
The challenge of multivariate, multi-step forecasting across multiple sites, in this case cities.
An LSTM model architecture for time series forecasting comprised of separate autoencoder and forecasting sub-models.
The skill of the proposed LSTM architecture at rare event demand forecasting and the ability to reuse the trained model on unrelated forecasting problems.
Kick-start your project with my new book Deep Learning for Time Series Forecasting, including step-by-step tutorials and the Python source code files for all examples.
This post is divided into four sections; they are:
Motivation
Datasets
Model
Findings
Motivation
The goal of the work was to develop an end-to-end forecast model for multi-step time series forecasting that can handle multivariate inputs (e.g. multiple input time series).
The intent of the model was to forecast driver demand at Uber for ride sharing, specifically to forecast demand on challenging days such as holidays where the uncertainty for classical models was high.
Generally, this type of demand forecasting for holidays belongs to an area of study called extreme event prediction.
Extreme event prediction has become a popular topic for estimating peak electricity demand, traffic jam severity and surge pricing for ride sharing and other applications. In fact there is a branch of statistics known as extreme value theory (EVT) that deals directly with this challenge.
Classical Forecasting Methods: Where a model was developed per time series, perhaps fit as needed.
Two-Step Approach: Where classical models were used in conjunction with machine learning models.
The difficulty of these existing models motivated the desire for a single end-to-end model.
Further, a model was required that could generalize across locales, specifically across data collected for each city. This means a model trained on some or all cities with data available and used to make forecasts across some or all cities.
We can summarize this as the general need for a model that supports multivariate inputs, makes multi-step forecasts, and generalizes across multiple sites, in this case cities.
Need help with Deep Learning for Time Series?
Take my free 7-day email crash course now (with sample code).
Click to sign-up and also get a free PDF Ebook version of the course.
Datasets
The model was fit in a propitiatory Uber dataset comprised of five years of anonymized ride sharing data across top cities in the US.
A five year daily history of completed trips across top US cities in terms of population was used to provide forecasts across all major US holidays.
The input to each forecast consisted of both the information about each ride, as well as weather, city, and holiday variables.
To circumvent the lack of data we use additional features including weather information (e.g., precipitation, wind speed, temperature) and city level information (e.g., current trips, current users, local holidays).
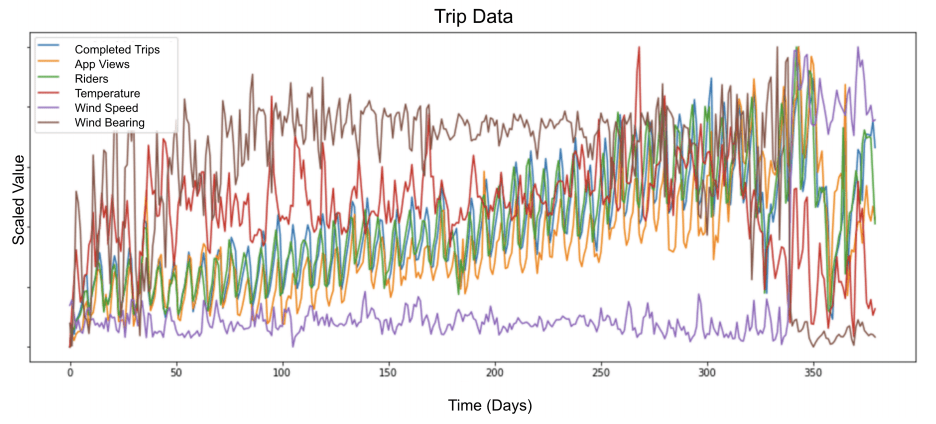
The figure below taken from the paper provides a sample of six variables for one year.
Scaled Multivariate Input for Model Taken from “Time-series Extreme Event Forecasting with Neural Networks at Uber”.
A training dataset was created by splitting the historical data into sliding windows of input and output variables.
The specific size of the look-back and forecast horizon used in the experiments were not specified in the paper.
Sliding Window Approach to Modeling Time Series Taken from “Time-series Extreme Event Forecasting with Neural Networks at Uber”.
Time series data was scaled by normalizing observations per batch of samples and each input series was de-trended, but not deseasonalized.
Neural networks are sensitive to unscaled data, therefore we normalize every minibatch. Furthermore, we found that de-trending the data, as opposed to de-seasoning, produces better results.
A more elaborate architecture was used, comprised of two LSTM models:
Feature Extractor: Model for distilling an input sequence down to a feature vector that may be used as input for making a forecast.
Forecaster: Model that uses the extracted features and other inputs to make a forecast.
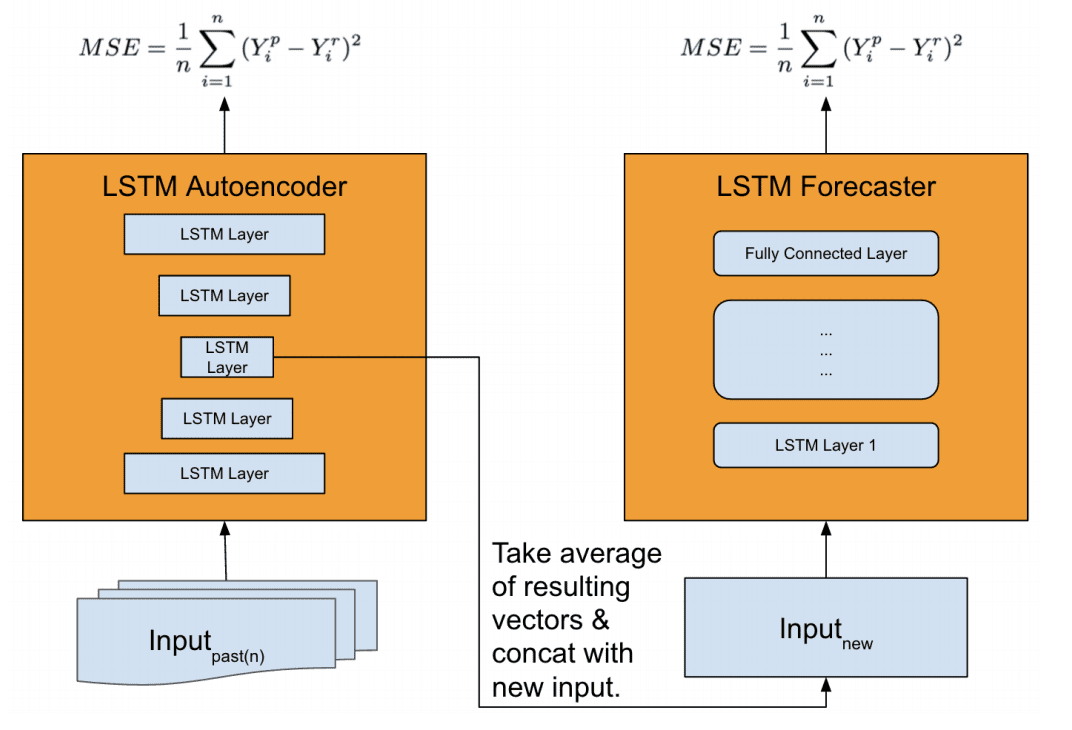
An LSTM autoencoder model was developed for use as the feature extraction model and a Stacked LSTM was used as the forecast model.
We found that the vanilla LSTM model’s performance is worse than our baseline. Thus, we propose a new architecture, that leverages an autoencoder for feature extraction, achieving superior performance compared to our baseline.
When making a forecast, time series data is first provided to the autoencoders, which is compressed to multiple feature vectors that are averaged and concatenated. The feature vectors are then provided as input to the forecast model in order to make a prediction.
… the model first primes the network by auto feature extraction, which is critical to capture complex time-series dynamics during special events at scale. […] Features vectors are then aggregated via an ensemble technique (e.g., averaging or other methods). The final vector is then concatenated with the new input and fed to LSTM forecaster for prediction.
It is not clear what exactly is provided to the autoencoder when making a prediction, although we may guess that it is a multivariate time series for the city being forecasted with observations prior to the interval being forecasted.
A multivariate time series as input to the autoencoder will result in multiple encoded vectors (one for each series) that could be concatenated. It is not clear what role averaging may take at this point, although we may guess that it is an averaging of multiple models performing the autoencoding process.
Overview of Feature Extraction Model and Forecast Model Taken from “Time-series Extreme Event Forecasting with Neural Networks at Uber.”
The authors comment that it would be possible to make the autoencoder a part of the forecast model, and that this was evaluated, but the separate model resulted in better performance.
Having a separate auto-encoder module, however, produced better results in our experience.
More details of the developed model were made available in the slides used when presenting the paper.
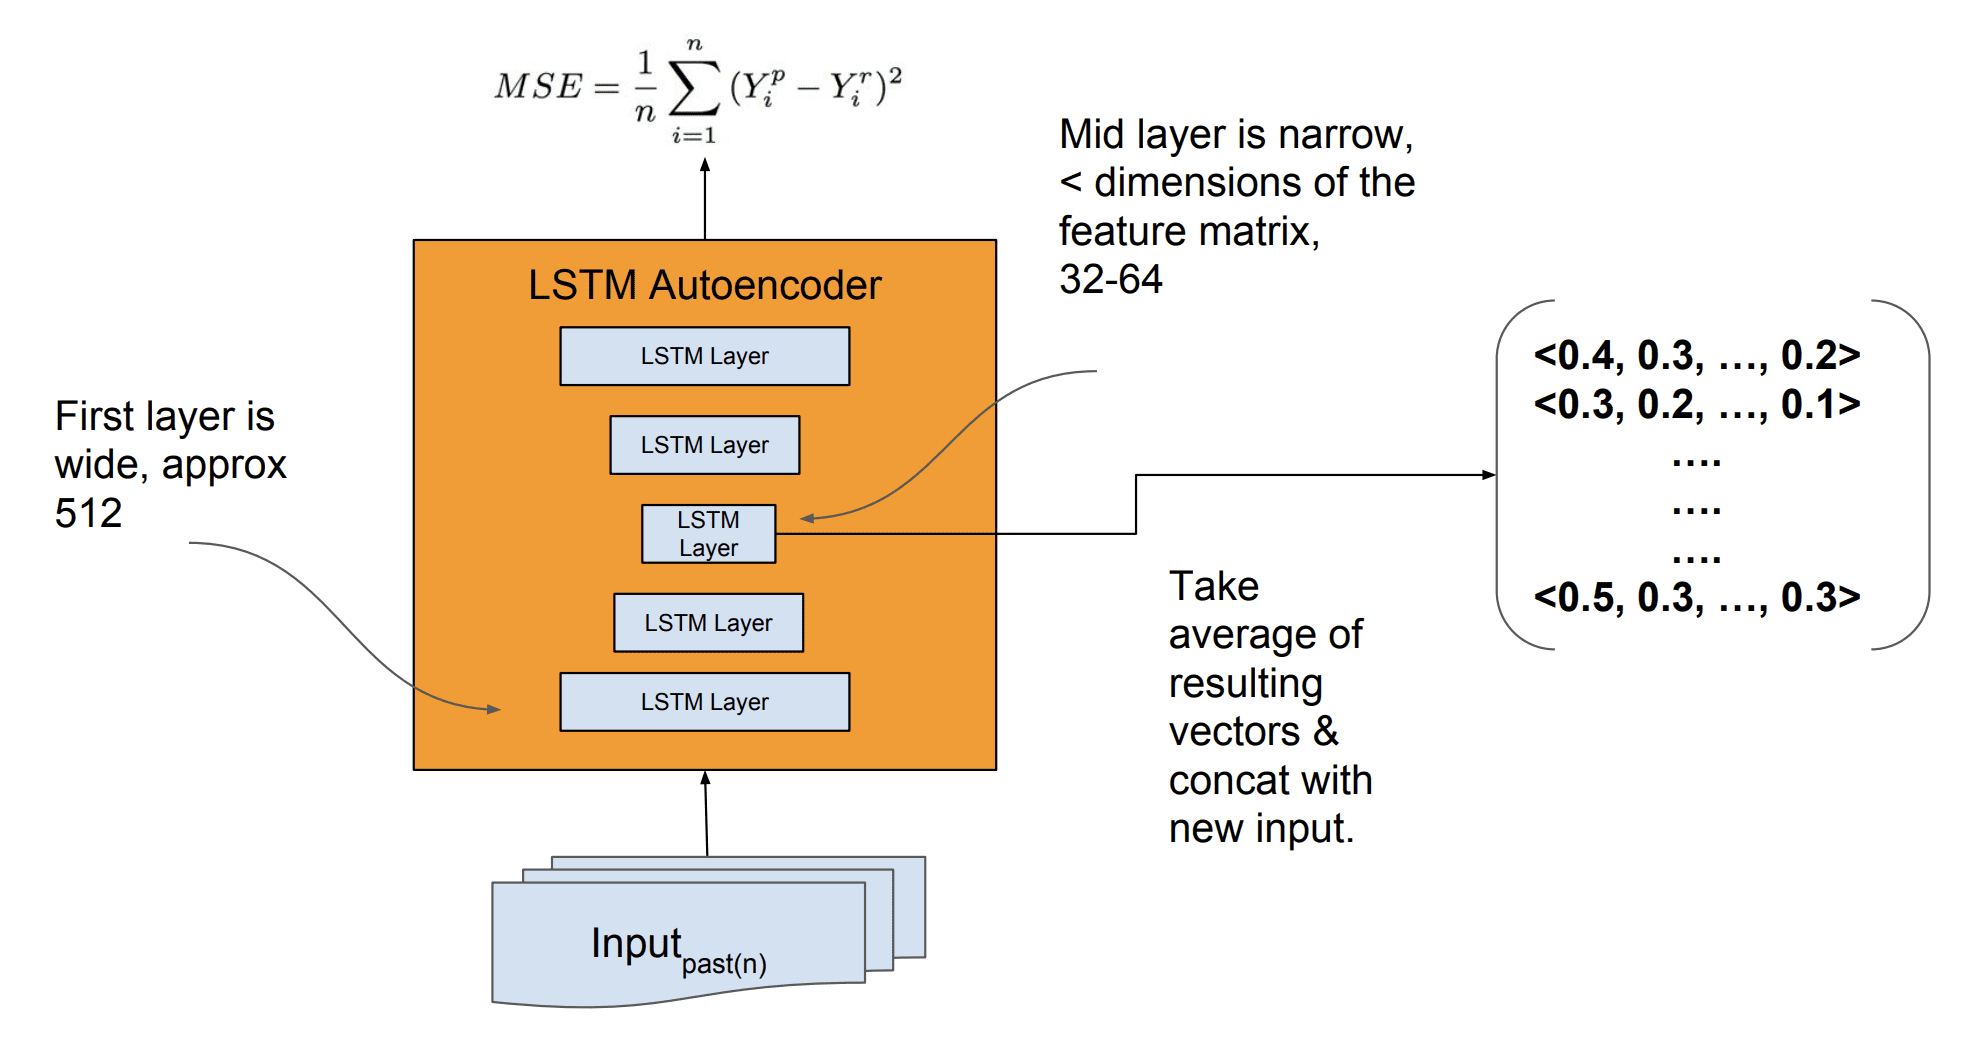
The input for the autoencoder was 512 LSTM units and the bottleneck in the autoencoder used to create the encoded feature vectors as 32 or 64 LSTM units.
Details of LSTM Autoencoder for Feature Extraction Taken from “Time-series Extreme Event Forecasting with Neural Networks at Uber.”
The encoded feature vectors are provided to the forecast model with ‘new input‘, although it is not specified what this new input is; we could guess that it is a time series, perhaps a multivariate time series of the city being forecasted with observations prior to the forecast interval. Or, features extracted from this series as the blog post on the paper suggests (although I’m skeptical as the paper and slides contradict this).
The model was trained on a lot of data, which is a general requirement of stacked LSTMs or perhaps LSTMs in general.
The described production Neural Network Model was trained on thousands of time-series with thousands of data points each.
The model is not retrained when making new forecasts.
An interesting approach to estimating forecast uncertainty was also implemented that used the bootstrap.
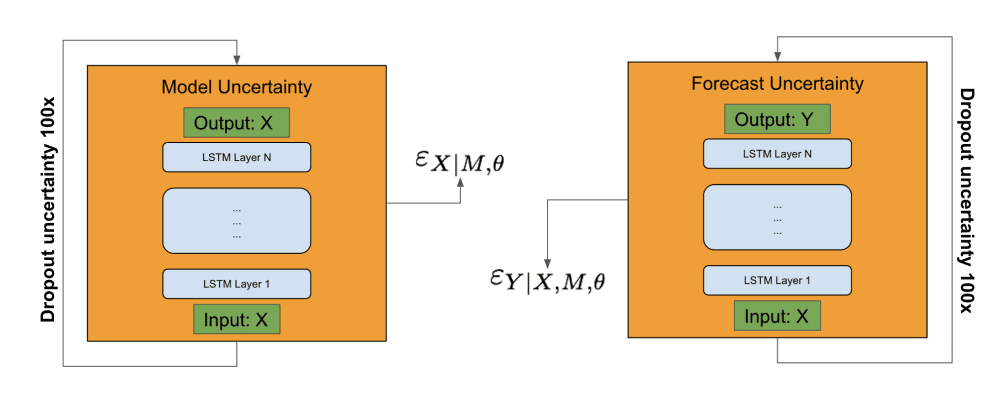
It involved estimating model uncertainty and forecast uncertainty separately, using the autoencoder and the forecast model respectively. Inputs were provided to a given model and dropout of the activations (as commented in the slides) was used. This process was repeated 100 times, and the model and forecast error terms were used in an estimate of the forecast uncertainty.
Overview of Forecast Uncertainty Estimation Taken from “Time-series Extreme Event Forecasting with Neural Networks at Uber.”
The model was evaluated with a special focus on demand forecasting for U.S. holidays by U.S. city.
The specifics of the model evaluation were not specified.
The new generalized LSTM forecast model was found to outperform the existing model used at Uber, which may be impressive if we assume that the existing model was well tuned.
The results presented show a 2%-18% forecast accuracy improvement compared to the current proprietary method comprising a univariate timeseries and machine learned model.
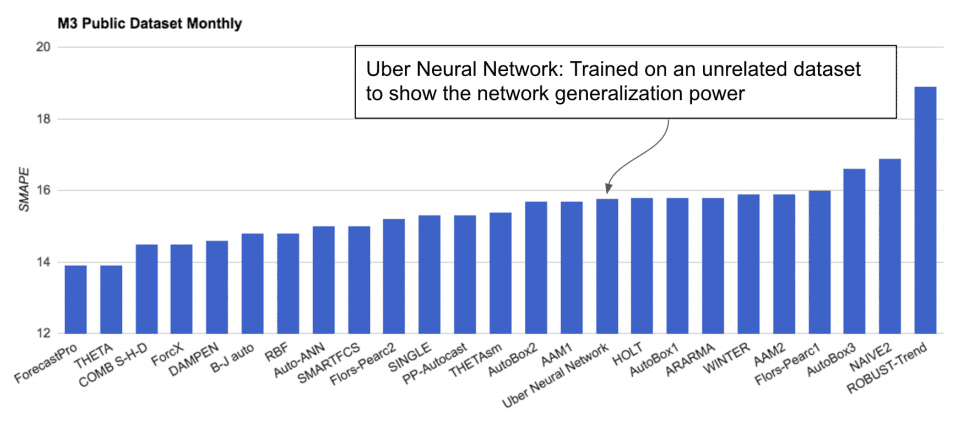
The model trained on the Uber dataset was then applied directly to a subset of the M3-Competition dataset comprised of about 1,500 monthly univariate time series forecasting datasets.
This is a type of transfer learning, a highly-desirable goal that allows the reuse of deep learning models across problem domains.
Surprisingly, the model performed well, not great compared to the top performing methods, but better than many sophisticated models. The result is suggests that perhaps with fine tuning (e.g. as is done in other transfer learning case studies) the model could be reused and be skillful.
Performance of LSTM Model Trained on Uber Data and Evaluated on the M3 Datasets Taken from “Time-series Extreme Event Forecasting with Neural Networks at Uber.”
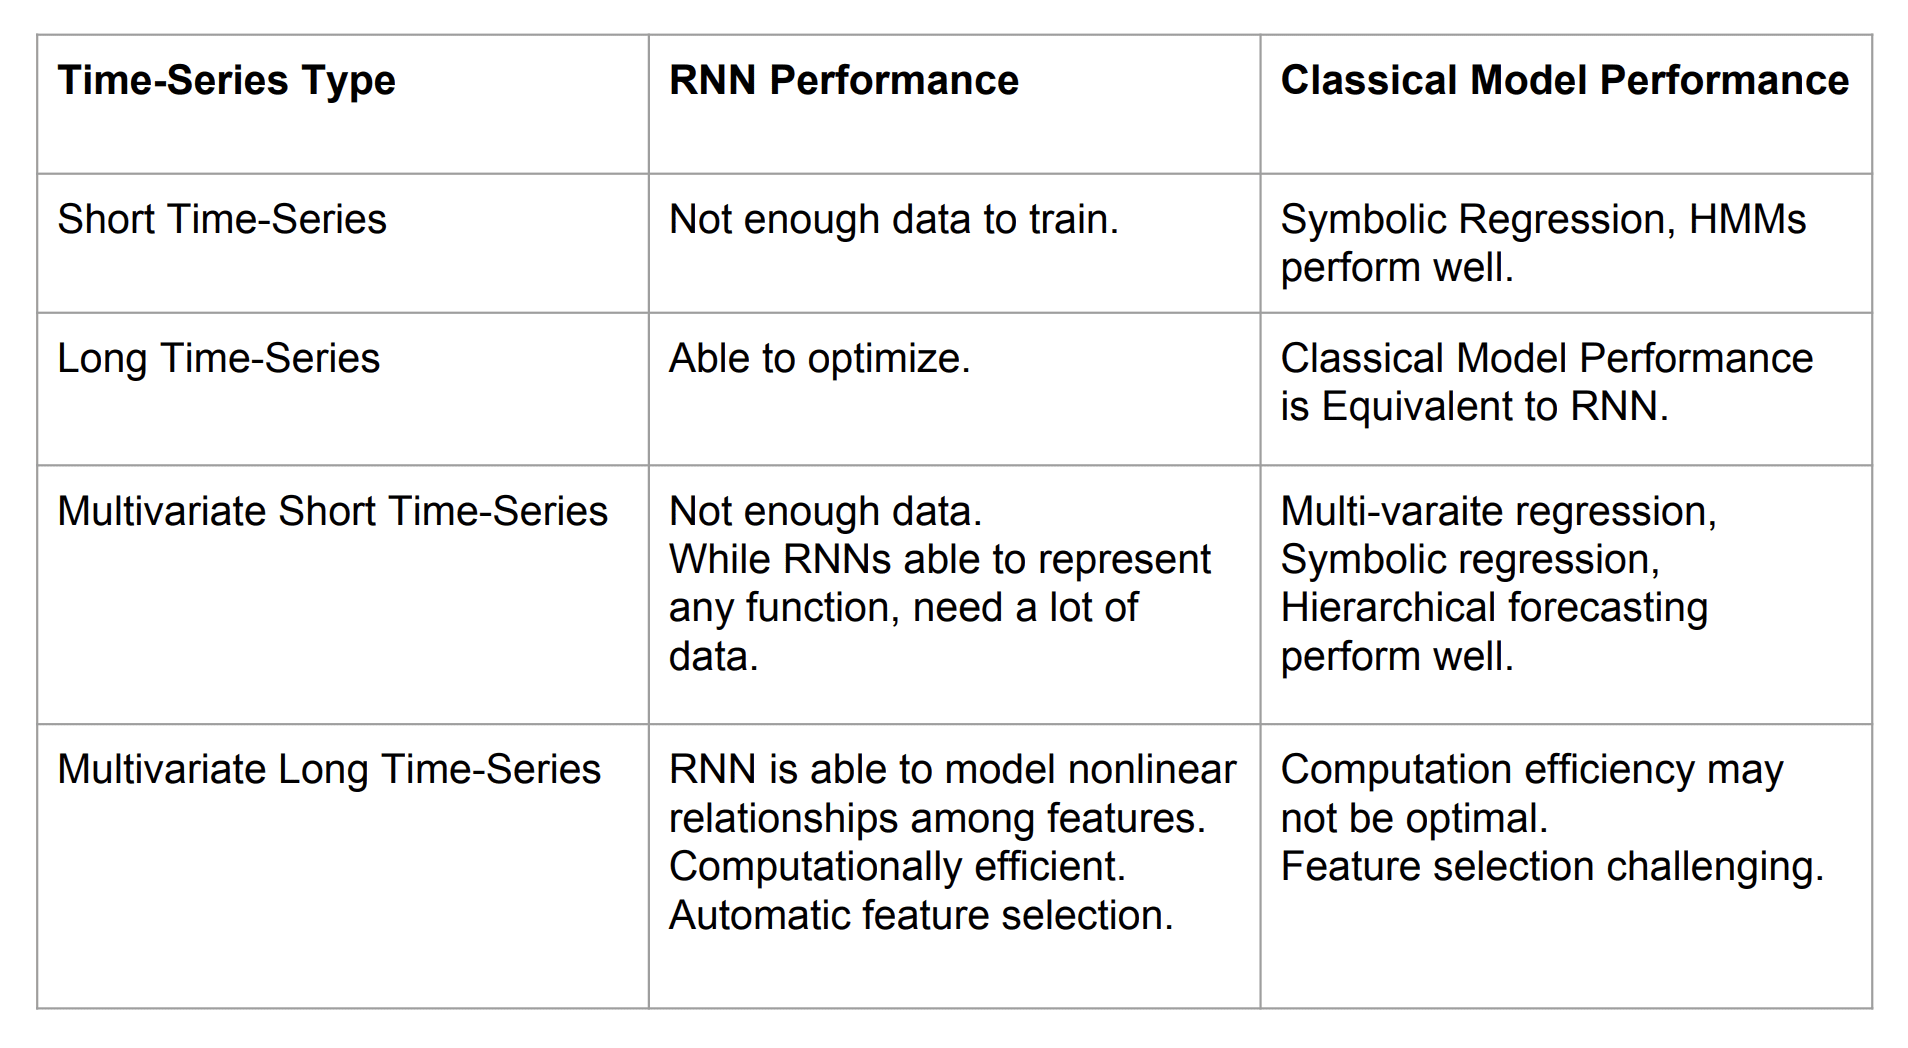
Importantly, the authors suggest that perhaps the most beneficial application of deep LSTM models to time series forecasting are situations where:
There are a large number of time series.
There are a large number of observations for each series.
There is a strong correlation between time series.
From our experience there are three criteria for picking a neural network model for time-series: (a) number of timeseries (b) length of time-series and (c) correlation among the time-series. If (a), (b) and (c) are high then the neural network might be the right choice, otherwise classical timeseries approach may work best.
In this post, you discovered a scalable end-to-end LSTM model for time series forecasting.
Specifically, you learned:
The challenge of multivariate, multi-step forecasting across multiple sites, in this case cities.
An LSTM model architecture for time series forecasting comprised of separate autoencoder and forecasting sub-models.
The skill of the proposed LSTM architecture at rare event demand forecasting and the ability to reuse the trained model on unrelated forecasting problems.
Do you have any questions?
Ask your questions in the comments below and I will do my best to answer.
Develop Deep Learning models for Time Series Today!
Is there a way to identify and remove outliers from data sets without affecting rare events?
Or how not to mistakenly have outliers as rare events ?
Thanks
Outliers usually are anomalies which are abnormal ie. outside a normal distribution. Something like mean+/-2*std. in a time series outliers are sparks, with much higher freq than the normal signal even with rare events.
For instance a Black Friday is rare event but fits in the normal frequency whereas an outlier is much higher frequency.
So how can I bring the frequency part in the equation?
Thanks
“Higher frequency” means more often. I think you mean that true outliers have a much *lower* frequency. But even that isn’t necessarily accurate. I’ve seen web traffic time series that have occasional spikes that correspond to no known event, occurring in some cases more commonly than the few known special events.
Thanks for this article. I’m trying to implement this paper using the Tensorflow low-level api.
Can you explain more about the confident interval computation, please.
I mean one you got the uncertainty error and the irreducible error, how can you get the interval through MC Dropout
very well explained, as always! a lot of your other articles contain code that help us understand the concepts better. I’m sure you’re very busy, but it’d be great if you could add code to this post, or point me to some articles/repos that have some code related to this post. Thanks,
I Master Degree student and I got interested in aply this approach in climate data series. I my research I have an adiction challenge (dimesions) the are latitude and longitude of an extrem or rare event.
So, as an example, I’m interested in predict an extreme rain (> 50mm in 24h) for a selected area (0.75 resolution): latitude from-18.75 to -20.25 and longitude from 315.0 to 316.5., It’s a grid 3 x 3 = 9 grids.
The rain (total precipitation in mm) doesn’t have a gaussian distribution, so, there are a lot of 00mm days, and the time series of rain are not a continuos sequence.
In your experience, this “Ubber” approach can fit despite of distribution problem? I have some doubts about the approach, like how this “LSTM Autoencoder for Feature Extraction” works. Do you expected do code a complete example like this “Uber” approach?
Thank you for the answer Jason! You need not be sorry 🙂 Do you have any example code or could you suggest me some methods with which I can visualize the feature vectors?
Hi Jason, thank you for the post. Please! what is the difference between Monte Carlo dropout and normal dropout? Do you have a link to any tutorial that shows how to add Monte Carlo dropout to the LSTM model implementation?
It is a stochastic dropout used as Bayesian approximation for model uncertainty estimation. It is equivalent to performing T stochastic forward passes through the Neural Network and averaging the result. It can also be approximated by averaging the weights of the NN (i.e.multiplying each weight by a probability p at test time). MC dropout s used for model uncertainty estimation in the paper you elaborated and the one you provided as reference (“Deep and Confident Prediction for Time Series at Uber”) in this post.
Good job. But I must say that I’m sick of reading this incomplete paper. “new input” is something not specified clearly in any part of the paper. They publish a paper and they hide some details or made them obscure. What’s the point?
If you are transforming new input data from different series then avg + concatenate to prior to making a new prediction then why do they add another new input? Is this new input the same input as the one prior to transformation by the encoder? I still do not understand this.
How many time series are sufficient enough for these network training? (Author suggest that more number of time series needed for these type of network to succeed, but how many?)
Can you please give some number to have rough idea?
Thanks for very insightful post!
So each individual event in the trace has its unique duration and volume (y-value). An overlapped event will look like a block of stacked rectangular events. Any suggestions ? Thanks
I wanted to make a prediction of a t+1 every 15 minutes, (in real time: Run forever).
will be better to look for a good model, then I predict the next step (off line), Or, at each prediction I update my model with the new prediction (on line)?
I have to perform Anomaly detection and I only have a univariate Time series data (~1 year).
Does it make sense to create lagged and derived features from the same time series (such as mean, min, max, sd, deviation etc. for different windows) and train a LSTM autoencoder model on it?
The idea is that if I score/predict the new data point using the lagged and derived features and the reconstruction error is > threshold then it’s an anomaly.Do you recommend this approach?
Hmmm, there is no real right and wrong, there are only models that work and ones that do not.
You’re idea is complex, but perhaps it will work – give it a shot. The great thing about these libraries is that testing ideas is very fast – like just a few minutes.
I’m working on a problem where I have a daily time series with a set of ~100 features associated for every day. There is also an 0/1 event associated with each day. There are days missing in the data. I want to predict, based on the future features whether or not the event will occur on that day. I’m not really getting how can I do it?
Thanks for the prompt reply. I’m not getting what might be a good approach to start with? Should I frame it as a simple classification problem or a time series approach
Is univariate LSTM RNN capable of giving good results with 1200 observation of daily sales data with 20 percent of observations have sales happened and other 80 percent don’t have any sales happened so taken as zero. The sales data is in the form of daily number of units sold.
I am trying with this model. Is there any other time series model you can suggest me for this kind of problem where there is daily sales but happened for few days only . An accuracy of 60 Percent as a start will be good .
I have divided the problem in two parts
1. When is the sales happened and
2. How much is the sales happened .
for the1. part I have given 0 flag to the day where sales didn’t happened and 1 where sales happened irrespective of how much .
Is univariate LSTM helpful in pattern recognization of 0 and 1…? after that I will go for 2 part . i.e. how much …If you have any other technique let me know ..
Regards
Bandeep
Thanks for this, and the many other useful articles that you publish.
In the Uber study, did your network identify spikes and dips NOT associated with events known beforehand: public holidays?
I am working towards a network that identifies rare events (demand spikes) before they occur. I have demand spikes that just seem to appear out of the blue.
I have a simple neural network that predicts when an order is coming in, but predicting whether the next order is a spike has resisted analysis thus far. A runs test shows that order size is not random and intuition after many years in the business tells me there’s a model out there somewhere.
As luck would have it, a vanilla LSTM network gave astonishingly good results on my data: really exciting. I’m guessing that, if I can do it, an expert can do it even better.
Accordingly, I think the guys working for Uber would have forecast random demand spikes not related to holidays. Perhaps it’s so obvious, they didn’t feel the need to mention it.
As with them, the uncertainty on the actual level of demand shows up in my model. It’s a less urgent issue for me but further improvement gives me a chance to upgrade my skills.


Hi,
Is there a way to identify and remove outliers from data sets without affecting rare events?
Or how not to mistakenly have outliers as rare events ?
Thanks
Vali
You must carefully define what you mean by “outlier” and “rare event” so that the methods that detect the former don’t detect the latter.
Outliers usually are anomalies which are abnormal ie. outside a normal distribution. Something like mean+/-2*std. in a time series outliers are sparks, with much higher freq than the normal signal even with rare events.
For instance a Black Friday is rare event but fits in the normal frequency whereas an outlier is much higher frequency.
So how can I bring the frequency part in the equation?
Thanks
Good question, I don’t have material on this topic so I can’t give you good off the cuff advice.
I may cover the topic in the future.
“Higher frequency” means more often. I think you mean that true outliers have a much *lower* frequency. But even that isn’t necessarily accurate. I’ve seen web traffic time series that have occasional spikes that correspond to no known event, occurring in some cases more commonly than the few known special events.
Thanks for the post. Do you know where an implementation for this algorithm can be found?
Not at this stage. Although this might help as a start:
https://machinelearningmastery.com/lstm-autoencoders/
I don’t understood this paper as it includes terms like time series multivariate lstm recurrent model
Perhaps start with something simpler, for example:
https://machinelearningmastery.com/how-to-develop-lstm-models-for-time-series-forecasting/
Hi,
Thanks for this article. I’m trying to implement this paper using the Tensorflow low-level api.
Can you explain more about the confident interval computation, please.
I mean one you got the uncertainty error and the irreducible error, how can you get the interval through MC Dropout
Thank a lot
Perhaps check the paper or contact the author of the paper, it has been months since I read the paper.
very well explained, as always! a lot of your other articles contain code that help us understand the concepts better. I’m sure you’re very busy, but it’d be great if you could add code to this post, or point me to some articles/repos that have some code related to this post. Thanks,
Thanks, you can learn more about LSTMs here:
https://machinelearningmastery.com/start-here/#lstm
I would like that too!
Hi Jason,
I Master Degree student and I got interested in aply this approach in climate data series. I my research I have an adiction challenge (dimesions) the are latitude and longitude of an extrem or rare event.
I created a time series downloading 10 years of ERA Interim, Daily: Pressure and sufarce data form ECMWF (https://apps.ecmwf.int/datasets/data/interim-full-daily/levtype=sfc/).
So, as an example, I’m interested in predict an extreme rain (> 50mm in 24h) for a selected area (0.75 resolution): latitude from-18.75 to -20.25 and longitude from 315.0 to 316.5., It’s a grid 3 x 3 = 9 grids.
The rain (total precipitation in mm) doesn’t have a gaussian distribution, so, there are a lot of 00mm days, and the time series of rain are not a continuos sequence.
In your experience, this “Ubber” approach can fit despite of distribution problem? I have some doubts about the approach, like how this “LSTM Autoencoder for Feature Extraction” works. Do you expected do code a complete example like this “Uber” approach?
I don’t know how this approach will fair with your data, perhaps try it and see?
Hi Jason,
Thank you for the explanation of this paper.
I have one question and maybe you could help me with that. The LSTM Autoencoder that I created looks like this —
inputs = Input(shape=(n_steps, input_dim))
encoder1 = CuDNNLSTM(128, return_sequences = True)(inputs)
encoder2 = CuDNNLSTM(64, return_sequences = True)(encoder1)
encoder3 = CuDNNLSTM(32)(encoder2)
repeat = RepeatVector(10)(encoder3)
decoder1 = CuDNNLSTM(32, return_sequences=True)(repeat)
decoder2 = CuDNNLSTM(64, return_sequences=True)(decoder1)
decoder3 = CuDNNLSTM(128, return_sequences=True)(decoder2)
dense1 = TimeDistributed(Dense(100, activation=’relu’))(decoder3)
dense2 = TimeDistributed(Dense(1))(dense1)
sequence_autoencoder = Model(inputs, dense2)
encoder_model = Model(inputs, repeat)
Should we extract the feature from the “repeat” layer or the “encoder3” layer?
Could you please give me a hint for plotting/visualization of the extracted features please?
Thanks & Regards
Savan
I’m eager to help, but I don’t have the capacity to debug your code, sorry.
Thank you for the answer Jason! You need not be sorry 🙂 Do you have any example code or could you suggest me some methods with which I can visualize the feature vectors?
Thanks you 🙂
You can use a PCA to visualize high-dimensional vectors.
where to find the dataset for this paper of uber could you please send me
ansd how to implement this
All code and data is here:
https://github.com/M4Competition/M4-methods
please give me the implementation with results of this data set
please send me dataset for this paper . i need this desperately for my research work please help me
It was uber data and not released.
This is the closest we have:
https://github.com/M4Competition/M4-methods
please provie me any downloaded file of data and how to implement it
If you’re looking for datasets, perhaps start here:
https://machinelearningmastery.com/faq/single-faq/where-can-i-get-a-dataset-on-___
can you provide me thesis work related to this topic of rare events please help me.with implementation
I cannot, sorry.
Hi Jason, thank you for the post. Please! what is the difference between Monte Carlo dropout and normal dropout? Do you have a link to any tutorial that shows how to add Monte Carlo dropout to the LSTM model implementation?
Thank you!
What is monte carlo dropout?
It is a stochastic dropout used as Bayesian approximation for model uncertainty estimation. It is equivalent to performing T stochastic forward passes through the Neural Network and averaging the result. It can also be approximated by averaging the weights of the NN (i.e.multiplying each weight by a probability p at test time). MC dropout s used for model uncertainty estimation in the paper you elaborated and the one you provided as reference (“Deep and Confident Prediction for Time Series at Uber”) in this post.
Thanks!
Please! help me with any tutorial that shows how it can be implemented using the LSTM model
Thanks for the suggestion, I may be able to cover it in the future.
I made a post where I replicate these results. You can find the article here: https://towardsdatascience.com/extreme-event-forecasting-with-lstm-autoencoders-297492485037 (with Python Code)
Well done, thanks for sharing.
@Marco. In one of your post: https://towardsdatascience.com/anomaly-detection-with-lstm-in-keras-8d8d7e50ab1b you used quantile regression for anomaly detection. Is it possible to use quantile regression in the extreme event forecasting with lstm autoencoder to identify anomalies? If yes, how can I update it?
Good job. But I must say that I’m sick of reading this incomplete paper. “new input” is something not specified clearly in any part of the paper. They publish a paper and they hide some details or made them obscure. What’s the point?
Papers are always incomplete, they are just enough to give you a rough idea – which might be enough.
It’s a pain. And unless a paper has associated code it is almost fraud – they can make up anything.
Thankfully, most good papers have associated github project – this never used to be the case.
What is this ‘new input’? I am stuck here.
Perhaps this will help:
https://machinelearningmastery.com/make-predictions-long-short-term-memory-models-keras/
If you are transforming new input data from different series then avg + concatenate to prior to making a new prediction then why do they add another new input? Is this new input the same input as the one prior to transformation by the encoder? I still do not understand this.
What do you mean by another new input?
I’d recommend reading the paper, it may have more details and make the situation clearer.
How many time series are sufficient enough for these network training? (Author suggest that more number of time series needed for these type of network to succeed, but how many?)
Can you please give some number to have rough idea?
Thanks for very insightful post!
It really depends.
If you don’t have a lot of data, you can avoid overfitting with regularization:
https://machinelearningmastery.com/introduction-to-regularization-to-reduce-overfitting-and-improve-generalization-error/
Is there a way to separate overlapped events in a time series trace ?
I guess it depends on the data.
So each individual event in the trace has its unique duration and volume (y-value). An overlapped event will look like a block of stacked rectangular events. Any suggestions ? Thanks
Not off hand, some research may be required. Perhaps try some searches on scholar.google.com
Okay
Thanks 😀
I wanted to make a prediction of a t+1 every 15 minutes, (in real time: Run forever).
will be better to look for a good model, then I predict the next step (off line), Or, at each prediction I update my model with the new prediction (on line)?
Test a few approaches and see what works best for your specific dataset.
Hi Jason,
I have to perform Anomaly detection and I only have a univariate Time series data (~1 year).
Does it make sense to create lagged and derived features from the same time series (such as mean, min, max, sd, deviation etc. for different windows) and train a LSTM autoencoder model on it?
The idea is that if I score/predict the new data point using the lagged and derived features and the reconstruction error is > threshold then it’s an anomaly.Do you recommend this approach?
I recommend testing a suite of framings of the problem and models in order to discover what works best.
Hi Jason,
Thanks for your reply.
But it is not conceptually wrong if I create features that are essentially from 1 univariate time series and then use autoencoder right?
Just want to confirm my understanding.
Regards,
Emily
Hmmm, there is no real right and wrong, there are only models that work and ones that do not.
You’re idea is complex, but perhaps it will work – give it a shot. The great thing about these libraries is that testing ideas is very fast – like just a few minutes.
Thanks a lot!
Hi Jason,
I’m working on a problem where I have a daily time series with a set of ~100 features associated for every day. There is also an 0/1 event associated with each day. There are days missing in the data. I want to predict, based on the future features whether or not the event will occur on that day. I’m not really getting how can I do it?
Thanks a lot!
I recommend testing many different framings of the dataset and see what works.
Thanks for the prompt reply. I’m not getting what might be a good approach to start with? Should I frame it as a simple classification problem or a time series approach
Start simple, then go to complex.
Start with classification, e.g. prior days features as input todays label as output, or something. Perhaps explore feature selection on this.
Then start adding in more history to some/all features, for different prior intervals. Discover what results in skillful models on your data.
Play the scientist.
Hello Jason,
Is univariate LSTM RNN capable of giving good results with 1200 observation of daily sales data with 20 percent of observations have sales happened and other 80 percent don’t have any sales happened so taken as zero. The sales data is in the form of daily number of units sold.
I am trying with this model. Is there any other time series model you can suggest me for this kind of problem where there is daily sales but happened for few days only . An accuracy of 60 Percent as a start will be good .
I have divided the problem in two parts
1. When is the sales happened and
2. How much is the sales happened .
for the1. part I have given 0 flag to the day where sales didn’t happened and 1 where sales happened irrespective of how much .
Is univariate LSTM helpful in pattern recognization of 0 and 1…? after that I will go for 2 part . i.e. how much …If you have any other technique let me know ..
Regards
Bandeep
Perhaps test the model on your data and evaluate the result?
I would strongly encourage you to test other models as LSTMs are generally terrible at univariate time series forecasting.
Thanks for this, and the many other useful articles that you publish.
In the Uber study, did your network identify spikes and dips NOT associated with events known beforehand: public holidays?
I am working towards a network that identifies rare events (demand spikes) before they occur. I have demand spikes that just seem to appear out of the blue.
I have a simple neural network that predicts when an order is coming in, but predicting whether the next order is a spike has resisted analysis thus far. A runs test shows that order size is not random and intuition after many years in the business tells me there’s a model out there somewhere.
I believe they were anticipated, but I’m not confident on that guess. Perhaps double check the paper?
As luck would have it, a vanilla LSTM network gave astonishingly good results on my data: really exciting. I’m guessing that, if I can do it, an expert can do it even better.
Accordingly, I think the guys working for Uber would have forecast random demand spikes not related to holidays. Perhaps it’s so obvious, they didn’t feel the need to mention it.
As with them, the uncertainty on the actual level of demand shows up in my model. It’s a less urgent issue for me but further improvement gives me a chance to upgrade my skills.
Hi
my dataset is 11000*6
Is it possible that RNN accuracy to be equal or greater than LSTM?
If you know a source in this field, please let me know
thank you
LSTM is an RNN.
Perhaps test a suite of models on your dataset and discover what works best.
How much data points in daily time series data will be there to call it as a long time series data
It really depends.
Generally an LSTM is limited to 200-400 time steps per sample.