Machine learning models are chosen based on their mean performance, often calculated using k-fold cross-validation.
The algorithm with the best mean performance is expected to be better than those algorithms with worse mean performance. But what if the difference in the mean performance is caused by a statistical fluke?
The solution is to use a statistical hypothesis test to evaluate whether the difference in the mean performance between any two algorithms is real or not.
In this tutorial, you will discover how to use statistical hypothesis tests for comparing machine learning algorithms.
After completing this tutorial, you will know:
Performing model selection based on the mean model performance can be misleading.
The five repeats of two-fold cross-validation with a modified Student’s t-Test is a good practice for comparing machine learning algorithms.
How to use the MLxtend machine learning to compare algorithms using a statistical hypothesis test.
Kick-start your project with my new book Statistics for Machine Learning, including step-by-step tutorials and the Python source code files for all examples.
Let’s get started.
Hypothesis Test for Comparing Machine Learning Algorithms Photo by Frank Shepherd, some rights reserved.
Tutorial Overview
This tutorial is divided into three parts; they are:
Hypothesis Test for Comparing Algorithms
5×2 Procedure With MLxtend
Comparing Classifier Algorithms
Hypothesis Test for Comparing Algorithms
Model selection involves evaluating a suite of different machine learning algorithms or modeling pipelines and comparing them based on their performance.
The model or modeling pipeline that achieves the best performance according to your performance metric is then selected as your final model that you can then use to start making predictions on new data.
This applies to regression and classification predictive modeling tasks with classical machine learning algorithms and deep learning. It’s always the same process.
The problem is, how do you know the difference between two models is real and not just a statistical fluke?
One approach is to evaluate each model on the same k-fold cross-validation split of the data (e.g. using the same random number seed to split the data in each case) and calculate a score for each split. This would give a sample of 10 scores for 10-fold cross-validation. The scores can then be compared using a paired statistical hypothesis test because the same treatment (rows of data) was used for each algorithm to come up with each score. The Paired Student’s t-Test could be used.
A problem with using the Paired Student’s t-Test, in this case, is that each evaluation of the model is not independent. This is because the same rows of data are used to train the data multiple times — actually, each time, except for the time a row of data is used in the hold-out test fold. This lack of independence in the evaluation means that the Paired Student’s t-Test is optimistically biased.
This statistical test can be adjusted to take the lack of independence into account. Additionally, the number of folds and repeats of the procedure can be configured to achieve a good sampling of model performance that generalizes well to a wide range of problems and algorithms. Specifically two-fold cross-validation with five repeats, so-called 5×2-fold cross-validation.
First, you must install the mlxtend library, for example:
1
sudo pip install mlxtend
To use the evaluation, you must first load your dataset, then define the two models that you wish to compare.
1
2
3
4
5
6
...
# load data
X,y=....
# define models
model1=...
model2=...
You can then call the paired_ttest_5x2cv() function and pass in your data and models and it will report the t-statistic value and the p-value as to whether the difference in the performance of the two algorithms is significant or not.
The p-value must be interpreted using an alpha value, which is the significance level that you are willing to accept.
If the p-value is less or equal to the chosen alpha, we reject the null hypothesis that the models have the same mean performance, which means the difference is probably real. If the p-value is greater than alpha, we fail to reject the null hypothesis that the models have the same mean performance and any observed difference in the mean accuracies is probability a statistical fluke.
The smaller the alpha value, the better, and a common value is 5 percent (0.05).
1
2
3
4
5
6
...
# interpret the result
ifp<=0.05:
print('Difference between mean performance is probably real')
else:
print('Algorithms probably have the same performance')
Now that we are familiar with the way to use a hypothesis test to compare algorithms, let’s look at some examples.
Comparing Classifier Algorithms
In this section, let’s compare the performance of two machine learning algorithms on a binary classification task, then check if the observed difference is statistically significant or not.
First, we can use the make_classification() function to create a synthetic dataset with 1,000 samples and 20 input variables.
The example below creates the dataset and summarizes its shape.
The procedure I like is to use repeated stratified k-fold cross-validation with 10 folds and three repeats. We will use this procedure to evaluate each algorithm and return and report the mean classification accuracy.
The complete example is listed below.
1
2
3
4
5
6
7
8
9
10
11
12
13
14
15
16
17
18
19
20
21
22
23
24
# compare logistic regression and lda for binary classification
from numpy import mean
from numpy import std
from sklearn.datasets import make_classification
from sklearn.model_selection import cross_val_score
from sklearn.model_selection import RepeatedStratifiedKFold
from sklearn.linear_model import LogisticRegression
from sklearn.discriminant_analysis import LinearDiscriminantAnalysis
Running the example first reports the mean classification accuracy for each algorithm.
Note: Your results may vary given the stochastic nature of the algorithm or evaluation procedure, or differences in numerical precision. Consider running the example a few times and compare the average outcome.
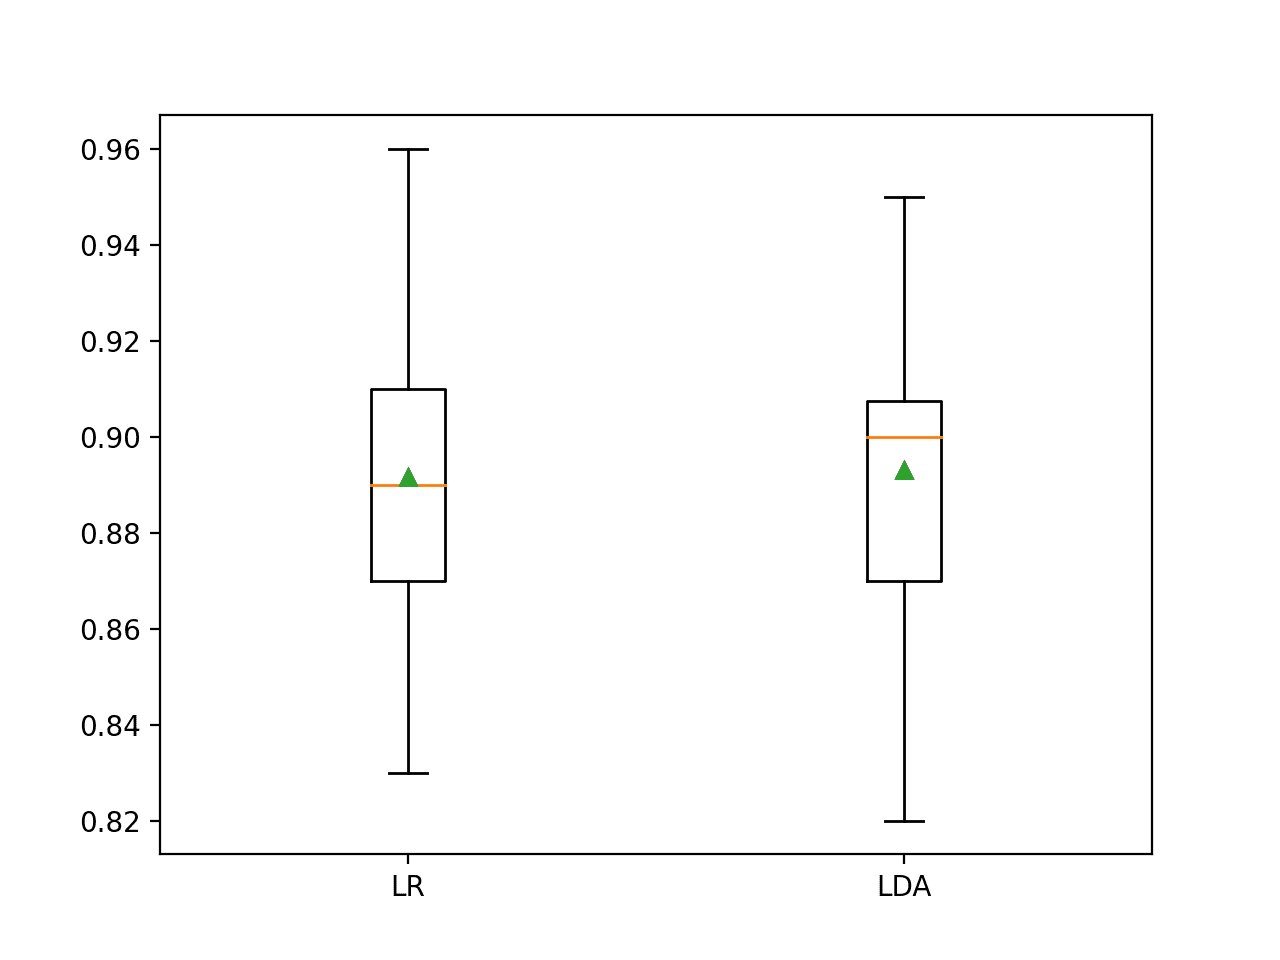
In this case, the results suggest that LDA has better performance if we just look at the mean scores: 89.2 percent for logistic regression and 89.3 percent for LDA.
1
2
LogisticRegression Mean Accuracy: 0.892 (0.036)
LinearDiscriminantAnalysis Mean Accuracy: 0.893 (0.033)
A box and whisker plot is also created summarizing the distribution of accuracy scores.
This plot would support my decision in choosing LDA over LR.
Box and Whisker Plot of Classification Accuracy Scores for Two Algorithms
Now we can use a hypothesis test to see if the observed results are statistically significant.
First, we will use the 5×2 procedure to evaluate the algorithms and calculate a p-value and test statistic value.
print('Difference between mean performance is probably real')
else:
print('Algorithms probably have the same performance')
Running the example, we first evaluate the algorithms before, then report on the result of the statistical hypothesis test.
Note: Your results may vary given the stochastic nature of the algorithm or evaluation procedure, or differences in numerical precision. Consider running the example a few times and compare the average outcome.
In this case, we can see that the p-value is about 0.3, which is much larger than 0.05. This leads us to fail to reject the null hypothesis, suggesting that any observed difference between the algorithms is probably not real.
We could just as easily choose logistic regression or LDA and both would perform about the same on average.
This highlights that performing model selection based only on the mean performance may not be sufficient.
1
2
3
4
LogisticRegression Mean Accuracy: 0.892 (0.036)
LinearDiscriminantAnalysis Mean Accuracy: 0.893 (0.033)
P-value: 0.328, t-Statistic: 1.085
Algorithms probably have the same performance
Recall that we are reporting performance using a different procedure (3×10 CV) than the procedure used to estimate the performance in the statistical test (5×2 CV). Perhaps results would be different if we looked at scores using five repeats of two-fold cross-validation?
The example below is updated to report classification accuracy for each algorithm using 5×2 CV.
1
2
3
4
5
6
7
8
9
10
11
12
13
14
15
16
17
18
19
20
21
22
23
24
25
26
27
28
29
30
# use 5x2 statistical hypothesis testing procedure to compare two machine learning algorithms
from numpy import mean
from numpy import std
from sklearn.datasets import make_classification
from sklearn.model_selection import cross_val_score
from sklearn.model_selection import RepeatedStratifiedKFold
from sklearn.linear_model import LogisticRegression
from sklearn.discriminant_analysis import LinearDiscriminantAnalysis
print('Difference between mean performance is probably real')
else:
print('Algorithms probably have the same performance')
Running the example reports the mean accuracy for both algorithms and the results of the statistical test.
Note: Your results may vary given the stochastic nature of the algorithm or evaluation procedure, or differences in numerical precision. Consider running the example a few times and compare the average outcome.
In this case, we can see that the difference in the mean performance for the two algorithms is even larger, 89.4 percent vs. 89.0 percent in favor of logistic regression instead of LDA as we saw with 3×10 CV.
1
2
3
4
LogisticRegression Mean Accuracy: 0.894 (0.012)
LinearDiscriminantAnalysis Mean Accuracy: 0.890 (0.013)
P-value: 0.328, t-Statistic: 1.085
Algorithms probably have the same performance
Further Reading
This section provides more resources on the topic if you are looking to go deeper.
Really it was good….for those who have not proper knowledge can easily understand. I m Associate professor in Statistics in one of the reputed Science college.
Dear Dr Jason,
apologies, I forgot to consider the comparison of SVC and KNeighborsClassifier with average values of 0.952 and 0.942 respectively and significant with p-value of 0.028.
Further conclusion:
Though there was little difference in accuracy between SVC and KNeighborsClassifier, it appears for the particular dataset consisting of X and y, SVC is likely to be the most suitable method for accuracy.
So if one is to made predictions for a given dataset X, y , SVC is likely to be model of choice.
Dear Dr Jason,
Thank you for your reply.
When you say that a “…good way to present pair wise hypothesis testing in a matrix…” could you elaborate please. Do you mean pair-wise boxplots, with a scatter matrix pairs?
Is there a scatter_matrix that enables one to switch from a scatter plot to a pairwise comparison of boxplots?
Dear Dr Jason,
The table above used the package prettytable.
Unfortunately you cannot add a header using prettytable package.
If you want to add a header like the table below:
Dear Dr Jason,
From my enhancements to your tutorial on comparing the scores of models, I have shown how one can make a table of the significant relationships between one model versus another model.
This tutorial showed the boxplots of the scores when comparing models.
Without showing the code in its entirety, I go to the essentials of plotting data of boxplots using matplotlib, matplotlib and seaborn which uses matplotlib. Note I did not accidentally write matplotlib twice. There are two methods.
I will relate this to the tutorial.
It is assumed that the packages have been declared at the top of the program.
This is presented as a ‘conceptual’ method but without the accoutrements
First matplotlib where subplots is instantiated with number of rows and number of columns
1
2
3
4
5
6
7
8
9
10
11
12
13
14
15
16
17
18
19
#This is matplotlib using rows and cols method
fig,ax=pyplot.subplots(vert,horiz)
fig.suptitle("Pairwise comparison of scores for models",fontsize=14,fontweight='bold')
fig.tight_layout()
index_limit=len(data from an arraycontaining model1 andmodel2)
counter=0;#Use this to access an array containing model1 and model2 data. and other arrays such as whether the relationship between the two models is sig or not sig
foriinrange(vert):
forjinrange(horiz):
............
............
model1_scores=data from an arraycontaining model1 andmodel2[counter];#conceptual
model2_scores=data from an arraycontaining model1 andmodel2[counter];#conceptual
ax[i,j+1].set_axis_off();#ensure that you don't have an empty graph
break
This uses matplotlib : compare the difference between instantiation of subplots in this and the previous example
1
2
3
4
5
6
7
8
9
10
11
12
13
fig=pyplot.figure()
fig.subplots_adjust(hspace=0.7,wspace=0.3)
fig.tight_layout()
fig.suptitle("Pairwise comparison of scores for models",fontsize=14,fontweight='bold')
counter=0;#Use this to access an array containing model1 and model2 data. and other arrays such as whether the relationship between the two models is sig or not sig
foritem indata from an arraycontaining model1 andmodel2:
counter+=1;#the counter in this instance may be used to get other arrays associated with model1 and model2
This example uses seaborn and matplotlib.
A boxplot in seaborn requires (i) a DataFrame, and (ii) restructing the two variables model1 and model2 into one array The boxplot in seaborn does IS NOT
1
2
3
4
5
import seaborn assns
#This shows difference between matplotlib's boxplot using variables model1 and model2
pyplot.boxplot([model1,model2],showmeans=True)
#This won't display properly - you'll get len(model1) boxplots!
sns.boxplot([model1,model2],showmeans=True)
What is required in seaborn’s boxplot is to have two variables, the categorical variable identifying model1 and model2, and another array consisting of the stacking of model1 and models’ values.
The generation of the separate categorical and values arrays are performed automatically using pandas’ melt and DataFrame function.
1
2
3
4
5
6
7
8
9
10
11
12
13
14
15
16
17
18
19
20
21
22
23
24
25
26
27
28
29
30
31
32
33
34
35
36
37
38
39
40
import seaborn assns
from pandas import DataFrame
from pandas import melt
#This is matplotlib using rows and cols method
fig,ax=pyplot.subplots(vert,horiz)
fig.suptitle("Pairwise comparison of scores for models",fontsize=14,fontweight='bold')
fig.tight_layout()
index_limit=len(data from an arraycontaining model1 andmodel2)
counter=0;#Use this to access an array containing model1 and model2 data.
foriinrange(vert):
forjinrange(horiz):
............
............
model1_scores=data from an arraycontaining model1 andmodel2[counter];#conceptual
model2_scores=data from an arraycontaining model1 andmodel2[counter];#conceptual
ax[i,j+1].set_axis_off();#ensure that you don't have an empty graph
break
A bonus.
You can use a DataFrame in conjunction with the melt method to generate an array of categorical variable associated with the other ‘array’ of data.
The categorical variable’s is derived when intializing the DataFrame.
Hi Jason,
This is a very interesting post which will help me with my PhD work a lot so thank you.
I am just wondering what your advice would be if you wanted to test multiple machine learning algorithms on multiple data sets.
I was thinking I could test each data set using cross-validation and then get a table of results for each machine learning algorithm to conduct a hypothesis test. An example below shows a table presenting the standardised RMSE for various machine learning algorithms:
So in this case. Would there be a recommended hypothesis test to compare the regression techniques? Any literature you would recommend to investigate this further? And what are your thoughts on this sort of analysis?
My issue is that most of the literature I am finding is comparing two machine learning techniques as the best for just one dataset. Whereas I am wanting to find an overall better technique for numerous datasets.
Hi Aaron, I hope you’ll find your answer till now, however I would share a really great Book that essentially is in the depth of this field, that is : Evaluating Learning Algorithms A Classification Perspective By “NATHALIE JAPKOWICZ, University of Ottawa” and “MOHAK SHAH, McGill University”.
I hope this reference help you and others out with these problems.
Thanks for the article! It is indeed very helpful!
May I ask what method would you suggest when using large datasets? Cross-validation would be very time-consuming, so maybe there is something else out there that I could consider?
Is there a recommended test when the model has been trained k (let’s say 5) times on the same train/test split (it is a benchmark). So not exactly cross validation (no variability in the data split) but multiple runs due to the model own stoochasticity.
Hello Jason. Just 1 quick question. Why do you define cv and cv2? Doesn’t this mean that the 2 models will be trained and evaluated in different splits of data? Would it be wrong if you just used 1 cv?
Hello Jason, Thank you for your great post. I have a question for comparing two deep learning models such as u-net and attention u-net. Is it possible to fix the dataset (add 10% of data for test and the rest for training), and train the two models using a set of the same hyperparameters on the fix dataset. Then, using hypothesis testing on the obtained results?
Hi Carol…You are very welcome! Certainly your understanding is correct! You may also want to try the various models on new data and compare the root mean square error of each.


")


Thanks for the post!!
Another possible option would be the bayesian approach through BEST
https://best.readthedocs.io/en/latest/
Thanks for sharing!
Really it was good….for those who have not proper knowledge can easily understand. I m Associate professor in Statistics in one of the reputed Science college.
Thanks!
Dear Dr Jason,
I have extended the above accuracy with the models used at https://machinelearningmastery.com/calculate-the-bias-variance-trade-off/#comment-550512. That is I have made pairwise combinations of the models from that site and this site and produced the following results.
This contained statistically significant and not significant comparisons
The statistically significant models were:
Conclusion:
Out of the statistically significant models SVC had the highest accuracy of 0.952 compared to LDA of 0.894. The p-value is 0.003
Thank you,
Anthony of Sydney
Dear Dr Jason,
apologies, I forgot to consider the comparison of SVC and KNeighborsClassifier with average values of 0.952 and 0.942 respectively and significant with p-value of 0.028.
Further conclusion:
Though there was little difference in accuracy between SVC and KNeighborsClassifier, it appears for the particular dataset consisting of X and y, SVC is likely to be the most suitable method for accuracy.
So if one is to made predictions for a given dataset X, y , SVC is likely to be model of choice.
Thank you,
Anthony of Sydney
Nice, thanks for sharing.
Nice work!
A good way to present pair-wise hypothesis tests is in a matrix with algorithms along both axis and significant true/false in each cell of the matrix.
Dear Dr Jason,
Thank you for your reply.
When you say that a “…good way to present pair wise hypothesis testing in a matrix…” could you elaborate please. Do you mean pair-wise boxplots, with a scatter matrix pairs?
Is there a scatter_matrix that enables one to switch from a scatter plot to a pairwise comparison of boxplots?
Thank you,
Anthony of Sydney
No, not a plot, a matrix or table with true/false values indicating whether there is a significant difference between each pair of algorithms or not.
One can then review the actual mean values for each algorithm that has significant results and ignore the rest.
A list of pairs can also be used.
Dear Dr Jason,
Thank you for that.
Do you mean a table such as this:
Please advise.
Thank you,
Anthony of Sydney
I don’t think so. It was something I did way back in my phd days.
Dear Dr Jason,
Please widen the above ‘table’ it shows
Thank you,
Anthony of Sydney
Dear Dr Jason,
A modification to the program, produced this list:
Do you mean something like the above?
If so is there a way to display text in a nice way = the text aligns nicely.
Thank you,
Anthony of Sydney
Nice work!
Dear Dr Jason,
This is a text-graphic of the output using the package ‘prettyable’ from https://pypi.org/project/PrettyTable/
Some code to demonstrate implementation:
Output – expand the width of the page by hovering your mouse over the top of this output to view complete viewing.
Thank you,
Anthony of Sydney
Very cool.
Weka does this too I think and adds a * to the mean that is larger – to make the table easier to scan.
Dear Dr Jason,
The above was an ascii text table. The following two are graphical implementations using plotly and matplotlib
Thank you,
Anthony of Sydney
Nice!
Dear Dr Jason,
You mentioned “….Weka does this too I think and adds a * to the mean that is larger – to make the table easier to scan.>
I spent an extra two minutes to modify the code in python.
Here is the result:
Thank you,
Anthony of Sydney
This is really great stuff Anthony!
Dear Dr Jason,
The table above used the package prettytable.
Unfortunately you cannot add a header using prettytable package.
If you want to add a header like the table below:
Use the pytable package. First you uninstall prettytable then install pytable.
In your python program you import the ptable package as importing prettytable.
In this example, you add another line
Here is the code:
Thank you,
Anthony of Sydney
Nice work.
Dear Dr Jason,
From my enhancements to your tutorial on comparing the scores of models, I have shown how one can make a table of the significant relationships between one model versus another model.
This tutorial showed the boxplots of the scores when comparing models.
Without showing the code in its entirety, I go to the essentials of plotting data of boxplots using matplotlib, matplotlib and seaborn which uses matplotlib. Note I did not accidentally write matplotlib twice. There are two methods.
I will relate this to the tutorial.
It is assumed that the packages have been declared at the top of the program.
This is presented as a ‘conceptual’ method but without the accoutrements
First matplotlib where subplots is instantiated with number of rows and number of columns
This uses matplotlib : compare the difference between instantiation of subplots in this and the previous example
This example uses seaborn and matplotlib.
A boxplot in seaborn requires (i) a DataFrame, and (ii) restructing the two variables model1 and model2 into one array The boxplot in seaborn does IS NOT
What is required in seaborn’s boxplot is to have two variables, the categorical variable identifying model1 and model2, and another array consisting of the stacking of model1 and models’ values.
The generation of the separate categorical and values arrays are performed automatically using pandas’ melt and DataFrame function.
A bonus.
You can use a DataFrame in conjunction with the melt method to generate an array of categorical variable associated with the other ‘array’ of data.
The categorical variable’s is derived when intializing the DataFrame.
Thank you,
Anthony of Sydney
Nice work, thanks for sharing!
Hi Jason,
This is a very interesting post which will help me with my PhD work a lot so thank you.
I am just wondering what your advice would be if you wanted to test multiple machine learning algorithms on multiple data sets.
I was thinking I could test each data set using cross-validation and then get a table of results for each machine learning algorithm to conduct a hypothesis test. An example below shows a table presenting the standardised RMSE for various machine learning algorithms:
Dataset | GP1 | GP2 | ANN | Linear Regression
Ishigami | 0.21 | 0.16 | 0.19 | 0.32
Sobol | blah | blah | blah | blah
….
….
and so on.
So in this case. Would there be a recommended hypothesis test to compare the regression techniques? Any literature you would recommend to investigate this further? And what are your thoughts on this sort of analysis?
My issue is that most of the literature I am finding is comparing two machine learning techniques as the best for just one dataset. Whereas I am wanting to find an overall better technique for numerous datasets.
Thanks,
Aaron
Perhaps pair-wise tests between all cases.
Hi Aaron, I hope you’ll find your answer till now, however I would share a really great Book that essentially is in the depth of this field, that is : Evaluating Learning Algorithms A Classification Perspective By “NATHALIE JAPKOWICZ, University of Ottawa” and “MOHAK SHAH, McGill University”.
I hope this reference help you and others out with these problems.
Anyone has an idea how to calculate power of such a test? 🙂
Perhaps the references in this tutorial will help:
https://machinelearningmastery.com/statistical-power-and-power-analysis-in-python/
Hi Jason,
Thanks for the article! It is indeed very helpful!
May I ask what method would you suggest when using large datasets? Cross-validation would be very time-consuming, so maybe there is something else out there that I could consider?
Thanks,
Laura
For very large datasets, perhaps a train/test split and a mcnemars test:
https://machinelearningmastery.com/mcnemars-test-for-machine-learning/
Is there a recommended test when the model has been trained k (let’s say 5) times on the same train/test split (it is a benchmark). So not exactly cross validation (no variability in the data split) but multiple runs due to the model own stoochasticity.
when I make this test, should I do preprocessing the data before it, or not necessary
No need.
if i compare ML and DL classifiers, cross val score in DL how is wittren?
Perhaps you can use a standard test harness like cross-validation:
https://machinelearningmastery.com/repeated-k-fold-cross-validation-with-python/
Hi, I came across this paper and it seems to be very close to your article. I don’t know if it was plagiarised but wanted to bring it to your notice.
https://www.spu.edu.iq/kjar/index.php/kjar/article/view/630/333
Thank you for the feedback, Shruti!
Hello Jason. Just 1 quick question. Why do you define cv and cv2? Doesn’t this mean that the 2 models will be trained and evaluated in different splits of data? Would it be wrong if you just used 1 cv?
I only used 1 too
Hello Jason, Thank you for your great post. I have a question for comparing two deep learning models such as u-net and attention u-net. Is it possible to fix the dataset (add 10% of data for test and the rest for training), and train the two models using a set of the same hyperparameters on the fix dataset. Then, using hypothesis testing on the obtained results?
Hi Carol…You are very welcome! Certainly your understanding is correct! You may also want to try the various models on new data and compare the root mean square error of each.
https://machinelearningmastery.com/regression-metrics-for-machine-learning/
Other ideas are presented here:
https://machinelearningmastery.com/evaluate-performance-deep-learning-models-keras/