It is difficult to find a good machine learning algorithm for your problem. But once you do, how do you get the best performance out of it.
In this post you will discover three ways that you can tune the parameters of a machine learning algorithm in R.
Walk through a real example step-by-step with working code in R. Use the code as a template to tune machine learning algorithms on your current or next machine learning project.
Kick-start your project with my new book Machine Learning Mastery With R, including step-by-step tutorials and the R source code files for all examples.
Let’s get started.
Tune Random Forest in R. Photo by Susanne Nilsson, some rights reserved.
Get Better Accuracy From Top Algorithms
It is difficult to find a good or even a well-performing machine learning algorithm for your dataset.
Through a process of trial and error you can settle on a short list of algorithms that show promise, but how do you know which is the best.
You could use the default parameters for each algorithm. These are the parameters set by rules of thumb or suggestions in books and research papers. But how do you know the algorithms that you are settling on are showing their best performance?
Use Algorithm Tuning To Search For Algorithm Parameters
The answer is to search for good or even best combinations of algorithm parameters for your problem.
You need a process to tune each machine learning algorithm to know that you are getting the most out of it. Once tuned, you can make an objective comparison between the algorithms on your shortlist.
Searching for algorithm parameters can be difficult, there are many options, such as:
What parameters to tune?
What search method to use to locate good algorithm parameters?
What test options to use to limit overfitting the training data?
Need more Help with R for Machine Learning?
Take my free 14-day email course and discover how to use R on your project (with sample code).
Click to sign-up and also get a free PDF Ebook version of the course.
Tune Machine Learning Algorithms in R
You can tune your machine learning algorithm parameters in R.
Generally, the approaches in this section assume that you already have a short list of well-performing machine learning algorithms for your problem from which you are looking to get better performance.
An excellent way to create your shortlist of well-performing algorithms is to use the caret package.
In this section we will look at three methods that you can use in R to tune algorithm parameters:
Using the caret R package.
Using tools that come with the algorithm.
Designing your own parameter search.
Before we start tuning, let’s setup our environment and test data.
Test Setup
Let’s take a quick look at the data and the algorithm we will use in this case study.
Test Dataset
In this case study, we will use the sonar test problem.
This is a dataset from the UCI Machine Learning Repository that describes radar returns as either bouncing off metal or rocks.
It is a binary classification problem with 60 numerical input features that describe the properties of the radar return. You can learn more about this problem here: Sonar Dataset. You can see world class published results for this dataset here: Accuracy on the Sonar Dataset.
This is not a particularly difficult dataset, but is non-trivial and interesting for this example.
Let’s load the required libraries and load the dataset from the mlbench package.
1
2
3
4
5
6
7
8
9
library(randomForest)
library(mlbench)
library(caret)
# Load Dataset
data(Sonar)
dataset<-Sonar
x<-dataset[,1:60]
y<-dataset[,61]
Test Algorithm
We will use the popular Random Forest algorithm as the subject of our algorithm tuning.
Random Forest is not necessarily the best algorithm for this dataset, but it is a very popular algorithm and no doubt you will find tuning it a useful exercise in you own machine learning work.
When tuning an algorithm, it is important to have a good understanding of your algorithm so that you know what affect the parameters have on the model you are creating.
In this case study, we will stick to tuning two parameters, namely the mtry and the ntree parameters that have the following affect on our random forest model. There are many other parameters, but these two parameters are perhaps the most likely to have the biggest effect on your final accuracy.
Direct from the help page for the randomForest() function in R:
mtry: Number of variables randomly sampled as candidates at each split.
ntree: Number of trees to grow.
Let’s create a baseline for comparison by using the recommend defaults for each parameter and mtry=floor(sqrt(ncol(x))) or mtry=7 and ntree=500.
The caret package in R provides an excellent facility to tune machine learning algorithm parameters.
Not all machine learning algorithms are available in caret for tuning. The choice of parameters is left to the developers of the package, namely Max Khun. Only those algorithm parameters that have a large effect (e.g. really require tuning in Khun’s opinion) are available for tuning in caret.
As such, only mtry parameter is available in caret for tuning. The reason is its effect on the final accuracy and that it must be found empirically for a dataset.
The ntree parameter is different in that it can be as large as you like, and continues to increases the accuracy up to some point. It is less difficult or critical to tune and could be limited more by compute time available more than anything.
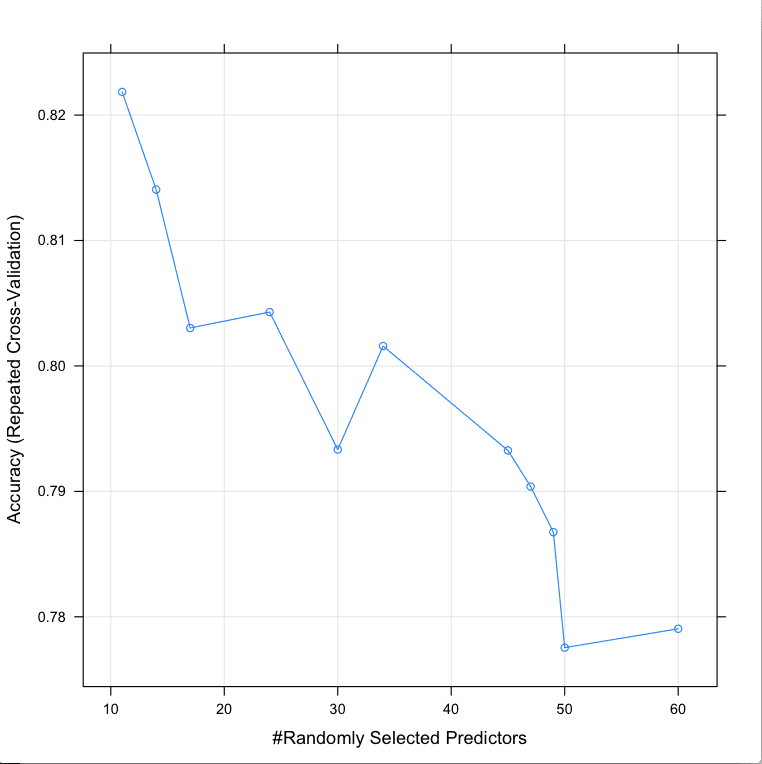
Random Search
One search strategy that we can use is to try random values within a range.
This can be good if we are unsure of what the value might be and we want to overcome any biases we may have for setting the parameter (like the suggested equation above).
Note, that we are using a test harness similar to that which we would use to spot check algorithms. Both 10-fold cross-validation and 3 repeats slows down the search process, but is intended to limit and reduce overfitting on the training set. It won’t remove overfitting entirely. Holding back a validation set for final checking is a great idea if you can spare the data.
1
2
3
4
5
6
7
8
9
10
11
12
13
14
Resampling results across tuning parameters:
mtry Accuracy Kappa Accuracy SD Kappa SD
11 0.8218470 0.6365181 0.09124610 0.1906693
14 0.8140620 0.6215867 0.08475785 0.1750848
17 0.8030231 0.5990734 0.09595988 0.1986971
24 0.8042929 0.6002362 0.09847815 0.2053314
30 0.7933333 0.5798250 0.09110171 0.1879681
34 0.8015873 0.5970248 0.07931664 0.1621170
45 0.7932612 0.5796828 0.09195386 0.1887363
47 0.7903896 0.5738230 0.10325010 0.2123314
49 0.7867532 0.5673879 0.09256912 0.1899197
50 0.7775397 0.5483207 0.10118502 0.2063198
60 0.7790476 0.5513705 0.09810647 0.2005012
We can see that the most accurate value for mtry was 11 with an accuracy of 82.1%.
Tune Random Forest Parameters in R Using Random Search
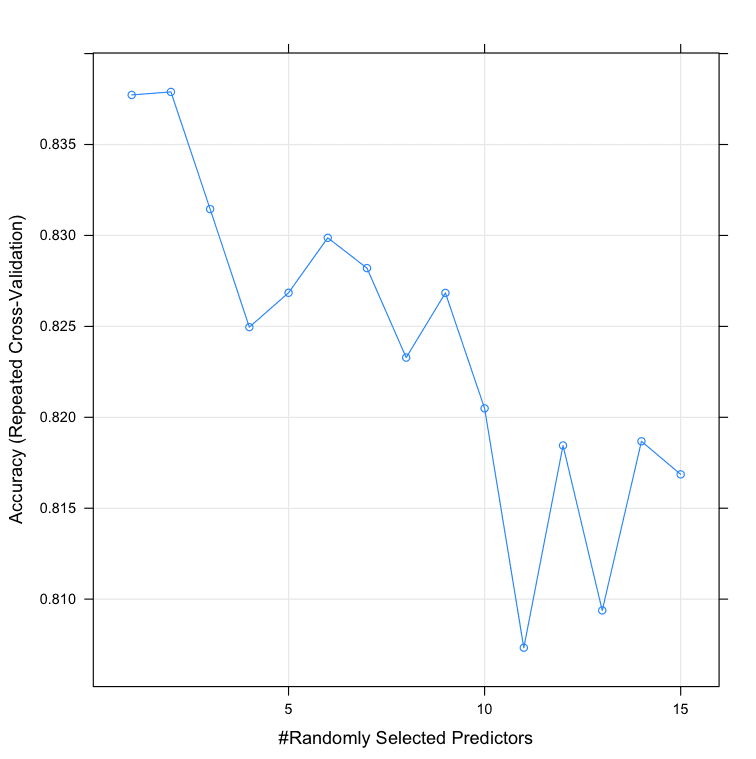
Grid Search
Another search is to define a grid of algorithm parameters to try.
Each axis of the grid is an algorithm parameter, and points in the grid are specific combinations of parameters. Because we are only tuning one parameter, the grid search is a linear search through a vector of candidate values.
We can see that the most accurate value for mtry was 2 with an accuracy of 83.78%.
1
2
3
4
5
6
7
8
9
10
11
12
13
14
15
16
17
18
Resampling results across tuning parameters:
mtry Accuracy Kappa Accuracy SD Kappa SD
1 0.8377273 0.6688712 0.07154794 0.1507990
2 0.8378932 0.6693593 0.07185686 0.1513988
3 0.8314502 0.6564856 0.08191277 0.1700197
4 0.8249567 0.6435956 0.07653933 0.1590840
5 0.8268470 0.6472114 0.06787878 0.1418983
6 0.8298701 0.6537667 0.07968069 0.1654484
7 0.8282035 0.6493708 0.07492042 0.1584772
8 0.8232828 0.6396484 0.07468091 0.1571185
9 0.8268398 0.6476575 0.07355522 0.1529670
10 0.8204906 0.6346991 0.08499469 0.1756645
11 0.8073304 0.6071477 0.09882638 0.2055589
12 0.8184488 0.6299098 0.09038264 0.1884499
13 0.8093795 0.6119327 0.08788302 0.1821910
14 0.8186797 0.6304113 0.08178957 0.1715189
15 0.8168615 0.6265481 0.10074984 0.2091663
Tune Random Forest Parameters in R Using Grid Search.png
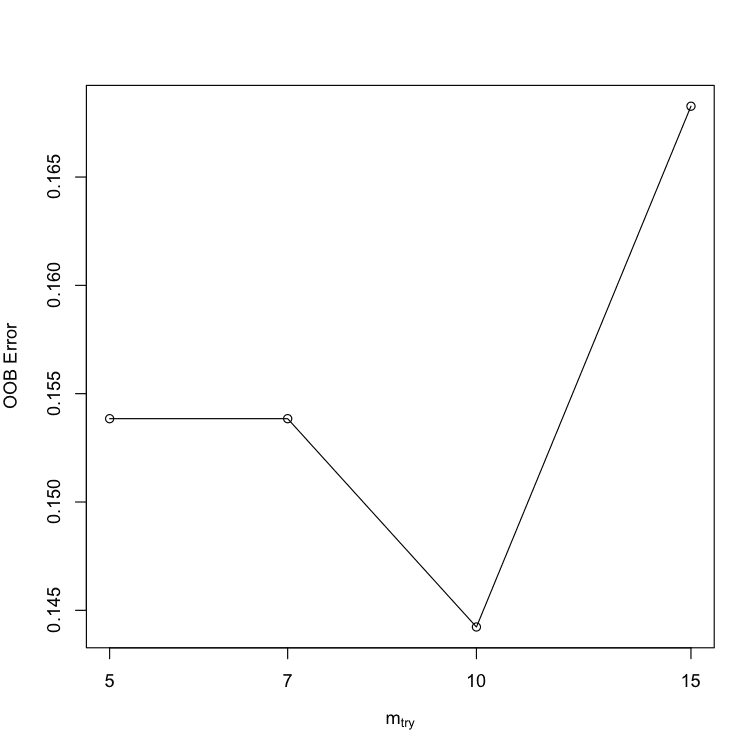
2. Tune Using Algorithm Tools
Some algorithms provide tools for tuning the parameters of the algorithm.
For example, the random forest algorithm implementation in the randomForest package provides the tuneRF() function that searches for optimal mtry values given your data.
You can see that the most accurate value for mtry was 10 with an OOBError of 0.1442308.
This does not really match up with what we saw in the caret repeated cross validation experiment above, where mtry=10 gave an accuracy of 82.04%. Nevertheless, it is an alternate way to tune the algorithm.
1
2
3
4
5
mtry OOBError
5.OOB 5 0.1538462
7.OOB 7 0.1538462
10.OOB 10 0.1442308
15.OOB 15 0.1682692
Tune Random Forest Parameters in R using tuneRF
3. Craft Your Own Parameter Search
Often you want to search for both the parameters that must be tuned (handled by caret) and the those that need to be scaled or adapted more generally for your dataset.
You have to craft your own parameter search.
Two popular options that I recommend are:
Tune Manually: Write R code to create lots of models and compare their accuracy using caret
Extend Caret: Create an extension to caret that adds in additional parameters to caret for the algorithm you want to tune.
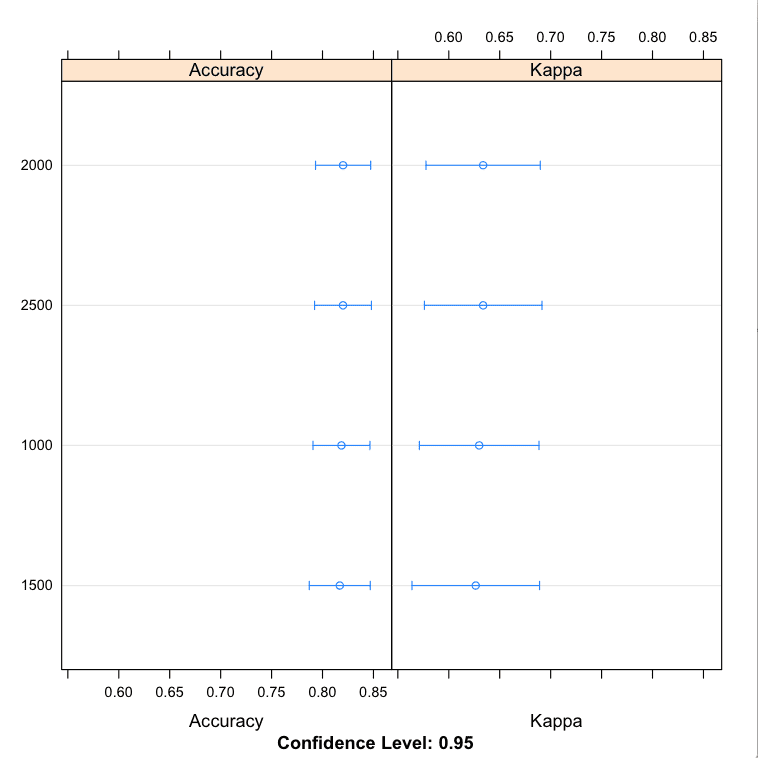
Tune Manually
We want to keep using caret because it provides a direct point of comparison to our previous models (apples to apples, even the same data splits) and because of the repeated cross validation test harness that we like as it reduces the severity of overfitting.
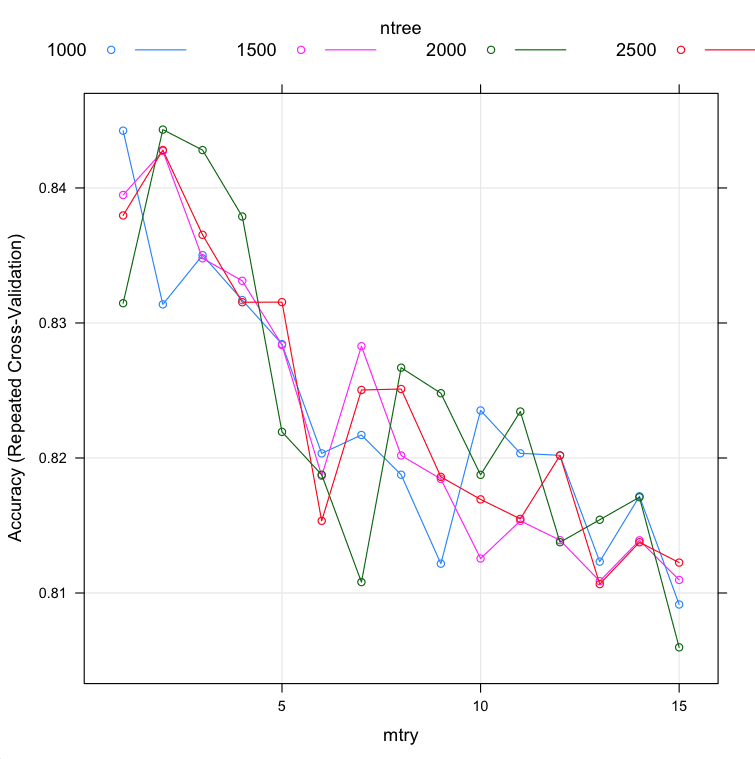
One approach is to create many caret models for our algorithm and pass in a different parameters directly to the algorithm manually. Let’s look at an example doing this to evaluate different values for ntree while holding mtry constant.
You can see that the most accuracy value for ntree was perhaps 2000 with a mean accuracy of 82.02% (a lift over our very first experiment using the default mtry value).
The results perhaps suggest an optimal value for ntree between 2000 and 2500. Also note, we held mtry constant at the default value. We could repeat the experiment with a possible better mtry=2 from the experiment above, or try combinations of of ntree and mtry in case they have interaction effects.
1
2
3
4
5
6
7
8
9
Models: 1000, 1500, 2000, 2500
Number of resamples: 30
Accuracy
Min. 1st Qu. Median Mean 3rd Qu. Max. NA's
1000 0.600 0.8024 0.8500 0.8186 0.8571 0.9048 0
1500 0.600 0.8024 0.8095 0.8169 0.8571 0.9500 0
2000 0.619 0.8024 0.8095 0.8202 0.8620 0.9048 0
2500 0.619 0.8000 0.8095 0.8201 0.8893 0.9091 0
Tune Random Forest Parameters in R Manually
Extend Caret
Another approach is to create a “new” algorithm for caret to support.
This is the same random forest algorithm you are using, only modified so that it supports multiple tuning of multiple parameters.
A risk with this approach is that the caret native support for the algorithm has additional or fancy code wrapping it that subtly but importantly changes it’s behavior. You many need to repeat prior experiments with your custom algorithm support.
We can define our own algorithm to use in caret by defining a list that contains a number of custom named elements that the caret package looks for, such as how to fit and how to predict. See below for a definition of a custom random forest algorithm for use with caret that takes both an mtry and ntree parameters.
You can see that the most accurate values for ntree and mtry were 2000 and 2 with an accuracy of 84.43%.
We do perhaps see some interaction effects between the number of trees and the value of ntree. Nevertheless, if we had chosen the best value for mtry found using grid search of 2 (above) and the best value of ntree found using grid search of 2000 (above), in this case we would have achieved the same level of tuning found in this combined search. This is a nice confirmation.
1
2
3
4
5
6
7
8
9
10
11
12
13
14
15
16
17
18
19
20
21
22
23
24
25
26
27
28
29
30
31
32
33
34
35
36
37
38
39
40
41
42
43
44
45
46
47
48
49
50
51
52
53
54
55
56
57
58
59
60
61
mtry ntree Accuracy Kappa Accuracy SD Kappa SD
1 1000 0.8442424 0.6828299 0.06505226 0.1352640
1 1500 0.8394805 0.6730868 0.05797828 0.1215990
1 2000 0.8314646 0.6564643 0.06630279 0.1381197
1 2500 0.8379654 0.6693773 0.06576468 0.1375408
2 1000 0.8313781 0.6562819 0.06909608 0.1436961
2 1500 0.8427345 0.6793793 0.07005975 0.1451269
2 2000 0.8443218 0.6830115 0.06754346 0.1403497
2 2500 0.8428066 0.6791639 0.06488132 0.1361329
3 1000 0.8350216 0.6637523 0.06530816 0.1362839
3 1500 0.8347908 0.6633405 0.06836512 0.1418106
3 2000 0.8428066 0.6800703 0.06643838 0.1382763
3 2500 0.8365296 0.6668480 0.06401429 0.1336583
4 1000 0.8316955 0.6574476 0.06292132 0.1317857
4 1500 0.8331241 0.6605244 0.07543919 0.1563171
4 2000 0.8378860 0.6699428 0.07147459 0.1488322
4 2500 0.8315368 0.6568128 0.06981259 0.1450390
5 1000 0.8284343 0.6505097 0.07278539 0.1516109
5 1500 0.8283622 0.6506604 0.07166975 0.1488037
5 2000 0.8219336 0.6375155 0.07548501 0.1564718
5 2500 0.8315440 0.6570792 0.07067743 0.1472716
6 1000 0.8203391 0.6341073 0.08076304 0.1689558
6 1500 0.8186797 0.6302188 0.07559694 0.1588256
6 2000 0.8187590 0.6310555 0.07081621 0.1468780
6 2500 0.8153463 0.6230495 0.07728249 0.1623253
7 1000 0.8217027 0.6367189 0.07649651 0.1606837
7 1500 0.8282828 0.6503808 0.06628953 0.1381925
7 2000 0.8108081 0.6147563 0.07605609 0.1573067
7 2500 0.8250361 0.6437397 0.07737756 0.1602434
8 1000 0.8187590 0.6314307 0.08378631 0.1722251
8 1500 0.8201876 0.6335679 0.07380001 0.1551340
8 2000 0.8266883 0.6472907 0.06965118 0.1450607
8 2500 0.8251082 0.6434251 0.07745300 0.1628087
9 1000 0.8121717 0.6177751 0.08218598 0.1709987
9 1500 0.8184488 0.6300547 0.08077766 0.1674261
9 2000 0.8247980 0.6429315 0.07260439 0.1513512
9 2500 0.8186003 0.6302674 0.07356916 0.1547231
10 1000 0.8235209 0.6407121 0.07991334 0.1656978
10 1500 0.8125541 0.6183581 0.06851683 0.1421993
10 2000 0.8187518 0.6308120 0.08538951 0.1782368
10 2500 0.8169336 0.6263682 0.07847066 0.1649216
11 1000 0.8203463 0.6341158 0.07222587 0.1497558
11 1500 0.8153463 0.6235878 0.09131621 0.1904418
11 2000 0.8234416 0.6402906 0.07586609 0.1576765
11 2500 0.8154906 0.6236875 0.07485835 0.1576576
12 1000 0.8201948 0.6336913 0.08672139 0.1806589
12 1500 0.8139105 0.6206994 0.08638618 0.1804780
12 2000 0.8137590 0.6204461 0.07771424 0.1629707
12 2500 0.8201876 0.6333194 0.07799832 0.1636237
13 1000 0.8123232 0.6173280 0.09299062 0.1936232
13 1500 0.8108802 0.6142721 0.08416414 0.1760527
13 2000 0.8154257 0.6236191 0.08079923 0.1693634
13 2500 0.8106566 0.6138814 0.08074394 0.1687437
14 1000 0.8171645 0.6270292 0.08608806 0.1799346
14 1500 0.8139033 0.6207263 0.08522205 0.1781396
14 2000 0.8170924 0.6276518 0.08766645 0.1822010
14 2500 0.8137590 0.6207371 0.08353328 0.1746425
15 1000 0.8091486 0.6110154 0.08455439 0.1745129
15 1500 0.8109668 0.6154780 0.08928549 0.1838700
15 2000 0.8059740 0.6047791 0.08829659 0.1837809
15 2500 0.8122511 0.6172771 0.08863418 0.1845635
Custom Tuning of Random Forest parameters in R
For more information on defining custom algorithms in caret see:
Though i try Tuning the Random forest model with number of trees and mtry Parameters, the result is the same. The table Looks like this and I have to predict y11.
All x11 to x19 are the important Features to detect y11 value. I have given the model like this but still not able to achieve high Efficiency. Can you please help me.
rf_model <- randomForest(y11~x11+x12+x13+x14+x15+x16+x17+x18+x19, data =new_dataframe_train,ntree=1001,importance=TRUE,keep.forest=TRUE,mtry=3)
Thanks for your post. I’ve been trying to get stability of top predictors after nested cross validated rf like I can in glmnet but I’ve been having difficulty. Do you happen to have any tips?
Thanks for your codes. I am trying to run them and I was not able to get the same output as you did for the last part of
> summary(custom)
> plot(custom)
I got something like this instead for “summary(custom)”:
Length Class Mode
call 5 -none- call
type 1 -none- character
predicted 10537 factor numeric
err.rate 7500 -none- numeric
confusion 6 -none- numeric
votes 21074 matrix numeric
oob.times 10537 -none- numeric
classes 2 -none- character
importance 51 -none- numeric
importanceSD 0 -none- NULL
localImportance 0 -none- NULL
proximity 0 -none- NULL
ntree 1 -none- numeric
mtry 1 -none- numeric
forest 14 -none- list
y 10537 factor numeric
test 0 -none- NULL
inbag 0 -none- NULL
xNames 51 -none- character
problemType 1 -none- character
tuneValue 2 data.frame list
obsLevels 2 -none- character
Can you advise what went wrong? The codes took 4 days to run and I’m sort of disappointed I wasn’t getting an output I was expecting. Thanks!
Is it a general practice to normalize and reduce the number of features using PCA before running the random forest algorithm? I understand that RF picks the best features while splitting the nodes, but my only motivation for PCA is to reduce the computation time.
Very informative blog! thank you! I am experimenting with custom RF function for regression model. I changed type = “regression” and metric=”RMSE”. But, for custom <- train(x,y, method=customRF, metric="RMSE", tuneGrid=tunegrid, trControl=c – I get error. "Error in train.default(x, y, method = customRF, metric = "RMSE", tuneGrid = tunegrid, :
wrong model type for regression" . What could be wrong?
Thanks Jason, I tried as per your suggestion and I get NULL output for fit$predicted !
In function help, it is mentioned that “train{caret} function sets up a grid of tuning parameters for a number of classification and regression routines, fits each model and calculates a resampling based performance measure.”
Do the tuning parameters I have obtained from above mentioned code are relevant, given the situation when we don’t go for grid search?
Is there a theoretical uperr bound for mtry? I see in most examples the upper bound is 15 but why not fr example 35? Any reference will be greatly appreciated 🙂
Thank you for your post, very detailed and super clear! To follow up DF’s question: I understand that the universe of possible values for mtry is 1 to the number of features. Does it mean that if I want to do a systematic tuning on mtry, I should try all value with this big range if I have many features (like more than 5,000)? What are the pros and cons of choosing bog value of mtry? Any reference will be highly appreciated!
Thank you Jason for your reply! But I found that if I choose the values that is higher than sqrt(num feature), the model performance (Accuracy) is better. Can I use the higher value of mtry? Or it is very strict that we need to use < sqrt(num feature)? What is the principle behind this sqrt(num feature)?
As you said mtry has the upper bound of the number of attributes in a data sample. I dont understand this:
You can see here (as below) I have 11 attributes in my trainData. I copied your code where mtry is set as mtry <- sqrt(ncol(trainData)). why the results show the model has tried many mtry values. the best is mtry = 25! which is more than the attributes of the data sample.
Hi Jason,
In order to improve a model’s accuracy I go back and search for inaccurately misplaced training points and correct or remove them. I have thousands of training points so it is not easy to locate them in the training data-set. I was wondering, since the confusion matrix in Random Forest Package in R shows how many training points are inaccurately classified in each class is there a way to easily pinpoint those inaccurately classified training points? I have ID’s of my training samples but I don’t know if it is possible to locate them.
Some of my training points are collected using google earth so as you can guess they are not always the best validation data. that is the reason I tune my training points. Can you give me any suggestion regarding the problem? Normally it is possible to locate those points manually but it is time consuming. I am sure there should be a way to reveal the misclassified points but I don’t know how.
Right, that is what I am talking about “data cleaning” but not prior to use of random forest model. I use uncleaned data as a pre-analysis and get confusion matrix. The confusion matrix reveals how many points are misclassified but I need to know exactly which points are misclassified so I can clean it. I need a code in R that reveals the misclassified points. I have the order numbers of each point (total 3000) if it helps.
Question was deleted…. may be there was error..
so I request. now.
in this grid search code. you use set.seed(seed). Also, you use same function in random search code. I know what is set.seed. But I don’t know why you use this function in grid search code. I understand that set.seed function is used in random search because it has to select each parameter’s number. If i know wrong information, please explain what is the role of set.seed function in this code. Have a nice day!
Hi Jason. you introduced good 2 method(grid, random search).
Is there another method to select best paramters??
I want to know that Even if I do not set the range of parameters, I can find the optimal parameters for the model. The random search eventually sets the number to use as the tuneLength argument….
Hi Jason. Thanks for your work. I am trying to run ‘Extend Caret’ part and it is unable to get the same output as you did, especially this:
> summary(custom)
> plot(custom)
Something is wrong in “summary(custom)”, almost the same as Bing mentioned , as I used custom$results. as Beth suggested before. the result is still wrong.
Could you please give further advise about this?Thank you!
Thanks for this blog post which gave me the confidence to go beyond Coursera ML course project requirements by daring to tune not just mtry parameter in a basic Forest model but also C parameter in a Support Vector Machine model with an radial basis kernel. Even tried plotting the effects of mtry and ntree settings on OOB error:
There are 84 features in the train data set.. So, the maximum number of features considered at any point is 84. However, I get the output as below with mtry as 145 and 288 which is strange (more than 84 features tried)..I am confused.. Please clarify
hi, I heard cross validation is not necessary for random forest, since we can use out of bagging error. In this demo, we use train function with control. could you give me some comments about it? Many thanks
Thank you for your reply! I see. I also heard using OOB errors may overestimate the accuracy. So in this sense, it maybe also interesting to tune it with CV except using ‘tuneRF’ from ‘randomForest’.
I was wondering if you knew of a way to re-write the RF model to allow for tuning of the cutoff probabilities? For instance, if we had a dataset with unbalanced classes, is it possible to write a custom RF model where mtry was fixed at floor(sqrt(predictors)), and cutoff would iterate through a sequence of values such as .1,.2,.3… .9 for each class? So cutoff for the first iteration might be c(.25,.25,.5), second might be c(.3,.4.3) etc? The only “catch” is that the cutoff probabilities must add to to 1.
Yes, I met the same problem. After searching many information, I found that only mtry could be listed and tuned in train method. ntrees could be not tuned at the same time. I don’t know how to tuned them at the same time?
I am evaluating the performance of several approaches (linear regression, random forest, support vector machine, gradient boosting, neural network and cubist) for a regression related problem. I am using caret package for this, and have been using 10-fold cross validation approach. To compare the performance of the models, I am using two metrics R2 and RMSE. Are there any other metrics that can be used to compare these models? In addition to these two metrics, I am suggested to use some information criterions to evaluate the model performance. The only information criterions I am aware are AIC and BIC, but I am not sure if that can be used with Caret package. Do you have any suggestions?
My other question is about rationale for splitting the data. I am dealing with 250 records. I split the data into 80 (train) and 20 (test), as I find 80:20 is the most commonly used number. Can you please recommend what split is good for what scenario? If you have to respond to question like “why did you split the total data at 80:20”, what would be your response? Are they are source (References) that I can cite. I need to explain someone
My another question is about stepwise regression versus genetic algorithm to address a problem of multi-collinearity. I have extensively used stepwise regression, but have not used genetic algorithm. Are you familiar with these? If you are, can you help me compare them in terms of their pros and cons?
Any suggestions on these would be highly appreciated. Thanks.
Yes, there are many metrics you can use. Think hard about the goals of the project and choose metrics that help you to show/not show you are meeting those goals.
That split is fine, but may not be needed if you are using k-fold cross-validation to estimate model skill.
You can perform a sensitivity analysis to show how the statistical properties of the same change with sample size to help support a chosen sample size. Might not have any real impact though, e.g. just hand waving.
Yes, I’d recommend testing a suite of different feature selection methods, build a model from the results of each and double down on what works best. If you have resources, try all subsets of features.
Thanks Jason for your response. Can you please suggest any example that illustrates the use of AIC or BIC or other information criterion for evaluating regression models’ built using CARET package.I have been asked to do this, but don’t know how to do it.
Same with the genetic algorithms. Any examples would help. Thanks.
Hi Jason,
Thanks for your blog. This is very helpful!
I want to ask about what your physical configuration do you use to tune model in Extend caret item? You said that it spend 1-2 minutes but I wait up to 2 hours to complete my process. My physical configuration is (core i7-3720QM RAM 8GB
I want to ask you where did the accuracy score be obtained in caret package? Confussion matrix or from data out of bag?
And then, I have some question off the topic. I know that random forest was built more for prediction. But, can we make random forest more interpretable? Or is there any package that we can use to get sample of random forest tree? Hopefully you can help me answer the question
once I’ve found the best parameters and want to validate the model on a set (previously separated and not used in the tuning process), can I just take the best model found and trained in the tuning process or should I train the model once again with the best parameters? I’ve used tune.wrapper from e1071 for SVM and NNET, and according to the e1071 doc, you can access the best model, which was trained on the whole training data after finding the best parameters, however I see some differences in performance between the model taken from the tuning and a model, which is trained again from the beginning. I would be very grateful for your help on this.
Sir, I used random forest for my classification method. I evaluated the model in the data train and data test. In data train, i got 100% on accuracy. Any reason why can this happen?
Hi Jason,
Thank you for the nice post on tuning parameters for random forest. I am trying test my model, using repeated cross validation, 10 folds, 3 times. So much seed should I set it for?. Is it 31? Please advice on setting the seed number?
Thank you
Priya
HI Jason, in the caret package with RF you can obtain a variable importance plot. In regular RF this is done by Gini decrease–does the caret RF variable importance plot also present the gini decrease? The documentation for the caret package doesn’t explicitly say this.
I’m having a lot of trouble changing the customRF function to account for a new dataset. It is a dataset also found on UCI (https://archive.ics.uci.edu/ml/datasets/heart+Disease). It has 13 variables and the variable I want to predict is disease. Any advice for altering your function.
Thanks so much sir, this blog helps me a lot. But may I have a question?
I have a problem in part ‘Extend Caret’ , the error message that I get from R is shown below.
Something is wrong; all the Accuracy metric values are missing:
Accuracy Kappa
Min. : NA Min. : NA
1st Qu.: NA 1st Qu.: NA
Median : NA Median : NA
Mean :NaN Mean :NaN
3rd Qu.: NA 3rd Qu.: NA
Max. : NA Max. : NA
NA’s :30 NA’s :30
Error: Stopping
In addition: Warning message:
In nominalTrainWorkflow(x = x, y = y, wts = weights, info = trainInfo, :
There were missing values in resampled performance measures.
What should I do then? Your help would means a lot for me.
I had the same error today, and later I found out it’s because I didn’t library(randomForest). Hope this would be helpful for other people who are facing the same error.
Another package worth of trying is “DEoptim” using the different evolution algorithm for a “smart search”, which work for both floating and integer parameters.
Error in contrasts<-(*tmp*, value = contr.funs[1 + isOF[nn]]) :
contrasts can be applied only to factors with 2 or more levels
What do you suppose the issue is? WOODLAND values are observations/counts varying from 0-125. Predictors are various environmental variables for a total of 104.
The code I ran is from the code you provided, run with my dataset and it didn’t run. Should predictors in x dataset be all factors or all numeric or does it matter? I was able to run all lines of code as you shared until the train function and the output states as I shared above, that “contrasts can be applied only to factors with 2 or more levels”. I am not sure what factors with 2 or more levels, means. Should the y data/column values be a factor or does it matter? Thank you for your time and response.
Hi Jason
Thanks for posting, it is really helpful.
After I successfully tuned my parameters (i.e. found the best parameter combination), how do I proceed with the actual prediction on my unseen test data?
Do I take the best parameters and use them as input for the randomForest function:
Hi Jason! Thank you so much for your amazing posts! Helps a lot! I am trying to find a way to tune the max tree depth in the random forest method in caret but I don’t see any relevant tuning parameter in the subject method. The only tuning parameter is the ‘mtry’. Besides, I also used a for loop to try different values for the trees. Is there a way to tune the max tree depth as well?
I’ll be obliged for your kind cooperation.
Learned a lot from this. I would like to ask how to create a new algorithm for regression and not classification under the Extent caret. I realized the customRF in the lecture is for classification and not regression cos it was giving me “Error: wrong model type for regression” when I tried it. please, can you kindly send me the code for customRF regression or tell me what to edit from the one you did. Thanks
And teh customRF works well for regression with so e modification.
I just have one qusetion:
To make random forest regression on time series data, we need stationarity in the time series before we make the random forest forecasting and tuning the parameters, right?
Do we also need to remove trend and seasonality? As I have understand the random forst can handle these things in the code? It is only in ARIMA and so on we have to take these tings into account?
I was wondering if you can suggest a method to calculate the minimum number of samples (or columns) that require a random forest model. Do you know if there is a rule of thumb about it?
Nice post! In your custom script, you tried several values for ntree for tuning: 1000, 1500, 2000, 2500. I was wondering is there theoretical range for ntreer? why do you choose these numbers for tuning? How can we understand this hyperparameter? Is it true that more tree is better? It would be super nice if your can provide reference, thank you in advance!
Thank you for your suggestions! In my project, I tried ntree = 500, 1000, 1500, 2000, and 2500, but the model performance is not so different when I chose different ntree, but it seems mtry matters more. In this case, do you think it is safe just choose ntree = 500? Thanks again!
Hi Jason,
Thank you for this very interesting and educational tutorial. I have two questions, the first is how to get the result of each iteration (number).
control <- trainControl(method="repeatedcv", number=10, repeats=3) or
control <- trainControl(method="LOOCV", number=10)
and run this model in our topic
rf_default <- train(Class~., data=dataset, method="rf", metric=metric, tuneGrid=tunegrid, trControl=control)
How to get each run results ie rf_default 1…. rf_default 10
The second one is how to add the weight in the search grid
Thank you for your response. So nn the case of unbalanced data in the grid search for optimal parameters, we try to give greater weight to the minority class.
Hello Sir, I saw your code for tuning the number of trees in caret package for the randomforest algorithm. Here I have one problem, you gave the extension code for the classification problem. Please help me how to make for the regression type of problems
Great tutorials on machine learning. I was wondering if it’s possible to plot ROC curves on
n-fold cross-validation test in the above example on iris dataset.
Hi, Jason.
Thanks for the tutorial, but I am having trouble replicating the precise values that you are getting. What version of R and caret was this example run under?
Nice article and easy to follow. You are talking about interaction effects between number of trees and the value of ntree. What exactly do you mean? Could it be for example the ntree and RMSE (or MSE, R2 etc)? Is there a way to visualize (in a graph for example) these interactions?
Helpful but the custom tuning is poorly explained. There’s no explanation of what “wts”, “lev”, “last”, etc. mean and how to even use them. I want to incorporate class or case weights into this but it has been impossible to figure out.


")
")
")
Though i try Tuning the Random forest model with number of trees and mtry Parameters, the result is the same. The table Looks like this and I have to predict y11.
x11 x12 x13 x14 x15 x16 x17 x18 x19 y11
0 0 0 2 0 2 2 4 0.000000000 ?
1 1 0 0 0 3 3 18 0.000025700 ?
0 1 0 0 1 2 2 2 0.000000000 ?
5 2 1 0 1 12 12 14 0.000128479
0 0 2 0 1 3 3 3 0.000000000
4 0 2 0 1 7 8 104 0.000102783
All x11 to x19 are the important Features to detect y11 value. I have given the model like this but still not able to achieve high Efficiency. Can you please help me.
rf_model <- randomForest(y11~x11+x12+x13+x14+x15+x16+x17+x18+x19, data =new_dataframe_train,ntree=1001,importance=TRUE,keep.forest=TRUE,mtry=3)
rf_pred<-predict(rf_model,new_dataframe_test)
Generally it is a good idea to tune mtry and keep increasing the number of trees until you no longer see an improvement in performance.
No need to perform feature selection with random forest, it will do so automatically, ignoring features that make bad split points.
Warning in install.packages :
package ‘videoplayR’ is not available (for R version 3.5.2)
I don’t know about that package, sorry. Perhaps try posting to stackoverflow or the r user group?
Hi Jason,
Thanks for your post. I’ve been trying to get stability of top predictors after nested cross validated rf like I can in glmnet but I’ve been having difficulty. Do you happen to have any tips?
Thanks!
Emma
Sorry, what do you mean by “stability on top of predictors”?
Thanks for your codes. I am trying to run them and I was not able to get the same output as you did for the last part of
> summary(custom)
> plot(custom)
I got something like this instead for “summary(custom)”:
Length Class Mode
call 5 -none- call
type 1 -none- character
predicted 10537 factor numeric
err.rate 7500 -none- numeric
confusion 6 -none- numeric
votes 21074 matrix numeric
oob.times 10537 -none- numeric
classes 2 -none- character
importance 51 -none- numeric
importanceSD 0 -none- NULL
localImportance 0 -none- NULL
proximity 0 -none- NULL
ntree 1 -none- numeric
mtry 1 -none- numeric
forest 14 -none- list
y 10537 factor numeric
test 0 -none- NULL
inbag 0 -none- NULL
xNames 51 -none- character
problemType 1 -none- character
tuneValue 2 data.frame list
obsLevels 2 -none- character
Can you advise what went wrong? The codes took 4 days to run and I’m sort of disappointed I wasn’t getting an output I was expecting. Thanks!
Try:
> custom$results.
Hi Jason,
I love your website and work.
Is it a general practice to normalize and reduce the number of features using PCA before running the random forest algorithm? I understand that RF picks the best features while splitting the nodes, but my only motivation for PCA is to reduce the computation time.
Thanks Aditya.
No, I would suggest you let RF figure it out.
If you have time, you could later compare a PCA projected version of your dataset to see if it can out-perform the raw data.
Great. Thanks for the tip!
Great Work! Thanks for the post! 🙂
What will be the metric incase of regression?
Thanks Harini, I’m glad you found it useful.
When you write the line for the model:
rf_default <- train(Class~., . . . )
My R compiler says that 'Class' wasn't found, what does the Class~. represent and how does one go about resolving the issue?
This is the formula notation, where “Class” is the name of a variable in the dataset. It may not exist in your dataset.
More on the formula notation here:
https://stat.ethz.ch/R-manual/R-devel/library/stats/html/formula.html
and here:
https://ww2.coastal.edu/kingw/statistics/R-tutorials/formulae.html
Very informative blog! thank you! I am experimenting with custom RF function for regression model. I changed type = “regression” and metric=”RMSE”. But, for custom <- train(x,y, method=customRF, metric="RMSE", tuneGrid=tunegrid, trControl=c – I get error. "Error in train.default(x, y, method = customRF, metric = "RMSE", tuneGrid = tunegrid, :
wrong model type for regression" . What could be wrong?
meanwhile, I did as coded below:
control <- trainControl(method="repeatedcv", number=10, repeats=3, search="grid")
tunegrid <- expand.grid(.mtry=c(1:15))
modellist <- list()
for (ntree in c(1000, 1500, 2000, 2500,3000)) {
fit <- train(x,y, method="rf", metric="RMSE", tuneGrid=tunegrid, trControl=control, ntree=ntree)
key <- toString(ntree)
modellist[[key]] <- fit
}
But this takes too much time!
Strange, it looks like it does not want to use random forest for regression.
Try using caret train() with ‘rf’ on your dataset without grid search and ensure it works.
Thanks Jason, I tried as per your suggestion and I get NULL output for fit$predicted !
In function help, it is mentioned that “train{caret} function sets up a grid of tuning parameters for a number of classification and regression routines, fits each model and calculates a resampling based performance measure.”
Do the tuning parameters I have obtained from above mentioned code are relevant, given the situation when we don’t go for grid search?
You can call the predict() function to make predictions.
Is there a theoretical uperr bound for mtry? I see in most examples the upper bound is 15 but why not fr example 35? Any reference will be greatly appreciated 🙂
Hi DF,
mtry is the number of features to consider at each split point.
The universe of possible values is 1 to the number of features in your dataset.
Hi Jason,
Thank you for your post, very detailed and super clear! To follow up DF’s question: I understand that the universe of possible values for mtry is 1 to the number of features. Does it mean that if I want to do a systematic tuning on mtry, I should try all value with this big range if I have many features (like more than 5,000)? What are the pros and cons of choosing bog value of mtry? Any reference will be highly appreciated!
No, typically 1 to sqrt(num features) is sufficient.
Impact of tuning it depends on the problem.
Here’s an example of tuning it in python:
https://machinelearningmastery.com/random-forest-ensemble-in-python/
Thank you Jason for your reply! But I found that if I choose the values that is higher than sqrt(num feature), the model performance (Accuracy) is better. Can I use the higher value of mtry? Or it is very strict that we need to use < sqrt(num feature)? What is the principle behind this sqrt(num feature)?
Great. Yes, you can.
It is just a heuristic.
Dear Jason,
As you said mtry has the upper bound of the number of attributes in a data sample. I dont understand this:
You can see here (as below) I have 11 attributes in my trainData. I copied your code where mtry is set as mtry <- sqrt(ncol(trainData)). why the results show the model has tried many mtry values. the best is mtry = 25! which is more than the attributes of the data sample.
control <- trainControl(method="repeatedcv", number=10, repeats=3, search="random")
set.seed(2222)
mtry <- sqrt(ncol(trainData))
rf_random ncol(trainData)
[1] 12
results:
Random Forest
623 samples
11 predictor
2 classes: ‘0’, ‘1’
No pre-processing
Resampling: Cross-Validated (10 fold, repeated 3 times)
Summary of sample sizes: 561, 560, 561, 560, 561, 561, …
Resampling results across tuning parameters:
mtry Accuracy Kappa
1 0.7122839 0.3097868
4 0.8138063 0.5970567
10 0.8149683 0.6041117
16 0.8128004 0.5994635
17 0.8106752 0.5951853
22 0.8149336 0.6048981
24 0.8149939 0.6053784
25 0.8160003 0.6069581
31 0.8122969 0.5985465
35 0.8016210 0.5760874
37 0.8037374 0.5809098
38 0.8053330 0.5842086
Accuracy was used to select the optimal model using the largest value.
The final value used for the model was mtry = 25.
I cannot explain that, it’s very odd!
Perhaps there is a faulty assumption in your scenario? or a bug in your code?
Hi Jason,
In order to improve a model’s accuracy I go back and search for inaccurately misplaced training points and correct or remove them. I have thousands of training points so it is not easy to locate them in the training data-set. I was wondering, since the confusion matrix in Random Forest Package in R shows how many training points are inaccurately classified in each class is there a way to easily pinpoint those inaccurately classified training points? I have ID’s of my training samples but I don’t know if it is possible to locate them.
Interesting tactic of removing misclassified points. This is generally not an approach I use or recommend.
Why are you tuning your model this way?
Some of my training points are collected using google earth so as you can guess they are not always the best validation data. that is the reason I tune my training points. Can you give me any suggestion regarding the problem? Normally it is possible to locate those points manually but it is time consuming. I am sure there should be a way to reveal the misclassified points but I don’t know how.
To identify misclassified point would require another source of information.
This sounds like a data cleaning exercise, prior to modeling, unrelated to the choice or use of machine learning algorithms.
Right, that is what I am talking about “data cleaning” but not prior to use of random forest model. I use uncleaned data as a pre-analysis and get confusion matrix. The confusion matrix reveals how many points are misclassified but I need to know exactly which points are misclassified so I can clean it. I need a code in R that reveals the misclassified points. I have the order numbers of each point (total 3000) if it helps.
I would recommend comparing predictions to actual points one at a time to discover which points were misclassified.
I do not have an example at hand, sorry.
Thank you for good information!
But I have a one question.
>control set.seed(seed)
>tunegrid rf_gridsearch control set.seed(seed)
>mtry rf_random <- train(Class~., data=dataset, method="rf", metric=metric, tuneLength=15, trControl=control)
Have a nice day !!
What question?
hahahahah!
I try to help… but sometimes it’s hard.
Thank you for nice information. But, I want to know more parameter like nodesize. Then.. how to write R code.. 🙁
Question was deleted…. may be there was error..
so I request. now.
in this grid search code. you use set.seed(seed). Also, you use same function in random search code. I know what is set.seed. But I don’t know why you use this function in grid search code. I understand that set.seed function is used in random search because it has to select each parameter’s number. If i know wrong information, please explain what is the role of set.seed function in this code. Have a nice day!
# train model
control <- trainControl(method="repeatedcv", number=10, repeats=3)
tunegrid <- expand.grid(.mtry=c(1:15), .ntree=c(1000, 1500, 2000, 2500))
set.seed(seed)
custom <- train(Class~., data=dataset, method=customRF, metric=metric, tuneGrid=tunegrid, trControl=control)
summary(custom)
plot(custom)
I call seed to initialize the random number generator to get the same results each time the code is run. This is useful for tutorials.
You can learn more about the stochastic nature of applied machine learning here:
https://machinelearningmastery.com/randomness-in-machine-learning/
Oh. Thank you for your reply.
At first, I understood that set.seed function affect to the selection of random number of ntree and mtry in random search.
But you mean that seed function affect to the trainControl’s result and train function result. right?
Correct. The whole algorithm evaluation procedure including fitting the model.
Hi Jason. you introduced good 2 method(grid, random search).
Is there another method to select best paramters??
I want to know that Even if I do not set the range of parameters, I can find the optimal parameters for the model. The random search eventually sets the number to use as the tuneLength argument….
Is there a way to find the parameters i want?
You can use an exhaustive search.
We often do not have the resources to find the “best” parameters and are happy to use “good” or “best found”.
Thank you!
But….What is the exhaustive search??
Is it function?? or just try many times as gird search??
An exhaustive search is like a grid search where the grid is every possible value:
https://en.wikipedia.org/wiki/Brute-force_search
Hi Jason. Thanks for your work. I am trying to run ‘Extend Caret’ part and it is unable to get the same output as you did, especially this:
> summary(custom)
> plot(custom)
Something is wrong in “summary(custom)”, almost the same as Bing mentioned , as I used custom$results. as Beth suggested before. the result is still wrong.
Could you please give further advise about this?Thank you!
What problem do you see exactly?
Hi Jason.
I never try Caret before and I am assuming the following line of code performs cross validation.
control <- trainControl(method="repeatedcv", number=10, repeats=3)
My question is why is cross-validation necessary since in random forest ,in its algorithmic philosophy, is already cross-validated.
We need a scheme to evaluate the skill of the model on unseen data.
We could use train/test split or k-fold CV.
Thanks for this blog post which gave me the confidence to go beyond Coursera ML course project requirements by daring to tune not just mtry parameter in a basic Forest model but also C parameter in a Support Vector Machine model with an radial basis kernel. Even tried plotting the effects of mtry and ntree settings on OOB error:
https://rpubs.com/DrFreedy/WeightLiftingExecisePredictiveModel
Now following you on Twitter, and inviting you to connect on LinkedIn, too. 🙂
Well done!
Hi,
I have given the code as below
round5_train_CV<-train(SalePrice~.,data=TrainData_split,method="rf",
trControl=trainControl(method="cv",number=5),
prox=TRUE,allowParallel=TRUE)
There are 84 features in the train data set.. So, the maximum number of features considered at any point is 84. However, I get the output as below with mtry as 145 and 288 which is strange (more than 84 features tried)..I am confused.. Please clarify
mtry RMSE Rsquared
2 47522.34 0.7675486
145 30352.25 0.8574420
288 30593.40 0.8540389
The algorithm is reporting error. The error of the predictive model is not related to the number of features (well, not directly related).
Not a question. Just wanted to say thank you for taking the time to share this. It was very helpful to me.
Thanks Julian.
The grid search tuning method worked really well. Great job Jason, collecting everything on one page is helpful.
I’m glad to hear that!
hi, I heard cross validation is not necessary for random forest, since we can use out of bagging error. In this demo, we use train function with control. could you give me some comments about it? Many thanks
Sure, I have read the same thing.
I try to keep my test harness consistent for all algorithms when spot checking, hence the use of CV.
Thank you for your reply! I see. I also heard using OOB errors may overestimate the accuracy. So in this sense, it maybe also interesting to tune it with CV except using ‘tuneRF’ from ‘randomForest’.
Hi,
I was wondering if you knew of a way to re-write the RF model to allow for tuning of the cutoff probabilities? For instance, if we had a dataset with unbalanced classes, is it possible to write a custom RF model where mtry was fixed at floor(sqrt(predictors)), and cutoff would iterate through a sequence of values such as .1,.2,.3… .9 for each class? So cutoff for the first iteration might be c(.25,.25,.5), second might be c(.3,.4.3) etc? The only “catch” is that the cutoff probabilities must add to to 1.
Good question.
I expect there are papers/code out there for a customized random forest for imbalanced data (e.g. with weighted sampling built in).
Hi,
I tried to grid search in Random Forest.
tunegrid_2 <- expand.grid(.mtry=c(1:7), .ntree=c(1000, 1500, 2000, 2500))
set.seet(1234)
RF_fit <- train(class~., data = tables, method = "rf",metric = "ROC",tuneGrid = tunegrid_2, trControl =control)
But I got error like this "Error: The tuning parameter grid should have columns mtry".
Thank you so much for your help.
I don’t know, sorry.
same error here!
Sounds like you need to add “mtry” to the list of hyperparameters that are being tuned.
Yes, I met the same problem. After searching many information, I found that only mtry could be listed and tuned in train method. ntrees could be not tuned at the same time. I don’t know how to tuned them at the same time?
Hi Melody…Please clarify your question so that I may understand what you are seeking to accomplish and better assist you.
Hello,
Thanks for the code. I tried the customRF implementation in caret and it runs, but doesn’t return the model resampled performance measures.
Warning message:
In nominalTrainWorkflow(x = x, y = y, wts = weights, info = trainInfo, :
There were missing values in resampled performance measures.
Any ideas?
Thanks.
Hi Jason,
Thanks for your blog. This is very helpful.
I am evaluating the performance of several approaches (linear regression, random forest, support vector machine, gradient boosting, neural network and cubist) for a regression related problem. I am using caret package for this, and have been using 10-fold cross validation approach. To compare the performance of the models, I am using two metrics R2 and RMSE. Are there any other metrics that can be used to compare these models? In addition to these two metrics, I am suggested to use some information criterions to evaluate the model performance. The only information criterions I am aware are AIC and BIC, but I am not sure if that can be used with Caret package. Do you have any suggestions?
My other question is about rationale for splitting the data. I am dealing with 250 records. I split the data into 80 (train) and 20 (test), as I find 80:20 is the most commonly used number. Can you please recommend what split is good for what scenario? If you have to respond to question like “why did you split the total data at 80:20”, what would be your response? Are they are source (References) that I can cite. I need to explain someone
My another question is about stepwise regression versus genetic algorithm to address a problem of multi-collinearity. I have extensively used stepwise regression, but have not used genetic algorithm. Are you familiar with these? If you are, can you help me compare them in terms of their pros and cons?
Any suggestions on these would be highly appreciated. Thanks.
Yes, there are many metrics you can use. Think hard about the goals of the project and choose metrics that help you to show/not show you are meeting those goals.
That split is fine, but may not be needed if you are using k-fold cross-validation to estimate model skill.
You can perform a sensitivity analysis to show how the statistical properties of the same change with sample size to help support a chosen sample size. Might not have any real impact though, e.g. just hand waving.
Yes, I’d recommend testing a suite of different feature selection methods, build a model from the results of each and double down on what works best. If you have resources, try all subsets of features.
Thanks Jason for your response. Can you please suggest any example that illustrates the use of AIC or BIC or other information criterion for evaluating regression models’ built using CARET package.I have been asked to do this, but don’t know how to do it.
Same with the genetic algorithms. Any examples would help. Thanks.
Thanks for the suggestion.
Hi Jason,
Thanks for your blog. This is very helpful!
I want to ask about what your physical configuration do you use to tune model in Extend caret item? You said that it spend 1-2 minutes but I wait up to 2 hours to complete my process. My physical configuration is (core i7-3720QM RAM 8GB
That should be fine. Perhaps you ran out of RAM or the code is not using all cores?
Hi sir!
Thanks for the very helpful blog!
I want to ask you where did the accuracy score be obtained in caret package? Confussion matrix or from data out of bag?
And then, I have some question off the topic. I know that random forest was built more for prediction. But, can we make random forest more interpretable? Or is there any package that we can use to get sample of random forest tree? Hopefully you can help me answer the question
I have more on metrics in caret here:
https://machinelearningmastery.com/machine-learning-evaluation-metrics-in-r/
Generally, we are not interested in making ML models interpretable, I write about this topic here:
https://machinelearningmastery.com/faq/single-faq/how-do-i-interpret-the-predictions-from-my-model
Hi Jason,
once I’ve found the best parameters and want to validate the model on a set (previously separated and not used in the tuning process), can I just take the best model found and trained in the tuning process or should I train the model once again with the best parameters? I’ve used tune.wrapper from e1071 for SVM and NNET, and according to the e1071 doc, you can access the best model, which was trained on the whole training data after finding the best parameters, however I see some differences in performance between the model taken from the tuning and a model, which is trained again from the beginning. I would be very grateful for your help on this.
(And thank you for this amazingly useful site)!
It is your choice of course.
I would re-fit the model on all training data with the best hyperparameters and evaluate it on the hold out set.
Ok, thank you very much!
Sir, I used random forest for my classification method. I evaluated the model in the data train and data test. In data train, i got 100% on accuracy. Any reason why can this happen?
The problem may be too simple and ML is not required.
Hi Jason,
Thank you for the nice post on tuning parameters for random forest. I am trying test my model, using repeated cross validation, 10 folds, 3 times. So much seed should I set it for?. Is it 31? Please advice on setting the seed number?
Thank you
Priya
Use the default m_tree, the sqrt of the number of features.
HI Jason,
I am great fan of your work and blog..I have a question,
tuning the parameter is only for random forest model? If i want to develop any logistic model, can i tune parameters for logistic model also?
Sincerely,
Sayam
You sure can!
Generally, GridSearch and Algorithmic Tuning will provide a different result, isn’t? Then how to differentiate and choose them?
Choose a configuration that gives the best performance on average, results in a stable model, and/or results in a simple model.
HI Jason, in the caret package with RF you can obtain a variable importance plot. In regular RF this is done by Gini decrease–does the caret RF variable importance plot also present the gini decrease? The documentation for the caret package doesn’t explicitly say this.
I’m not sure if the caret package can, but I expect the random forest package can. I don’t have an example at hand.
I’m having a lot of trouble changing the customRF function to account for a new dataset. It is a dataset also found on UCI (https://archive.ics.uci.edu/ml/datasets/heart+Disease). It has 13 variables and the variable I want to predict is disease. Any advice for altering your function.
anyone
Sorry, I don’t have good suggestions, perhaps try posting your specific fault to stackoverflow or the R user list?
Why do you choose mtry=c(1:15). Is this because your predictor variables are in columns 1 through to 15 in your dataset?
Yes, it is the number of randomly chosen features that may be selected from eat each spit point.
HI , when i running the same for RF logistic classification, I am getting below error.
Error in metric %in% c(“RMSE”, “Rsquared”) : object ‘metric’ not found
Sorry to hear that, I don’t know the cause, perhaps try posting to stackoverflow?
next what i should do, after getting the tuning parameter ntree and mtry .
should i go back to my RF model and build it again using tuning parameters?
Tuning those two parameters alone is probably enough.
Thanks so much sir, this blog helps me a lot. But may I have a question?
I have a problem in part ‘Extend Caret’ , the error message that I get from R is shown below.
Something is wrong; all the Accuracy metric values are missing:
Accuracy Kappa
Min. : NA Min. : NA
1st Qu.: NA 1st Qu.: NA
Median : NA Median : NA
Mean :NaN Mean :NaN
3rd Qu.: NA 3rd Qu.: NA
Max. : NA Max. : NA
NA’s :30 NA’s :30
Error: Stopping
In addition: Warning message:
In nominalTrainWorkflow(x = x, y = y, wts = weights, info = trainInfo, :
There were missing values in resampled performance measures.
What should I do then? Your help would means a lot for me.
I had the same error today, and later I found out it’s because I didn’t library(randomForest). Hope this would be helpful for other people who are facing the same error.
Thanks for sharing!
Hi Jason,
When i run the customRF code :
customRF$parameters <- data.frame(parameter = c("mtry", "ntree"), class = rep("numeric", 2), label = c("mtry", "ntree"))
customRF$grid <- function(x, y, len = NULL, search = "grid") {}
customRF$fit <- function(x, y, wts, param, lev, last, weights, classProbs, …) {
randomForest(x, y, mtry = param$mtry, ntree=param$ntree, …)
}
customRF$predict <- function(modelFit, newdata, preProc = NULL, submodels = NULL)
predict(modelFit, newdata)
customRF$prob <- function(modelFit, newdata, preProc = NULL, submodels = NULL)
predict(modelFit, newdata, type = "prob")
customRF$sort <- function(x) x[order(x[,1]),]
customRF$levels <- function(x) x$classes
# train model
control <- trainControl(method="repeatedcv", number=10, repeats=3)
tunegrid <- expand.grid(.mtry=c(1:4), .ntree=c(100, 500, 1000))
set.seed(42)
custom <- train(SOH~., data=TrainSet, method=customRF, metric=metric, tuneGrid=tunegrid, trControl=control)
summary(custom)
plot(custom)
At this point:
custom <- train(SOH~., data=TrainSet, method=customRF, metric=metric, tuneGrid=tunegrid, trControl=control)
I get this error :
Error: some required components are missing: library, type
What does this mean ?
Also, does the customRF code need to be changed ? or can we just copy paste it?
Sorry, I have not seen this error before.
You could try a search/post on stackoverflow?
Another package worth of trying is “DEoptim” using the different evolution algorithm for a “smart search”, which work for both floating and integer parameters.
Nice, thanks for sharing!
When I ran:
rf_default <- train(WOODLAND~., data=datasetgeo, method="rf", metric=metric, tuneGrid=tunegrid, trControl=control)
Output was:
Error in
contrasts<-(*tmp*, value = contr.funs[1 + isOF[nn]]) :contrasts can be applied only to factors with 2 or more levels
What do you suppose the issue is? WOODLAND values are observations/counts varying from 0-125. Predictors are various environmental variables for a total of 104.
Sorry to hear that. I’m not familiar with that dataset, sorry.
Perhaps try posting on cross validated?
The code I ran is from the code you provided, run with my dataset and it didn’t run. Should predictors in x dataset be all factors or all numeric or does it matter? I was able to run all lines of code as you shared until the train function and the output states as I shared above, that “contrasts can be applied only to factors with 2 or more levels”. I am not sure what factors with 2 or more levels, means. Should the y data/column values be a factor or does it matter? Thank you for your time and response.
Hi Jason
Thanks for posting, it is really helpful.
After I successfully tuned my parameters (i.e. found the best parameter combination), how do I proceed with the actual prediction on my unseen test data?
Do I take the best parameters and use them as input for the randomForest function:
regr <- randomForest(x = X_train, y = y_train , mtry = 1, ntree = 10)
predictions <- predict(regr, X_test)
or is there a way to make the prediction directly with the newly created customRF algorithm?
Yes, typically the predict() function is used.
Hi Jason! Thank you so much for your amazing posts! Helps a lot! I am trying to find a way to tune the max tree depth in the random forest method in caret but I don’t see any relevant tuning parameter in the subject method. The only tuning parameter is the ‘mtry’. Besides, I also used a for loop to try different values for the trees. Is there a way to tune the max tree depth as well?
I’ll be obliged for your kind cooperation.
Perhaps you can manually specify the parameter as part of the grid search?
The caret documentation might have more information:
http://topepo.github.io/caret/index.html
Learned a lot from this. I would like to ask how to create a new algorithm for regression and not classification under the Extent caret. I realized the customRF in the lecture is for classification and not regression cos it was giving me “Error: wrong model type for regression” when I tried it. please, can you kindly send me the code for customRF regression or tell me what to edit from the one you did. Thanks
Hey Jason
I have found your blog very inspiring!
And teh customRF works well for regression with so e modification.
I just have one qusetion:
To make random forest regression on time series data, we need stationarity in the time series before we make the random forest forecasting and tuning the parameters, right?
Do we also need to remove trend and seasonality? As I have understand the random forst can handle these things in the code? It is only in ARIMA and so on we have to take these tings into account?
Thanks
Thanks!
Yes, it is a good idea to make the data stationary prior to fitting a model.
Yes, trend and seasonally stationary.
Try with and without making the series stationary and compare results.
This is totally a helpful content. However, for a large input it takes a lot time, just be careful before you copy+paste it! Thank you Jason!
Thanks!
Hi Jason,
in my PC customRF doesn’t work in multicore… do you confirm that do you have the same problem?
Thanks
Diego
Sorry to hear that.
Perhaps try running single core for now?
Integration…
It works with:
cores <- makeCluster(detectCores())
registerDoParallel(cores = cores)
but not with:
cl = makePSOCKcluster(detectCores())
registerDoParallel(cl)
on centos server.
I don't know why.
Jason. Why did you use seed <- 7 in the example? Would you explain further?
No good reason, you any number you like.
Dear folks
thank you so much for your wonderful presentation and discussion which makes it more meaningful.
I am in search of the “use of NI(nature-inspired) algorithm to tune XGBoost in R”.
with due respect Kindly share.
regards
Suraj
You’re welcome.
Sorry, I cannot help.
hi jason
when i trying model tuning
i saw this error ;
Error in data[, all.vars(Terms), drop = FALSE] :
msgid “subscript out of bounds”
can you help me ?
Best Regards
Sorry to hear that. I have not seen this error before.
Perhaps try posting your code and error message on stackoverflow.
Hi Jason,
I was wondering if you can suggest a method to calculate the minimum number of samples (or columns) that require a random forest model. Do you know if there is a rule of thumb about it?
Thank you in advance.
More is better generally, this may help:
https://machinelearningmastery.com/much-training-data-required-machine-learning/
Hi Jason,
Nice post! In your custom script, you tried several values for ntree for tuning: 1000, 1500, 2000, 2500. I was wondering is there theoretical range for ntreer? why do you choose these numbers for tuning? How can we understand this hyperparameter? Is it true that more tree is better? It would be super nice if your can provide reference, thank you in advance!
No, keep increasing trees until performance stops improving. More is better, but also slower.
Hi Jason,
Thank you for your suggestions! In my project, I tried ntree = 500, 1000, 1500, 2000, and 2500, but the model performance is not so different when I chose different ntree, but it seems mtry matters more. In this case, do you think it is safe just choose ntree = 500? Thanks again!
Sure.
Awesome, thank you Jason!
You’re welcome!
Hi Jason,
Thank you for this very interesting and educational tutorial. I have two questions, the first is how to get the result of each iteration (number).
control <- trainControl(method="repeatedcv", number=10, repeats=3) or
control <- trainControl(method="LOOCV", number=10)
and run this model in our topic
rf_default <- train(Class~., data=dataset, method="rf", metric=metric, tuneGrid=tunegrid, trControl=control)
How to get each run results ie rf_default 1…. rf_default 10
The second one is how to add the weight in the search grid
tunegrid <- expand.grid(.mtry=c(3, 4 ,5 ,6 , 7),
.ntree = c(500, 1000 ,1500,2000),
.nodesize = c(5,10,15),
.maxnodes = c(10,20,50),
.classwt = list(c(1,1),c(1,3),c(1,5)))
Thank you in advance
Sidy
You’re welcome.
Good question, I’m not sure. Perhaps check the documentation for the package?
How do you weight a grid search? It does not make sense to me, sorry.
Thank you for your response. So nn the case of unbalanced data in the grid search for optimal parameters, we try to give greater weight to the minority class.
Typically a model is weighted (e.g. during training), not the search process.
Hello Sir, I saw your code for tuning the number of trees in caret package for the randomforest algorithm. Here I have one problem, you gave the extension code for the classification problem. Please help me how to make for the regression type of problems
Thanks for the suggestion, I may prepare an example in the future.
Hi Jason,
Did you made the example for regression ?
It will help me a lot 😀
Thanks
Hi Chloe…I would highly recommend the following resources to help add clarity on many questions you may have:
https://machinelearningmastery.com/r-bundle/
Hi Jason,
Great tutorials on machine learning. I was wondering if it’s possible to plot ROC curves on
n-fold cross-validation test in the above example on iris dataset.
Any help will be highly appreciated.
Thank you
Thanks!
No, typically ROC curves are plotted for a single test set.
Hi Jason and all,
Great tutorial! I have learned loads on tuning random forest.
I was wondering is there a reason why tuning mtry and ntree will have the largest effect on our model’s accuracy?
Any help will be highly appreciated.
Cheers!
They are the two hyperparameters that impact the algorithm the most.
Hi, Do you a a script that covers the tuned parameters for Caret ranger and Random Forest Rule-Based Model implementation of random forest
I’m not sure sorry, perhaps try searching on the blog or adapting the above example.
Hi, Jason.
Thanks for the tutorial, but I am having trouble replicating the precise values that you are getting. What version of R and caret was this example run under?
Thanks for making this.
The version should not matter. Probably you will never get the exact value as shown because of this: https://machinelearningmastery.com/different-results-each-time-in-machine-learning/
What does exactly mtry function does? Can you give simple example.
“mtry: Number of variables randomly sampled as candidates at each split.”
That is a hyperparameter in random forest algorithm.
Nice article and easy to follow. You are talking about interaction effects between number of trees and the value of ntree. What exactly do you mean? Could it be for example the ntree and RMSE (or MSE, R2 etc)? Is there a way to visualize (in a graph for example) these interactions?
Hi Nikolas…Yes, the interaction can be measured in RMSE. This is the preferred method.
Helpful but the custom tuning is poorly explained. There’s no explanation of what “wts”, “lev”, “last”, etc. mean and how to even use them. I want to incorporate class or case weights into this but it has been impossible to figure out.
Thank you Trenton for your feedback!