Selecting the right features in your data can mean the difference between mediocre performance with long training times and great performance with short training times.
The caret R package provides tools to automatically report on the relevance and importance of attributes in your data and even select the most important features for you.
In this post you will discover the feature selection tools in the Caret R package with standalone recipes in R.
After reading this post you will know:
How to remove redundant features from your dataset.
How to rank features in your dataset by their importance.
How to select features from your dataset using the Recursive Feature Elimination method.
Kick-start your project with my new book Machine Learning Mastery With R, including step-by-step tutorials and the R source code files for all examples.
Let’s get started.
Confidence Intervals for Machine Learning Photo by Paul Balfe, some rights reserved.
Need more Help with R for Machine Learning?
Take my free 14-day email course and discover how to use R on your project (with sample code).
Click to sign-up and also get a free PDF Ebook version of the course.
Remove Redundant Features
Data can contain attributes that are highly correlated with each other. Many methods perform better if highly correlated attributes are removed.
The Caret R package provides the findCorrelation which will analyze a correlation matrix of your data’s attributes report on attributes that can be removed.
The following example loads the Pima Indians Diabetes dataset that contains a number of biological attributes from medical reports. A correlation matrix is created from these attributes and highly correlated attributes are identified, in this case the age attribute is removed as it correlates highly with the pregnant attribute.
Generally, you want to remove attributes with an absolute correlation of 0.75 or higher.
Identify highly correlated features in caret r package
R
1
2
3
4
5
6
7
8
9
10
11
12
13
14
15
# ensure the results are repeatable
set.seed(7)
# load the library
library(mlbench)
library(caret)
# load the data
data(PimaIndiansDiabetes)
# calculate correlation matrix
correlationMatrix<-cor(PimaIndiansDiabetes[,1:8])
# summarize the correlation matrix
print(correlationMatrix)
# find attributes that are highly corrected (ideally >0.75)
The importance of features can be estimated from data by building a model. Some methods like decision trees have a built in mechanism to report on variable importance. For other algorithms, the importance can be estimated using a ROC curve analysis conducted for each attribute.
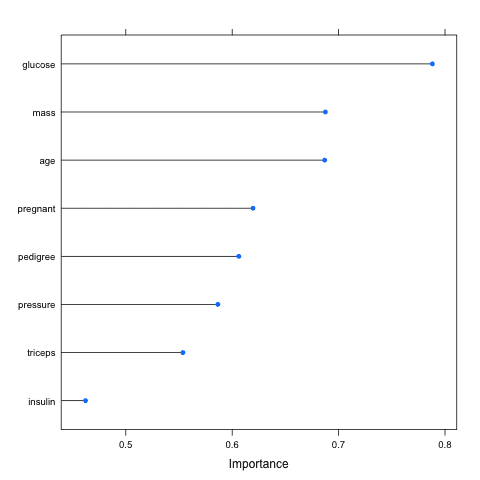
The example below loads the Pima Indians Diabetes dataset and constructs an Learning Vector Quantization (LVQ) model. The varImp is then used to estimate the variable importance, which is printed and plotted. It shows that the glucose, mass and age attributes are the top 3 most important attributes in the dataset and the insulin attribute is the least important.
Rank features by importance using the caret r package
Rank of Features by Importance using Caret R Package
Feature Selection
Automatic feature selection methods can be used to build many models with different subsets of a dataset and identify those attributes that are and are not required to build an accurate model.
A popular automatic method for feature selection provided by the caret R package is called Recursive Feature Elimination or RFE.
The example below provides an example of the RFE method on the Pima Indians Diabetes dataset. A Random Forest algorithm is used on each iteration to evaluate the model. The algorithm is configured to explore all possible subsets of the attributes. All 8 attributes are selected in this example, although in the plot showing the accuracy of the different attribute subset sizes, we can see that just 4 attributes gives almost comparable results.
Automatically select features using Caret R Package
R
1
2
3
4
5
6
7
8
9
10
11
12
13
14
15
16
17
# ensure the results are repeatable
set.seed(7)
# load the library
library(mlbench)
library(caret)
# load the data
data(PimaIndiansDiabetes)
# define the control using a random forest selection function
In this post you discovered 3 feature selection methods provided by the caret R package. Specifically, searching for and removing redundant features, ranking features by importance and automatically selecting a subset of the most predictive features.
Three standalone recipes in R were provided that you can copy-and-paste into your own project and adapt for your specific problems.
Thanks for an awesome post. Your writings always talk to the point of practical knowledge which i love, easy to understand !!. I think one thing you missed out in Recursive Feature Elimination or RFE. is to include a library “library(randomForest)”, bcoz when i tried to replicate it was unable to find the Random Forest package.
Hi,
I was trying to run importance of features from above posts but I couldnt.
I am receiving an error for package ‘e1071′. The command I used to install it is:
install.packages(“e1071”,dep=TRUE,type=’source’)
the error is :
ERROR: compilation failed for package ‘e1071’
This was a great read! Thank you! I do have one question. With my data set I performed the last two options (ranking by importance and then feature selection), however, the top features selected by the methods were not the same. Why would this be? Is one better than the other?
Thanks Jordan.
This is a good point. Different methods will select different subsets of features. There is likely no “best set” of features just like there is no best model. My advice is to model each subset of features and see what works best for your problem and your needs.
Applied machine learning is a process of empirical hypothesis testing – lots of trial and error.
Thanks for such a useful post.
I have one question about RFE method. I am not sure if I’ve got the point correctly because I wonder which method is used to build the model in each step and if it is possible to build the model using SVM in each iteration?
Your post is a very nice read – I’m new to caret and found it useful to get things running quickly. I am working on a p>>n classification problem, in particular I am not interested in a blackbox predictive model, but rather a more explanatory model, therefore I’m trying to extract sets of important features that can help to explain the outcome (I have additional data to validate the relationship between the extracted features).
I am wondering if it makes sense to run RFE with different models and extract the subset of important variables for fitting each respective model, and then find the intersection of the set of features. I’d expect that each model might produce different sets of features (with the most important ones shared), and that the sets of features for one model might not work as good for another type of model, so I’m not sure though.
What’s the best way to approach a problem like this? Thanks!
Great pics, but when running the code i found that rf feature selection would recommend 5 features as recommended, how to change the default setting? many thanks!!!
I have a question about the machine learning feature selection approach. You use the All dataset, doesnt need to Split into train and test subset? And make a model to training subset, and to see there the VarImp?
Hi. Great post! I have a doubt about using varImp for feature selection. I have already written an algorithm that runs randomForest for building a model on training set. Now I want to use varImp() to select only important features before applying randomForest. But varImp seems to build yet another model on the data to extract feature importance, which seems to be a bit counter-intuitive. Would you please explain me the significance of varImp before using randomForest to train a model on training data? How can I use varImp in such case?
I am working with the data from Lending Club that is made available to public on their website. The dataset has a significant number of non numerical columns (grade, loan status etc). I am assuming before I get to feature selection methods described above, I will have to map these non numeric data to numeric values. My question: is there a prescribed way for handling such a situation or is it okay to follow an ad hoc mapping scheme. My intent, of course, is to be able to get to the point where I can do an intelligent feature selection. Thanks
Amit
I follow your newsletter. They have saved me at the right times 2x! Thanks. Also, do any of these algorithms take into consideration normalization of the data?
I tried the code and i am trying to model only the features that are selected by the RFE algorithm. I get an error when i tried to use. Couldn’t figure out why it is giving an error
‘Error in eval(expr, envir, enclos) : object ‘diabetes’ not found’ at model (….) statement.
#Load the libraries
rm(list=ls())
library(mlbench)
library(caret)
#load the data
data(PimaIndiansDiabetes)
#define the control using a random forest selection function
control <- rfeControl(functions=rfFuncs, method='cv', number=10)
#Split data
inTrain = createDataPartition(y=PimaIndiansDiabetes$diabetes, p=0.7, list=FALSE)
train <- iris[inTrain,]
test <- iris[-inTrain,]
attach(train)
#train the model
model <- train(diabetes ~ glucose + mass + age + pregnant + pedigree, data=train, trControl = train_control, method='lvq', tuneLength=5)
In Importance part, for instance in your case, the variable ‘Age’ ranked at 3rd place, but can I know it is positive or negative way? I.e. higher age will lead to more chance of diabete, or vice versa?
So I did the feature elimination as so :
control <- rfeControl(functions=caretFuncs, method="cv", number=10)
results <- rfe(mydata.train[,1:23], mydata.train[,24], sizes=c(2,5,8,13,19), rfeControl=control , method="svmRadial")
print(results)
This is a good result for me , almost 65% . But when I try now to do a training
with :
svm.model <- train(OUTPUT~.,data = mydata.train,method = "svmRadial",trControl = trainControl(method = "cv",number = 10),tuneLength = 8,metric="Accuracy")
, I can't get that accuracy . What model and parameters is the recursive elimination using ?
Hi!
The blog is really informative.Thanks!
Would be nice to see some recommender system examples like supermarket basket analysis and recommendations to them in R.
How it works.
Could you please add a page for this?
great posting! I tried to use my dataset named R_feature_selection_test.csv
but it didn’t work. I got an error message as below. Could you please give me advice?
data(R_feature_selection_test)
Warning message:
In data(R_feature_selection_test) :
data set ‘R_feature_selection_test’ not found
Hi Thanks for the great blog. My outcome is coded disease absent = 0, disease present = 0. Input contains both binary and continous variables. Binary variables are coded in 0 and 1.
I am getting the following error messages when I try lvq:
Error in train.default(x, y, weights = w, …) :
wrong model type for regression
and later when I try rfe, I get the folllowing warning:
In randomForest.default(x, y, importance = first, …) :
The response has five or fewer unique values. Are you sure you want to do regression?
i guess the question is: does lvq and ref in caret work for categorical data? Has anyone applied these models to datasets containing catogerical variables?
both lines work now when i recoded the ouput as “yes” , “no” instead of 1 /0 . Make sure to do as.factor in case the recoded output is stored as character format
Hi I also met this kind of problem however, my dependent variables is not “yes” ‘no’. It is some number. Can I also use this to do the feature selection?
I would like to ask how we can using t-test for feature selection. I have 12 attributes (variables) and one class variable(labels). Please guide me , how I can use t-test for variable selection?
Thank you for the extremely reproducible code. It worked well for me and I could adapt it to my current problem as well. Since you have recently responded to a post, I was hoping you could address this very basic and general query I had regarding RFE.
My belief so far was that RFE is an additional tool to supplement the findings from trained models using the train function in caret or the randomForest function in the random forest package until I read a paper recently which did not explicitly say but hinted that feature selection is done prior to training the random forest model. So which scenario would be the appropriate use case for RFE?
Also my accuracy using the RFE function is different than the accuracy I get by tuning the model for ROC. What might be the reason for this?
could you please build a model with feature selection using SVM-RFE followed by Genetic algorithm followed by permutation test and then any other model using R code
great posting! I tried to use my dataset named R_feature_selection_test.csv
but it didn’t work. I got an error message as below. Could you please give me advice?
data(R_feature_selection_test)
Warning message:
In data(R_feature_selection_test) :
data set ‘R_feature_selection_test’ not found
My original dataset has missing values in some of the columns but to use rfe() I need to treat those missing values, If I treat missing values my feature selection would be based on this but in the final model I am not treating missing values for those columns, wouldn’t my results be skewed?
Also is there a way to decide number of iteration in the algorithm or we just try it for various numbers and then try to come up with an optimum number
I am trying to use the rank features by importance and I keep getting the error: Error in na.fail.default(list(SalePrice = c(208500L, 181500L, 223500L, :
missing values in object
My code looks like this:
model <- train(SalePrice~., data=train_data, method="lvq", preProcess="scale", trControl=control)
With train_date being the name of my data frame that has all my data. Would you know why I keep getting this error?
I am trying to run the RFE on a dataset with approx 1000 data entries and 17 variables where several of the variables are categorical. I am not getting an error, however, the process just seems to keep running without stopping or coming to any conclusion.
Do you know if this could be because of the size of my dataset or the type of data?
Thanks for the spot on post.
However, I’m getting the same problem (processing won’t end) and my variable are not categorical.
What might be the problem?
Cross-validation allows us to make decisions (choose models or choose features) by estimating the performance of the result of the choice on unseen data. This is more robust than reviewing the performance on the entire training dataset alone.
It is used to choose which model to build, prior. Once chosen, the model can be constructed using all available data.
I tried to fix ntree and find different mtry.
The code works well, but resamples have same ranges of accuracy by different mtry values..not possible. .something doesnot work!!!
Thanks for response
your post is really helpful,thank you so much for those information, it works only for quantitative variables i need to know how to calculate the matrix with qualitative variables.
Is there a way to make findCorrelation() flag attributes that are strictly above cutoff? I see from my use case that the absolute correlation value is compared against cutoff, as in the verbose output snippet below (cutoff=0.9):
Combination row 12474 and column 12484 is above the cut-off, value = 0.922
Flagging column 12474
Combination row 12476 and column 12484 is above the cut-off, value = -0.913
Flagging column 12476
Hi Jason,
I am assuming that before I get to using the above feature selection methods, I’ll have to convert these non numeric values to numeric values (e.g., converting “W” for wins to “1”s and “L” for losses to “0”s). Is that right? Or, can I leave those columns with non-numeric values as is. My intent, of course, is to be able to get to the point where I can do an intelligent feature selection.
Thank you for a great post! I am wondering how to apply the same technique to a large data set in order to keep all features and extract the required rows (as a subset or sample) that are highly correlated. Say we start with a matrix of 1000000 rows and 15 variables, I want to extract 20 rows that are most or least correlated. What technique (or algorithm) would be best? Thank you in advance!
Hi Jason,
Thank you very much for the explanation. Now I’m trying to use it on another dataset, but I’m running into a bit of an issue. My dataset had 962 features and 144 observations. My response is a factor with 4 levels and all other variables are either numeric or integer. So far, I’m able to run the first part, but I’m getting an error when I build my model:
library(mlbench)
library(caret)
set.seed(233)
correlationMatrix <- cor(dataset[,3:962])
highlyCorrelated <- findCorrelation(correlationMatrix, cutoff = 0.5)
control <- trainControl(method = "repeatedcv", number=10, repeats=3)
model Error in seeds[[num_rs + 1L]] : subscript out of bounds
It’s the first time I’ve encountered this error and I didn’t find any information that could help me so far. I was wondering if you had a hint for me.
Thank you!
Hi Jason! I am using the Feature Selection, copy and adapting the code to my data and instead of giving me the results according to the ACCURACY, it gives me acording to the RMSE. If I use the selected variables in a multiple linear regression this results in a different RMSE value. Could you help me to change this plot to accuracy instead of RMSE ? Thanks!
If your problem is a regression problem (predicting a real value), then you cannot calculate accuracy, you must calculate a prediction error, like RMSE.
I have a question: are there any limitations for the number of features vs. number of observations for machine learning algorithms? E.g can I run SVM or random forest with more feature than observations? For example, for linear regression, I have read that (as a rule of thumb), the number of features better not exceed the 1/5 of the number of observations to avoid overfitting.
Help i got this error results <- rfe(data[,1:71], data[,72], sizes=c(1:71), rfeControl=control)
Error in { : task 9 failed – "Can't have empty classes in y."
> I am getting problem while installing Fselector command, i am not getting whats the matter
plz help
install.packages(“FSelector”)
Error in fetch(key) :
lazy-load database ‘C:/Users/ux305/Documents/R/win-library/3.4/FSelector/help/FSelector.rdb’ is corrupt
> library(FSelector)
Error: package or namespace load failed for ‘FSelector’:
.onLoad failed in loadNamespace() for ‘rJava’, details:
call: fun(libname, pkgname)
error: JAVA_HOME cannot be determined from the Registry
Hi Jason, this is a very good post and i am a huge fan because all your work make ML very easy to handle. just wondering if any of your posts goes further to do the main classification task, i.e training the selected rfe attributes?
In the Feature Selection, when you used plot(results, type=c(“g”, “o”)) code to make an accuracy vs Variables plot, is there any way we can get the actual names of variables instead of variable numbers?
Thank you in advance for your help.
Hi Jason. If I’m using recursive feature elimination, how could I obtain a ROC curve for the best model? Like if I had 10 variables and it selected 5, how do I plot the curve for this specific model?
HI jason,
I have one question. I have dataset with 1600 features. I have applied lvq.
It is giving 20 imp features. But I want mininum 60 features. how to get that using varimp? plot(importance) is so clumsy that I am not getting the names of the features.
HI Jason, I may have posted this on a different thread by accident, but I was curious about the difference in the caret package Var Imp plot and the regular Random Forest Var Imp Plot. In regular RF, the variable importance is determined by gini decrease, whereas it seems that what you are saying here is that the caret uses a different method–not a gini decrease. The code for running both is the same in both packages (VarImp)–so I’m a bit confused…..
Oh I see, thank you…. but the plot we produce from caret random forest is an importance plot based on 1-100, whereas using random forest alone gives us a mean accuracy decrease and mean gini decrease for importance. I guess that’s where I was confused because I had assumed that caret was using essentially the RF package. But when I run the importance plots in both, they don’t seem to give me the same statistics (even if the order of variables is the same).
Thank you for this post! It helps a lot. I ran the model as you instructed. It shows that my 21 variables can be narrowed down to 8. It lists variables 1-7 and 21. Would those numbers correspond to the order in which they appear in the data frame? Thanks in advance!
Why is the use of removing features that are correlated with eachother? And if I find 2 features that are highly correlated do I remove only one of them or both? And why is nobody asking this question?
Thanks for the great post. I have a question if for example I have a classifier problem and let’s say I want to choose an algorithm.
Do I use RFE first, I get the important features and then based on them I run all possible algorithms (e.g. logistic regression, kNN, Decision Trees…) and choose the best one?
OR Do I choose features within each algorithm (e.g. forward selection in logistic regression, RFE in Decision trees etc) and then at the end compare the accuracy of all algorithms and choose the best one?
Thank you for sharing a good method. I have a question. If i want to know a detailed combination of variables with different number of variables, how can i do?
For example, I have 11 variables. When the number of variables is 7, the model is optimal and I can know which variables are there. I want to know what the detailed variable is when the number of variables is 5.
I have a question with regards to the correlation – the highly correlated features i find with this function…
# Find attributes that are highly corrected (ideally >0.75)
highlyCorrelated <- findCorrelation(correlationMatrix, cutoff=0.75)
… do I need to take out all of them or should I only tak out half, because then, they do not correlate with something anymore. Or are these the ones that correlate high with ALL the variables in my dataset? Thank you for the help.
Hi Jason,
Great post, thank you very much.
I had one question regarding the “Recursive Feature Elimination”. Here it shows that with 4 features we get almost the same performance as with 8, is there any way to see which 4 variables those are?
could you share the advantage and disadvantages of RFE, please? I have used it and also used other example xgboost and GA to compare the capacity of each. in some cases, RFE performed well and in other xgboost and GA featured models got higher accuracy.
Hi
Thank you for your nice and explicit explanation.
What if I want to do recursive feature selection for other ML algorithms in caret package such us SVM, ANN, KNN?
I saw a free function called “caretFuncs”. Can i use this function for all machine learning methods that are embedded with caret package including for the random forest classifier? Thank you in advance.
alternative hypothesis:truecorrelation isnotequal to0
95percent confidence interval:
0.49256520.5922775
sample estimates:
cor
0.5443412
So I am wondering after the correlation matrix we have observed here with 4 features which are highly correlated. Do we remove 3 out of 4 of theses features before starting a new model of prediction?
I believe there is a procedure for this, for removing redundant inputs. From memory, I think each feature is assigned a scoring based how correlated it is with all other features, and a subset of the most correlated inputs are removed.
Dear Jason,
Thank you for your work. I have a question related to feature selection part after varImp(). After seeing the most important features for my prediction, suppose I want to select first 4 of them as my predictors and continue with the random forest. Could you help me with that?
Hi Jason,
I have nonlinear time series dataset which contains numerical data and I just pass model <- train(EGT~., data=df[1:10], method="lvq", preProcess="scale", trControl=control)
and it obtains the Error: wrong model type for regression.
I hv no idea. Also, how to cal the non-linear corr?!
I have got the error. Please help me, how can I solve the problem?
results <- rfe(x,y, sizes=c(1:13), rfeControl=control , method="svmRadial")
Error in { : task 1 failed – "missing value where TRUE/FALSE needed"
In addition: There were 50 or more warnings (use warnings() to see the first 50)
Thanks for your valuable information. I am doing prediction analysis using ANN, RF, SVM, KNN, NB and XGB. Where i have used caret package to calculate the feature importance for SVM, KNN and NB, while for ANN, RF and XGB, i have used neuralnetwork, ranomforest and xgboost packages, respectively. My question is, how these packages select the ranks the different parameters because the weight of each parameter is not the same with all 4 packages. Thanks
I would like to tell you that I used the support vector regression model using the caret package. For my project, I also need to consider the importance of independent variables.
Could you please tell me, how ‘VarImp’ function in the caret package works for models such as SVR, where no built-in importance score is implemented, to determine the importance of independent variables?
Hi James, thanks for such a clear tutorial!
I’m struggling to get this to work on my data which has a mix of numerical values and hot one encoded data. Everything works when I only use the numerical values, but when I add in the hot one encoded data (ie. 1s and 0s), I get ‘Error: wrong model type for regression’. Do you know how I can fix the issue?
Thanks so much!


Thanks for an awesome post. Your writings always talk to the point of practical knowledge which i love, easy to understand !!. I think one thing you missed out in Recursive Feature Elimination or RFE. is to include a library “library(randomForest)”, bcoz when i tried to replicate it was unable to find the Random Forest package.
Keep writing its helping lot !!! 🙂
Thanks.
Hi,
I was trying to run importance of features from above posts but I couldnt.
I am receiving an error for package ‘e1071′. The command I used to install it is:
install.packages(“e1071”,dep=TRUE,type=’source’)
the error is :
ERROR: compilation failed for package ‘e1071’
I am using latest version of R 3.1.1.
Can anyone please help me in it.
> install.packages(‘e1071’)
trying URL ‘https://cran.hafro.is/bin/windows/contrib/3.6/e1071_1.7-2.zip’
Content type ‘application/zip’ length 1021699 bytes (997 KB)
downloaded 997 KB
package ‘e1071’ successfully unpacked and MD5 sums checked
The downloaded binary packages are in
Nice!
This was a great read! Thank you! I do have one question. With my data set I performed the last two options (ranking by importance and then feature selection), however, the top features selected by the methods were not the same. Why would this be? Is one better than the other?
Thanks!
Thanks Jordan.
This is a good point. Different methods will select different subsets of features. There is likely no “best set” of features just like there is no best model. My advice is to model each subset of features and see what works best for your problem and your needs.
Applied machine learning is a process of empirical hypothesis testing – lots of trial and error.
Thanks for such a useful post.
I have one question about RFE method. I am not sure if I’ve got the point correctly because I wonder which method is used to build the model in each step and if it is possible to build the model using SVM in each iteration?
Your post is a very nice read – I’m new to caret and found it useful to get things running quickly. I am working on a p>>n classification problem, in particular I am not interested in a blackbox predictive model, but rather a more explanatory model, therefore I’m trying to extract sets of important features that can help to explain the outcome (I have additional data to validate the relationship between the extracted features).
I am wondering if it makes sense to run RFE with different models and extract the subset of important variables for fitting each respective model, and then find the intersection of the set of features. I’d expect that each model might produce different sets of features (with the most important ones shared), and that the sets of features for one model might not work as good for another type of model, so I’m not sure though.
What’s the best way to approach a problem like this? Thanks!
Brilliant post and very well laid out. Thanks a million.
can we do feature extraction using caret package?
Great pics, but when running the code i found that rf feature selection would recommend 5 features as recommended, how to change the default setting? many thanks!!!
I have the same question. How can we plot all the variables instead of top 5?
I have a question about the machine learning feature selection approach. You use the All dataset, doesnt need to Split into train and test subset? And make a model to training subset, and to see there the VarImp?
Hi. Great post! I have a doubt about using varImp for feature selection. I have already written an algorithm that runs randomForest for building a model on training set. Now I want to use varImp() to select only important features before applying randomForest. But varImp seems to build yet another model on the data to extract feature importance, which seems to be a bit counter-intuitive. Would you please explain me the significance of varImp before using randomForest to train a model on training data? How can I use varImp in such case?
Thanks for the informative post.
I am working with the data from Lending Club that is made available to public on their website. The dataset has a significant number of non numerical columns (grade, loan status etc). I am assuming before I get to feature selection methods described above, I will have to map these non numeric data to numeric values. My question: is there a prescribed way for handling such a situation or is it okay to follow an ad hoc mapping scheme. My intent, of course, is to be able to get to the point where I can do an intelligent feature selection. Thanks
Amit
Hello James,
I follow your newsletter. They have saved me at the right times 2x! Thanks. Also, do any of these algorithms take into consideration normalization of the data?
Thanks for the useful information.
How can it be applied for svm?
thanks a lot for the wonderful information!
It seems feature importance works with LVQ method only for classification problems, but not for regression problems, doesn’t it?
Awesome ML post i’ve come across Jason !!
I tried the code and i am trying to model only the features that are selected by the RFE algorithm. I get an error when i tried to use. Couldn’t figure out why it is giving an error
‘Error in eval(expr, envir, enclos) : object ‘diabetes’ not found’ at model (….) statement.
#Load the libraries
rm(list=ls())
library(mlbench)
library(caret)
#load the data
data(PimaIndiansDiabetes)
#define the control using a random forest selection function
control <- rfeControl(functions=rfFuncs, method='cv', number=10)
#run the RFE algorithm
results <- rfe(PimaIndiansDiabetes[,1:8], PimaIndiansDiabetes[,9], sizes=c(1:8), rfeControl = control)
#summarize the results
print(results)
names(PimaIndiansDiabetes)
#list the chosen features
predictors(results)
#Plot the results
plot(results, type=c('g','o'))
PimaIndiansDiabetes$diabetes <- as.character(PimaIndiansDiabetes$diabetes)
PimaIndiansDiabetes$diabetes[PimaIndiansDiabetes$diabetes=='neg'] <- 0
PimaIndiansDiabetes$diabetes[PimaIndiansDiabetes$diabetes=='pos'] <- 1
PimaIndiansDiabetes$diabetes <- as.factor(PimaIndiansDiabetes$diabetes)
View(PimaIndiansDiabetes)
#Split data
inTrain = createDataPartition(y=PimaIndiansDiabetes$diabetes, p=0.7, list=FALSE)
train <- iris[inTrain,]
test <- iris[-inTrain,]
attach(train)
#train the model
model <- train(diabetes ~ glucose + mass + age + pregnant + pedigree, data=train, trControl = train_control, method='lvq', tuneLength=5)
#Summary of model
summary(model)
You need to work with “PimaIndiansDiabetes” dataset which is within Rstudio. Not the one (pima.indians.diabetes.data) given in this page.
Hey, I’m trying to plot the importance of the different variables, but calling
importance <- varImp(model, scale=FALSE)
gives the error
Error: (list) object cannot be coerced to type 'double'
Any advice what I'm doing wrong or how to debug this issue?
Thanks in advance!
Awesome post Jason. I have been following your blogs like a university course to get up to speed in ML.
In Importance part, for instance in your case, the variable ‘Age’ ranked at 3rd place, but can I know it is positive or negative way? I.e. higher age will lead to more chance of diabete, or vice versa?
So I did the feature elimination as so :
control <- rfeControl(functions=caretFuncs, method="cv", number=10)
results <- rfe(mydata.train[,1:23], mydata.train[,24], sizes=c(2,5,8,13,19), rfeControl=control , method="svmRadial")
print(results)
Recursive feature selection
Outer resampling method: Cross-Validated (10 fold)
Resampling performance over subset size:
Variables Accuracy Kappa AccuracySD KappaSD Selected
2 0.5100 -0.02879 0.05230 0.08438
5 0.5371 0.02703 0.05953 0.12621
8 0.5371 0.03630 0.07200 0.15233
13 0.5207 0.01543 0.05248 0.11149
19 0.5850 0.15647 0.07122 0.14019
23 0.6447 0.27620 0.06088 0.12219 *
This is a good result for me , almost 65% . But when I try now to do a training
with :
svm.model <- train(OUTPUT~.,data = mydata.train,method = "svmRadial",trControl = trainControl(method = "cv",number = 10),tuneLength = 8,metric="Accuracy")
, I can't get that accuracy . What model and parameters is the recursive elimination using ?
Hi!
The blog is really informative.Thanks!
Would be nice to see some recommender system examples like supermarket basket analysis and recommendations to them in R.
How it works.
Could you please add a page for this?
Thanks!
great posting! I tried to use my dataset named R_feature_selection_test.csv
but it didn’t work. I got an error message as below. Could you please give me advice?
data(R_feature_selection_test)
Warning message:
In data(R_feature_selection_test) :
data set ‘R_feature_selection_test’ not found
I am getting the same problem. Have you found any solution?
This is an old post, but just in case someone needs this:
You need to first import your data into R.
****
mydata <- read.csv("R_feature_selection_test.csv")
***
Thanks for sharing!
Hi Thanks for the great blog. My outcome is coded disease absent = 0, disease present = 0. Input contains both binary and continous variables. Binary variables are coded in 0 and 1.
I am getting the following error messages when I try lvq:
Error in train.default(x, y, weights = w, …) :
wrong model type for regression
and later when I try rfe, I get the folllowing warning:
In randomForest.default(x, y, importance = first, …) :
The response has five or fewer unique values. Are you sure you want to do regression?
Any idea what might be causing this?
i guess the question is: does lvq and ref in caret work for categorical data? Has anyone applied these models to datasets containing catogerical variables?
both lines work now when i recoded the ouput as “yes” , “no” instead of 1 /0 . Make sure to do as.factor in case the recoded output is stored as character format
Great ! Thanks
Hi I also met this kind of problem however, my dependent variables is not “yes” ‘no’. It is some number. Can I also use this to do the feature selection?
Yes. You might need to encode the factor as 0 and 1.
Hi Jason
Excellent work.
I would like to ask how we can using t-test for feature selection. I have 12 attributes (variables) and one class variable(labels). Please guide me , how I can use t-test for variable selection?
Thanks,
Just want to thank you for this accessible post!
You’re very welcome.
Hi Jason,
Thank you for the extremely reproducible code. It worked well for me and I could adapt it to my current problem as well. Since you have recently responded to a post, I was hoping you could address this very basic and general query I had regarding RFE.
My belief so far was that RFE is an additional tool to supplement the findings from trained models using the train function in caret or the randomForest function in the random forest package until I read a paper recently which did not explicitly say but hinted that feature selection is done prior to training the random forest model. So which scenario would be the appropriate use case for RFE?
Also my accuracy using the RFE function is different than the accuracy I get by tuning the model for ROC. What might be the reason for this?
Thanks a lot for your time,
Best,
Manasi
Normally you could perform feature selection then build your models.
As part of feature selection, you can build models, but only to inform you as to what features to select. These are not the final models.
Thanks, that confirms my doubt and will be helpful in further incorporating this method in the analysis,
Best,
Manasi
Glad to hear that Manasi.
Dear Jason,
could you please build a model with feature selection using SVM-RFE followed by Genetic algorithm followed by permutation test and then any other model using R code
Sorry Krishna, I don’t have the capacity to write this code for you.
Best of luck with your project.
Hi Jason
Thanks for the detailed note It is very helpful for fresher like me.I have a doubt that do we need to remove outlier before using above techniques.
Yes, often data cleaning is a good first step.
great posting! I tried to use my dataset named R_feature_selection_test.csv
but it didn’t work. I got an error message as below. Could you please give me advice?
data(R_feature_selection_test)
Warning message:
In data(R_feature_selection_test) :
data set ‘R_feature_selection_test’ not found
Hi Jason, Great Posting!!!
My original dataset has missing values in some of the columns but to use rfe() I need to treat those missing values, If I treat missing values my feature selection would be based on this but in the final model I am not treating missing values for those columns, wouldn’t my results be skewed?
It may be.
Try feature selection with the data with imputed missing values, then try feature selection with all records with missing data removed.
See which set of features result in the model with the best performance.
I hope that helps.
Alright, Thanks!
Also is there a way to decide number of iteration in the algorithm or we just try it for various numbers and then try to come up with an optimum number
Try various training lengths and see what works best.
Hi!
I am new to this whole programming thing.
I am trying to use the rank features by importance and I keep getting the error: Error in na.fail.default(list(SalePrice = c(208500L, 181500L, 223500L, :
missing values in object
My code looks like this:
model <- train(SalePrice~., data=train_data, method="lvq", preProcess="scale", trControl=control)
With train_date being the name of my data frame that has all my data. Would you know why I keep getting this error?
I’ve not seen this specific error Brittany. I wonder if it an issue with your data.
Perhaps try to cut back your data either rows or columns until your code begins to work – it might help unearth the cause.
Hi Brittany/ Jason,
Did you end up finding the solution to this? Apologies for any trouble.
Hi Jason
This is a great post, thanks.
I am trying to run the RFE on a dataset with approx 1000 data entries and 17 variables where several of the variables are categorical. I am not getting an error, however, the process just seems to keep running without stopping or coming to any conclusion.
Do you know if this could be because of the size of my dataset or the type of data?
Many thanks
Ciara
Hi Ciara, RFE might not be the best method for categorical inputs.
Try wrapping a tree method and see how that goes.
More on feature selection in general here:
https://machinelearningmastery.com/an-introduction-to-feature-selection/
Jason Hi
Thanks for the spot on post.
However, I’m getting the same problem (processing won’t end) and my variable are not categorical.
What might be the problem?
Perhaps cut your data back to a small set inline to help figure out the cause of the fault?
Hi Jason, thanks for an amazing explanation. I have few queries regarding the cross validation.
1. Why do we use cross validation exactly? Is it only to select the important feature? Or it has some other reason too?
2. When do we do the cross validation? is it before the model building or after the model building?
Hope to get a reply.
Thanks
Gaurav
Hi Gaurav,
Cross-validation allows us to make decisions (choose models or choose features) by estimating the performance of the result of the choice on unseen data. This is more robust than reviewing the performance on the entire training dataset alone.
It is used to choose which model to build, prior. Once chosen, the model can be constructed using all available data.
I hope that helps.
Hi,
Can you please explain how to perform Feature selection using genetic algorithm on Pima Indians Diabetes Dataset in R? If possible in SAS also.
Sorry, I don’t have an example of feature selection with genetic algorithms. At least not yet.
Thanks for sharing your knowledge, Jason. Excelent explanation.
You’re welcome Roberto, I’m glad you found it useful.
hi sir, is any tutorial for GA algorithm for feature selection in binary classification i am working on DNA and RNA datasets.
Sorry Asad, no tutorial on GA for feature selection yet, soon hopefully.
great post Jason.
I tried to fix ntree and find different mtry.
The code works well, but resamples have same ranges of accuracy by different mtry values..not possible. .something doesnot work!!!
Thanks for response
metric <- "Accuracy"
control <- trainControl(method="cv", number=10, search="grid")
tunegrid <- expand.grid(mtry=c(10, 20, 30, 40, 50))
modellist2 <- list()
for (mtry in c(10, 20,30, 40, 50)) {
set.seed(seed)
custom2 <- train(Class~., data=dataset, method="rf", metric=metric, tuneGrid=tunegrid, trControl=control, ntree=500)
key2 <- toString(mtry)
modellist2[[key2]] <- custom2
}
custom2
results2 <- resamples(modellist2)
summary(results2$values)
Good information!
I have two questions.
1. In varImp selection, when I implement that code, I can see an overall.
What is the overall??(like p-value, t-test …. what is it?)
2. And in the varImp() result, what variables have to be selected or removed?? what’s the criteria?
You can learn more about the function in the official doco here:
https://topepo.github.io/caret/variable-importance.html
your post is really helpful,thank you so much for those information, it works only for quantitative variables i need to know how to calculate the matrix with qualitative variables.
Good question, sorry I do not have an example at the moment.
Thank you for the post, Jason! Is there any packages (algorithms) for feature selection on nominal data?
I expect there must be, but I don’t recall off hand sorry.
Is there a way to make findCorrelation() flag attributes that are strictly above cutoff? I see from my use case that the absolute correlation value is compared against cutoff, as in the verbose output snippet below (cutoff=0.9):
Combination row 12474 and column 12484 is above the cut-off, value = 0.922
Flagging column 12474
Combination row 12476 and column 12484 is above the cut-off, value = -0.913
Flagging column 12476
Is there a way to not flag negative correlation?
thanks for your help!
It may work on the absolute abs() value.
Hi Jason,
I am assuming that before I get to using the above feature selection methods, I’ll have to convert these non numeric values to numeric values (e.g., converting “W” for wins to “1”s and “L” for losses to “0”s). Is that right? Or, can I leave those columns with non-numeric values as is. My intent, of course, is to be able to get to the point where I can do an intelligent feature selection.
Thanks in advance.
Lee
Generally yes, most methods expect to work with numeric values.
Hi Jason,
Thank you for a great post! I am wondering how to apply the same technique to a large data set in order to keep all features and extract the required rows (as a subset or sample) that are highly correlated. Say we start with a matrix of 1000000 rows and 15 variables, I want to extract 20 rows that are most or least correlated. What technique (or algorithm) would be best? Thank you in advance!
Interesting idea Mike. You may need to prepare some custom code for this task.
Hi Jason,
Thank you very much for the explanation. Now I’m trying to use it on another dataset, but I’m running into a bit of an issue. My dataset had 962 features and 144 observations. My response is a factor with 4 levels and all other variables are either numeric or integer. So far, I’m able to run the first part, but I’m getting an error when I build my model:
library(mlbench)
library(caret)
set.seed(233)
correlationMatrix <- cor(dataset[,3:962])
highlyCorrelated <- findCorrelation(correlationMatrix, cutoff = 0.5)
control <- trainControl(method = "repeatedcv", number=10, repeats=3)
model Error in seeds[[num_rs + 1L]] : subscript out of bounds
It’s the first time I’ve encountered this error and I didn’t find any information that could help me so far. I was wondering if you had a hint for me.
Thank you!
Sorry to hear that. I have not seen this error.
Perhaps try simplifying your code/run to help expose it.
Perhaps try searching stackoverflow/crossvalidated or even posting the issue there?
getting the same issue? did you solve it?
I have the same problm. did you solve it?
Hi Jason! I am using the Feature Selection, copy and adapting the code to my data and instead of giving me the results according to the ACCURACY, it gives me acording to the RMSE. If I use the selected variables in a multiple linear regression this results in a different RMSE value. Could you help me to change this plot to accuracy instead of RMSE ? Thanks!
If your problem is a regression problem (predicting a real value), then you cannot calculate accuracy, you must calculate a prediction error, like RMSE.
Hi Jason, thanks for these wonderful posts.
I have a question: are there any limitations for the number of features vs. number of observations for machine learning algorithms? E.g can I run SVM or random forest with more feature than observations? For example, for linear regression, I have read that (as a rule of thumb), the number of features better not exceed the 1/5 of the number of observations to avoid overfitting.
Thank you!
Generally, we prefer to have more observations than features. In fact perhaps 10x more obs than features or more.
Get at much data as you can is the best rule of thumb:
https://machinelearningmastery.com/much-training-data-required-machine-learning/
Thank you for your great posts! I like simple solutions with simple codes like these. These post was very useful for my project. Thanks a lot! Piroska
Thanks Piroska, I’m glad to hear that!
Hi Jason
Thank you for your post.
in your post, you have used a numeric data set.
Is it possible to apply the mentioned methods on mixed data set such as heart, and
hepatitis datasets from UCI.
Thanks
Perhaps, but you will need to encoder categorical variables to integer values or binary vectors.
how can I obtain the importance for each attribute using a ROC curve analysis?
Why does findCorrelation only report on the first row? How do I get it to report on all correlations?
You can learn more about the cor function by typing: ?cor
Help i got this error results <- rfe(data[,1:71], data[,72], sizes=c(1:71), rfeControl=control)
Error in { : task 9 failed – "Can't have empty classes in y."
Double check your data, e.g. assign to a variable and summarize it to ensure it is as you expect.
model <- train(diabetes~., data=PimaIndiansDiabetes, method="lvq", preProcess="scale", trCo
can you explain me what diabetes refers to ? or where it come from?
The outcome variable (column) in the dataset (PimaIndiansDiabetes).
Hi ,
I want to understand you code could you help me
model <- train(diabetes~., data=PimaIndiansDiabetes, method="lvq", preProcess="scale", trControl=control)
in above statement what diabetes is referred to?
Sure, ‘diabetes’ is the target column in the ‘PimaIndiansDiabetes’ dataset.
sorry omit my last post
hi,
I am trying to running your code by replacing my dataset but it is giving me error for wrong model for regression in feature selection by Varimp
any idea what it could cause ?
Perhaps post your error to stackoverflow?
i give it try but didn’t got any response
hi, i am trying but it says there is no package called caret and no package called mlbench.pls help
I’m sorry to hear that. Perhaps try posting to stackoverflow with your error messages?
if error message “Error in library(mlbench)” then
before you have to this
> install.package(“mlbench”)
> I am getting problem while installing Fselector command, i am not getting whats the matter
plz help
install.packages(“FSelector”)
Error in fetch(key) :
lazy-load database ‘C:/Users/ux305/Documents/R/win-library/3.4/FSelector/help/FSelector.rdb’ is corrupt
> library(FSelector)
Error: package or namespace load failed for ‘FSelector’:
.onLoad failed in loadNamespace() for ‘rJava’, details:
call: fun(libname, pkgname)
error: JAVA_HOME cannot be determined from the Registry
I’m sorry to hear that. Perhaps try posting the error to stackoverflow?
I wanna ask which is the best performance evaluation metric in feature selection in case of classification (ROC, MSRE,, ACCURACY,…)? and thank you
It really depends on your project, your goals, and your specific dataset.
Hi Jason, this is a very good post and i am a huge fan because all your work make ML very easy to handle. just wondering if any of your posts goes further to do the main classification task, i.e training the selected rfe attributes?
Sorry, I don’t have more detail on RFE at this stage.
It was really nice. but when I used
model <- train(quality~., data=wine, method="lvq", trControl=control)
then
error: wrong model type for regression.
does this model does not work with only numeric data.
I was trying this model to the Red Wine dataset.
Perhaps take the wine quality scores as 10 classes?
hI Jason thank you so much about this post.
You’re welcome.
Hi Jason;
In the Feature Selection, when you used plot(results, type=c(“g”, “o”)) code to make an accuracy vs Variables plot, is there any way we can get the actual names of variables instead of variable numbers?
Thank you in advance for your help.
Hi jason,
I am having problem with Caret package RFE-RF
set.seed(42)
index <- createDataPartition(RFTXModel$outcome, p = 0.7, list = FALSE)
train_data <- RFTXModel[index, ]
test_data <- RFTXModel[-index, ]
x <- dplyr::select(train_data, -outcome)
y <- as.factor(train_data$outcome)
set.seed(42)
control <- rfeControl(functions = rfFuncs,
method = "repeatedcv",
repeats = 5,
verbose = FALSE)
Result <- rfe(x,y,metric = "Kappa",
rfeControl = control)
print(Result)
I have two question
1. If I only need the list of predictors to be used in another classifier, do I split the data train and test for RFE?
2. How to get OA and Kappa value for each variable like this table
Variablenames OA Kappa SD (OA) SD (Kappa)
PC2Tex1 0.63 0.57 0.05 0.06
PC2 0.70 0.65 0.03 0.04
Thanks in advance
In removing redundant features don’t we focus on Negative correlation also ?
Yes, we should. Or just take the absolute of the coefficient and work in the positive domain.
Hi Jason. If I’m using recursive feature elimination, how could I obtain a ROC curve for the best model? Like if I had 10 variables and it selected 5, how do I plot the curve for this specific model?
Thanks!
Once you select the features, fit a model then calculate a ROC curve using a test dataset.
I don’t think I have an example in R, sorry.
HI jason,
I have one question. I have dataset with 1600 features. I have applied lvq.
It is giving 20 imp features. But I want mininum 60 features. how to get that using varimp? plot(importance) is so clumsy that I am not getting the names of the features.
I’m not sure off hand, sorry. Perhaps try posting to stackoverflow?
HI Jason, I may have posted this on a different thread by accident, but I was curious about the difference in the caret package Var Imp plot and the regular Random Forest Var Imp Plot. In regular RF, the variable importance is determined by gini decrease, whereas it seems that what you are saying here is that the caret uses a different method–not a gini decrease. The code for running both is the same in both packages (VarImp)–so I’m a bit confused…..
Caret doesn’t actually implement the algorithms, it is just a wrapper to use algorithms from other packages, like the random forest package.
Oh I see, thank you…. but the plot we produce from caret random forest is an importance plot based on 1-100, whereas using random forest alone gives us a mean accuracy decrease and mean gini decrease for importance. I guess that’s where I was confused because I had assumed that caret was using essentially the RF package. But when I run the importance plots in both, they don’t seem to give me the same statistics (even if the order of variables is the same).
I see. Perhaps post to stackoverflow or the R users list?
Thank you for this post! It helps a lot. I ran the model as you instructed. It shows that my 21 variables can be narrowed down to 8. It lists variables 1-7 and 21. Would those numbers correspond to the order in which they appear in the data frame? Thanks in advance!
Yes, the numbers represent the column index for each selected feature.
Why is the use of removing features that are correlated with eachother? And if I find 2 features that are highly correlated do I remove only one of them or both? And why is nobody asking this question?
It simplifies the model and removes redundancy. This means it is less complex, learns faster and may even make better predictions.
You remove one of them.
You remove the one that is less correlated with your dependent variable
Thanks for the great post. I have a question if for example I have a classifier problem and let’s say I want to choose an algorithm.
Do I use RFE first, I get the important features and then based on them I run all possible algorithms (e.g. logistic regression, kNN, Decision Trees…) and choose the best one?
OR Do I choose features within each algorithm (e.g. forward selection in logistic regression, RFE in Decision trees etc) and then at the end compare the accuracy of all algorithms and choose the best one?
Perhaps go back and forth between the two processes until you find a well performing combination of features and model.
Can you provide a reference or set of references for using a cutoff of .75 (or other)?
Thank you
No, sorry.
Perhaps run a sensitivity analysis of different cut off values and see what works best for your dataset.
Thank you for sharing a good method. I have a question. If i want to know a detailed combination of variables with different number of variables, how can i do?
Sorry, I don’t follow, can you elaborate please?
For example, I have 11 variables. When the number of variables is 7, the model is optimal and I can know which variables are there. I want to know what the detailed variable is when the number of variables is 5.
Hi Jason,
I have a question with regards to the correlation – the highly correlated features i find with this function…
# Find attributes that are highly corrected (ideally >0.75)
highlyCorrelated <- findCorrelation(correlationMatrix, cutoff=0.75)
… do I need to take out all of them or should I only tak out half, because then, they do not correlate with something anymore. Or are these the ones that correlate high with ALL the variables in my dataset? Thank you for the help.
Best,
Steven
Half.
The idea is to remove redundant features. Those features that correlate strongly with existing features are redundant, they don’t add new information.
Hi Jason!
Do you have any topic regarding variable normalization?
Yes, many, perhaps start here:
https://machinelearningmastery.com/?s=normalize&post_type=post&submit=Search
Hi Jason,
Great post, thank you very much.
I had one question regarding the “Recursive Feature Elimination”. Here it shows that with 4 features we get almost the same performance as with 8, is there any way to see which 4 variables those are?
Thank you very much
Yes, it reports the index or column of each selected variable. You can then lookup the names of these columns.
This is very useful. It has worked well for my data
Thanks, I’m glad it helped.
What is difference is Variable importance and feature selection?
Importance can be used for selection but is itself not selection.
Could you please tell in what sense the importance of variables is measured? Are they mean decrease in accuracy or decrease in Gini?
Thank you.
Yes, you can learn more here:
https://topepo.github.io/caret/variable-importance.html
Hi Jason,
if I use RFE based on Random forest, can the selected features set be used to build other kind of model like SVM?
Thank you!
Yes.
could you share the advantage and disadvantages of RFE, please? I have used it and also used other example xgboost and GA to compare the capacity of each. in some cases, RFE performed well and in other xgboost and GA featured models got higher accuracy.
ps. regression data have used.
best regards
If it works well on your dataset, use it, if not, don’t. Other than that – I cannot help you.
Hi
Thank you for your nice and explicit explanation.
What if I want to do recursive feature selection for other ML algorithms in caret package such us SVM, ANN, KNN?
I saw a free function called “caretFuncs”. Can i use this function for all machine learning methods that are embedded with caret package including for the random forest classifier? Thank you in advance.
Yes, you can use any algorithm you like in RFE I believe.
Hi Jason,
Thanks for this nice post.
I observed that the correlation matrix is in fact a Pearson correlation computation.
So I am wondering after the correlation matrix we have observed here with 4 features which are highly correlated. Do we remove 3 out of 4 of theses features before starting a new model of prediction?
Thanks,
Regards,
Dominique
Yes.
I believe there is a procedure for this, for removing redundant inputs. From memory, I think each feature is assigned a scoring based how correlated it is with all other features, and a subset of the most correlated inputs are removed.
Hi, I’m using the below code for recursive elimination its a 140:396 dataset.
#Recrusive Elimination…………………………………………………..
control <- rfeControl(functions=rfFuncs, method="cv", number=10)
RFE <- rfe(dat5[,2:396], dat5[,1],
sizes=c(1:8), rfeControl=control)
But I'm Keep having the below error.
Error in summary.connection(connection) : invalid connection
That is an odd error.
Perhaps try posting your code and error message to the R user group or stackoverflow?
Thanks for Replying Jason,
Buth the error is due to parallel computing.
After running the below code able to solve it
library(doParallel); library(doSNOW);
{ # doParallel
cl <- makeCluster(detectCores()); registerDoParallel(cl);
getDoParWorkers(); stopCluster(cl);
# let it snow (doSNOW)
cl <- makeCluster(32,type="SOCK")
stopCluster(cl)
}
I’m happy to hear that.
Dear Jason,
Thank you for your work. I have a question related to feature selection part after varImp(). After seeing the most important features for my prediction, suppose I want to select first 4 of them as my predictors and continue with the random forest. Could you help me with that?
Excellent question. I hope to demonstrate this with an example in the future.
Hi Jason
a question on what basis I define
sizes = C (1: 8)
for
results <- rfe(PimaIndiansDiabetes[,1:8], PimaIndiansDiabetes[,9], sizes=c(1:8), rfeControl=control)
I guess it depends on the dataset, but is there a general rule to rely on?
Thanks in advance for your reply
Not really, it might be a good idea to test 1 to n for n input features.
Hi Jason,
I have nonlinear time series dataset which contains numerical data and I just pass model <- train(EGT~., data=df[1:10], method="lvq", preProcess="scale", trControl=control)
and it obtains the Error: wrong model type for regression.
I hv no idea. Also, how to cal the non-linear corr?!
Thanks.
This form of feature selection is probably not appropriate for time series.
Perhaps try nonparametric correlation, like spearmans?
I have got the error. Please help me, how can I solve the problem?
results <- rfe(x,y, sizes=c(1:13), rfeControl=control , method="svmRadial")
Error in { : task 1 failed – "missing value where TRUE/FALSE needed"
In addition: There were 50 or more warnings (use warnings() to see the first 50)
Sorry to hear that, perhaps these tips will help:
https://machinelearningmastery.com/faq/single-faq/why-does-the-code-in-the-tutorial-not-work-for-me
Thanks for your valuable information. I am doing prediction analysis using ANN, RF, SVM, KNN, NB and XGB. Where i have used caret package to calculate the feature importance for SVM, KNN and NB, while for ANN, RF and XGB, i have used neuralnetwork, ranomforest and xgboost packages, respectively. My question is, how these packages select the ranks the different parameters because the weight of each parameter is not the same with all 4 packages. Thanks
You’re welcome.
I believe each model uses default hyperparametesr. I would recommend tuning each algorithm if you have the time.
the result of the plot of the rfe function is RMSE, how did you come up with the accuracy plot?
The code used to create the plots is in the above tutorial.
Hi Jason,
I would like to tell you that I used the support vector regression model using the caret package. For my project, I also need to consider the importance of independent variables.
Could you please tell me, how ‘VarImp’ function in the caret package works for models such as SVR, where no built-in importance score is implemented, to determine the importance of independent variables?
Best Wishes,
Younes
Hi Vounes…some excellent examples are found here:
https://topepo.github.io/caret/variable-importance.html
Hi James, thanks for such a clear tutorial!
I’m struggling to get this to work on my data which has a mix of numerical values and hot one encoded data. Everything works when I only use the numerical values, but when I add in the hot one encoded data (ie. 1s and 0s), I get ‘Error: wrong model type for regression’. Do you know how I can fix the issue?
Thanks so much!
Hi Jen…You are very welcome! You may find the following discussions of interest:
https://stackoverflow.com/questions/23357855/wrong-model-type-for-regression-error-in-10-fold-cross-validation-for-naive-baye
https://www.reddit.com/r/statistics/comments/8q35w7/lasso_regression_caret_error_wrong_model_type_for/