Ensembles can give you a boost in accuracy on your dataset.
In this post you will discover how you can create three of the most powerful types of ensembles in R.
This case study will step you through Boosting, Bagging and Stacking and show you how you can continue to ratchet up the accuracy of the models on your own datasets.
Kick-start your project with my new book Machine Learning Mastery With R, including step-by-step tutorials and the R source code files for all examples.
Let’s get started.
Build an Ensemble Of Machine Learning Algorithms in R Photo by Barbara Hobbs, some rights reserved.
Increase The Accuracy Of Your Models
It can take time to find well performing machine learning algorithms for your dataset. This is because of the trial and error nature of applied machine learning.
Once you have a shortlist of accurate models, you can use algorithm tuning to get the most from each algorithm.
Another approach that you can use to increase accuracy on your dataset is to combine the predictions of multiple different models together.
Combine Model Predictions Into Ensemble Predictions
The three most popular methods for combining the predictions from different models are:
Bagging. Building multiple models (typically of the same type) from different subsamples of the training dataset.
Boosting. Building multiple models (typically of the same type) each of which learns to fix the prediction errors of a prior model in the chain.
Stacking. Building multiple models (typically of differing types) and supervisor model that learns how to best combine the predictions of the primary models.
This post will not explain each of these methods. It assumes you are generally familiar with machine learning algorithms and ensemble methods and that you are looking for information on how to create ensembles with R.
Need more Help with R for Machine Learning?
Take my free 14-day email course and discover how to use R on your project (with sample code).
Click to sign-up and also get a free PDF Ebook version of the course.
Ensemble Machine Learning in R
You can create ensembles of machine learning algorithms in R.
There are three main techniques that you can create an ensemble of machine learning algorithms in R: Boosting, Bagging and Stacking. In this section, we will look at each in turn.
Before we start building ensembles, let’s define our test set-up.
Test Dataset
All of the examples of ensemble predictions in this case study will use the ionosphere dataset.
This is a dataset available from the UCI Machine Learning Repository. This dataset describes high-frequency antenna returns from high energy particles in the atmosphere and whether the return shows structure or not. The problem is a binary classification that contains 351 instances and 35 numerical attributes.
Let’s load the libraries and the dataset.
1
2
3
4
5
6
7
8
9
10
# Load libraries
library(mlbench)
library(caret)
library(caretEnsemble)
# Load the dataset
data(Ionosphere)
dataset<-Ionosphere
dataset<-dataset[,-2]
dataset$V1<-as.numeric(as.character(dataset$V1))
Note that the first attribute was a factor (0,1) and has been transformed to be numeric for consistency with all of the other numeric attributes. Also note that the second attribute is a constant and has been removed.
Here is a sneak-peek at the first few rows of the ionosphere dataset.
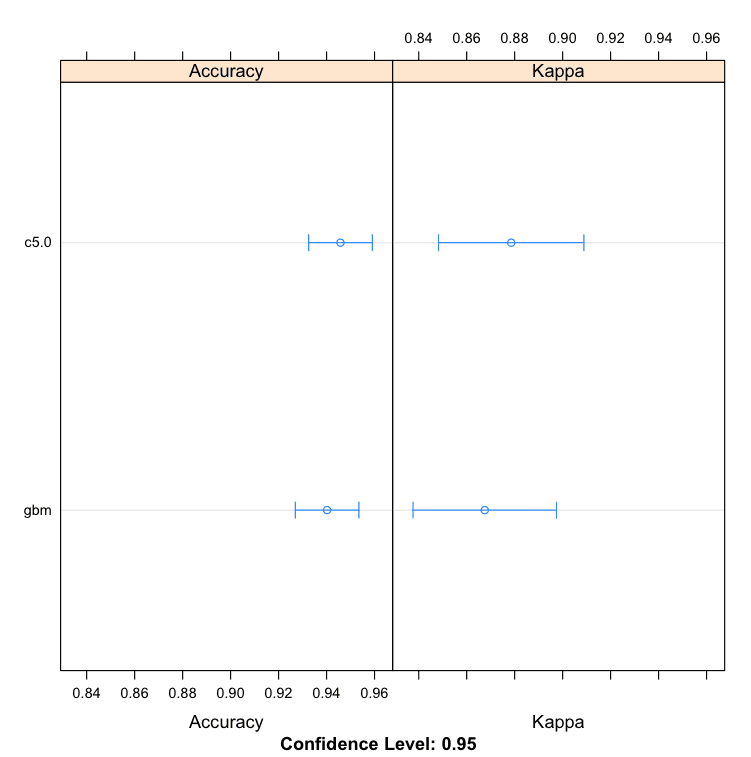
We can look at two of the most popular boosting machine learning algorithms:
C5.0
Stochastic Gradient Boosting
Below is an example of the C5.0 and Stochastic Gradient Boosting (using the Gradient Boosting Modeling implementation) algorithms in R. Both algorithms include parameters that are not tuned in this example.
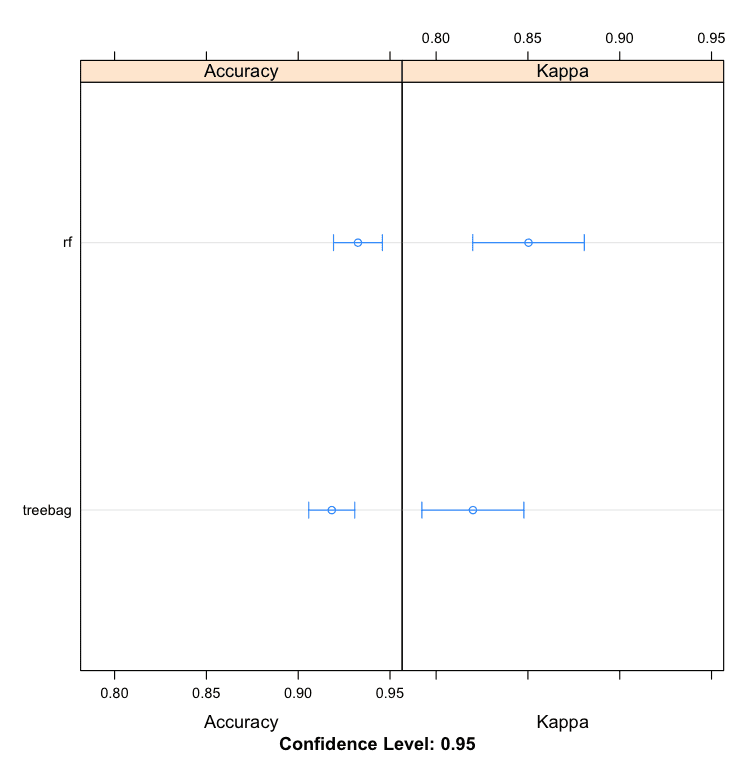
We can see that random forest produces a more accurate model with an accuracy of 93.25%.
1
2
3
4
5
6
7
Models: treebag, rf
Number of resamples: 30
Accuracy
Min. 1st Qu. Median Mean 3rd Qu. Max. NA's
treebag 0.8529 0.8946 0.9143 0.9183 0.9440 1 0
rf 0.8571 0.9143 0.9420 0.9325 0.9444 1 0
Bagging Machine Learning Algorithms in R
Learn more about caret bagging model here: Bagging Models.
3. Stacking Algorithms
You can combine the predictions of multiple caret models using the caretEnsemble package.
Given a list of caret models, the caretStack() function can be used to specify a higher-order model to learn how to best combine the predictions of sub-models together.
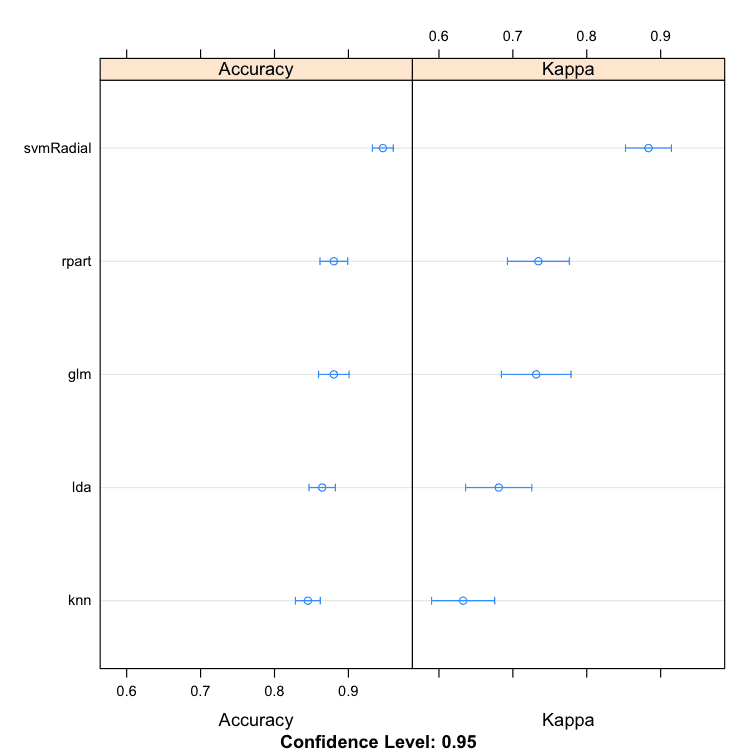
Let’s first look at creating 5 sub-models for the ionosphere dataset, specifically:
Linear Discriminate Analysis (LDA)
Classification and Regression Trees (CART)
Logistic Regression (via Generalized Linear Model or GLM)
k-Nearest Neighbors (kNN)
Support Vector Machine with a Radial Basis Kernel Function (SVM)
Below is an example that creates these 5 sub-models. Note the new helpful caretList() function provided by the caretEnsemble package for creating a list of standard caret models.
Comparison of Sub-Models for Stacking Ensemble in R
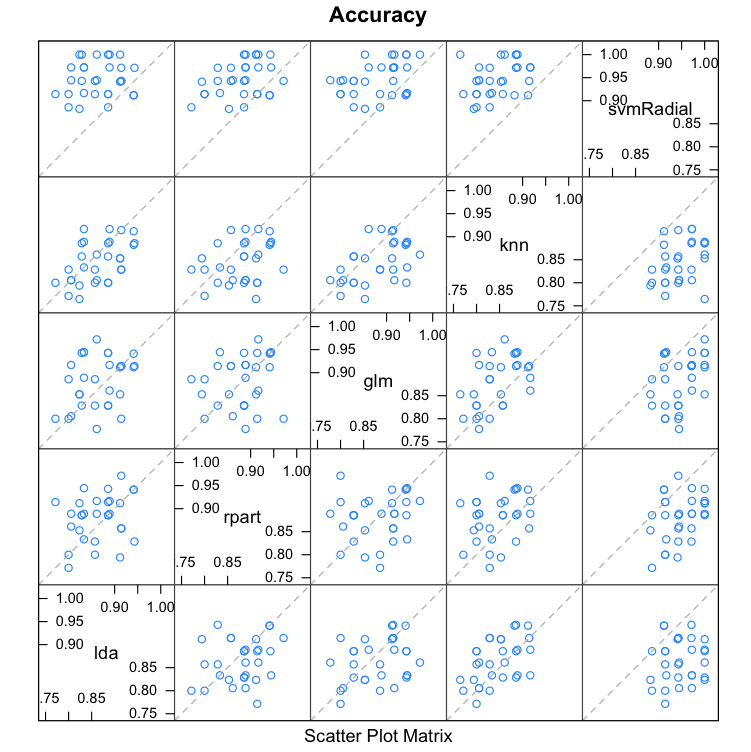
When we combine the predictions of different models using stacking, it is desirable that the predictions made by the sub-models have low correlation. This would suggest that the models are skillful but in different ways, allowing a new classifier to figure out how to get the best from each model for an improved score.
If the predictions for the sub-models were highly corrected (>0.75) then they would be making the same or very similar predictions most of the time reducing the benefit of combining the predictions.
1
2
3
# correlation between results
modelCor(results)
splom(results)
We can see that all pairs of predictions have generally low correlation. The two methods with the highest correlation between their predictions are Logistic Regression (GLM) and kNN at 0.517 correlation which is not considered high (>0.75).
We can see that we have lifted the accuracy to 94.99% which is a small improvement over using SVM alone. This is also an improvement over using random forest alone on the dataset, as observed above.
1
2
3
4
5
6
7
8
9
10
11
12
13
14
15
16
A glm ensemble of 2 base models: lda, rpart, glm, knn, svmRadial
We can also use more sophisticated algorithms to combine predictions in an effort to tease out when best to use the different methods. In this case, we can use the random forest algorithm to combine the predictions.
Accuracy was used to select the optimal model using the largest value.
The final value used for the model was mtry = 2.
You Can Build Ensembles in R
You do not need to be an R programmer. You can copy and paste the sample code from this blog post to get started. Study the functions used in the examples using the built-in help in R.
You do not need to be a machine learning expert. Creating ensembles can be very complex if you are doing it from scratch. The caret and the caretEnsemble package allow you start creating and experimenting with ensembles even if you don’t have a deep understanding of how they work. Read-up on each type of ensemble to get more out of them at a later time.
You do not need to collect your own data. The data used in this case study was from the mlbench package. You can use standard machine learning dataset like this to learn, use and experiment with machine learning algorithms.
You do not need to write your own ensemble code. Some of the most powerful algorithms for creating ensembles is provided by R, ready to run. Use the examples in this post to get started right now. You can always adapt it to your specific cases or try out new ideas with custom code at a later time.
Summary
In this post you discovered that you can use ensembles of machine learning algorithms to improve the accuracy of your models.
You discovered three types of ensembles of machine learning algorithms that you can build in R:
Boosting
Bagging
Stacking
You can use the code in this case study as a template on your current or next machine learning project in R.
Next Step
Did you work through the case study?
Start your R interactive environment.
Type or copy-paste all of the code in this case study.
Take the time to understand each part of the case study using the help for R functions.
Do you have any questions about this case study or using ensembles in R? Leave a comment and ask and I will do my best to answer.
One question: In the stacked random forest and GLM ensemble models, how are the hyperparameters specified for each model (e.g., which value of k for k Nearest Neighbor, how many trees in the random forest)? I’m assuming default values are used, but can these values be tweaked within the caretEnsemble package?
The algorithms use “sensible” defaults. I think 100 trees for RF, I don’t recall the value for K in KNN. The caret docs will specify the default or you can print the model after training.
How to make predict function work after building models
Also can these methods be used for Multi class classification beause while doing caretstack I get error for multiclass classification
thanks for this tutorial. I have a question regarding the validation of the models. Should I always use the same seeds (folds) for the whole evaluation process (i.e. tuning the individual models, stacking the models etc.). I think it´s really hard to get valid numbers for the hyperparameters for the individual models, good performance of the individual models and uncorrelated models at the same time. For example, if I use 10 * 10 cross-validation with the same seeds (folds) for all models their performance is quite stable but the intercorrelation of their results tends to be quiet high.
I started following your posts recently and so far this is one of the best post I came across, not just in this website but among all the ML websites I have visited. Really appreciate your efforts to explain such a useful topic in a simple & clear manner. I will definitely try out this technique soon. Thanks again..
Fantastic tutorial!!. One of the most simple and elegant ways of introducing ensembles. As someone mentioned in earlier comment, this is one of the cutest resource for introducing ensembles.
It looks like you are adapting the example to your own problem nice work!
Were you able to reproduce the example in the tutorial first? This will confirm your environment is working correctly.
I have not seen this error before, but I suspect it is related to your dataset. Confirm the data is in a form to make it easy to model, such as all numeric attributes and a factor being predicted.
The environment is fine as i have tried the other codes of your to as well and those run fine……
Can I send you the dataset i m using on your mail id and you can help me with the code and let me know what mistake i m doing….just to give you a heads up i have also converted all the variables to as.numeric before applying the algorithm but i m still facing the same issue.
Please if you can help me with your mail id to send the dataset.
Hi Mudit,
I see you are participating in AV Loan default prediction competition. I am also participating in the same in the learning mode and my score (so far) is same as yours. At present i am working on stacking using caretEnsemble, I have not come across the error that you are seeing. Would you be able to provide more info (or) share code.
I need to do combine 6 different predictive models , this is a 7 class problem.
Each model predicts output probability for being in all the seven classes (lib SVMs using -b 1 option) and I need to combine them to get a better model. I just have to use the predictions of these models to train the ensemble.
Can you please tell me how to do the ensemble learning for multiclass problem and how this can be done in matlab ? Please reply as soon as possible. I shall be thankful. Thanks !
Hi Jason,
I have built many models with different pre-processing done on each model and the model itself is unique tuned by its own tune parameters and i want to stack them now. how do i get them into caretStack, because caretStack requires caretList to be its input. but i have generated models using caret train function. hope you got what i am saying. Appreciate your response.
How did you do it? I am currently working on one such problem. Could you advise me on how to go about it. Using a caretlist with different preprocessing, and different variables for each model to build a stacked ensemble.
Hi Jason,
I am currently trying to construct an ensembles of classifiers using the stacking technique. I am currently using the Naive Bayes and j48 classifier as the base leaarners with Random Forest as the meta learner.Where can I find the correlation values for predictions in Weka?
Thanks
Hi Seun, if you are looking to investigate the correlation between prediction errors in Weka, you will have to do this manually. I don’t believe there is facility.
You will have to make predictions on a test dataset for each classier, save them to CSV files and then calculate the PEARSON() correlation in MS Excel or similar.
what changes shd be made if i deal with a categorical featurespace with large no of levels. on execution if this code shows an error “Error in train.default(x, y, weights = w, …) : Stopping
In addition: There were 33 warnings (use warnings() to see them)”..
Yes, you can create an ensemble by combining the predictions from these models. You can use voting (mode), take the average or use another model to learn how to best combine the predictions (called stacked generalization or stacking).
The tutorial is awesome, but i am not able to install caretEnsemble pkg for R version 3.3.1, is there any other pkgs available for same task or any workaround.
Do you know where I can find code to implement Stacked Models in R? I am interested in tuning my xgboost models and stacking them with other optimized models. Any pointers towards examples/implementations would be awesome!
Let’s say you have got predictions where there are two models which are highly correlated (>0.75). Should we apply the same code as below for the mentioned example in the article?
# stack using random forest
set.seed(seed)
stack.rf <- caretStack(models, method="rf", metric="Accuracy", trControl=stackControl)
print(stack.rf)
Sorry, if you can elaborate on this will be great. How stacking algorithm has to be used when One model is having low correlation with all other models.
I don’t remember the specifics of the paper, but it was along the lines of better performance when predictions between weak learners are uncorrelated (or maybe it was the errors being uncorrelated). This may have been in PAC learning theory – it has been a while, sorry.
Hi, thanks for nice introduction to ensemble techniques.
I have one question. Can I ensemble 1 method repeatedly?
It seems CaretEnsemble mix different methods.
What if I want to ensemble a single method many times?(like boosting)
Function “train” seems to help resampling data and apply method repeatedly. But does it mean bagging or boosting? Or it just helps to pick a best parameter for single method?
You could create 10 neural nets and take the mean prediction – this would probably outperform a stacking approach.
You can put other methods inside bagging (I don’t remember the package name off hand), but bagging works so much better with high variance methods – like unpruned trees or low-k in KNN with subsampled training data, etc.
At the end of the day, try different methods and see what gives the best results on your problem.
Hello Jason, first l would like to thank you for such a nice article of ensemble methods. I have a question that may be naive but i m confused,
My question is that since ensemble methods are used on a base classifer model (naive base classifier, SVM etc.) to improve accuracy of the base model but how to choose on which classifier we should apply ensemble methods.
How do we know that wihch classifier is best for applying ensemble methods?
Hi Jason, really inspired by your post. However, I have one question regarding the output of the stacking model.
“A rf ensemble of 2 base models: lda, rpart, glm, knn, svmRadial”, why there are only 2 base models? 2 is selected by the accuracy?
Thanks Jason, it is a really clear and sound example. I really appreciated. I am starting in this arena, and it is pretty impressive the method.
I found references to a package named SuperLearner in R. I wonder if this package also work for this sort of examples or it has restrictions. I have a quick look at the documentation and I see that mentioned parametric models. Do you anything about SuperLearner?
Just wow Jason. Thank you so much for this very useful tutorial on ensemble methods. I have bought many a book on Machine Learning in R over the last 5 years and I think this is the best summary of how you can use multiple machine learning methods together to enable you to select the best option and the method which is most fit for purpose.
Again, you have proverbially saved my bacon here – so thank you!
can i make an ensemble to predict unknown data.
like : https://archive.ics.uci.edu/ml/datasets/diabetes
dataset
consisting of
(1) Date in MM-DD-YYYY format
(2) Time in XX:YY format
(3) Code
(4) Value
i used knn
and neural net to predict by giving any one code value and in response i got respective values which i trained the machine, my question is is it possible to predict the unknown data on which it has not trained
for example
upto glucose values i trained the machine for 350
if i have given 600 then why it is not giving the relative output it is showng the last i.e nearest neighbour value as a predicted value in neural networks..
Hi jason, thanks for this great work.
i have a question, if i have a data set contains of android code and i need to apply ensemble method on this data set to improve the accuracy how i can apply ensemble techniques can i use weka tool or if u have another way to apply this work.
C5.0 is a more advanced version of Quinlan’s C4.5 classification model that has additional features, such as boosting and unequal costs for different types of errors.
I am planning to stack different algorithms like Artificial Neural Network, SVM, KNN, C5.0, Random Forest in my research work for predicting diabetes disease…Whether this is feasible?? or whether the library above works only with certain algorithms?
thank you for your advice! And I tried to use stacking,but the following error occurred
Error: wrong model type for regression
In addition: Warning messages:
1: In trControlCheck(x = trControl, y = target) :
x$savePredictions == TRUE is depreciated. Setting to ‘final’ instead.
2: In trControlCheck(x = trControl, y = target) :
indexes not defined in trControl. Attempting to set them ourselves, so each model in the ensemble will have the same resampling indexes.
I‘ve solved the previous problem,another questions
1.is there any way to add the xgboost models?
2.can change KAPPA to AUC to validate model?
thank you!
Good evening mr. Jason.
I want to asking , what ensemble learning bagging-boosting-random forest for logistic regression and linear discriminant. Any specific syntac bagging-boosting-random forest for that classifier?
When you say that the “predictions ” must not be too correlated, do you mean the posterior probabilities (not the predicted values which are two possible values)?
But in most cases, the predictions are the same for every method here, since it’s a binary classification problem. How can the correlations be the so small ?
Other question : the caretList function does not seem to support missing values. How do you deal with that ?
Could you help me to find solution for that error (Value Error: could not convert string to float: ‘ [-5.67604346 -0.37017465 1.41012661 2.30903599 2.85538861] ‘)?
I am trying different algorithms on classifying cancer as either Malignant or Benign. When I compare these models (LDA, NN, KNN, RF, NB…) using modelCor function in caret package, I get negative correlation coefficient form some models. Is this something possible and how can they (negatively correlated) models be interpreted?
Thanks for the tutorial. It was very much helpful. Can you please suggest how can I plot the ROC curve for a stacked model? Following your example, I have generated stack.svm, now please tell me how can I draw a ROC curve for it?
> models <- caretList(Stroke~., data=d11, trControl=control, methodList=algorithmList)
Error: At least one of the class levels is not a valid R variable name; This will cause errors when class probabilities are generated because the variables names will be converted to X0, X1 . Please use factor levels that can be used as valid R variable names (see ?make.names for help).
In addition: Warning messages:
1: In trControlCheck(x = trControl, y = target) :
x$savePredictions == TRUE is depreciated. Setting to 'final' instead.
2: In trControlCheck(x = trControl, y = target) :
indexes not defined in trControl. Attempting to set them ourselves, so each model in the ensemble will have the same resampling indexes.
Hello Jason! your post helps me so much I really so thankful to you
How many layers have you used in stacking example?
if two, which classifiers exist or reside in the bottom layer and which classifiers reside in the top layer?
in the following line of code does “glm” in the top layer?
stack.glm <- caretStack(models, method="glm", metric="Accuracy", trControl=stackControl)
based on what condition I should choose the top layer's model in order to best combine the predictions of all models?
sorry, Jason, I read the section many times but I didn’t figure out how many layers in the stacking ensemble in your example? Maybe you refer to it implicitly throughout the article but I am a beginner and I didn’t get it?
Hi Jason
your explanation is so clear and easy to grasp
I have a question about modelCor() function, it computes the correlation according to the Pearson or Spearman correlation method?
I would like to read more about the working of modelCor()function because I want to print the prediction’s matrix for each model in R. the models that are used as inputs to the modelCor function in order to see the matrix used in correlation
is it possible to provide me a link or any information about modelCor()function because I read about this function in the help of R but the information was so limited?
Hi Jason,
Thank you very much for your instruction.
I have 2 questions, hoping you will help me explain.
1. In the part of Stacking Algorithms, I see that you used 5 sub-model, How I can find another model, Have any target?
2. Why you choose Random forest and glm? How about the other?
Thank you very much
The answer to these questions can only be found via systematic experimentation – there are no theories of mapping algorithms to problems or algorithm configuration based on problem type.
Test different numbers of sub-models on your problem to see what works best.
Test different model types, to see what works best for your specific dataset.
hi Jason,
thanks for the tutorial. it was great.
does the stacking algorithm only work for binary classification?
do you know how can I change the stacking code in order to use for Multi-class classification?
Thank you very much for such a wonderful post which was a pleasure to follow. I have a set of 10 GCM predictions for which I would like to have the best prediction out of them (i.e. the best ensemble). I have clearly understood your tutorial, but is it possible to come up with a time series data file for the best ensemble. I would like to use the time series for further investigation.
Hey Jason – really love this example & all of your explanations…each one is very succinct & easy to understand.
I just have one question: In theory, should caretStack only be applied to base learners like a GLM & SVM or could you also use caretStack to combine boosting & bagging algorithms like C5.0, GBM, and RF so long as these models have little correlation to each other?
Thanks for the tutorial. I’ve tried to use modelCor() to present the correlation of some models in order to verify if an ensemble of the methods will improve the results. However, some correlation resulted in “NA”. Did you know some feature to correct this?
No, other values of the matrix. Example: I consider four methods: rf, svmRadialWeights, gbm and rpart. The correlation of svmRadialWeights and rf is 0.5722874, the correlation of gbm and rf is -0.1273161, but when I calculate the correlation of rpart with any method the results are NA.
When I run the method rpart individually it works fine.
Thanks for the tutorial. Just a quick update, as of September 2020, my results using exactly the same code are slightly different. Not a big deal, just gbm provides more accurate results than c5.0 in the Boosting Algorithms section now. I tested both in R 4.0 and 3.6.3, I got the same results.
hello Jason,
Thanks for the explanation! I was wondering if I can use these techniques for non binary numerical variables as the response variable. Or are there other types of algorithms to use for that? Ex: to predict the imdb score of a movie, using machine learning techniques.
Accuracy cannot be measured for regression, instead we must use error.
Some algorithms will give you a formula (such as linear algorithms), most do not. You may need to check the documentation for the algorithm that you are using.
I got this error “Error: wrong model type for regression”.
How do I correct it?
In order words, I apply this code for a regression problem, what should I change in the code?
I tried to change: metric <- "RMSE", but it is not work.


")
Thanks for posting Jason, very helpful.
One question: In the stacked random forest and GLM ensemble models, how are the hyperparameters specified for each model (e.g., which value of k for k Nearest Neighbor, how many trees in the random forest)? I’m assuming default values are used, but can these values be tweaked within the caretEnsemble package?
The algorithms use “sensible” defaults. I think 100 trees for RF, I don’t recall the value for K in KNN. The caret docs will specify the default or you can print the model after training.
How to make predict function work after building models
Also can these methods be used for Multi class classification beause while doing caretstack I get error for multiclass classification
All the examples I see are for binary classification are there any examples for multi classification.
Yes, see this:
https://machinelearningmastery.com/machine-learning-in-r-step-by-step/
Hi,
thanks for this tutorial. I have a question regarding the validation of the models. Should I always use the same seeds (folds) for the whole evaluation process (i.e. tuning the individual models, stacking the models etc.). I think it´s really hard to get valid numbers for the hyperparameters for the individual models, good performance of the individual models and uncorrelated models at the same time. For example, if I use 10 * 10 cross-validation with the same seeds (folds) for all models their performance is quite stable but the intercorrelation of their results tends to be quiet high.
No, I think it is better to evaluate the model including the variance in the data and model (e.g. average over many runs).
Hi Jason,
I started following your posts recently and so far this is one of the best post I came across, not just in this website but among all the ML websites I have visited. Really appreciate your efforts to explain such a useful topic in a simple & clear manner. I will definitely try out this technique soon. Thanks again..
Thanks Sreenath.
One of best articles I came accross. Superhelpful
Thanks!!
You’re welcome pradnya.
one question : how to stack models of different subsets of a dataset into one model i tried caretStack but i got an error
Sorry to hear that. What error did you get?
Did the above example work for you?
Fantastic tutorial!!. One of the most simple and elegant ways of introducing ensembles. As someone mentioned in earlier comment, this is one of the cutest resource for introducing ensembles.
Thanks Ramasubramaniam.
models <- caretList(Loan_Status~., data=train1, trControl=control, methodList=algorithmList)
Throws a error
Error in { : task 1 failed – "argument is not interpretable as logical"
In addition: There were 32 warnings (use warnings() to see them)
any suggestion ?
It looks like you are adapting the example to your own problem nice work!
Were you able to reproduce the example in the tutorial first? This will confirm your environment is working correctly.
I have not seen this error before, but I suspect it is related to your dataset. Confirm the data is in a form to make it easy to model, such as all numeric attributes and a factor being predicted.
You can ignore the warnings for now.
Hi Jason,
The environment is fine as i have tried the other codes of your to as well and those run fine……
Can I send you the dataset i m using on your mail id and you can help me with the code and let me know what mistake i m doing….just to give you a heads up i have also converted all the variables to as.numeric before applying the algorithm but i m still facing the same issue.
Please if you can help me with your mail id to send the dataset.
Regards
Mudit
Hi Jason,
Any response ?
Regards
Mudit
I am happy to answer specific questions:
https://machinelearningmastery.com/contact/
But I’m sorry, I do not have the time to debug your problem for you.
Hi Jason,
I totally respect your time constraint……..its just when I’m stuck with code it get hard to debug…seeing the same code working on other dataset fine….
Regards
Mudit
Hi Mudit,
I see you are participating in AV Loan default prediction competition. I am also participating in the same in the learning mode and my score (so far) is same as yours. At present i am working on stacking using caretEnsemble, I have not come across the error that you are seeing. Would you be able to provide more info (or) share code.
Thanks,
Raj
I need to do combine 6 different predictive models , this is a 7 class problem.
Each model predicts output probability for being in all the seven classes (lib SVMs using -b 1 option) and I need to combine them to get a better model. I just have to use the predictions of these models to train the ensemble.
Can you please tell me how to do the ensemble learning for multiclass problem and how this can be done in matlab ? Please reply as soon as possible. I shall be thankful. Thanks !
Sorry, I don’t have any examples in Matlab at the moment.
Hi Jason,
I have built many models with different pre-processing done on each model and the model itself is unique tuned by its own tune parameters and i want to stack them now. how do i get them into caretStack, because caretStack requires caretList to be its input. but i have generated models using caret train function. hope you got what i am saying. Appreciate your response.
Cheers,
Raj
Jason, no worries. i figured it out. thanks.
How did you do it? I am currently working on one such problem. Could you advise me on how to go about it. Using a caretlist with different preprocessing, and different variables for each model to build a stacked ensemble.
Hi Jason,
I am currently trying to construct an ensembles of classifiers using the stacking technique. I am currently using the Naive Bayes and j48 classifier as the base leaarners with Random Forest as the meta learner.Where can I find the correlation values for predictions in Weka?
Thanks
Hi Seun, if you are looking to investigate the correlation between prediction errors in Weka, you will have to do this manually. I don’t believe there is facility.
You will have to make predictions on a test dataset for each classier, save them to CSV files and then calculate the PEARSON() correlation in MS Excel or similar.
I hope that helps.
Hi Jason,Thanks. Thats sounds like a lot of work.
what changes shd be made if i deal with a categorical featurespace with large no of levels. on execution if this code shows an error “Error in train.default(x, y, weights = w, …) : Stopping
In addition: There were 33 warnings (use warnings() to see them)”..
i was talking about executing stacking
A hard question babi. Try converting the categorical features to binary features and see if that makes a difference.
Thanks a lot Jason.. This article is very helpful to Ensemble the model.
I tried one of our regression Problem, the RMSE values is increased..
is there any article to Merge the models other than caret Packages, If it is ok…
Thanks,
Narendra Prasad K
You can merge the predictions from models manually, that is how we had to do it before caretEnsemble.
Can i merge classification model like logistic regression and linear regression? If so which method is to be used?
Hi Siddhesh,
Yes, you can create an ensemble by combining the predictions from these models. You can use voting (mode), take the average or use another model to learn how to best combine the predictions (called stacked generalization or stacking).
Hey Jason,
The tutorial is awesome, but i am not able to install caretEnsemble pkg for R version 3.3.1, is there any other pkgs available for same task or any workaround.
Thanks for the help..!..
I’m sorry to hear that.
Perhaps you could update to 3.3.2 and try again?
Perhaps check stack overflow to see if anyone else has your error?
You may even want to try to R mailing list, if you’re brave.
models <- caretList(Item_Outlet_Sales~., data=BigMartimp, trControl=trainControl, methodList=algorithmList)
results <- resamples(models)
summary(results)
dotplot(results)
modelCor(results)
splom(results)
From above we found that Decision tree is having low correlation with all other models used in the method list previously.
So while creating stackedensemble model do we need to remove the rpart and train the model again before doing stacking?
stack.rf <- caretStack(models, method="rf", metric="RMSE", trControl=stackControl)
Good question Surya,
You could create the stacked model yourself. I believe a limitation of caretStack is that it expects to train the submodels itself.
Do you know where I can find code to implement Stacked Models in R? I am interested in tuning my xgboost models and stacking them with other optimized models. Any pointers towards examples/implementations would be awesome!
Does the stacking example in this post not help?
XGBoost is available in R and caret, and can be used from caretEnsemble.
Let’s say you have got predictions where there are two models which are highly correlated (>0.75). Should we apply the same code as below for the mentioned example in the article?
# stack using random forest
set.seed(seed)
stack.rf <- caretStack(models, method="rf", metric="Accuracy", trControl=stackControl)
print(stack.rf)
I would suggest try and see if you can lift the performance by using a stacked model. Even just a few better predictions can help model performance.
Sorry, if you can elaborate on this will be great. How stacking algorithm has to be used when One model is having low correlation with all other models.
I don’t remember the specifics of the paper, but it was along the lines of better performance when predictions between weak learners are uncorrelated (or maybe it was the errors being uncorrelated). This may have been in PAC learning theory – it has been a while, sorry.
Hi, thanks for nice introduction to ensemble techniques.
I have one question. Can I ensemble 1 method repeatedly?
It seems CaretEnsemble mix different methods.
What if I want to ensemble a single method many times?(like boosting)
Function “train” seems to help resampling data and apply method repeatedly. But does it mean bagging or boosting? Or it just helps to pick a best parameter for single method?
Thanks in advance.
You can, but may not get any gain Gunwoo.
You could create 10 neural nets and take the mean prediction – this would probably outperform a stacking approach.
You can put other methods inside bagging (I don’t remember the package name off hand), but bagging works so much better with high variance methods – like unpruned trees or low-k in KNN with subsampled training data, etc.
At the end of the day, try different methods and see what gives the best results on your problem.
Thanks for your writting!
Can I ask you a question?
What is the maximum model can combine in this package?
I don’t know Anh. Perhaps it is limited by memory and CPU power.
I got it. Thank you so much
This post is the most useful job that I’ve seen about ensemble modeling!!
I have a question.
below sentences seem to show correlations between resampled accuracy measures of each models,
not correlations between predictions.
# correlation between results
modelCor(results)
splom(results)
correlations between accuracy ratios can be interpreted as them between predictions
by each model ?
Hello Jason, first l would like to thank you for such a nice article of ensemble methods. I have a question that may be naive but i m confused,
My question is that since ensemble methods are used on a base classifer model (naive base classifier, SVM etc.) to improve accuracy of the base model but how to choose on which classifier we should apply ensemble methods.
How do we know that wihch classifier is best for applying ensemble methods?
Great question Aadi.
Generally, we cannot know before hand. Use trial and error.
Perhaps we can ensemble a suite of well-performing models in the case of stacked generalization.
Perhaps we can ensemble a suite of well performing high variance models in the case of bagging.
It is really problem specific. This post will shed more light on the open problem of algorithm selection:
https://machinelearningmastery.com/a-data-driven-approach-to-machine-learning/
Best explanation of ensembles I’ve seen. Thanks for posting this
Thanks Carl.
we need to combine c5.0 and random forest for our dataset can we do it and how ?
Yes, the tutorial above should help. Sorry I cannot write the code for you.
Hi Jason, really inspired by your post. However, I have one question regarding the output of the stacking model.
“A rf ensemble of 2 base models: lda, rpart, glm, knn, svmRadial”, why there are only 2 base models? 2 is selected by the accuracy?
Good question.
I think that is a typo in the R code for the ensemble package. I would suggest ignoring it.
Can we have a deep learning system with (n-1) neural net layers and a final layer with a different algorithm, say SVM?
Yes. I would consider this a stacked ensemble.
Hi,
Is there any advantage in converting the first column to a numeric value instead of keeping it as a factor?
Thanks
This really depends on the specific data and the algorithms being used.
Most algorithms expect to work with numeric data instead of factors.
Hi, Jason.
what would be your recommended library to do something like this in python?
Thanks.
Great question, perhaps rolled by hand but first pushing sklearn to the limit:
https://machinelearningmastery.com/start-here/#python
This is definitely one of the best tutorial for ensemble learning using R for participants in competitions.
Can we have an tutorial for multi level ensemble models which are winning the competitions ?
Great suggestion, perhaps in the future.
Thanks Jason, it is a really clear and sound example. I really appreciated. I am starting in this arena, and it is pretty impressive the method.
I found references to a package named SuperLearner in R. I wonder if this package also work for this sort of examples or it has restrictions. I have a quick look at the documentation and I see that mentioned parametric models. Do you anything about SuperLearner?
Thanks Sergio.
Sorry, I am not familiar with that package.
You are the best and most unselfish ML expert out there. Reproducible, simple, and well explained.
Thanks Pat, that is very kind of you to say.
I’m very happy to hear you found the example useful!
Thank You Mr.Jason, very nice explanation. Can you please upload the same tutorial using some hydrological data?
Sorry I cannot.
One thing that would improve the tutorial is to show how to use the stacked models on the testing dataset or on new data for making predictions.
Thanks for the suggestion Eric.
Just wow Jason. Thank you so much for this very useful tutorial on ensemble methods. I have bought many a book on Machine Learning in R over the last 5 years and I think this is the best summary of how you can use multiple machine learning methods together to enable you to select the best option and the method which is most fit for purpose.
Again, you have proverbially saved my bacon here – so thank you!
THanks Gary, I’m glad to hear that.
can i make an ensemble to predict unknown data.
like :
https://archive.ics.uci.edu/ml/datasets/diabetes
dataset
consisting of
(1) Date in MM-DD-YYYY format
(2) Time in XX:YY format
(3) Code
(4) Value
number of codes are 20
33 = Regular insulin dose
34 = NPH insulin dose
35 = UltraLente insulin dose
48 = Unspecified blood glucose measurement
57 = Unspecified blood glucose measurement
58 = Pre-breakfast blood glucose measurement
59 = Post-breakfast blood glucose measurement
60 = Pre-lunch blood glucose measurement
61 = Post-lunch blood glucose measurement
62 = Pre-supper blood glucose measurement
63 = Post-supper blood glucose measurement
64 = Pre-snack blood glucose measurement
65 = Hypoglycemic symptoms
66 = Typical meal ingestion
67 = More-than-usual meal ingestion
68 = Less-than-usual meal ingestion
69 = Typical exercise activity
70 = More-than-usual exercise activity
71 = Less-than-usual exercise activity
72 = Unspecified special event
value represents for the respective code of a record
i have understood the dataset and transformed it to
input codes and output codes
i.e input codes means code values for glucose value
output codes as insulin values
as output vector codes: 33,34,35.
input codes vector: 48,57,58,59,60,61,62,63,64,65,66,67,68,69,70,71,72.
sample file contents of data01
date time code value
1 04-21-1991 9:09 58 100
2 04-21-1991 9:09 33 9
3 04-21-1991 9:09 34 13
4 04-21-1991 17:08 62 119
5 04-21-1991 17:08 33 7
after transformation
the sample table:
c48 c57 c58 c59 c60 c61 c62 c63 c64 c65 c66 c67 c68 c69 c70 c71 c72 c33 c34 c35 c33x c34x c35x
1 0 0 0 0 0 0 0 0 0 0 0 0 0 0 0 0 0 0 0 0 0 0 0
2 0 0 100 0 0 0 0 0 0 0 0 0 0 0 0 0 0 9 13 0 0 0 0
3 0 0 0 0 0 0 119 0 0 0 0 0 0 0 0 0 0 7 0 0 0 0 0
4 123 0 0 0 0 0 0 0 0 0 0 0 0 0 0 0 0 0 0 0 0 0 0
5 0 0 216 0 0 0 0 0 0 0 0 0 0 0 0 0 0 10 13 0 2 0 0
i used knn
and neural net to predict by giving any one code value and in response i got respective values which i trained the machine, my question is is it possible to predict the unknown data on which it has not trained
for example
upto glucose values i trained the machine for 350
if i have given 600 then why it is not giving the relative output it is showng the last i.e nearest neighbour value as a predicted value in neural networks..
Hi Jason, Thanks for this great work.
You’re welcome.
This one is really superb Jason. I used this for public kernel for titanic competition in Kaggle(with due credit of this article). https://www.kaggle.com/bhavesh09/stacking-example
However my score is just around 40%. I am not able to figure out why?
You will need to tune it to your specific dataset.
Hi jason, thanks for this great work.
i have a question, if i have a data set contains of android code and i need to apply ensemble method on this data set to improve the accuracy how i can apply ensemble techniques can i use weka tool or if u have another way to apply this work.
thank you
Most platforms, including Weka provide access to ensemble algorithms, for example:
https://machinelearningmastery.com/use-ensemble-machine-learning-algorithms-weka/
Hi Jason,
why do you think C5.0 is a boosting algorithm? Based on my understanding, C5.0 is just a simple decision tree algorithm.
From Page 392 of “Applied predictive modeling”:
Hi Jason,
I am planning to stack different algorithms like Artificial Neural Network, SVM, KNN, C5.0, Random Forest in my research work for predicting diabetes disease…Whether this is feasible?? or whether the library above works only with certain algorithms?
Sure, try it and see how you go on your specific dataset.
Any suggestions before implementation of my model? Or could you please share your previous experience on doing so?
Hello Sir,
I am trying to stacking using neural network for my research problem. I want to know whether it will be apt to use NN in case of stacking?
Perhaps try and discover what works best on your specific dataset.
don’t you split a trainingdata and a testdata?
how do you define a test set and a training set?
You can learn more here:
https://www.rdocumentation.org/packages/caret/versions/6.0-79/topics/trainControl
thank you for your advice! And I tried to use stacking,but the following error occurred
Error: wrong model type for regression
In addition: Warning messages:
1: In trControlCheck(x = trControl, y = target) :
x$savePredictions == TRUE is depreciated. Setting to ‘final’ instead.
2: In trControlCheck(x = trControl, y = target) :
indexes not defined in trControl. Attempting to set them ourselves, so each model in the ensemble will have the same resampling indexes.
can you give me some advice,please
Sorry, I have not seen this error, perhaps post to stackoverflow?
I‘ve solved the previous problem,another questions
1.is there any way to add the xgboost models?
2.can change KAPPA to AUC to validate model?
thank you!
Sure, you can use xgboost in R. Using them as part of another ensemble such as voting or stacking might not add a lot of value.
I believe you can calculate any metrics you wish. Sorry, I don’t have a worked example for AUC.
Yes, that can be a good way to evaluate the skill of machine learning algorithms on new data.
Here, we use repeated k-fold cross-validation.
Good evening mr. Jason.
I want to asking , what ensemble learning bagging-boosting-random forest for logistic regression and linear discriminant. Any specific syntac bagging-boosting-random forest for that classifier?
Bagging can be used with each algorithm, it is better suited to algorithms with high variance like unpruned trees.
Hello, I’d like to ask why the relevance of the model below 0.75 is feasible?why is not 0.7 or 0.8? Is there any papers to support that? Thank you
It is just an arbitrary cut-off for high correlation. You can choose another value if you wish.
When you say that the “predictions ” must not be too correlated, do you mean the posterior probabilities (not the predicted values which are two possible values)?
I mean the samples of predictions from the two methods.
But in most cases, the predictions are the same for every method here, since it’s a binary classification problem. How can the correlations be the so small ?
Other question : the caretList function does not seem to support missing values. How do you deal with that ?
I’m not sure caret supports imputing, perhaps prepare the data before hand.
Could you help me to find solution for that error (Value Error: could not convert string to float: ‘ [-5.67604346 -0.37017465 1.41012661 2.30903599 2.85538861] ‘)?
Sorry, I don’t know the cause of your error. Perhaps try posting all code and data to stackoverflow?
Hi Jason,
I am trying different algorithms on classifying cancer as either Malignant or Benign. When I compare these models (LDA, NN, KNN, RF, NB…) using modelCor function in caret package, I get negative correlation coefficient form some models. Is this something possible and how can they (negatively correlated) models be interpreted?
Thanks,
Yes, negative correlation means when the value of one goes up, the value of the other goes down.
Thanks for the tutorial. It was very much helpful. Can you please suggest how can I plot the ROC curve for a stacked model? Following your example, I have generated stack.svm, now please tell me how can I draw a ROC curve for it?
Sorry, I don’t have an example of plotting ROC curves in R.
HI i have few questions,
1. What is the reason behind choosing 5 models as base models. On what basis 5 models are chosen.
2. what is the maximum number of base models we can have.
3. Are the base models treated as uncorrelated decision trees by random forest algorithm? if not how the models are combined using random forest?
I chose 5 base models arbitrarily.
You can have as many or fewer models as you like. Perhaps test to discover what works best on your problem.
Ideally, the base models should make predictions (or make errors) that are weakly correlated.
2. what is the maximum number of base models we can have.
3. Are the base models treated as uncorrelated decision trees by random forest algorithm? if not how the models are combined using random forest?
how models are combined using random forest
Fitting unpruned trees where split points operate on a random subset of features.
No limit.
In all methods, it helps if the models are weakly correlated. Random forest is an extension of bagging.
Great Tutorial! Thank you Jason. Was able to easily adapt your script for my PhD Remote Sensing research at Oregon State.
I’m glad it helped Cory!
Hi Jason,
When I ran my codes, it witnessed an error.
> models <- caretList(Stroke~., data=d11, trControl=control, methodList=algorithmList)
Error: At least one of the class levels is not a valid R variable name; This will cause errors when class probabilities are generated because the variables names will be converted to X0, X1 . Please use factor levels that can be used as valid R variable names (see ?make.names for help).
In addition: Warning messages:
1: In trControlCheck(x = trControl, y = target) :
x$savePredictions == TRUE is depreciated. Setting to 'final' instead.
2: In trControlCheck(x = trControl, y = target) :
indexes not defined in trControl. Attempting to set them ourselves, so each model in the ensemble will have the same resampling indexes.
any suggestion?
Thanks for your time.
Sorry to hear that, I have some suggestions here:
https://machinelearningmastery.com/faq/single-faq/why-does-the-code-in-the-tutorial-not-work-for-me
Hello Jason! your post helps me so much I really so thankful to you
How many layers have you used in stacking example?
if two, which classifiers exist or reside in the bottom layer and which classifiers reside in the top layer?
in the following line of code does “glm” in the top layer?
stack.glm <- caretStack(models, method="glm", metric="Accuracy", trControl=stackControl)
based on what condition I should choose the top layer's model in order to best combine the predictions of all models?
This is explained in the post, I recommend re-reading that section.
I recommend testing a suite of different models and discover what works best, ideally they should be somewhat uncorrelated in their predictions/error.
sorry, Jason, I read the section many times but I didn’t figure out how many layers in the stacking ensemble in your example? Maybe you refer to it implicitly throughout the article but I am a beginner and I didn’t get it?
Sorry, one level of base models and one level for the ensemble model.
Thank you Jason that is very kind of you
Hi Jason
your explanation is so clear and easy to grasp
I have a question about modelCor() function, it computes the correlation according to the Pearson or Spearman correlation method?
I would like to read more about the working of modelCor()function because I want to print the prediction’s matrix for each model in R. the models that are used as inputs to the modelCor function in order to see the matrix used in correlation
is it possible to provide me a link or any information about modelCor()function because I read about this function in the help of R but the information was so limited?
Type:
?modelCor
Hi Jason,
Thank you very much for your instruction.
I have 2 questions, hoping you will help me explain.
1. In the part of Stacking Algorithms, I see that you used 5 sub-model, How I can find another model, Have any target?
2. Why you choose Random forest and glm? How about the other?
Thank you very much
The answer to these questions can only be found via systematic experimentation – there are no theories of mapping algorithms to problems or algorithm configuration based on problem type.
Test different numbers of sub-models on your problem to see what works best.
Test different model types, to see what works best for your specific dataset.
hi Jason,
thanks for the tutorial. it was great.
does the stacking algorithm only work for binary classification?
do you know how can I change the stacking code in order to use for Multi-class classification?
No, I believe you can use it directly for multi-class classification.
very useful example and nice tutorial..Pls tell me which coorelation function used by modelCOr() and why? Any refrence that i can use for modelCor()
Thanks.
I would guess Pearson’s correlation coefficient for linear correlation, but you can check the documentation for the function to be sure.
This technique in ensemble is very easy but actually it gave me less accuracy than this technique :
can any one tell me way ?
Yes, this can happen.
It is important to test a suite of algorithms on your dataaset to discover what works best.
Hi
Thanks for your awesome post. I have some questions. What about tuning parameters in ensemble? And how we measure the accuracy?
Sorry instead of accuracy I meant variance.
You can collect the sample of accuracy scores across repeated k-fold cross validation and report the mean and standard deviation.
Yes, you can tune hyperparameters in the ensemble.
You can measure accuracy as you do for any other model.
Dear Jason
Thank you very much for such a wonderful post which was a pleasure to follow. I have a set of 10 GCM predictions for which I would like to have the best prediction out of them (i.e. the best ensemble). I have clearly understood your tutorial, but is it possible to come up with a time series data file for the best ensemble. I would like to use the time series for further investigation.
You’re welcome.
Perhaps. I don’t have an example, sorry.
Hi Jason
How to ensemble random forest and neural network in R.
Perhaps try a voting ensemble or a stacking ensemble.
Thank you. I need some help here, can you please state with some example that how to perform.
Sorry, I don’t have the capacity to prepare a custom example for you.
Hey Jason – really love this example & all of your explanations…each one is very succinct & easy to understand.
I just have one question: In theory, should caretStack only be applied to base learners like a GLM & SVM or could you also use caretStack to combine boosting & bagging algorithms like C5.0, GBM, and RF so long as these models have little correlation to each other?
Thanks!
Yes, most likely.
Dear Jason,
The “Bagging Models” does not work.
Thanks for your job.
Sorry to hear that, what problem do you get exactly?
Dear Jason,
Thanks for the tutorial. I’ve tried to use modelCor() to present the correlation of some models in order to verify if an ensemble of the methods will improve the results. However, some correlation resulted in “NA”. Did you know some feature to correct this?
Thanks in advance.
Best regards.
Do you mean the diagonal, if so, no need to calculate correlation of a sample with itself.
No, other values of the matrix. Example: I consider four methods: rf, svmRadialWeights, gbm and rpart. The correlation of svmRadialWeights and rf is 0.5722874, the correlation of gbm and rf is -0.1273161, but when I calculate the correlation of rpart with any method the results are NA.
When I run the method rpart individually it works fine.
If some of your values are na, then the result will also be na, you will need to remove them from the values.
I don’t have any NA values in my data, that’s why I didn’t understand the results of ensemble when using method rpart…
Perhaps it is worth posting your code, data, and error to stackoverflow.
Hi Jason,
Thanks for the tutorial. Just a quick update, as of September 2020, my results using exactly the same code are slightly different. Not a big deal, just gbm provides more accurate results than c5.0 in the Boosting Algorithms section now. I tested both in R 4.0 and 3.6.3, I got the same results.
This is to be expected, see this:
https://machinelearningmastery.com/faq/single-faq/why-do-i-get-different-results-each-time-i-run-the-code
We know things related to the above, or we know things because we have inherited some of the knowledge with our gene
Sorry, I don’t understand. Can you please elaborate?
hello Jason,
Thanks for the explanation! I was wondering if I can use these techniques for non binary numerical variables as the response variable. Or are there other types of algorithms to use for that? Ex: to predict the imdb score of a movie, using machine learning techniques.
You’re welcome.
Yes, that is called regression. Many of the algorithms can be used for regression also.
Hi! Very helpfull article!
One question. If i have qualitative predictors like
Q11={less than one time per week, 1-2 times per week, 3 or more times per week}
and i want to predict
Q15={very bad ,bad,good,very good}
do i have to make them numeric ? or if turn them in to factors and feed them to the model it will be ok ?
Some algorithms can work with them as factors directly, some may require you to encode them first.
Indeed it’s good article.
Just a quick question.
I have only two variables X and Y and it’s a regression problem. I used power function to predict Y and getting 47% accuracy.
If I try boosting or bagging using linear regression, can I expect significant improvement in R-square.
How to get the prediction function and formula for the same.
Thanks!
Accuracy cannot be measured for regression, instead we must use error.
Some algorithms will give you a formula (such as linear algorithms), most do not. You may need to check the documentation for the algorithm that you are using.
Hi Jason,
I got this error “Error: wrong model type for regression”.
How do I correct it?
In order words, I apply this code for a regression problem, what should I change in the code?
I tried to change: metric <- "RMSE", but it is not work.
Looks like you are trying to use a classification algorithm for a regression problem.