A benefit of using ensembles of decision tree methods like gradient boosting is that they can automatically provide estimates of feature importance from a trained predictive model.
In this post you will discover how you can estimate the importance of features for a predictive modeling problem using the XGBoost library in Python.
After reading this post you will know:
- How feature importance is calculated using the gradient boosting algorithm.
- How to plot feature importance in Python calculated by the XGBoost model.
- How to use feature importance calculated by XGBoost to perform feature selection.
Kick-start your project with my new book XGBoost With Python, including step-by-step tutorials and the Python source code files for all examples.
Let’s get started.
- Update Jan/2017: Updated to reflect changes in scikit-learn API version 0.18.1.
- Update Mar/2018: Added alternate link to download the dataset as the original appears to have been taken down.
- Update Apr/2020: Updated example for XGBoost 1.0.2.

Feature Importance and Feature Selection With XGBoost in Python
Photo by Keith Roper, some rights reserved.
Need help with XGBoost in Python?
Take my free 7-day email course and discover xgboost (with sample code).
Click to sign-up now and also get a free PDF Ebook version of the course.
Feature Importance in Gradient Boosting
A benefit of using gradient boosting is that after the boosted trees are constructed, it is relatively straightforward to retrieve importance scores for each attribute.
Generally, importance provides a score that indicates how useful or valuable each feature was in the construction of the boosted decision trees within the model. The more an attribute is used to make key decisions with decision trees, the higher its relative importance.
This importance is calculated explicitly for each attribute in the dataset, allowing attributes to be ranked and compared to each other.
Importance is calculated for a single decision tree by the amount that each attribute split point improves the performance measure, weighted by the number of observations the node is responsible for. The performance measure may be the purity (Gini index) used to select the split points or another more specific error function.
The feature importances are then averaged across all of the the decision trees within the model.
For more technical information on how feature importance is calculated in boosted decision trees, see Section 10.13.1 “Relative Importance of Predictor Variables” of the book The Elements of Statistical Learning: Data Mining, Inference, and Prediction, page 367.
Also, see Matthew Drury answer to the StackOverflow question “Relative variable importance for Boosting” where he provides a very detailed and practical answer.
Manually Plot Feature Importance
A trained XGBoost model automatically calculates feature importance on your predictive modeling problem.
These importance scores are available in the feature_importances_ member variable of the trained model. For example, they can be printed directly as follows:
|
1 |
print(model.feature_importances_) |
We can plot these scores on a bar chart directly to get a visual indication of the relative importance of each feature in the dataset. For example:
|
1 2 3 |
# plot pyplot.bar(range(len(model.feature_importances_)), model.feature_importances_) pyplot.show() |
We can demonstrate this by training an XGBoost model on the Pima Indians onset of diabetes dataset and creating a bar chart from the calculated feature importances.
Download the dataset and place it in your current working directory.
|
1 2 3 4 5 6 7 8 9 10 11 12 13 14 15 16 17 |
# plot feature importance manually from numpy import loadtxt from xgboost import XGBClassifier from matplotlib import pyplot # load data dataset = loadtxt('pima-indians-diabetes.csv', delimiter=",") # split data into X and y X = dataset[:,0:8] y = dataset[:,8] # fit model no training data model = XGBClassifier() model.fit(X, y) # feature importance print(model.feature_importances_) # plot pyplot.bar(range(len(model.feature_importances_)), model.feature_importances_) pyplot.show() |
Note: Your results may vary given the stochastic nature of the algorithm or evaluation procedure, or differences in numerical precision. Consider running the example a few times and compare the average outcome.
Running this example first outputs the importance scores.
|
1 |
[ 0.089701 0.17109634 0.08139535 0.04651163 0.10465116 0.2026578 0.1627907 0.14119601] |
We also get a bar chart of the relative importances.
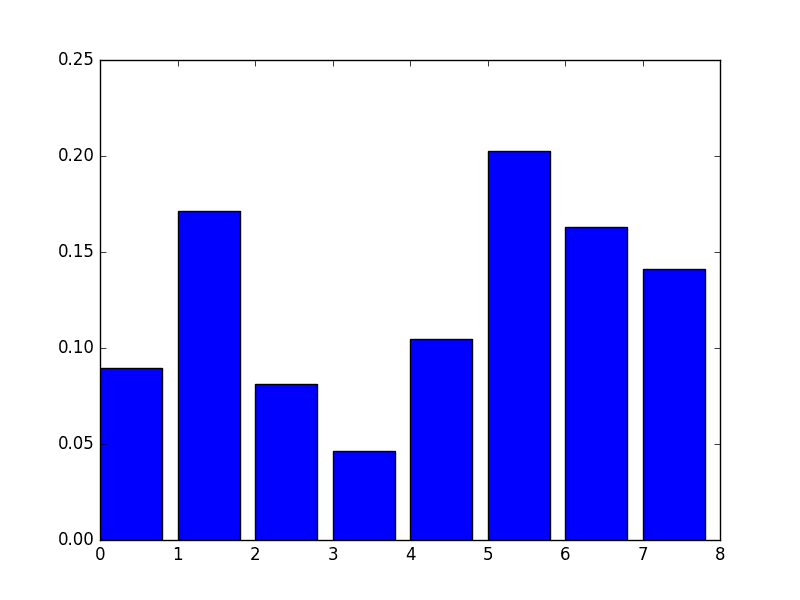
Manual Bar Chart of XGBoost Feature Importance
A downside of this plot is that the features are ordered by their input index rather than their importance. We could sort the features before plotting.
Thankfully, there is a built in plot function to help us.
Using theBuilt-in XGBoost Feature Importance Plot
The XGBoost library provides a built-in function to plot features ordered by their importance.
The function is called plot_importance() and can be used as follows:
|
1 2 3 |
# plot feature importance plot_importance(model) pyplot.show() |
For example, below is a complete code listing plotting the feature importance for the Pima Indians dataset using the built-in plot_importance() function.
|
1 2 3 4 5 6 7 8 9 10 11 12 13 14 15 16 |
# plot feature importance using built-in function from numpy import loadtxt from xgboost import XGBClassifier from xgboost import plot_importance from matplotlib import pyplot # load data dataset = loadtxt('pima-indians-diabetes.csv', delimiter=",") # split data into X and y X = dataset[:,0:8] y = dataset[:,8] # fit model no training data model = XGBClassifier() model.fit(X, y) # plot feature importance plot_importance(model) pyplot.show() |
Note: Your results may vary given the stochastic nature of the algorithm or evaluation procedure, or differences in numerical precision. Consider running the example a few times and compare the average outcome.
Running the example gives us a more useful bar chart.
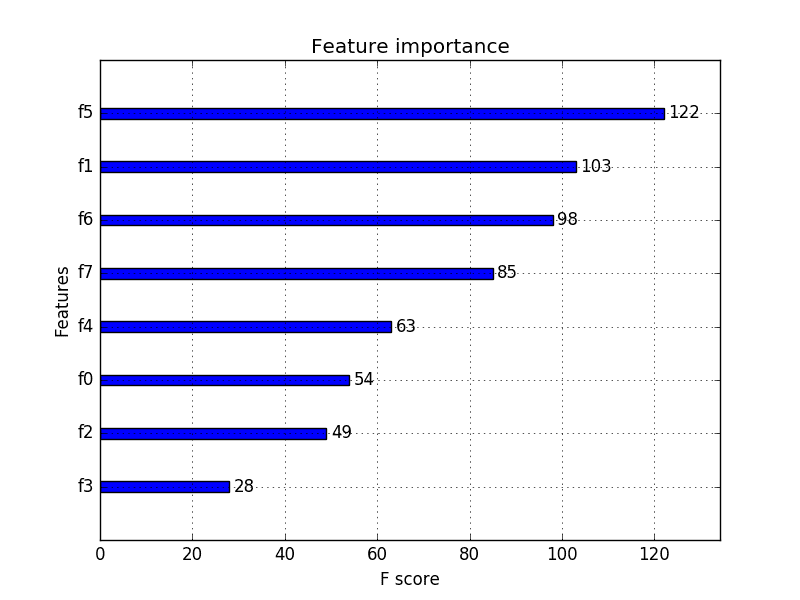
XGBoost Feature Importance Bar Chart
You can see that features are automatically named according to their index in the input array (X) from F0 to F7.
Manually mapping these indices to names in the problem description, we can see that the plot shows F5 (body mass index) has the highest importance and F3 (skin fold thickness) has the lowest importance.
Feature Selection with XGBoost Feature Importance Scores
Feature importance scores can be used for feature selection in scikit-learn.
This is done using the SelectFromModel class that takes a model and can transform a dataset into a subset with selected features.
This class can take a pre-trained model, such as one trained on the entire training dataset. It can then use a threshold to decide which features to select. This threshold is used when you call the transform() method on the SelectFromModel instance to consistently select the same features on the training dataset and the test dataset.
In the example below we first train and then evaluate an XGBoost model on the entire training dataset and test datasets respectively.
Using the feature importances calculated from the training dataset, we then wrap the model in a SelectFromModel instance. We use this to select features on the training dataset, train a model from the selected subset of features, then evaluate the model on the testset, subject to the same feature selection scheme.
For example:
|
1 2 3 4 5 6 7 8 9 |
# select features using threshold selection = SelectFromModel(model, threshold=thresh, prefit=True) select_X_train = selection.transform(X_train) # train model selection_model = XGBClassifier() selection_model.fit(select_X_train, y_train) # eval model select_X_test = selection.transform(X_test) y_pred = selection_model.predict(select_X_test) |
For interest, we can test multiple thresholds for selecting features by feature importance. Specifically, the feature importance of each input variable, essentially allowing us to test each subset of features by importance, starting with all features and ending with a subset with the most important feature.
The complete code listing is provided below.
|
1 2 3 4 5 6 7 8 9 10 11 12 13 14 15 16 17 18 19 20 21 22 23 24 25 26 27 28 29 30 31 32 33 34 35 36 37 |
# use feature importance for feature selection from numpy import loadtxt from numpy import sort from xgboost import XGBClassifier from sklearn.model_selection import train_test_split from sklearn.metrics import accuracy_score from sklearn.feature_selection import SelectFromModel # load data dataset = loadtxt('pima-indians-diabetes.csv', delimiter=",") # split data into X and y X = dataset[:,0:8] Y = dataset[:,8] # split data into train and test sets X_train, X_test, y_train, y_test = train_test_split(X, Y, test_size=0.33, random_state=7) # fit model on all training data model = XGBClassifier() model.fit(X_train, y_train) # make predictions for test data and evaluate y_pred = model.predict(X_test) predictions = [round(value) for value in y_pred] accuracy = accuracy_score(y_test, predictions) print("Accuracy: %.2f%%" % (accuracy * 100.0)) # Fit model using each importance as a threshold thresholds = sort(model.feature_importances_) for thresh in thresholds: # select features using threshold selection = SelectFromModel(model, threshold=thresh, prefit=True) select_X_train = selection.transform(X_train) # train model selection_model = XGBClassifier() selection_model.fit(select_X_train, y_train) # eval model select_X_test = selection.transform(X_test) y_pred = selection_model.predict(select_X_test) predictions = [round(value) for value in y_pred] accuracy = accuracy_score(y_test, predictions) print("Thresh=%.3f, n=%d, Accuracy: %.2f%%" % (thresh, select_X_train.shape[1], accuracy*100.0)) |
Note, if you are using XGBoost 1.0.2 (and perhaps other versions), there is a bug in the XGBClassifier class that results in the error:
|
1 |
KeyError: 'weight' |
This can be fixed by using a custom XGBClassifier class that returns None for the coef_ property.
The complete example is listed below.
|
1 2 3 4 5 6 7 8 9 10 11 12 13 14 15 16 17 18 19 20 21 22 23 24 25 26 27 28 29 30 31 32 33 34 35 36 37 38 39 40 41 42 |
# use feature importance for feature selection, with fix for xgboost 1.0.2 from numpy import loadtxt from numpy import sort from xgboost import XGBClassifier from sklearn.model_selection import train_test_split from sklearn.metrics import accuracy_score from sklearn.feature_selection import SelectFromModel # define custom class to fix bug in xgboost 1.0.2 class MyXGBClassifier(XGBClassifier): @property def coef_(self): return None # load data dataset = loadtxt('pima-indians-diabetes.csv', delimiter=",") # split data into X and y X = dataset[:,0:8] Y = dataset[:,8] # split data into train and test sets X_train, X_test, y_train, y_test = train_test_split(X, Y, test_size=0.33, random_state=7) # fit model on all training data model = MyXGBClassifier() model.fit(X_train, y_train) # make predictions for test data and evaluate predictions = model.predict(X_test) accuracy = accuracy_score(y_test, predictions) print("Accuracy: %.2f%%" % (accuracy * 100.0)) # Fit model using each importance as a threshold thresholds = sort(model.feature_importances_) for thresh in thresholds: # select features using threshold selection = SelectFromModel(model, threshold=thresh, prefit=True) select_X_train = selection.transform(X_train) # train model selection_model = XGBClassifier() selection_model.fit(select_X_train, y_train) # eval model select_X_test = selection.transform(X_test) predictions = selection_model.predict(select_X_test) accuracy = accuracy_score(y_test, predictions) print("Thresh=%.3f, n=%d, Accuracy: %.2f%%" % (thresh, select_X_train.shape[1], accuracy*100.0)) |
Note: Your results may vary given the stochastic nature of the algorithm or evaluation procedure, or differences in numerical precision. Consider running the example a few times and compare the average outcome.
Running this example prints the following output.
|
1 2 3 4 5 6 7 8 9 |
Accuracy: 77.95% Thresh=0.071, n=8, Accuracy: 77.95% Thresh=0.073, n=7, Accuracy: 76.38% Thresh=0.084, n=6, Accuracy: 77.56% Thresh=0.090, n=5, Accuracy: 76.38% Thresh=0.128, n=4, Accuracy: 76.38% Thresh=0.160, n=3, Accuracy: 74.80% Thresh=0.186, n=2, Accuracy: 71.65% Thresh=0.208, n=1, Accuracy: 63.78% |
We can see that the performance of the model generally decreases with the number of selected features.
On this problem there is a trade-off of features to test set accuracy and we could decide to take a less complex model (fewer attributes such as n=4) and accept a modest decrease in estimated accuracy from 77.95% down to 76.38%.
This is likely to be a wash on such a small dataset, but may be a more useful strategy on a larger dataset and using cross validation as the model evaluation scheme.
Summary
In this post you discovered how to access features and use importance in a trained XGBoost gradient boosting model.
Specifically, you learned:
- What feature importance is and generally how it is calculated in XGBoost.
- How to access and plot feature importance scores from an XGBoost model.
- How to use feature importance from an XGBoost model for feature selection.
Do you have any questions about feature importance in XGBoost or about this post? Ask your questions in the comments and I will do my best to answer them.
Discover The Algorithm Winning Competitions!
Develop Your Own XGBoost Models in Minutes
...with just a few lines of Python
Discover how in my new Ebook:
XGBoost With Python
It covers self-study tutorials like:
Algorithm Fundamentals, Scaling, Hyperparameters, and much more...
Bring The Power of XGBoost To Your Own Projects
Skip the Academics. Just Results.


 for Feature Selection in Python")


Hi. I am running “select_X_train = selection.transform(X_train)” where x_train is the data with dependent variables in few rows.
The error I am getting is “select_X_train = selection.transform(X_train)”
Request your help.
Thanks!
sorry the error is “TypeError: only length-1 arrays can be converted to Python scalars”.
Check the shape of your X_train, e.g. print(X_train.shape)
You may need to reshape it into a matrix.
How would you solve this? I have the same issue
This may help:
https://machinelearningmastery.com/index-slice-reshape-numpy-arrays-machine-learning-python/
I tried to select features for xgboost based on this post (last part which uses thresholds) but since I am using gridsearch and pipeline, this error is reported:
select_X_train = selection.transform(X_train)
File “C:\Users\Markazi.co\Anaconda3\lib\site-packages\sklearn\feature_selection\base.py”, line 76, in transform
mask = self.get_support()
File “C:\Users\MM.co\Anaconda3\lib\site-packages\sklearn\feature_selection\base.py”, line 47, in get_support
mask = self._get_support_mask()
File “C:\Users\Markazi.co\Anaconda3\lib\site-packages\sklearn\feature_selection\from_model.py”, line 201, in _get_support_mask
scores = _get_feature_importances(estimator)
File “C:\Users\Markazi.co\Anaconda3\lib\site-packages\sklearn\feature_selection\from_model.py”, line 32, in _get_feature_importances
% estimator.__class__.__name__)
ValueError: The underlying estimator method has no
coef_orfeature_importances_attribute. Either pass a fitted estimator to SelectFromModel or call fit before calling transform.regards,
Hi sa,
Consider trying the example without Pipelines first, get it working, then try adding in additional complexity.
Hello Mr. Brownlee
Thanks
I already tried the example without Pipelines , and it works well. After adding pipeline, it could extract feature importance but after that it fails. Thanks.
Best regards,
Thanks for the post. I don’t understand what’s the meaning of “F-score” in the x-axis of the feature importance plot….. And what is the number next to each of the bar?
Hi Johnn,
You can learn more about the F1 score here:
https://en.wikipedia.org/wiki/F1_score
The number is a scaled importance, it really only has meaning relative to other features.
Hey Jason,
Are you sure the F score on the graph is realted to the tradicional F1-score?
I found this github page where the owner presents many ways to extract feature importance meaning from xgb. His explanation abou the F measure seems to have no relation to F1
https://github.com/Far0n/xgbfi
Importance scores are different from F scores. The above tutorial focuses on feature importance scores.
Hi Johnn,
Gonçalo has right , not the F1 score was the question. F1 score is totally different from the F score in the feature importance plot.
F score in the feature importance context simply means the number of times a feature is used to split the data across all trees. at least, if you are using the built-in feature of Xgboost.
Resource: https://github.com/dmlc/xgboost/blob/b4f952b/python-package/xgboost/core.py#L1639-L1661
I hope it helped to clarify things.
Cheers,
D.
Thanks for sharing!
plot_importance() by default plots feature importance based on importance_type = ‘weight’, which is the number of times a feature appears in a tree.
It is confusing when compared to clf.feature_importance_, which by default is based on normalized gain values.
You can check the correspondence between the plot and the feature_importance_ values using this code:
# How to get back feature_importances_ (gain based) from plot_importance fscore
# Calculate two types of feature importance:
# Weight = number of times a feature appears in tree
# Gain = average gain of splits which use the feature = average all the gain values of the feature if it appears multiple times
# Normalized gain = Proportion of average gain out of total average gain
k = clf.get_booster().trees_to_dataframe()
group = k[k[‘Feature’]!=’Leaf’].groupby(‘Feature’).agg(fscore = (‘Gain’, ‘count’),
feature_importance_gain = (‘Gain’, ‘mean’))
# Feature importance same as plot_importance(importance_type = ‘weight’), default value
group[‘fscore’].sort_values(ascending=False)
# Feature importance same as clf.feature_importance_ default = ‘gain’
group[‘feature_importance_gain_norm’] = group[‘feature_importance_gain’]/group[‘feature_importance_gain’].sum()
group[‘feature_importance_gain_norm’].sort_values(by=’feature_importance_gain_norm’, ascending=False)
# Feature importance same as plot_importance(importance_type = ‘gain’)
group[[‘feature_importance_gain’]].sort_values(by=’feature_importance_gain’, ascending=False)
Note:
1. Features with zero feature_importance_ don’t show in trees_to_dataframe(). You can check what they are with:
X_train.columns[[ x not in k[‘Feature’].unique() for x in X_train.columns]]
2. The feature importance ranks for ‘weight’ and ‘gain’ types can be quite different. Be careful when choosing features based on the plot. I would choose gain over weight because gain reflects the feature’s power of grouping similar instances into a more homogeneous child node at the split.
Fantastic comment!
Hi Jason,
Your postings are always amazing for me to learn ML techniques!
Especially this XGBoost post really helped me work on my ongoing interview project.
The task is not for the Kaggle competition but for my technical interview! 🙂
I used your code to generate a feature importance ranking and some of the explanations you used to describe techniques.
You can find it here: https://www.kaggle.com/soyoungkim/two-sigma-connect-rental-listing-inquiries/rent-interest-classifier
I also put your link in the reference section.
Please let me know if it is not appropriate for me to use your code.
Well done.
As long as you cite the source, I am happy.
Hi Jason,
I have some questions about feature importance.
I want to use the features that selected by XGBoost in other classification models, and
I got confused on how to get the right scores of features, I mean that is it necessary to adjust parameters to get the best model and obtain the corresponding scores of features? In other words, how can I get the right scores of features in the model?
Thanks a lot.
The scores are relative.
You can use them as a filter and select all features with a score above x, e.g. 0.5.
Hi Jason, I know that choosing a threshold (like 0.5) is always arbitray …but is there a rule of thumb for this?
thanks a lot.
Yes, start with 0.5, tune if needed.
Hi Jason,
Is there a score which should be discounted? For example, my highest score is 0.27, then 0.15, 0.13… Should I discount the model all together? Thanks!
Scores are relative. Test different cut-off values on your specific dataset.
One good way to not worry about thresholds is to use something like – CalibratedClassifierCV(clf, cv=’prefit’, method=’sigmoid’).
It kind of calibrated your classifier to .5 without screwing you base classifier output.
Nice, thanks for sharing this tip!
I also have a little more on the topic here:
https://machinelearningmastery.com/calibrated-classification-model-in-scikit-learn/
Hello sir,
For the XGBoost feature selection, How do i change the Y axis to the names of my attributes. Kind regards sir.
Great question, I’m not sure off-hand. You may need to use the xgboost API directly.
@Omogbehin, to get the Y labels automatically, you need to switch from arrays to Pandas dataframe. By doing so, you get automatically labeled Y and X.
column_names = [‘preg’, ‘plas’, ‘pres’, ‘skin’, ‘test’, ‘mass’, ‘pedi’, ‘age’, ‘class’]
data = pd.read_csv(“diabetes.csv”, names = column_names)
X = data.iloc[:,0:8]
Y = data.iloc[:,8]
model = XGBClassifier()
model.fit(X, Y)
from xgboost import plot_importance
plot_importance(model)
plt.show()
1. You can plot feature_importance directly as in:
clf = xgb.XGBClassifier(
learning_rate =0.1,
n_estimators=1000,
max_depth=5,
min_child_weight=1,
gamma=0,
subsample=0.8,
colsample_bytree=0.8,
objective= ‘multi:softprob’,
nthread=4,
# scale_pos_weight=1,
num_class=6,
seed=0,
verbosity=0).fit(X_train, y_train)
%matplotlib notebook
fig, ax = plt.subplots(figsize=(10,6))
xgb.plot_importance(clf, height = 0.4, grid = False, ax=ax, importance_type=’weight’)
fig.subplots_adjust(left = 0.35);
2. Or you can also output a list of feature importance based on normalized gain values, i.e. gain/sum of gain:
pd.Series(clf.feature_importances_, index=X_train.columns, name=’Feature_Importance’).sort_values(ascending=False)
Great tips!
Hi Jason,
Is it possible using “feature_importances_” in XGBRegressor() ?
I’m not sure off the cuff, sorry.
Ok, I will try another method for features selection.
Thanks
Hello Jason, I use the XGBRegressor and want to do some feature selection. However, although the ‘plot_importance(model)’ command works, when I want to retreive the values using model.feature_importances_, it says ‘AttributeError: ‘XGBRegressor’ object has no attribute ‘feature_importances_’. Any hints how to retreive the feature importances for regression?
Sorry to hear that Richard. I’m not sure of the cause.
Hi Jason,
Do you know some methods to quality variable importance in RNN or LSTM? Could the XGBoost method be used in regression problems of RNN or LSTM? Thanks a lot.
Perhaps, I have not tried.
Can you explain how the decision trees feature importance also works?
Hi Jason while trying to fir my model in Xgboost object it is showing the below error
OSError: [WinError -529697949] Windows Error 0xe06d7363
i am using 32 bit anaconda
import platform
platform.architecture()
(’32bit’, ‘WindowsPE’)
Please suggect how to get over this issue
Sorry, I have not seen this error.
Perhaps you can post to stackoverflow?
Hi Jason.
SelectFromModel(model, threshold=thresh, prefit=True)
I wonder what prefit = true means in this section. I checked on the sklearn site, but I do not understand.
It specifies not to fit the model again, that we have already fit it prior.
Hi, Jason
Can you get feature importance of artificial neural network?
If you can, how?
Thanks very much.
Perhaps, I have not seen this done.
Hi, Jason. I am doing a project with Stochastic gradient boosting. My database is clinical data and I think the ranking of feature importance can feed clinicians back with clinical knowledge, i.e., machine can tell us which clinical features are most important in distinguishing phenotypes of the diseases. What I did is to predict the phenotypes of the diseases with all the variables of the database using SGB in the training set, and then test the performance of the model in testing set. If the testing is good (e.g., high accuracy and kappa), then I would like to say the ranking of the feature importance is reasonable as machine can make good prediction using this ranking information (i.e., the feature importance is the knowledge machine learns from the database and it is correct because machine uses this knowledge to make good classification). Vice versa, if the prediction is poor I would like to say the ranking of feature importance is bad or even wrong. In this case we cannot trust the ‘knowledge’ feed back by the machine. In other words, it wastes time to do feature selection in this case because the feature importance is not correct (either because of the poor data quality or the machine learning algorithm is not suitable). May I ask whether my thinking above is reasonable?
My second question is that I did not do feature selection to identify a subset of features as you did in your post. I just treat the few features on the top of the ranking list as the most important clinical features and then did classical analysis like t test to confirm these features are statistically different in different phenotypes. Can I still name it as feature selection or feature extraction? I am little bit confused about these terms. Thanks and I am waiting for your reply.
Sorry, I’m not sure I follow. Perhaps you can distil your question into one or two lines?
Yes, you could still call this feature selection.
Thanks for your reply.
As you may know, stochastic gradient boosting (SGB) is a model with built-in feature selection, which is thought to be more efficient in feature selection than wrapper methods and filter methods. But I doubt whether we can always trust the feature selected by SGB because the importance (relative influence) of the features are still provided by the model when the model has bad performance (e.g., very poor accuracy in testing). In this case, the model may be even wrong, so the selected features may be also wrong. So I would like to hear some comment from you regarding to this issue.
Thanks.
Perhaps compare models fit with different subsets of features to see if it is lifting skill.
Try using an ensemble of models fit on different subsets of features to see if you can lift skill further.
Hi, Jason.
Could you please let me know if the feature selection method that you used here, is classified as filter, wrapper or embedded feature selection method?
Regards,
Here we are doing feature importance or feature scoring. It would be a filter.
Hi Brownlee, if I have a dataset with 118 variables, but the target variable is in 116, and I want to use 6-115 and 117-118 variables as dependent variables, how can I modify the code X = dataset[:,0:8]
y = dataset[:,8]
to get X and Y?
I did not figure out this simple question. Please help
Thanks,
Hi Jason,
Thanks for the tutorial.
Did you notice that the values of the importances were very different when you used model.get_importances_ versus xgb.plot_importance(model)?
I used these two methods on a model I just trained and it looks like they are completely different. Moreover, the numpy array feature_importances do not directly correspond to the indexes that are returned from the plot_importance function.
In other words, these two methods give me qualitatively different results. Any idea why?
I have not noticed that. Perhaps post a ticket on the xgboost user group or on the project? Sounds like a fault?
There is a typo in my question:
It should be model.feature_importances, not model.get_importances_.
Better importance estimation:
model.feature_importances_ uses the
Booster.get_fscore() which uses
Booster.get_score(importance_type=’weight’)
Which is an estimation to ‘gain’ (as of how many times all trees represented a certain feature).
I think it would be better to use Booster.get_score(importance_type=’gain’) to get a more precise evaluation of how important a feature is.
In general, it describes how good was it to split branches by that feature
Thanks for sharing.
Hi Jason
Thanks for all the awesome posts. Regarding the feature importance in Xgboost (or more generally gradient boosting trees), how do you feel about the SHAP? I am not sure if you already had any post discussing SHAP, but it is definitely interesting to people who need gradient boosting tree models for feature selections.
Thanks!
What is SHAP?
Hi Jason
I need to know the feature importance calculations by different methods like “weight”, “gain”, or “cover” etc. in Xgboost.
Please let me know how can we do it ? Can it be done using same way as you developed the model here (using Xgbclassifier).
Also what’s the default method which is giving variable importance as per your code
(model.feature_importances_).
I need to save importances for very large set of features(around 225 ) using “weight”, “gain”, or “cover” etc. in Xgboost.
I’m not sure xgboost can present this, you might have to implement it yourself.
you can use the following code:
model.get_booster().get_score(importance_type=’type’)
‘type’ can fill in ‘weight’ , ‘gain’ or ‘cover’.
default = ‘weight’
see: https://xgboost.readthedocs.io/en/latest/python/python_api.html
Excuse me, I come across a problem when modeling with xgboost. Could I ask for your help? I use predict function to get a predict probability, but I get some prob which is below 0 or over 1. I’m wondering what’s my problem. Could you help me? Thank you very much.
What is the problem exactly? Low probabilities?
Is it necessary to perform a gridsearch when comparing the performance of the model with different numbers of features? E.g if I wanted to see if a model with 8 features performed better than one with 4, would it be good practice to run a gridsearch with both?
It depends on how much time and resources you have and the goals of your project.
Perhaps a comparison of the same configuration of model with different input features would be a good first step (w.g. without the grid search).
How can we use let’s say top 10 features to train the model? I can not find a parameter to do so while initiating.
You must use feature selection methods to select the features you want to use. There is no best feature selection method, just different perspectives on what might be useful.
Hi Jason,
After reading your book, I was able to implement a model successfully. However, I have a few questions and I will appreciate if you provide feedback:
Q1 – In terms of feature selection, can we apply PCA (Principal Component Analysis), LDA (Linear Discriminant Analysis), or Kernel PCA when we use XGBOOST to determine the most important features?
Q2 – Do you think we should apply standard scaling after one hot encoding the categorical values? Again, some people say that this is not necessary in decision tree like models, but I would like to get your opinion.
Q3 – Do we need to be concerned with the dummy variable trap when we use XGBOOST? I couldn’t find a good source about how XGBOOST handles the dummy variable trap meaning if it is necessary to drop a column.
As always I really appreciate your feedback.
Thank you.
You can try dimensionality reduction methods, it really depends on the dataset and the configuration of the model as to whether they will be beneficial.
No real need to rescale data for xgboost. Standardizing might be useful for Gaussian variables. Test and see.
Dummy vars can be useful, especially if they expose a grouping of levels not obvious from the data (e.g. the addition of flag variables)
As always, thank you so much Jason.
For people who are interested in my experiment:
Dimensionality reduction method didn’t really help much. XGBOOST feature selection method was way better in my case.
Standardizing didn’t really change neither the accuracy score or the predicting results.
Keeping dummy variable increased the accuracy by about 2%, I used KFold to measure the accuracy.
Thanks
Thanks
Nice work!
Hi Jason,
Thanks for your post. It is really helpful.
But I am still confused about “Importance is calculated for a single decision tree by the amount that each attribute split point improves the performance measure”.
How to calculate the “amount that each attribute split point improves the performance measure”?
This is calculated as part of constructing each individual tree. The final importance scores are an average of these scores.
Hi Jason, I have encountered a problem when I try to reimplement the python trained xgboost model by c++. I built the same decision trees as the python trained(use the ‘model.dump_model’ function) but I got the different scores. I didn’t know why and can’t figure that,can you give me several tips? thanks!
Perhaps there was a difference in your implementation? It could be one of a million things – impossible for me to diagnose sorry.
Hi,
when I’m running this code:
plot_importance(model)
pyplot.show()
I’m getting an error:
ValueError: tree must be Booster, XGBModel or dict instance
How can I deal with that?
Sorry, I have not seen that error, I have some suggestions here:
https://machinelearningmastery.com/faq/single-faq/why-does-the-code-in-the-tutorial-not-work-for-me
Is there any way to get sign of the features to understand if the impact is positive or negative.
Not as far as I know, sorry.
When I click on the link: “names in the problem description” I get a 404 error.
The “f1, f2.. ” names are not useful. I want the real column names.
Thanks, I have updated the link to:
https://github.com/jbrownlee/Datasets/blob/master/pima-indians-diabetes.names
Hi Jason,
Thanks again for an awesome post. Just like there are some tips which we keep in mind while feature selection using Random Forest.
Like – The categorical variable with high cardinality/ continous variable are given preference over others (due to more number of splits)
And correlation is not visible in case of RF feature importance.
Do XGBoost have similar cons similar to Random Forest??
Yes, perhaps this post will help:
https://machinelearningmastery.com/configure-gradient-boosting-algorithm/
Hello!
Given feature importance is a very interesting property, I wanted to ask if this is a feature that can be found in other models, like Linear regression (along with its regularized partners), in Support Vector Regressors or Neural Networks, or if it is a concept solely defined solely for tree-based models. I ask because I am not sure whether I can consider eg Linear Regression’s coefficients as the analog for feature importance.
Thanks!
Yes, coefficient size in linear regression can be a sign of importance.
SVM, less so.
Many thanks!
You’re welcome.
Thanks for all of your posts. I use your blog to study a lot.
I have a question. If you had a large number of features, do you want to use all of them? I have a dataset with over 1,000 features but not all of them are meaningful for this classification problem I am working on. Should I reduce the number of features before applying XGBoost? If so, how can I do so?
Try modeling with all features and compare results to models fit on subsets of selected features to see if it improves performance.
Hi Jason,
Does multicollinearity affect feature importance for boosted regression trees? If so, how would you suggest to treat this problem?
Thanks!
Probably not.
Try modeling with an without the colinear features and compare results.
Hello Jason,
Concerning default feature importance in similar method from sklearn (Random Forest) I recommend meaningful article :
https://explained.ai/rf-importance/
The authors show that the default feature importance implementation using Gini is biased.
I observed this kind of bias several times, that is overestimation of importance of artificial random variables added to data sets. For this issue – so called – permutation importance was a solution at a cost of longer computation.
However, there are other methods like “drop-col importance” (described in same source). Interestingly, while working with production data, I observed that some variables occur in head of sorted distribution or in its tail – depending which method of 2 above I applied.
This is somehow confusing and now I am cautious in using RF for feature selection.
Do you have some experience in this field or some best practices to share?
Best regards!
Thanks for sharing.
My best advice is to use importance as a suggestion but remain skeptical. Test many methods, many subsets, make features earn the use in the model with hard evidence.
My data only has 6 columns, where i want to predict one of those columns so remaining 5. Out of which 2 are categorical variable and 3 are numerical variable. So, i used https://scikit-learn.org/stable/auto_examples/compose/plot_column_transformer_mixed_types.html to workout a mixed data type issues. But when i the feature_importance size does not match with the original number of columns? The size of feature_importances_ array is 918
I mean its generating extra feature or is it creating a feature value for one_hot_encoding of the categorical variable.
I checked my data has 1665 unique brand values. So, its not the same as feature_importances_ array size
Performing feature selection on the categorical data might be confusing as it is probably one hot encoded.
Perhaps create a subset of the data with just the numerical features and perform feature selection on that?
Thanks, but i found it was working once i tried dummies in place of the above mentioned column transformer approach seems like during transformation there is some loss of information when the xgboost booster picks up the feature names
Glad to hear it.
Interesting article, thanks a lot!!
Ho can I reverse-engineer a Decision Tree? That is, change the target variable and consequently have feature variables adjust themselves.
Basically, I want to set a target variable value and get all possible values of feature variables that can yield the target variable value.
Reverse ML/predictive modeling is very hard if not entirely intractable.
You could turn one tree into rules and do this and give many “results”.
It would might not make sense for an ensemble of trees.
Hi Jason,
Thanks for your prompt response. I will will try to work on the solution and let you know how it goes.
Kind Regards
Good luck!
How to extract the n best attributs at the end?
I give an example in the above tutorial.
Thanks Jason, very helpful!
Is there a way to determine if a feature has a net positive or negative correlation with the outcome variable?
Yes, you can calculate the correlation between them.
precision: 51.85%
Thresh=0.030, n=10, precision: 46.81%
Thresh=0.031, n=9, precision: 50.00%
Thresh=0.032, n=8, precision: 47.83%
Thresh=0.033, n=7, precision: 51.11%
Thresh=0.035, n=6, precision: 48.78%
Thresh=0.041, n=5, precision: 41.86%
Thresh=0.042, n=4, precision: 58.62%
Thresh=0.043, n=3, precision: 68.97%
Thresh=0.045, n=2, precision: 62.96%
Thresh=0.059, n=1, precision: 0.00%
Hi Jason, Thank you for your post, and I am so happy to read this kind of useful ML articles. I have a question: the above output is from my example. As you can see, when thresh = 0.043 and n = 3, the precision dramatically goes up. So, I want to take a closer look at that thresh and wants to find out the names and corresponding feature importances of those 3 features. How can I achieve this goal?
Each feature has a unique index of the column in the dataset from 0 to n. If you know the names of the columns, you can map the column index to names.
You can then do this in Python to automate it.
I hope that helps.
Hi! I am using instead the xgb.train command instead of XGBClassifier because this is much faster. By the way you have any idea why, and if it possible to obtain the same performance with XGBClassifier (might be related to the number of threads)?
Anyway, you have any idea of how to get importance feature with xgb.train?
Many thanks
Are you sure it is faster? It should be identical in speed.
Any reason why the Accuracy has increased from 76.38 at n=7 to 77.56 at n=6 ?
Perhaps the change in inputs or perhaps the stochastic nature of the learning algorithm.
A fair comparison would use repeated k-fold cross validation and perhaps a significance test.
Hello Jason,
I work on an imbalanced dataset for annomaly detection in machines. I have 590 features and 1567 observations. I tried this approach for reducing the number of features since I noticed there was multicollinearity, however, there is no important shift in the results for my precision and recall and sometimes the results get really weird. I was wondering what could that be an indication of?
Here are the results of the features selection
Thresh=0.000, n=211, f1_score: 5.71%
precision_score: 50.00%
recall_score: 3.03%
accuracy_score: 91.22%
Thresh=0.000, n=210, f1_score: 5.71%
precision_score: 50.00%
recall_score: 3.03%
accuracy_score: 91.22%
Thresh=0.000, n=209, f1_score: 5.71%
precision_score: 50.00%
recall_score: 3.03%
accuracy_score: 91.22%
Thresh=0.000, n=208, f1_score: 5.71%
precision_score: 50.00%
recall_score: 3.03%
accuracy_score: 91.22%
Thresh=0.000, n=207, f1_score: 5.71%
precision_score: 50.00%
recall_score: 3.03%
accuracy_score: 91.22%
.
.
.
Thresh=0.006, n=55, f1_score: 11.11%
precision_score: 66.67%
recall_score: 6.06%
accuracy_score: 91.49%
Thresh=0.006, n=54, f1_score: 5.88%
precision_score: 100.00%
recall_score: 3.03%
accuracy_score: 91.49%
Thresh=0.007, n=53, f1_score: 5.88%
precision_score: 100.00%
recall_score: 3.03%
accuracy_score: 91.49%
Thresh=0.007, n=52, f1_score: 5.88%
precision_score: 100.00%
recall_score: 3.03%
accuracy_score: 91.49%
.
.
.
Thresh=0.007, n=47, f1_score: 0.00%
precision_score: 0.00%
recall_score: 0.00%
accuracy_score: 91.22%
UndefinedMetricWarning: F-score is ill-defined and being set to 0.0 due to no predicted samples.
‘precision’, ‘predicted’, average, warn_for)
Precision is ill-defined and being set to 0.0 due to no predicted samples.
‘precision’, ‘predicted’, average, warn_for)
Intersting, I’m not sure.
You may need to dig into the specifics of the data to what is going on. If you’re using CV, then perhaps some folds don’t have examples of the target class – use stratified CV.
You’re right. I have 104 exemples of the minority class and 1463 of the other one. Would you suggest oversampling in that case?
Perhaps test it and see.
More ideas here:
https://machinelearningmastery.com/tactics-to-combat-imbalanced-classes-in-your-machine-learning-dataset/
Hi
I have a doubt as to how can we know the names of the features that are selected in: model using each importance as a threshold.
Each column in the array of loaded data will map to the column in your raw data.
If you know column names in the raw data, you can figure out the names of columns in your loaded data, model, or visualization.
Can you try plotting model interpretation using shap library for tree based algorithms??
Thanks for the suggestion.
Variable of Importance in Xgboost for multilinear features –
I am using 60 obseravation*90features data (all continuous variables) and the response variable is also continuous. These 90 features are highly correlated and some of them might be redundant. I am using gain feature importance in python(xgb.feature_importances_), that sumps up 1. I run xgboost 100 times and select features based on the rank of mean variable importance in 100 runs. Let’s say I choose 10 factors and then, again run xgboost with the same hyperparameters on these 10 features, surprisingly the most important feature becomes least important in these 10 variables.Any feasible explanation for this ?
Not off hand, does it matter though?
Choose a subset of features that gives the best results/most skillful model – any importance scores are a “suggestion” at best.
In a XGBoost model, the top features we derive shows which feature is more influential than the rest.
For example if the top feature is tenure days, how do i determine if “more tenure days” or “less tenure days” increase the rating in the output..
How do I determine if it is a positive influence or negative influence?
Not sure I follow. Importance is not positive or negative.
If you’re in doubt: build a model with and without it and compare the performance of the model.
I don’t understand the F -score in the feature importance plot, who can the value be 100+. Also, if this is not the traditional F-score, could you point to the definition/explanation of it? (can’t find it in the xgb documentation)
The scores are relative.
Is it possible to plot important features on model ensembled using Voting Classifier ?
If not then what could be the alternative to plot important features in an ensembled technique ?
Thank You
Not really.
Most ensembles of decision trees can give you feature importance.
Thank You !
But what about ensemble using Voting Classifier consisting of Random Forest, Decision Tree, XGBoost and Logistic Regression ?
Voting ensemble does not offer a way to get importance scores (as far as I know), regardless of what is being combined.
ok.
Thanks a lot !!
You’re welcome.
Hi and thanks for the codes first of all.
When I run the: “select_X_train = selection.transform(X_train)” I receive the following error: “ValueError: Input contains NaN, infinity or a value too large for dtype(‘float64’).”
My features do contain some NaNs, dummy variables and categorial variables. Do you know any way around this without having to change my data?
thanks in advance,
Daniel
You will need to impute the nan values first, or remove rows with nan values:
https://machinelearningmastery.com/handle-missing-data-python/
Hi,
I got an error at this line of the code: “select_X_train = selection.transform(X_train)”. The error is simply “KeyError: weight’
I did some research and found out that SelectFromModel expects an estimator having coef_ or feature_importances_ . Obviously XGBoostClassifier does have this attribute. Why is it not working for me but works for everybody else?
Please help!
Perhaps confirm that your version of xgboost is up to date?
I am having this same error. I am with xgboost 1.0.2 installed through pip.
it works in xgboost 0.90, but not 1.0.2
Thanks, I will investigate!
I have added a work around.
Awesome! you’re a true master. Thank you.
Thanks for your kind words.
Please, remove my last post… xgboost 0.90 worked
Done.
Hi,
I would like to use the “Feature Selection with XGBoost Feature Importance Scores” approach with model selection in my reserach. How can I cite it in paper/thesis?
Thank you
This will help:
https://machinelearningmastery.com/faq/single-faq/how-do-i-reference-or-cite-a-book-or-blog-post
my xgb model is taking too long for one fit and i want to try many thresholds so can i use another simple model to know the best threshold and is yes what do you recommend ?
You can try, but the threshold should be calculated for the specific model.
Hello, Sir.
I tried to run print(model.feature_importances_)
but it give an array with all ‘nan’ like [nan nan nan … nan nan nan]
and also, when i tried to plot the model with plot_importance(model), it return Booster.get_score() results in empty
do you have any advice? thank you very much
That is odd. Perhaps check that you fit the model?
yes it return like this
XGBClassifier(base_score=0.5, booster=None, colsample_bylevel=1,
colsample_bynode=1, colsample_bytree=1, gamma=0, gpu_id=-1,
importance_type=’gain’, interaction_constraints=None,
learning_rate=0.300000012, max_delta_step=0, max_depth=6,
min_child_weight=1, missing=nan, monotone_constraints=None,
n_estimators=100, n_jobs=0, num_parallel_tree=1,
objective=’binary:logistic’, random_state=0, reg_alpha=0,
reg_lambda=1, scale_pos_weight=1, subsample=1, tree_method=None,
validate_parameters=False, verbosity=None)
Fascinating.
I’m not sure off the cuff, you might have to try varying the training data and review the effects.
Hello Mr. Brownlee,
I’m testing your idea with feature importance of XGB and thresholds in a problem that I survey these days. I’m dealing with some weird results and I wonder if you could help.
Firstly, run a part of code similar to yours to see different metrics results on each threshold (beginning with all features to end up with 1). After that I check these metrics and note the best outcomes and the number of features resulting in these (best) metrics. Finally, I’m taking these features and use XGB algorithm with only these features but this time the results are different with results I got in the previous step. Any good explanation of this side effect?
Thanks for your time
Perhaps the difference in results is due to the stochastic nature of the learning algorithm or test harness.
Perhaps design a robust test harness and perform feature selection within the modeling pipeline.
dear Jason
thank you for your program
I have 2 questions
1)if my target data are not categorical or binary for example so as Boston housing price has many price target so I encoding the price first before feature selection?
2) does the feature selection and correlation must have the same results?
thank first for your time
No, that is a regression problem:
https://machinelearningmastery.com/faq/single-faq/what-is-the-difference-between-classification-and-regression
No, each technique will give you a different idea of what features may be important. You can fit a model from each suggestion and discover what actually results in a skillful model.
thank you for your answer
You’re welcome.
hi.
how get Effect (percentage) of the input variables on the output variable
One approach would be to covert each score to a ratio of the sum of the scores.
Hi Jason,
Thank you for a very thorough tutorial on this – I learn a lot.
I have one question, in the Feature Selection with XGBoost Feature Importance Scores section, you used
thresholds = sort(model.feature_importances_)
and do the for loop along these threshold values to evaluate the possible models.
Is there anyway how to do similar by using the values from plot_importance() results as the thresholds?
I looked at the data type from plot_importance() return, it is a matplotlib object instead of an array like the ones from model.feature_importances_
Can you please guide me on how to implement this?
Thank you
Good question James, yes there must be, but I’m not sure off hand. Perhaps check the xgboost library API for the appropriate function?
Alright
One more thing, in the results of different thresholds and respective different n number of features, how to pull in which features are in each scenario of threshold or in this n number of features? Means, which features are they? Can you show perhaps?
Sorry, I don’t follow your questions. Can you please restate or elaborate?
Jason,
Your way of explaining is very simple and straiprint(classification_report(y_test, predicted_xgb))ght forward. Please keep doing this!!!
As for this subject, I’ve done both manual feature importance and xgboost buit-in one but got different rankings. I’m not sure why ??
Thanks.
I believe they use a different evaluation function for the plot vs automatic.
Amazing job Jason, Very helpful…!
If I may ask about the difference between the two ways of calculating feature importance, as I’m having contradictory results and non-matching numbers.
Exp: first way is giving output in [0,1], and the second way is giving results >1, can you explain the difference please 🙂
In addition to that, if we take feature importance as ranking and setting apart the different scale issue between the two approaches, I encountered contradictory results where the number 1 important feature in the first method isn’t the number 1 in the second method.
Thanks.
I believe the built-in method uses a different scoring system, you can change it to be consistent with an argument to the function.
Hi,
Looks like the feature importance results from the model.feature_importances_ and the built in xgboost.plot_importance are different if your sort the importance weight for model.feature_importances_. I think you’d rather use model.get_fsscore() to determine the importance as xgboost use fs score to determine and generate feature importance plots.
-Jacob
Thanks for sharing.
What is the difference between feature importance and feature selection methods?
Good question, I answer it here:
https://machinelearningmastery.com/faq/single-faq/what-is-the-difference-between-feature-selection-and-feature-importance
Great explanation, thanks. So, when we run feature selection should we expect the most important variables to be selected?
Thanks!
XGBoost performs feature selection automatically as part of fitting the model.
Jason, thank you so much for the clarification about the XG-Boost. In the XGBoost, I used xgb.plot_importance which plots all the features by their F score. How I can plot the selected features which are used as part of fitting the model.?
The importance score itself is a reflection of the degree to which the features were used to fit the model.
Hi,
Thank you for your wisdom.
I’m using python and the recursive feature elimination (RFE). I’m trying different types of models such as the XGBClassifier, Decision Trees, or KNN.
However, the RFE gives me the following error when the model is XGBClassifier or KNN. The KNN does not provide logic to do feature selection, but the XGBClassifier does.
I’m doing something wrong or is there an explanation for this error with XGBClassifier?
Error: The classifier does not expose “coef_” or “feature_importances_” attributes
You’re welcome.
Interesting. Perhaps check of your xgboost library is up to date?
Otherwise, perhaps xgboost cannot be used in this way – which is a shame.
Hello,
I am getting an empty select_X_train when using the smallest threshold (So normally I will get the same for all other thresholds). Can someone please help me find out why?
Regards!
Yes, if the threshold is too low, you will not select any features. Increase it.
Why are you using ‘SelectFromModel’ here ?
can’t we just do something like this ?
regression_model2 = xgb.XGBRegressor(**tuned_params)
regression_model2.fit(X_imp_train,y_train,eval_set = [(X_imp_train,y_train),(X_imp_test,y_test)],verbose=False)
gain_importance_dict2temp = regression_model2.get_booster().get_score(importance_type=’gain’)
gain_importance_dict2temp = sorted(gain_importance_dict2temp.items(), key=lambda x: x[1], reverse=True)
#feature selection
feature_importance_len = len(gain_importance_dict2temp)
temmae = 10000.0
tempfeature_list = []
for i in range(1,feature_importance_len):
list_of_feature = [x for x,y in gain_importance_dict2temp[:feature_importance_len-i]]
print(list_of_feature)
X_imp_train3 = X_imp_train[list_of_feature]
X_imp_test3 = X_imp_test[list_of_feature]
regression_model = xgb.XGBRegressor(**tuned_params)
regression_model.fit(X_imp_train3,y_train,eval_set = [(X_imp_train3,y_train),(X_imp_test3,y_test)],verbose=False)
ypred= regression_model.predict(X_imp_test3)
We are using select from model because the xgboost model has feature importance scores.
You have implemented essentially what the select from model does automatically.
Thanks, you are so great, I didn’t expect an answer from you for small things like this. Thanks.
You’re welcome.
Followed exact same code but got “ValueError: X has a different shape than during fitting.” in line “select_x_train = selection.transform(x_train)” after projecting the first few lines of results of the features selection.
Please help, many thanks
Sorry to hear that, perhaps these tips will help:
https://machinelearningmastery.com/faq/single-faq/why-does-the-code-in-the-tutorial-not-work-for-me
thanks for the reply. I add the np.sort of the threshold and problem solved
threshold = np.sort(xgb.feature_importances_)
Happy to hear that Eric!
Hi jason, I have used a standard version of Algorithm A which has features x, y, and z
then I had used feature engineering to add for algorithm A new features (10 new features)
I would like to use the feature importance method to select the most important features between only the 10 features without removing any of the (x, y, z features)
can I identify first the list of features on which I would like to apply the feature importance method??
Sure. You can use any features you like, e.g. a combination of those selected by an algorithm and those you select.
thank you for your replay
You’re welcome.
Thank you for the article.
I decided to read in the pima Indian data using DF and put inthe feature names so that I can see those when plottng the feature importance.
I have used the following code to add the feature names to the scores of model.feature_importances_ and sort them to put in a plot:
=======================
from pandas import DataFrame
cols=X.columns
new_df = DataFrame (cols)
importance = model.feature_importances_*100
importance = importance.round(2)
new_df2 = DataFrame (importance)
fi=pd.concat([new_df,new_df2],axis=1)
fi.columns=[‘Feature’,’score’]
fi.set_index(‘Feature’,inplace=True)
fi.sort_values(by=’score’, ascending=False, inplace=True)
=========================
When comparing this plot to the one produced by plot_importance(model), you will notice the two do not rank the features in the same order. Any idea why?
I have tried the same thing with the famous wine data and again the two plots gave different orders to the feature importance.
One interesting thing to note is that when using catboost (as compared to xgboost) and then using SHAP to understand the impact of the features on the model, the graph is very similar to the (model.feature_importances_ ) method.
I believe that the plot_importance() uses a different metric for importance scores than feature_importances_.
I believe you can configure the plot function to use the same score to make the scores equivilient. I recommend checking the API.
Hi Jason,
Thanks for the tutorial. Which is the default type for the feature_importances_ , i.e. weight, gain, etc? It is not clear in the documentation.
Thank you in advance.
I don’t recall, sorry. If the docs are not clear, I recommend dipping into the code.
Hi Jason,
Thank you for the tutorial, it’s really useful! However, I have been encountering this error (ValueError: Shape of passed values is (59372, 40), indices imply (59372, 41)) with the transform part, by any chance do you know how can I solve it? I also posted my question on Stack Overflow, but no luck 🙁
https://stackoverflow.com/questions/69362344/valueerror-shape-of-passed-values-is-59372-40-indices-imply-59372-41
Seems an off-by-one error. Check how you preprocess your data.
Hey Mr. Jason .. thank you so much for your amazing article.
I’m using Feature Selection with XGBoost Feature Importance Scores with KNN based module and until now it has shown me great results.
I have one question, when I run the loop responsible of Feature Selection, I want to see the fueaturs that are involved in each iteration. Is there a simple way to do so ?
No simple way. I bet the best would be to drill into the XGBoost code to add a line or two to print that out.
UserWarning: X has feature names, but SelectFromModel was fitted without feature names
warnings.warn(
Hi, I am getting above mentioned error while I am trying to find the feature importance scores. DF has features with names in it. Below is the code I have used. Could you please mention a solution. Thank you.
Code:
model = XGBClassifier()
model.fit(X_train, y_train)
# make predictions for test data and evaluate
predictions = model.predict(X_test)
accuracy = accuracy_score(y_test, predictions)
print(“Accuracy: %.2f%%” % (accuracy * 100.0))
# Fit model using each importance as a threshold
thresholds = sort(model.feature_importances_)
for thresh in thresholds:
# select features using threshold
selection = SelectFromModel(model, threshold=thresh, prefit=True)
select_X_train = selection.transform(X_train)
# train model
selection_model = XGBClassifier()
selection_model.fit(select_X_train, y_train)
# eval model
select_X_test = selection.transform(X_test)
predictions = selection_model.predict(select_X_test)
accuracy = accuracy_score(y_test, predictions)
print(“Thresh=%.3f, n=%d, Accuracy: %.2f%%” % (thresh, select_X_train.shape[1], accuracy*100.0))
Hi Swappy…It looks like you are just using a code sample and not a full program listing.
I am currently applying the XGBoost Classifier on the Kaggle mushroom classification data, replicating your codes in this article. When using XGBClassifier, the number of important features could be reduced from original 22 variables down to 6-8 with still a high accuracy scores.
I then tried to use the XGBRFClassifier on the same data and this further cut down another variable from the best feature set. However, it seems to have met a ‘bump’ somewhere where the accuracy went down from 100 to lower varlues for the next 2 reductions and then it went back up to 100 from which it resumed the downward trend.
It seems unusual but Is this normal or something is wrong with the module?
Thanks for any feedback.
Romy
Hi Romy…The following may be of interest to you:
https://indiantechwarrior.com/why-does-the-loss-accuracy-fluctuate-during-the-training/
Thanks, I will check on it. Meanwhile, I have decided to stick with XGBClassifier because I am getting some weird results when I apply XGBRFClassirier.
Hi Jason,
Thanks for your great content.
Imagine I have 20 predictors (X) and one target (y).
After building the model, I want to see what happens if I only change one of these predictors and keep the rest constant. In other words, I want to see only the effect of that specific predictor on the target.
Is there a specific way to do that?
I was thinking about making a mock dataset with all other predictors kept the same and just changing the one that I am interested in. Then predict y and plot changes in that specific predictor and changes in y. Does that make sense? Because when I do it, then the predicted values of the mock data are the same…
Hi Joe…You are very welcome! In general, your suggestion is a valid one for small feature sets. The following may be of interest:
https://towardsdatascience.com/the-art-of-finding-the-best-features-for-machine-learning-a9074e2ca60d
Try to add a random column, train it, and you’ll see as the random column not only has importance>0, but also has a sizeable amount of importance.
Thank you for your feedback and suggestions Ivan!
hi sir,
while running this code i am getting error “AttributeError: ‘super’ object has no attribute ‘__sklearn_tags__'”
how to remove this error
Hi rajkumar…The error
AttributeError: 'super' object has no attribute '__sklearn_tags__'typically occurs due to an incompatibility between the version of thescikit-learnlibrary and theXGBoostlibrary. This issue arises because recent versions ofscikit-learnuse the__sklearn_tags__attribute, which might not be implemented in older versions ofXGBoost.Here’s how you can resolve this error:
—
### **Steps to Fix the Error**
1. **Update XGBoost to the Latest Version**
– Ensure that you are using the latest version of
XGBoost, as recent releases have resolved compatibility issues withscikit-learn.– Run the following command to update:
bash

     pip install --upgrade xgboost
2. **Update scikit-learn**
– Similarly, update your
scikit-learnlibrary to the latest version:bash
pip install --upgrade scikit-learn
3. **Check Compatibility Between Libraries**
– Use versions of
XGBoostandscikit-learnthat are known to work well together. For example:–
XGBoost >= 1.6.0–
scikit-learn >= 0.244. **Verify Your Code**
– Ensure your code is correctly importing and using the
XGBoostlibrary. A simple implementation should look like this:pythonfrom xgboost import XGBClassifier
from sklearn.feature_selection import SelectFromModel
from sklearn.datasets import make_classification
# Create a dataset
X, y = make_classification(n_samples=1000, n_features=10, random_state=42)
# Fit the model
model = XGBClassifier()
model.fit(X, y)
# Feature selection
selection = SelectFromModel(model, threshold=0.5, prefit=True)
X_selected = selection.transform(X)
print("Selected features shape:", X_selected.shape)
5. **Reinstall Libraries (if the issue persists)**
– If updating does not resolve the issue, try reinstalling both
scikit-learnandXGBoost:bash
pip uninstall scikit-learn xgboost
pip install scikit-learn xgboost
—
### **Additional Notes**
– If you are using an older Python version (<3.8), consider updating to Python 3.8 or later, as some library versions have dropped support for older Python versions.
- For compatibility-specific projects, consider using a virtual environment to isolate dependencies:
bash

  python -m venv myenv

  source myenv/bin/activate  # For Linux/Mac

  myenv\Scripts\activate     # For Windows

  pip install xgboost scikit-learn
By following these steps, you should be able to resolve the
__sklearn_tags__error and run your code successfully.