A valuable exercise when learning and practicing machine learning is to study how others apply methods and solve problems. It’s valuable because you can learn about new processes, software, graphs, and algorithms.
But it is new ways of thinking about the process of solving problems with machine learning that is the most valuable part of the exercise.
Curt uses R for his analysis and provides a logical approach to investigating the problem from which you can take away many lessons.
Kick-start your project with my new book Machine Learning Mastery With R, including step-by-step tutorials and the R source code files for all examples.
Let’s get started.
Study the Problem
Curt starts out by describing the problem. He links to resources such as the RMS Titanic Wikipedia entry and notes a few facts about the Titanic and the sinking event.
Rather than diving into the dataset, this demonstrates that Curt is thinking about the broader problem. It is not the prediction of an empty variable, it is an event that occurred in the real world from which we can make some assumptions.
Curt does this and lists of hypothesis that can be tested against the data such as the passenger class and the distance of cabins to lifeboats and the women and children first protocol.
Study the Data
Curt comments that he sees the bulk of the effort (and the return) in the data preparation phase of a problem. He sees it as an opportunity to get his hands dirty and gain a granular feeling for the data. He says that his greatest insights into the problem come from this stage.
Missing Data
Curt studies the missing data, creating a plot (missmap function from Amelia package) that summarizes the attributes that have missing data. He comments on the amount of missing data for different attributes and speculates at methods and the utility for imputing it.
Attribute Distributions
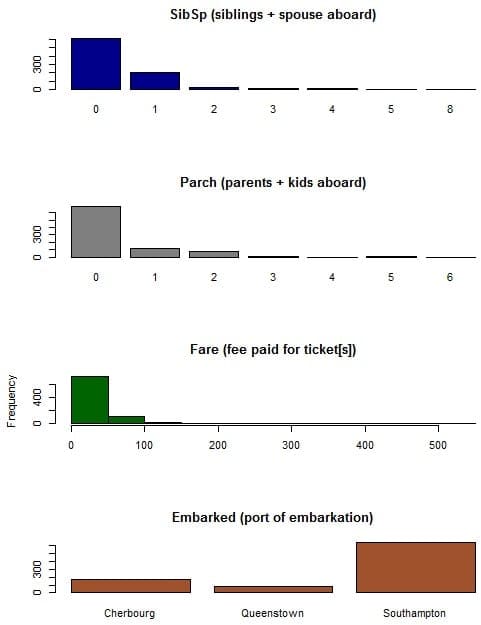
Curt studies the distributions of attributes in isolation, looking at histograms of the nominal attributes. He extracts general trends and interprets the data, commenting on their meaning in the context of the domain, such as age and class.
Attribute Distributions Graphs created by Curt Wehrley
Attribute Relationship with Survival
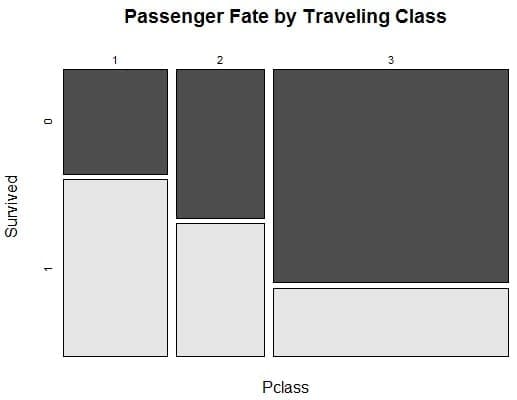
Next, Curt studies the distribution of attributes in the context of the predicted variable: survival. He uses mosaic plots (mosaicplot from vcd package) to assess categorical attributes against the predicted variable as well as correlogram (corrgram function from corrgram package) to support his interpretations.
Stepping through each key attribute, Curt picks out key relationships and interpretations such that class influenced survival probability and the relationship between gender and survival.
There is a useful pattern to note, that of visualization, interpretation and confirmation. The confirmation was by another subjective method, but the hypotheses could just as easily been modeled or modeled at a later time in the process.
Passenger Fate by Traveling Class Graph created by Curt Wehrley
Feature Engineering
Curt starts with age and considers different methods for imputing the approximate 20% of missing values. He looks at taking the average age, first overall, then by class, then using gender and even title.
This is an important example of the use of simple statistical methods for improving the quality of the data. Given that it is a competition, I would like to have seen the effect of different age models evaluated in the context of their contribution to final score.
Curt makes great use of the title prefix from the name field, extracting it and consolidating it using meaningful interpretations (mister and mr, nobles, etc.). It’s a good feature and there is a lot of room to explore the contributions it can make to models.
Finally, Curt derives a number of other features from the data such as the preference for female children, the deck and side of the ship for those records with a cabin attribute.
Need more Help with R for Machine Learning?
Take my free 14-day email course and discover how to use R on your project (with sample code).
Click to sign-up and also get a free PDF Ebook version of the course.
Study the Models
Curt does not throw a bunch of state-of-the-art models at the problem, at least, not at first.
Fit a Well Understood Model
Curt starts off with a well-understood method: logistic regression.
He uses it with a simple 80/20 split of the data for training and test and looks at how different attributes contribute to predicting passenger survival. He uses the chi-squared statistic to evaluate the models and takes a look at the reduction of variance for different attributes by running ANOVA.
This is a clever first step because it allows Curt to verify assumptions about the problem and look for easy wins, like dropping irrelevant features.
He then switches over to the caret package and runs logistic regression with 10-fold cross validation with 3 repeats. He is careful to use the same random seed for every run so that the results are directly comparable. With this more robust test harness, he tries different combinations of features, dropping features and even some further feature engineering.
Fit Other Models
After building some confidence in the selection of features, Curt picks out three other powerful models: Adaboost, Random Forest and SVM.
Rather than running the models with wild abandon, Curt uses features of the caret package to tune the parameters of each model. He selects the better performing set of parameters for each algorithm for use in model evaluation.
Evaluate Models
Curt evaluates each model on the problem and prepares a confusion matrix to summarize the results. He provides some minor interpretation of these results, leaving a lot of room for a deeper analysis.
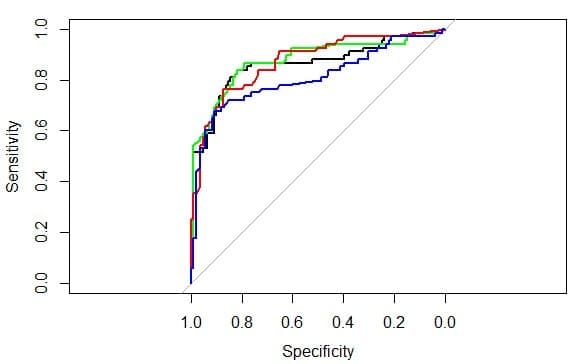
ROC Curves of Model Performance Graphs by Curt Wehrley
The results are graphically compared by the ROC curve of their results on a sensitivity-specificity graph. This is a common way to compare models based on the trade-offs in their predictive accuracy.
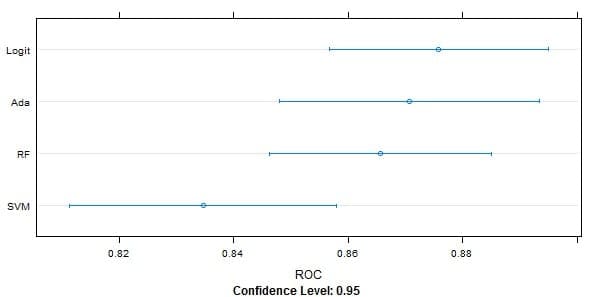
Curt also uses dot plots and box and whisker plots to compare the ROC scores for each of the models. He comments that all four models were better at predicting fatalities than survivals and that he would choose Logistic Regression if he had to pick one model to apply.
Dot Plots of Model Performance Graph by Curt Wehrley
Lessons Learned
Curt is careful to point out that this was but an example of approach this problem and far from the optimal approach to addressing it. I think it stands as a great example of how to approach a problem and apply machine learning algorithms.
Some lessons that you can take away from this case study are:
Study your problem: review the problem in the broader context and list out all of the assumptions you think might be relevant and that you can challenge with actual data.
Review your data: Study the data that is available. Look for missing values and think about how they could be imputed. Look carefully at the distributions of each attribute and of each attribute in the context of the predicted variable and be sure to write down interpretations and trends that you notice, these too can be tested and exploited during model building.
Derive Features: Go beyond the data that was provided and engineer new attributes that expose a structure in the data that you think will aid models in making predictions.
Study a model: Pick one model that you known and understand well and use it to learn more about the problem, test assumptions and pick out attributes that may or may not contribute to predictions.
Robust model evaluation: Use robust methods like cross validation with repeats to estimate model performance on unseen data and compare models using measure that are sensitive to the outcomes (true positive/false negatives)
This example is like telling how to fly a rocket using these steps –
1. Build a container – say there are options like metal and plastic.
2. Fill the containers with fuel. Do not tell people that it is not gasolene.
3. Ignite the bottom tip. Do not tell people whether to use a matchstick or a sparkler.
4. Say ‘Good Bye’ to the rocket and look skywards.
… rarely explains anything in clarity. In the end I have more questions than answers

")
")
")
")


This example is like telling how to fly a rocket using these steps –
1. Build a container – say there are options like metal and plastic.
2. Fill the containers with fuel. Do not tell people that it is not gasolene.
3. Ignite the bottom tip. Do not tell people whether to use a matchstick or a sparkler.
4. Say ‘Good Bye’ to the rocket and look skywards.
… rarely explains anything in clarity. In the end I have more questions than answers
Thanks for the feedback Learner.
Hi Jason,
Could you please give a link to a similar tutorial where the code for all the steps is provided and there is a deeper explanation of the concepts?
Thank you 🙂
I have many on the blog, try searching.