The k-fold cross-validation procedure is a standard method for estimating the performance of a machine learning algorithm on a dataset.
A common value for k is 10, although how do we know that this configuration is appropriate for our dataset and our algorithms?
One approach is to explore the effect of different k values on the estimate of model performance and compare this to an ideal test condition. This can help to choose an appropriate value for k.
Once a k-value is chosen, it can be used to evaluate a suite of different algorithms on the dataset and the distribution of results can be compared to an evaluation of the same algorithms using an ideal test condition to see if they are highly correlated or not. If correlated, it confirms the chosen configuration is a robust approximation for the ideal test condition.
In this tutorial, you will discover how to configure and evaluate configurations of k-fold cross-validation.
After completing this tutorial, you will know:
How to evaluate a machine learning algorithm using k-fold cross-validation on a dataset.
How to perform a sensitivity analysis of k-values for k-fold cross-validation.
How to calculate the correlation between a cross-validation test harness and an ideal test condition.
Kick-start your project with my new book Machine Learning Mastery With Python, including step-by-step tutorials and the Python source code files for all examples.
Let’s get started.
How to Configure k-Fold Cross-Validation Photo by Patricia Farrell, some rights reserved.
Tutorial Overview
This tutorial is divided into three parts; they are:
k-Fold Cross-Validation
Sensitivity Analysis for k
Correlation of Test Harness With Target
k-Fold Cross-Validation
It is common to evaluate machine learning models on a dataset using k-fold cross-validation.
The k-fold cross-validation procedure divides a limited dataset into k non-overlapping folds. Each of the k folds is given an opportunity to be used as a held-back test set, whilst all other folds collectively are used as a training dataset. A total of k models are fit and evaluated on the k hold-out test sets and the mean performance is reported.
For more on the k-fold cross-validation procedure, see the tutorial:
The k-fold cross-validation procedure can be implemented easily using the scikit-learn machine learning library.
First, let’s define a synthetic classification dataset that we can use as the basis of this tutorial.
The make_classification() function can be used to create a synthetic binary classification dataset. We will configure it to generate 100 samples each with 20 input features, 15 of which contribute to the target variable.
The example below creates and summarizes the dataset.
Running the example creates the dataset and confirms that it contains 100 samples and 10 input variables.
The fixed seed for the pseudorandom number generator ensures that we get the same samples each time the dataset is generated.
1
(100, 20) (100,)
Next, we can evaluate a model on this dataset using k-fold cross-validation.
We will evaluate a LogisticRegression model and use the KFold class to perform the cross-validation, configured to shuffle the dataset and set k=10, a popular default.
The cross_val_score() function will be used to perform the evaluation, taking the dataset and cross-validation configuration and returning a list of scores calculated for each fold.
The complete example is listed below.
1
2
3
4
5
6
7
8
9
10
11
12
13
14
15
16
17
# evaluate a logistic regression model using k-fold cross-validation
from numpy import mean
from numpy import std
from sklearn.datasets import make_classification
from sklearn.model_selection import KFold
from sklearn.model_selection import cross_val_score
from sklearn.linear_model import LogisticRegression
Running the example creates the dataset, then evaluates a logistic regression model on it using 10-fold cross-validation. The mean classification accuracy on the dataset is then reported.
Note: Your results may vary given the stochastic nature of the algorithm or evaluation procedure, or differences in numerical precision. Consider running the example a few times and compare the average outcome.
In this case, we can see that the model achieved an estimated classification accuracy of about 85.0 percent.
1
Accuracy: 0.850 (0.128)
Now that we are familiar with k-fold cross-validation, let’s look at how we might configure the procedure.
Sensitivity Analysis for k
The key configuration parameter for k-fold cross-validation is k that defines the number folds in which to split a given dataset.
Common values are k=3, k=5, and k=10, and by far the most popular value used in applied machine learning to evaluate models is k=10. The reason for this is studies were performed and k=10 was found to provide good trade-off of low computational cost and low bias in an estimate of model performance.
How do we know what value of k to use when evaluating models on our own dataset?
You can choose k=10, but how do you know this makes sense for your dataset?
One approach to answering this question is to perform a sensitivity analysis for different k values. That is, evaluate the performance of the same model on the same dataset with different values of k and see how they compare.
The expectation is that low values of k will result in a noisy estimate of model performance and large values of k will result in a less noisy estimate of model performance.
But noisy compared to what?
We don’t know the true performance of the model when making predictions on new/unseen data, as we don’t have access to new/unseen data. If we did, we would make use of it in the evaluation of the model.
Nevertheless, we can choose a test condition that represents an “ideal” or as-best-as-we-can-achieve “ideal” estimate of model performance.
One approach would be to train the model on all available data and estimate the performance on a separate large and representative hold-out dataset. The performance on this hold-out dataset would represent the “true” performance of the model and any cross-validation performances on the training dataset would represent an estimate of this score.
This is rarely possible as we often do not have enough data to hold some back and use it as a test set. Kaggle machine learning competitions are one exception to this, where we do have a hold-out test set, a sample of which is evaluated via submissions.
Instead, we can simulate this case using the leave-one-out cross-validation (LOOCV), a computationally expensive version of cross-validation where k=N, and N is the total number of examples in the training dataset. That is, each sample in the training set is given an example to be used alone as the test evaluation dataset. It is rarely used for large datasets as it is computationally expensive, although it can provide a good estimate of model performance given the available data.
We can then compare the mean classification accuracy for different k values to the mean classification accuracy from LOOCV on the same dataset. The difference between the scores provides a rough proxy for how well a k value approximates the ideal model evaluation test condition.
Let’s explore how to implement a sensitivity analysis of k-fold cross-validation.
First, let’s define a function to create the dataset. This allows you to change the dataset to your own if you desire.
Next, we can define a dataset to create the model to evaluate.
Again, this separation allows you to change the model to your own if you desire.
1
2
3
4
# retrieve the model to be evaluate
def get_model():
model=LogisticRegression()
returnmodel
Next, you can define a function to evaluate the model on the dataset given a test condition. The test condition could be an instance of the KFold configured with a given k-value, or it could be an instance of LeaveOneOut that represents our ideal test condition.
The function returns the mean classification accuracy as well as the min and max accuracy from the folds. We can use the min and max to summarize the distribution of scores.
Running the example first reports the LOOCV, then the mean, min, and max accuracy for each k value that was evaluated.
Note: Your results may vary given the stochastic nature of the algorithm or evaluation procedure, or differences in numerical precision. Consider running the example a few times and compare the average outcome.
In this case, we can see that the LOOCV result was about 84 percent, slightly lower than the k=10 result of 85 percent.
1
2
3
4
5
6
7
8
9
10
11
12
13
14
15
16
17
18
19
20
21
22
23
24
25
26
27
28
29
30
Ideal: 0.840
> folds=2, accuracy=0.740 (0.700,0.780)
> folds=3, accuracy=0.749 (0.697,0.824)
> folds=4, accuracy=0.790 (0.640,0.920)
> folds=5, accuracy=0.810 (0.600,0.950)
> folds=6, accuracy=0.820 (0.688,0.941)
> folds=7, accuracy=0.799 (0.571,1.000)
> folds=8, accuracy=0.811 (0.385,0.923)
> folds=9, accuracy=0.829 (0.636,1.000)
> folds=10, accuracy=0.850 (0.600,1.000)
> folds=11, accuracy=0.829 (0.667,1.000)
> folds=12, accuracy=0.785 (0.250,1.000)
> folds=13, accuracy=0.839 (0.571,1.000)
> folds=14, accuracy=0.807 (0.429,1.000)
> folds=15, accuracy=0.821 (0.571,1.000)
> folds=16, accuracy=0.827 (0.500,1.000)
> folds=17, accuracy=0.816 (0.600,1.000)
> folds=18, accuracy=0.831 (0.600,1.000)
> folds=19, accuracy=0.826 (0.600,1.000)
> folds=20, accuracy=0.830 (0.600,1.000)
> folds=21, accuracy=0.814 (0.500,1.000)
> folds=22, accuracy=0.820 (0.500,1.000)
> folds=23, accuracy=0.802 (0.250,1.000)
> folds=24, accuracy=0.804 (0.250,1.000)
> folds=25, accuracy=0.810 (0.250,1.000)
> folds=26, accuracy=0.804 (0.250,1.000)
> folds=27, accuracy=0.818 (0.250,1.000)
> folds=28, accuracy=0.821 (0.250,1.000)
> folds=29, accuracy=0.822 (0.250,1.000)
> folds=30, accuracy=0.822 (0.333,1.000)
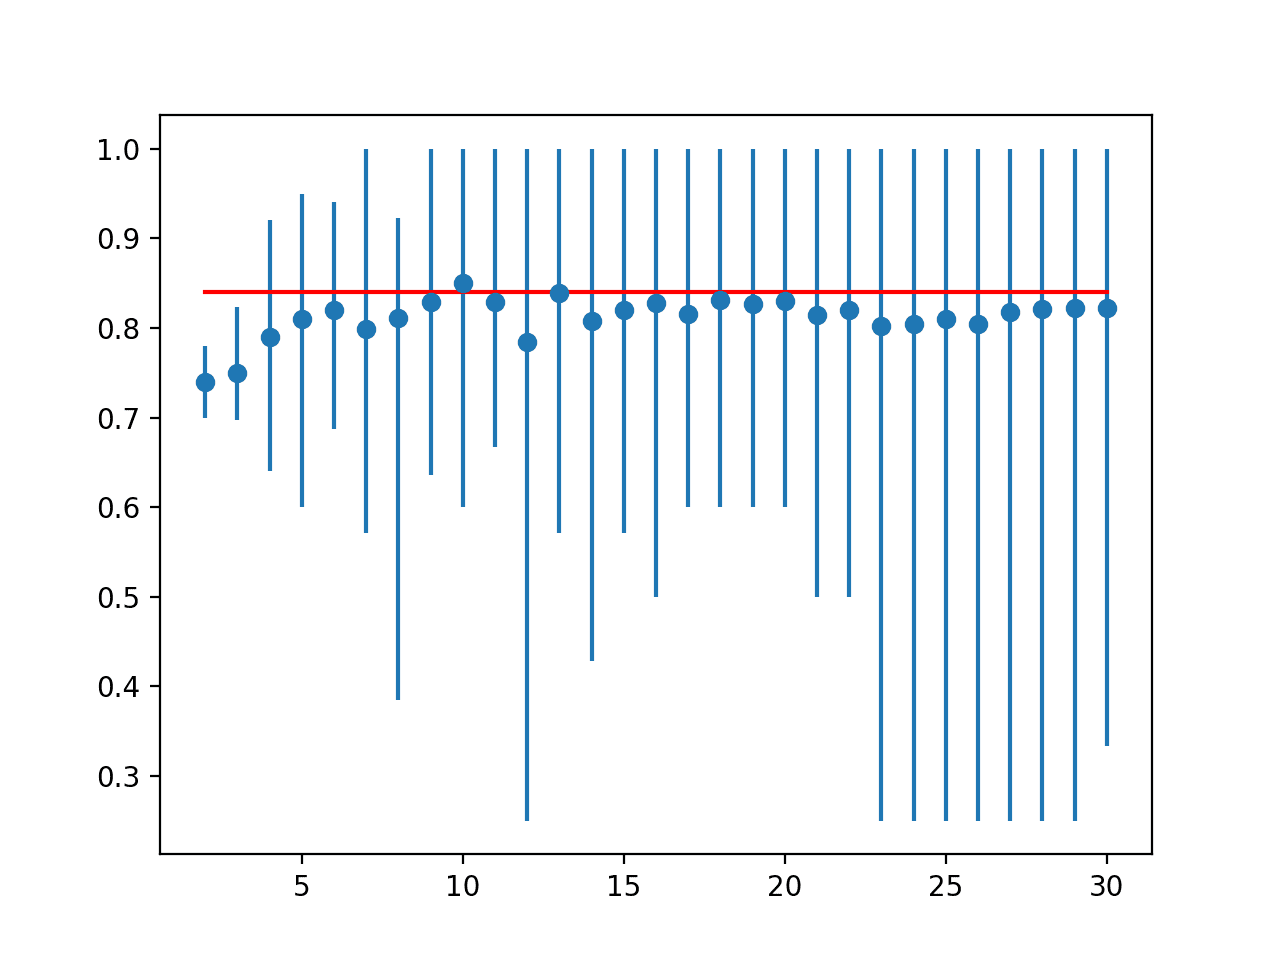
A line plot is created comparing the mean accuracy scores to the LOOCV result with the min and max of each result distribution indicated using error bars.
The results suggest that for this model on this dataset, most k values underestimate the performance of the model compared to the ideal case. The results suggest that perhaps k=10 alone is slightly optimistic and perhaps k=13 might be a more accurate estimate.
Line Plot of Mean Accuracy for Cross-Validation k-Values With Error Bars (Blue) vs. the Ideal Case (red)
This provides a template that you can use to perform a sensitivity analysis of k values of your chosen model on your dataset against a given ideal test condition.
Correlation of Test Harness With Target
Once a test harness is chosen, another consideration is how well it matches the ideal test condition across different algorithms.
It is possible that for some algorithms and some configurations, the k-fold cross-validation will be a better approximation of the ideal test condition compared to other algorithms and algorithm configurations.
We can evaluate and report on this relationship explicitly. This can be achieved by calculating how well the k-fold cross-validation results across a range of algorithms match the evaluation of the same algorithms on the ideal test condition.
The Pearson’s correlation coefficient can be calculated between the two groups of scores to measure how closely they match. That is, do they change together in the same ways: when one algorithm looks better than another via k-fold cross-validation, does this hold on the ideal test condition?
We expect to see a strong positive correlation between the scores, such as 0.5 or higher. A low correlation suggests the need to change the k-fold cross-validation test harness to better match the ideal test condition.
First, we can define a function that will create a list of standard machine learning models to evaluate via each test harness.
1
2
3
4
5
6
7
8
9
10
11
12
13
14
15
16
17
18
19
20
21
22
# get a list of models to evaluate
def get_models():
models=list()
models.append(LogisticRegression())
models.append(RidgeClassifier())
models.append(SGDClassifier())
models.append(PassiveAggressiveClassifier())
models.append(KNeighborsClassifier())
models.append(DecisionTreeClassifier())
models.append(ExtraTreeClassifier())
models.append(LinearSVC())
models.append(SVC())
models.append(GaussianNB())
models.append(AdaBoostClassifier())
models.append(BaggingClassifier())
models.append(RandomForestClassifier())
models.append(ExtraTreesClassifier())
models.append(GaussianProcessClassifier())
models.append(GradientBoostingClassifier())
models.append(LinearDiscriminantAnalysis())
models.append(QuadraticDiscriminantAnalysis())
returnmodels
We will use k=10 for the chosen test harness.
We can then enumerate each model and evaluate it using 10-fold cross-validation and our ideal test condition, in this case, LOOCV.
We can then calculate the correlation between the mean classification accuracy from the 10-fold cross-validation test harness and the LOOCV test harness.
1
2
3
4
...
# calculate the correlation between each test condition
corr,_=pearsonr(cv_results,ideal_results)
print('Correlation: %.3f'%corr)
Finally, we can create a scatter plot of the two sets of results and draw a line of best fit to visually see how well they change together.
1
2
3
4
5
6
7
8
9
...
# scatter plot of results
pyplot.scatter(cv_results,ideal_results)
# plot the line of best fit
coeff,bias=polyfit(cv_results,ideal_results,1)
line=coeff *asarray(cv_results)+bias
pyplot.plot(cv_results,line,color='r')
# show the plot
pyplot.show()
Tying all of this together, the complete example is listed below.
1
2
3
4
5
6
7
8
9
10
11
12
13
14
15
16
17
18
19
20
21
22
23
24
25
26
27
28
29
30
31
32
33
34
35
36
37
38
39
40
41
42
43
44
45
46
47
48
49
50
51
52
53
54
55
56
57
58
59
60
61
62
63
64
65
66
67
68
69
70
71
72
73
74
75
76
77
78
79
80
81
82
83
84
85
86
87
88
89
90
91
92
93
94
95
96
97
98
99
100
101
102
# correlation between test harness and ideal test condition
from numpy import mean
from numpy import isnan
from numpy import asarray
from numpy import polyfit
from scipy.stats import pearsonr
from matplotlib import pyplot
from sklearn.datasets import make_classification
from sklearn.model_selection import KFold
from sklearn.model_selection import LeaveOneOut
from sklearn.model_selection import cross_val_score
from sklearn.linear_model import LogisticRegression
from sklearn.linear_model import RidgeClassifier
from sklearn.linear_model import SGDClassifier
from sklearn.linear_model import PassiveAggressiveClassifier
from sklearn.neighbors import KNeighborsClassifier
from sklearn.tree import DecisionTreeClassifier
from sklearn.tree import ExtraTreeClassifier
from sklearn.svm import LinearSVC
from sklearn.svm import SVC
from sklearn.naive_bayes import GaussianNB
from sklearn.ensemble import AdaBoostClassifier
from sklearn.ensemble import BaggingClassifier
from sklearn.ensemble import RandomForestClassifier
from sklearn.ensemble import ExtraTreesClassifier
from sklearn.gaussian_process import GaussianProcessClassifier
from sklearn.ensemble import GradientBoostingClassifier
from sklearn.discriminant_analysis import LinearDiscriminantAnalysis
from sklearn.discriminant_analysis import QuadraticDiscriminantAnalysis
# calculate the correlation between each test condition
corr,_=pearsonr(cv_results,ideal_results)
print('Correlation: %.3f'%corr)
# scatter plot of results
pyplot.scatter(cv_results,ideal_results)
# plot the line of best fit
coeff,bias=polyfit(cv_results,ideal_results,1)
line=coeff *asarray(cv_results)+bias
pyplot.plot(cv_results,line,color='r')
# label the plot
pyplot.title('10-fold CV vs LOOCV Mean Accuracy')
pyplot.xlabel('Mean Accuracy (10-fold CV)')
pyplot.ylabel('Mean Accuracy (LOOCV)')
# show the plot
pyplot.show()
Running the example reports the mean classification accuracy for each algorithm calculated via each test harness.
Note: Your results may vary given the stochastic nature of the algorithm or evaluation procedure, or differences in numerical precision. Consider running the example a few times and compare the average outcome.
You may see some warnings that you can safely ignore, such as:
1
Variables are collinear
We can see that for some algorithms, the test harness over-estimates the accuracy compared to LOOCV, and in other cases, it under-estimates the accuracy. This is to be expected.
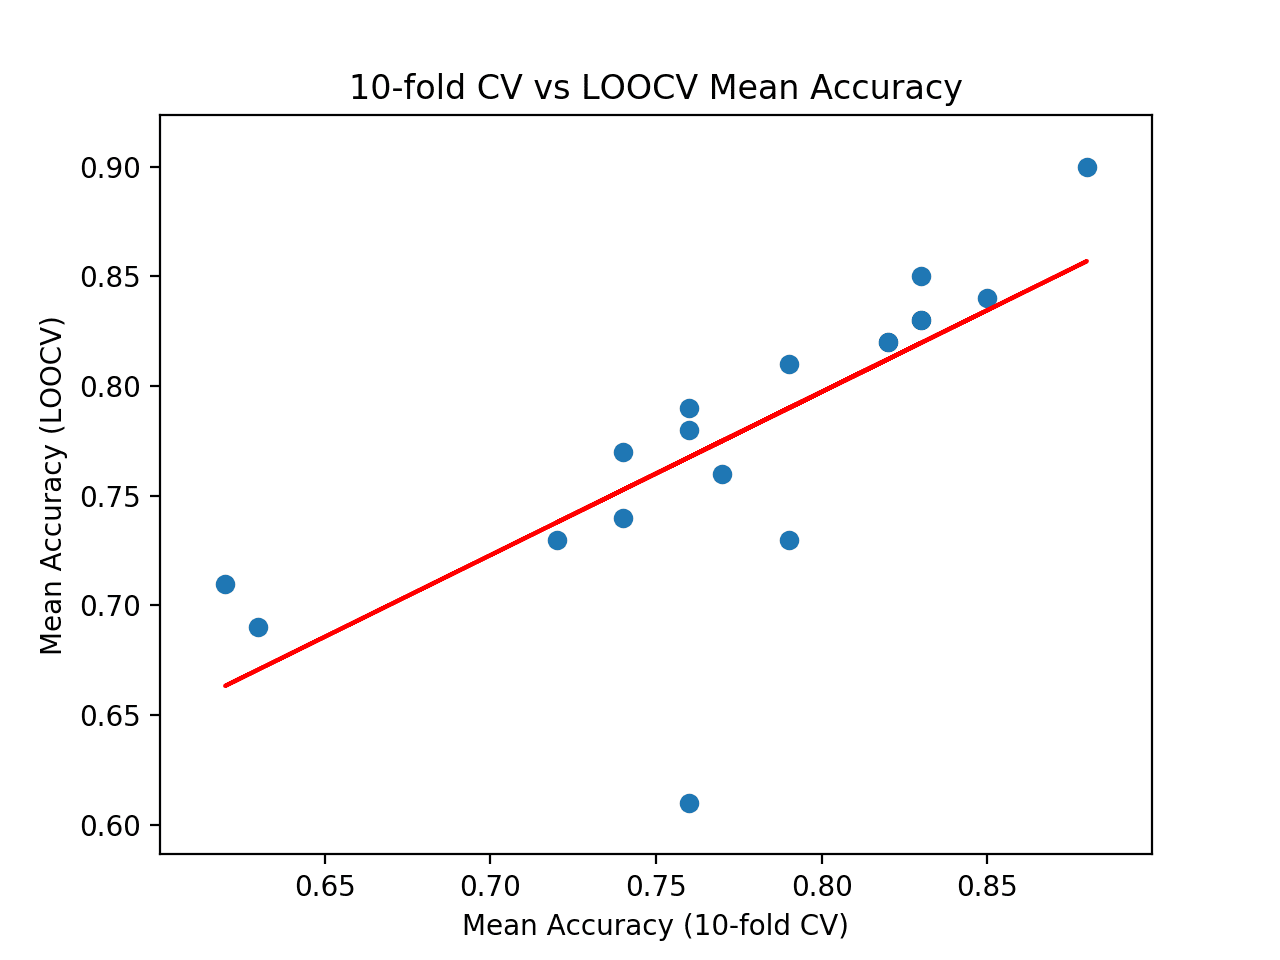
At the end of the run, we can see that the correlation between the two sets of results is reported. In this case, we can see that a correlation of 0.746 is reported, which is a good strong positive correlation. The results suggest that 10-fold cross-validation does provide a good approximation for the LOOCV test harness on this dataset as calculated with 18 popular machine learning algorithms.
Finally, a scatter plot is created comparing the distribution of mean accuracy scores for the test harness (x-axis) vs. the accuracy scores via LOOCV (y-axis).
A red line of best fit is drawn through the results showing the strong linear correlation.
Scatter Plot of Cross-Validation vs. Ideal Test Mean Accuracy With Line of Best Fit
This provides a harness for comparing your chosen test harness to an ideal test condition on your own dataset.
Further Reading
This section provides more resources on the topic if you are looking to go deeper.
However, when comparing the results of the kfold with differents n_splits values, I would highly suggest to use an other error than the one used here.
The line of code is the line 52 in the box starting with “# sensitivity analysis of k in k-fold cross-validation”.
Indeed, as you are currently using yerr=[mins, maxs], the size of the error bar tends to increase with the n_splits value, while I would argue it should actually tends to decrease. I think using something like yerr =[mean-std, mean+std] would be more appropriate. Let me know if you think I am mistaken.
Summary of results and model based on min/max of the stddev and mean of ideal scores and cv scores
1
2
3
4
5
6
7
8
9
10
11
Min mean ideal=0.58,model Extra TreeClassifier
Max mean ideal=0.9,model SVC
Min mean cv=0.65,model DecisionTreeClassifier,ExtraTreeClassifier
Max mean cv=0.88,model SVC
Min std dev ideal=0.3,model=SVC
Max std dev ideal=0.494,model=ExtraTreeClassifier
Min std dev cv=0.087,model=SVC
Max std dev cv=0.2,model=Bagging Classifier
Conclusions:
It appears that the the SVC is the model of choice for maximum mean ideal of 0.9 and cv 0.80. The respective ideal stddev is 0.3 and 0.087.
Based on the minimum variability of the cross validation score, KFold has the least variability of 0.087 compared to 0.3 for LOOCV.
Therefore, for the dataset, SVC using KFold cross validation score is the choice.
I would like to ask how can I perform k-fold cross validation using Imagedatagenerator and flow from directory in keras?. Any sample code would make understanding more clear. Kindly guide.
I was wondering, you use the same ‘cv’ object for each algorithm, right? Does this mean that, during the training of each algorithm (when you use cross_val_score()), the exact same breaks to train/test happen each time?
That is, will logistic regression get trained and tested on the exact same 10 folds as gaussian naive bayes will , for example?
Thank you for the great tutorial and intuition. I tried your code on a dataset with about 1500 features (less than 10k records), and it’s extremely slow… I mean it took days to process. So I wonder if I should’ve done sth different or … this not meant for such dataset. Thanks
Hi,when you print accuracy in each k. you are running k fold per k iteration. Meaning that there are a total of k*k folds not just k right? If this question makes sense.
Hi Jason, Please tell me when we are using k fold evaluation criteria then in that case we need to fit our model on full data i.e. X and Y without splitting into train and test, right? second thing I have seen in some articles that people use xtrain and y train in cross_val_score not x and y, what could be the logic for that?
If i will use 5 folds, Can i take maximum test accuracy from each fold and then take average of those 5 maximum accuracies for my final score in deep neural network
Hi,
Thank you for this excellent post and blog in general
I am still not conviced that we should use the LOOCV as an ground truth ( i.e., Ideal Test ) to define our best k. I was especially confused by “The results suggest that perhaps k=10 alone is slightly optimistic and perhaps k=13 might be a more accurate estimate.”
1) When i look at the graph from k=7 this is very difficult to draw conclusion. It appears to me that all mean scores are close to the red curve and show a lot of variability
2) Because we do not show the min/max of the score obtained with LOOCV, we do not know if our model (i.e., ML method + parametrisation) is stable ( even if it is probably not the case here).
Thanks a lot for the great article series over “machinelearningmastery.com”.
I am running a signal processing experiment using python sci-kit learn. I have an elaborate question which spans across multiple steps during K-Fold validation and the consequent predictions. I am describing them below.
I have 8640 samples of signal data which I am splitting into Training (70%) and Validation (30%). This gives me 6048 samples of Training and 2592 samples of validation. I am dividing the validation samples further – into 2500 samples for K-Fold validation and 92 samples as unseen/live signal. My ultimate goal is to predict all 92 unseen/live samples correctly.
predictions = estimator.predict(X_test[2400:2492,:]) #These are the test samples already used for K-Fold
print(predictions)
predictions-2 = estimator.predict(X_test[2500:2592,:]) #These are totally unseen samples
print(predictions-2)
My results are:
1. Accuracy (K-fold validation) = 70%
2. Standard deviation in accuracy = 29%
3. All samples from 2400 to 2492 are predicted correctly
4. Only 12 of the 2500 to 2592 are predicted correctly.
I would like to know, if I am going wrong in understanding somewhere. Why only so few unseen samples are predicted correctly, even though all the samples which are used for K-fold are predicted correctly?
´´´scores = cross_val_score(model, X, y, scoring=’accuracy’, cv=cv, n_jobs=-1)`
which, I think, obscures the functioning and the practical usage of k-Fold Cross Validation and limits the code in terms of customability.
So I made some modifications to the code in order to show a “step by step manual method” that performs the same task.
‘Hope it can be of any help.
Here is my proposition:
´´´
# Imports ———————————————————————-
import numpy as np # Math, Stat and Linear Algebra python library
from sklearn.datasets import make_classification # Random generator for classification data
from sklearn.model_selection import KFold # k-Fold module
from sklearn.model_selection import cross_val_score # k-Fold Cross Validation fully automated module
from sklearn.linear_model import LogisticRegression # Model: Logistic Regression module
# Parameters ——————————————————————-
k = 10 # Number of folds (the “k” values in k-fold cross-validation)
n_samples = 100 # Number of data samples
n_features = 20 # Number of input-data features
# Define dataset —————————————————————
X, y = make_classification(n_samples=n_samples, n_features=n_features, n_informative=15, n_redundant=5, random_state=1)
# X is of shape (100, 20) and y is of shape (100,)
# -> X contains float values
# -> y contain only 0 or 1 values
# -> Example: X_i -> y_i := [1.123, … , 0.123123] -> 0 or 1
# Initialiez Logistic Regression model and KFold ——————————-
model = LogisticRegression()
kfold = KFold(n_splits=k, random_state=1, shuffle=True)
# Leanring and k-Fold Cross Validation: Fully Automated ————————
# -> Eveything is done by the sklearn module “cross_val_score”
scores = cross_val_score(model, X, y, scoring=’accuracy’, cv=kfold, n_jobs=-1)
print(“Fully Automated method: “)
print(” Accuracy: μ = {0}, σ = {1}”.format( round(np.mean(scores), 3), round(np.std(scores),3) ))
# Leanring and k-Fold Cross Validation: Manual ———————————
# -> Step by step decomposition of the k-Fold Cross-Validation process
scores = []
for train_index, test_index in kfold.split(X):
# Define test and train data for the k-th fold
X_train, X_test = X[train_index], X[test_index]
y_train, y_test = y[train_index], y[test_index]
# Train the Logistic Regression model on train data
model.fit(X_train, y_train)
# Predict output (y) with the trained model on test data
y_pred = model.predict(X_test)
# Compute the accuracy of the model on test data
n_correct_values = sum([ p == t for p, t in zip(y_pred, y_test) ])
accuracy = n_correct_values / len(y_pred)
scores.append(accuracy)
scores = np.array(scores)
print(“Manual method: “)
print(” Accuracy: μ = {0}, σ = {1}”.format( round(np.mean(scores), 3), round(np.std(scores),3) ))
´´´
PS: I do not know how to post python code on this web-site. Really sorry for that.
import os
import time
import re
#import numpy as np
import pandas as pd
import matplotlib.pyplot as plt
from tqdm import tqdm
from sklearn.feature_extraction.text import CountVectorizer, TfidfVectorizer
from sklearn import preprocessing
from sklearn.model_selection import train_test_split, StratifiedKFold, KFold
from sklearn.naive_bayes import MultinomialNB
from sklearn.linear_model import SGDClassifier
from sklearn.linear_model import LogisticRegression
from sklearn.svm import LinearSVC
from sklearn.ensemble import RandomForestClassifier, GradientBoostingClassifier
from sklearn.metrics import classification_report
from sklearn.metrics import confusion_matrix
from sklearn.metrics import plot_confusion_matrix
from sklearn.metrics import precision_recall_fscore_support as score
df = pd.read_excel(‘/content/arabic (7).xlsx’)
df.head()
x = df[‘text’]
y = df[‘sen’]
from sklearn.feature_extraction.text import CountVectorizer
count_vect = CountVectorizer()
X_train_counts = count_vect.fit_transform(x)
X_train_counts.shape
from sklearn.feature_extraction.text import TfidfTransformer
tfidf_transformer = TfidfTransformer()
fold_no = 1
acc_score = []
for train_index,test_index in skf.split(x, y):
train = df.iloc[train_index,:]
test = df.iloc[test_index,:]
training(train, test, fold_no)
fold_no += 1
———-OUTPUT———-
For Fold 1 the accuracy is 0.9251433994965543
For Fold 2 the accuracy is 0.9251433994965543
For Fold 3 the accuracy is 0.9251433994965543
For Fold 4 the accuracy is 0.9251433994965543
For Fold 5 the accuracy is 0.9251433994965543
For Fold 6 the accuracy is 0.9251433994965543
For Fold 7 the accuracy is 0.9251433994965543
For Fold 8 the accuracy is 0.9251433994965543
For Fold 9 the accuracy is 0.9251433994965543
For Fold 10 the accuracy is 0.9251433994965543
Thanks, Dr. Jason for your great blogs. Would you please kindly help in the implementation of K-fold cross-validation for two inputs and single output? My implementation of the same is shown below:
num_folds = 5
kfold = StratifiedKFold(n_splits=num_folds, shuffle=True)
for IDs_Train, IDs_Test in kfold.split(X_CXR,y_CXR):
Also, I have used validation_split = 0.2 in model.fit
Issue: My validation accuracy remains 0 for the initial many iterations and grows very slowly leading to overftting though it does not overfit (achieves good test accuracy) in single fold implementation.
I have one more doubt. When I perform 5-fold cross-validation, do I need to re-initialize the weights of a model/network after each fold? I have observed that as it progresses from the first fold to the last fold, overfitting increases and it’s probably due to spillover of weights to the next fold.
Yes. Do each of the 5 fold separately without sharing any initialization, etc.
Just re-create your model on every fold with the same hyperparameter and do the fitting and validation.
Thanks for the quick response. I am trying your method exactly. Additionally, I am just deleting the model variable (del model) at the end of each fold in the for loop. Is this the correct way???
So whenever we use cross validation, we will give the whole dataset and it will do train and test and validation for us? right?
The next question, how to use the model to predict the new sample, when we use cross validation? is there any predict function ?
any response will be appreciated.
Best,
How could I apply your code for a CNN model instead a random forest. I have defined mi model architecture this way:
def get_model():
xinput=kl.Input((200,9,1))
#Add Gaussian Noise to reduce overfitting ()
xNoise=kl.GaussianNoise(.005)(xinput)
#Only convolutions in the time series direction (Similar to filtering)
x1=kl.Conv2D(NUMBER_FILTERS,(SIZE_FILTERS,1),kernel_regularizer=keras.regularizers.L1(l1=REG))(xNoise)
#Combining information
x1=kl.Conv2D(NUMBER_FILTERS,(SIZE_FILTERS,1),kernel_regularizer=keras.regularizers.L1(l1=REG),activation=’gelu’)(x1)
xFeatures=kl.Conv2D(DIMENSION_SUBSPACE1,(1,1),kernel_regularizer=keras.regularizers.L1(l1=REG),activation=’gelu’)(x1)
#Global Pooling (The network is invariant to translation)
xP=tf.reduce_max(xFeatures,axis=1)
#Classifier in a low dimensional space
x2=kl.Flatten()(xP)
x2=kl.Dense(DIMENSION_SUBSPACE2,activation=’gelu’)(x2)
xout=kl.Dense(1,activation=’sigmoid’)(x2)
return keras.Model(xinput,xout)
#model_Interpretation=keras.Model(xinput,xFeatures)


Once again, a very nice tutorial, thanks!
However, when comparing the results of the kfold with differents n_splits values, I would highly suggest to use an other error than the one used here.
The line of code is the line 52 in the box starting with “# sensitivity analysis of k in k-fold cross-validation”.
Indeed, as you are currently using yerr=[mins, maxs], the size of the error bar tends to increase with the n_splits value, while I would argue it should actually tends to decrease. I think using something like yerr =[mean-std, mean+std] would be more appropriate. Let me know if you think I am mistaken.
You’re welcome.
Thanks for the suggestion.
Is there a possibility to explain Reinforcement Learning?
This is a common question that I answer here:
https://machinelearningmastery.com/faq/single-faq/do-you-have-tutorials-on-deep-reinforcement-learning
how can i perform cross validation on a sign language datase which have two folders ,if i want to perfon nine fold for training and rest for testing?
Perhaps load all data into memory then use the cross-validation class in sklearn.
Hello Jason,
This can be used for a time series approach like lstm?
No, you must use walk-forward validation:
https://machinelearningmastery.com/backtest-machine-learning-models-time-series-forecasting/
Dear Dr Jason,
In the last example, in addition to the mean of the model
I also calculated the stddev of the ideal and cv scores.
Summary of results and model based on min/max of the stddev and mean of ideal scores and cv scores
Conclusions:
It appears that the the SVC is the model of choice for maximum mean ideal of 0.9 and cv 0.80. The respective ideal stddev is 0.3 and 0.087.
Based on the minimum variability of the cross validation score, KFold has the least variability of 0.087 compared to 0.3 for LOOCV.
Therefore, for the dataset, SVC using KFold cross validation score is the choice.
Thank you,
Anthony of Sydney
Nice experiment! Thanks for sharing your findings.
Hello Mr. Jason,
Thanks for your great support.
I would like to ask how can I perform k-fold cross validation using Imagedatagenerator and flow from directory in keras?. Any sample code would make understanding more clear. Kindly guide.
Regards
nkm
Sorry, I don’t have an example of combining those two methods – I don’t think they are compatible.
Hi Jason, do we run the sensitivity analysis for k ,for every possible combination of hyperparameters? like :
for all possible hyperparameters:
run Loocv
run a sensitivity analysis for k
Thank you 🙂
No, use 10.
This tutorial is about developing an intuition for why we choose 3, 5 or 10 in most cases.
Hi, thanks for this 🙂
I was wondering, you use the same ‘cv’ object for each algorithm, right? Does this mean that, during the training of each algorithm (when you use cross_val_score()), the exact same breaks to train/test happen each time?
That is, will logistic regression get trained and tested on the exact same 10 folds as gaussian naive bayes will , for example?
Thank you
Good question.
I think you’re right, it would be cleaner to re-create the object for each model. I would recommend that change for safety.
Hi Jason,
Thank you for the great tutorial and intuition. I tried your code on a dataset with about 1500 features (less than 10k records), and it’s extremely slow… I mean it took days to process. So I wonder if I should’ve done sth different or … this not meant for such dataset. Thanks
These suggestions will help:
https://machinelearningmastery.com/faq/single-faq/how-do-i-speed-up-the-training-of-my-model
Hi,when you print accuracy in each k. you are running k fold per k iteration. Meaning that there are a total of k*k folds not just k right? If this question makes sense.
Correct, it is a mean across k results.
Hi Jason, Please tell me when we are using k fold evaluation criteria then in that case we need to fit our model on full data i.e. X and Y without splitting into train and test, right? second thing I have seen in some articles that people use xtrain and y train in cross_val_score not x and y, what could be the logic for that?
Yes, k-fold cv is used instead of train/test split.
Perhaps ask the authors of the other tutorials you are reading their reasons.
If i will use 5 folds, Can i take maximum test accuracy from each fold and then take average of those 5 maximum accuracies for my final score in deep neural network
No, average. Taking the max would not be valid.
Hi,
Thank you for this excellent post and blog in general
I am still not conviced that we should use the LOOCV as an ground truth ( i.e., Ideal Test ) to define our best k. I was especially confused by “The results suggest that perhaps k=10 alone is slightly optimistic and perhaps k=13 might be a more accurate estimate.”
1) When i look at the graph from k=7 this is very difficult to draw conclusion. It appears to me that all mean scores are close to the red curve and show a lot of variability
2) Because we do not show the min/max of the score obtained with LOOCV, we do not know if our model (i.e., ML method + parametrisation) is stable ( even if it is probably not the case here).
Best Alexis
You’re welcome.
Agreed, it is just one approach to ground truth.
Hello Jason,
Thanks a lot for the great article series over “machinelearningmastery.com”.
I am running a signal processing experiment using python sci-kit learn. I have an elaborate question which spans across multiple steps during K-Fold validation and the consequent predictions. I am describing them below.
I have 8640 samples of signal data which I am splitting into Training (70%) and Validation (30%). This gives me 6048 samples of Training and 2592 samples of validation. I am dividing the validation samples further – into 2500 samples for K-Fold validation and 92 samples as unseen/live signal. My ultimate goal is to predict all 92 unseen/live samples correctly.
I am giving a code snippet below.
estimator = KerasClassifier(build_fn=lambda: model, epochs=350, batch_size=32, verbose=1)
estimator.fit(X_train, Y_train) //These are 6048 samples
kfold = KFold(n_splits=10, shuffle=True)
results = cross_val_score(estimator, X_test[0:2500,:], Y_test[0:2500], cv=kfold)
print(“Accuracy: %.2f%% (%.2f%%)” % (results.mean()*100, results.std()*100))
predictions = estimator.predict(X_test[2400:2492,:]) #These are the test samples already used for K-Fold
print(predictions)
predictions-2 = estimator.predict(X_test[2500:2592,:]) #These are totally unseen samples
print(predictions-2)
My results are:
1. Accuracy (K-fold validation) = 70%
2. Standard deviation in accuracy = 29%
3. All samples from 2400 to 2492 are predicted correctly
4. Only 12 of the 2500 to 2592 are predicted correctly.
I would like to know, if I am going wrong in understanding somewhere. Why only so few unseen samples are predicted correctly, even though all the samples which are used for K-fold are predicted correctly?
Regards,
Swati.
Perhaps the chosen test harness is not appropriate for your data, you could experiment with other configurations?
Perhaps the model or data preparation you are using is not the most effective for your data, perhaps you could explore alternatives?
Great article!
Also, I was a little bit confused by the line,
´´´scores = cross_val_score(model, X, y, scoring=’accuracy’, cv=cv, n_jobs=-1)
`which, I think, obscures the functioning and the practical usage of k-Fold Cross Validation and limits the code in terms of customability.
So I made some modifications to the code in order to show a “step by step manual method” that performs the same task.
‘Hope it can be of any help.
Here is my proposition:
´´´
# Imports ———————————————————————-
import numpy as np # Math, Stat and Linear Algebra python library
from sklearn.datasets import make_classification # Random generator for classification data
from sklearn.model_selection import KFold # k-Fold module
from sklearn.model_selection import cross_val_score # k-Fold Cross Validation fully automated module
from sklearn.linear_model import LogisticRegression # Model: Logistic Regression module
# Parameters ——————————————————————-
k = 10 # Number of folds (the “k” values in k-fold cross-validation)
n_samples = 100 # Number of data samples
n_features = 20 # Number of input-data features
# Define dataset —————————————————————
X, y = make_classification(n_samples=n_samples, n_features=n_features, n_informative=15, n_redundant=5, random_state=1)
# X is of shape (100, 20) and y is of shape (100,)
# -> X contains float values
# -> y contain only 0 or 1 values
# -> Example: X_i -> y_i := [1.123, … , 0.123123] -> 0 or 1
# Initialiez Logistic Regression model and KFold ——————————-
model = LogisticRegression()
kfold = KFold(n_splits=k, random_state=1, shuffle=True)
# Leanring and k-Fold Cross Validation: Fully Automated ————————
# -> Eveything is done by the sklearn module “cross_val_score”
scores = cross_val_score(model, X, y, scoring=’accuracy’, cv=kfold, n_jobs=-1)
print(“Fully Automated method: “)
print(” Accuracy: μ = {0}, σ = {1}”.format( round(np.mean(scores), 3), round(np.std(scores),3) ))
# Leanring and k-Fold Cross Validation: Manual ———————————
# -> Step by step decomposition of the k-Fold Cross-Validation process
scores = []
for train_index, test_index in kfold.split(X):
# Define test and train data for the k-th fold
X_train, X_test = X[train_index], X[test_index]
y_train, y_test = y[train_index], y[test_index]
# Train the Logistic Regression model on train data
model.fit(X_train, y_train)
# Predict output (y) with the trained model on test data
y_pred = model.predict(X_test)
# Compute the accuracy of the model on test data
n_correct_values = sum([ p == t for p, t in zip(y_pred, y_test) ])
accuracy = n_correct_values / len(y_pred)
scores.append(accuracy)
scores = np.array(scores)
print(“Manual method: “)
print(” Accuracy: μ = {0}, σ = {1}”.format( round(np.mean(scores), 3), round(np.std(scores),3) ))
´´´
PS: I do not know how to post python code on this web-site. Really sorry for that.
I didn’t check your code, but thanks for your suggestion.
Why does (KFOLD) show equal results on execution?
import os
import time
import re
#import numpy as np
import pandas as pd
import matplotlib.pyplot as plt
from tqdm import tqdm
from sklearn.feature_extraction.text import CountVectorizer, TfidfVectorizer
from sklearn import preprocessing
from sklearn.model_selection import train_test_split, StratifiedKFold, KFold
from sklearn.naive_bayes import MultinomialNB
from sklearn.linear_model import SGDClassifier
from sklearn.linear_model import LogisticRegression
from sklearn.svm import LinearSVC
from sklearn.ensemble import RandomForestClassifier, GradientBoostingClassifier
from sklearn.metrics import classification_report
from sklearn.metrics import confusion_matrix
from sklearn.metrics import plot_confusion_matrix
from sklearn.metrics import precision_recall_fscore_support as score
df = pd.read_excel(‘/content/arabic (7).xlsx’)
df.head()
x = df[‘text’]
y = df[‘sen’]
from sklearn.feature_extraction.text import CountVectorizer
count_vect = CountVectorizer()
X_train_counts = count_vect.fit_transform(x)
X_train_counts.shape
from sklearn.feature_extraction.text import TfidfTransformer
tfidf_transformer = TfidfTransformer()
X_train_tfidf = tfidf_transformer.fit_transform(X_train_counts)
X_train_tfidf.shape
from sklearn.preprocessing import LabelEncoder
df=df.dropna()
le=LabelEncoder()
df[‘sen’]=le.fit_transform(df[‘sen’])
df.head()
y=df[‘sen’]
model =LinearSVC()
fold_no=10
K=10
skf = StratifiedKFold(n_splits=10)
def training(train, test, fold_no):
x_train = X_train_tfidf
y_train=y
x_test = X_train_tfidf
y_test =y
model.fit(x_train, y_train)
score = model.score(x_test,y_test)
print(‘For Fold {} the accuracy is {}’.format(str(fold_no),score))
fold_no = 1
acc_score = []
for train_index,test_index in skf.split(x, y):
train = df.iloc[train_index,:]
test = df.iloc[test_index,:]
training(train, test, fold_no)
fold_no += 1
———-OUTPUT———-
For Fold 1 the accuracy is 0.9251433994965543
For Fold 2 the accuracy is 0.9251433994965543
For Fold 3 the accuracy is 0.9251433994965543
For Fold 4 the accuracy is 0.9251433994965543
For Fold 5 the accuracy is 0.9251433994965543
For Fold 6 the accuracy is 0.9251433994965543
For Fold 7 the accuracy is 0.9251433994965543
For Fold 8 the accuracy is 0.9251433994965543
For Fold 9 the accuracy is 0.9251433994965543
For Fold 10 the accuracy is 0.9251433994965543
Perhaps your problem is trivial or perhaps there is a bug in your code.
Thanks, Dr. Jason for your great blogs. Would you please kindly help in the implementation of K-fold cross-validation for two inputs and single output? My implementation of the same is shown below:
num_folds = 5
kfold = StratifiedKFold(n_splits=num_folds, shuffle=True)
for IDs_Train, IDs_Test in kfold.split(X_CXR,y_CXR):
X1_train_cv, X2_train_cv = X_CT[IDs_Train], X_CXR[IDs_Train]
y1_train_cv = y_CT[IDs_Train]
X1_test_cv, X2_test_cv = X_CT[IDs_Test], X_CXR[IDs_Test]
y1_test_cv = y_CT[IDs_Test]
Also, I have used validation_split = 0.2 in model.fit
Issue: My validation accuracy remains 0 for the initial many iterations and grows very slowly leading to overftting though it does not overfit (achieves good test accuracy) in single fold implementation.
Kindly guide.
Regards
Why don’t you combine the two input into one array or DataFrame before applying StratifiedKFold?
Thanks for the quick response. It helped a lot. Thank you so much.
Hello Dr. Adrian,
I have one more doubt. When I perform 5-fold cross-validation, do I need to re-initialize the weights of a model/network after each fold? I have observed that as it progresses from the first fold to the last fold, overfitting increases and it’s probably due to spillover of weights to the next fold.
If the answer is yes, how can I do it?
Thanks and regards
Yes. Do each of the 5 fold separately without sharing any initialization, etc.
Just re-create your model on every fold with the same hyperparameter and do the fitting and validation.
Thanks for the quick response. I am trying your method exactly. Additionally, I am just deleting the model variable (del model) at the end of each fold in the for loop. Is this the correct way???
Thanks again.
Correct. But probably you don’t need to del the model but just create a new one at the beginning of each loop is good enough.
Thank you so much for your quick and exact solutions. Thanks for your support and being a “Real Guide”.
So whenever we use cross validation, we will give the whole dataset and it will do train and test and validation for us? right?
The next question, how to use the model to predict the new sample, when we use cross validation? is there any predict function ?
any response will be appreciated.
Best,
Hi Fereshteh…The following may prove helpful:
https://machinelearningmastery.com/training-validation-test-split-and-cross-validation-done-right/
Thanks
sa
skf = StratifiedKFold(n_splits=3, shuffle=True, random_state=1)
lst_accu_stratified = []
labels = {‘AD’:0, ‘SZP’:1, }
ad_sz[‘class_number’] = ad_sz[‘target’]
ad_sz.class_number = [labels[item] for item in ad_sz.class_number]
ad_sz[‘class_number’] = ad_sz[‘class_number’].astype(np.float32)
# Convert the targets to numeric ones
# Define input and output datasets
input = ad_sz.iloc[:, 0]
print(‘\nInput values are:’)
print(input.head())
output = ad_sz.loc[:, ‘class_number’]
print(‘\nThe output value is:’)
print(output.head())
input = torch.from_numpy(np.vstack(input).astype(np.float32)) # Create tensor
print(‘\nInput format: ‘, input.shape, input.dtype)
output = torch.tensor(output.values) # Create tensor
print(‘Output format: ‘, output.shape, output.dtype)
data_ = TensorDataset(input, output)
model = LogisticRegression(solver=’lbfgs’,max_iter=1000)
skf = StratifiedKFold(n_splits=4, shuffle=True, random_state=1)
lst_accu_stratified = []
for train_index, test_index in skf.split(input, output):
X_train_fold, X_test_fold = input[train_index], input[test_index]
y_train_fold, y_test_fold = output[train_index], output[test_index]
model.fit(X_train_fold, y_train_fold)
lst_accu_stratified.append(model.score(X_test_fold, y_test_fold))
print(‘Maximum Accuracy’,max(lst_accu_stratified))
print(‘Minimum Accuracy:’,min(lst_accu_stratified))
print(‘Overall Accuracy:’,mean(lst_accu_stratified))
from sklearn.metrics import plot_confusion_matrix
plot_confusion_matrix(model, X_train_fold,y_train_fold)
for the above I’m trying to follow stratified kfold and print the accuracy and sensitivity and specificity
I’m struck on how to print accuracy and sensitivity and specificity any idea?
Hello Koundinya…The following may be of interest to you:
https://www.analyticsvidhya.com/blog/2021/06/classification-problem-relation-between-sensitivity-specificity-and-accuracy/
Is there any way I can set the size of the validation set to 20%, regardless of the amount of folds?
Hi Jason,
How could I apply your code for a CNN model instead a random forest. I have defined mi model architecture this way:
def get_model():
xinput=kl.Input((200,9,1))
#Add Gaussian Noise to reduce overfitting ()
xNoise=kl.GaussianNoise(.005)(xinput)
#Only convolutions in the time series direction (Similar to filtering)
x1=kl.Conv2D(NUMBER_FILTERS,(SIZE_FILTERS,1),kernel_regularizer=keras.regularizers.L1(l1=REG))(xNoise)
#Combining information
x1=kl.Conv2D(NUMBER_FILTERS,(SIZE_FILTERS,1),kernel_regularizer=keras.regularizers.L1(l1=REG),activation=’gelu’)(x1)
xFeatures=kl.Conv2D(DIMENSION_SUBSPACE1,(1,1),kernel_regularizer=keras.regularizers.L1(l1=REG),activation=’gelu’)(x1)
#Global Pooling (The network is invariant to translation)
xP=tf.reduce_max(xFeatures,axis=1)
#Classifier in a low dimensional space
x2=kl.Flatten()(xP)
x2=kl.Dense(DIMENSION_SUBSPACE2,activation=’gelu’)(x2)
xout=kl.Dense(1,activation=’sigmoid’)(x2)
return keras.Model(xinput,xout)
#model_Interpretation=keras.Model(xinput,xFeatures)
This is the summary:
Model: “model”
_________________________________________________________________
Layer (type) Output Shape Param #
=================================================================
input_1 (InputLayer) [(None, 200, 9, 1)] 0
gaussian_noise (GaussianNo (None, 200, 9, 1) 0
ise)
conv2d (Conv2D) (None, 186, 9, 32) 512
conv2d_1 (Conv2D) (None, 172, 9, 32) 15392
conv2d_2 (Conv2D) (None, 172, 9, 3) 99
tf.math.reduce_max (TFOpLa (None, 9, 3) 0
mbda)
flatten (Flatten) (None, 27) 0
dense (Dense) (None, 3) 84
dense_1 (Dense) (None, 1) 4
=================================================================
Total params: 16091 (62.86 KB)
Trainable params: 16091 (62.86 KB)
Non-trainable params: 0 (0.00 Byte)
And this are the lines to compile and train the model:
model.compile(optimizer=keras.optimizers.Adam(learning_rate=.001),loss=’binary_crossentropy’,metrics=’accuracy’)
CB=[keras.callbacks.ReduceLROnPlateau(monitor=’loss’,patience=10),keras.callbacks.EarlyStopping(monitor=’loss’,patience=30,restore_best_weights=True)]
model.fit(X,Y,batch_size=4,epochs=600,callbacks=CB)
I’ve been triying to implement your code but I just don’t know how. Thanks for any help and sorry for my bad English.
Thanks 🙂
Hi Carlos…Please provide the verbiage of any error messages you are encountering. That will enable us to better assist you with recommendations.