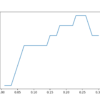
Line Plot of Statistical Noise Added to Examples in TTA vs. Classification Accuracy

Test-Time Augmentation For Tabular Data With Scikit-Learn

Test-time augmentation, or TTA for short, is a technique for improving the skill of predictive models. It is typically used to improve the predictive performance of deep learning models on image datasets where predictions are averaged across multiple augmented versions of each image in the test dataset. Although popular with image datasets and neural network […]

Continue Reading
How to Use Polynomial Features Transforms for Machine Learning

How to Use Polynomial Feature Transforms for Machine Learning

Often, the input features for a predictive modeling task interact in unexpected and often nonlinear ways. These interactions can be identified and modeled by a learning algorithm. Another approach is to engineer new features that expose these interactions and see if they improve model performance. Additionally, transforms like raising input variables to a power can […]

Continue Reading
Histogram Plots of Robust Scaler Transformed Input Variables for the Sonar Dataset

How to Scale Data With Outliers for Machine Learning

Many machine learning algorithms perform better when numerical input variables are scaled to a standard range. This includes algorithms that use a weighted sum of the input, like linear regression, and algorithms that use distance measures, like k-nearest neighbors. Standardizing is a popular scaling technique that subtracts the mean from values and divides by the […]

Continue Reading
Histogram of Data With a Gaussian Distribution

How to Use Discretization Transforms for Machine Learning

Numerical input variables may have a highly skewed or non-standard distribution. This could be caused by outliers in the data, multi-modal distributions, highly exponential distributions, and more. Many machine learning algorithms prefer or perform better when numerical input variables have a standard probability distribution. The discretization transform provides an automatic way to change a numeric […]

Continue Reading
Histogram of Skewed Gaussian Data After Quantile Transform

How to Use Quantile Transforms for Machine Learning

Numerical input variables may have a highly skewed or non-standard distribution. This could be caused by outliers in the data, multi-modal distributions, highly exponential distributions, and more. Many machine learning algorithms prefer or perform better when numerical input variables and even output variables in the case of regression have a standard probability distribution, such as […]

Continue Reading
Histogram of Skewed Gaussian Data After Power Transform

How to Use Power Transforms for Machine Learning

Machine learning algorithms like Linear Regression and Gaussian Naive Bayes assume the numerical variables have a Gaussian probability distribution. Your data may not have a Gaussian distribution and instead may have a Gaussian-like distribution (e.g. nearly Gaussian but with outliers or a skew) or a totally different distribution (e.g. exponential). As such, you may be […]

Continue Reading
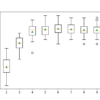
Box Plot of LDA Number of Components vs. Classification Accuracy

Linear Discriminant Analysis for Dimensionality Reduction in Python

Reducing the number of input variables for a predictive model is referred to as dimensionality reduction. Fewer input variables can result in a simpler predictive model that may have better performance when making predictions on new data. Linear Discriminant Analysis, or LDA for short, is a predictive modeling algorithm for multi-class classification. It can also […]

Continue Reading