White noise is an important concept in time series forecasting.
If a time series is white noise, it is a sequence of random numbers and cannot be predicted. If the series of forecast errors are not white noise, it suggests improvements could be made to the predictive model.
In this tutorial, you will discover white noise time series with Python.
After completing this tutorial, you will know:
- The definition of a white noise time series and why it matters.
- How to check if your time series is white noise.
- Statistics and diagnostic plots to identify white noise in Python.
Kick-start your project with my new book Time Series Forecasting With Python, including step-by-step tutorials and the Python source code files for all examples.
Let’s get started.
- Updated Sept/2019: Updated examples to use latest API.
- Updated Oct/2019: Made the check for white noise clearer (thanks Samuel Corradi)

White Noise Time Series with Python
Photo by Dan Eckert, some rights reserved.
What is a White Noise Time Series?
A time series may be white noise.
A time series is white noise if the variables are independent and identically distributed with a mean of zero.
This means that all variables have the same variance (sigma^2) and each value has a zero correlation with all other values in the series.
If the variables in the series are drawn from a Gaussian distribution, the series is called Gaussian white noise.
Why Does it Matter?
White noise is an important concept in time series analysis and forecasting.
It is important for two main reasons:
- Predictability: If your time series is white noise, then, by definition, it is random. You cannot reasonably model it and make predictions.
- Model Diagnostics: The series of errors from a time series forecast model should ideally be white noise.
Model Diagnostics is an important area of time series forecasting.
Time series data are expected to contain some white noise component on top of the signal generated by the underlying process.
For example:
|
1 |
y(t) = signal(t) + noise(t) |
Once predictions have been made by a time series forecast model, they can be collected and analyzed. The series of forecast errors should ideally be white noise.
When forecast errors are white noise, it means that all of the signal information in the time series has been harnessed by the model in order to make predictions. All that is left is the random fluctuations that cannot be modeled.
A sign that model predictions are not white noise is an indication that further improvements to the forecast model may be possible.
Stop learning Time Series Forecasting the slow way!
Take my free 7-day email course and discover how to get started (with sample code).
Click to sign-up and also get a free PDF Ebook version of the course.
Is your Time Series White Noise?
Your time series is probably NOT white noise if one or more of the following conditions are true:
- Is the mean/level non-zero?
- Does the mean/level change over time?
- Does the variance change over time?
- Do values correlate with lag values?
Some tools that you can use to check if your time series is white noise are:
- Create a line plot. Check for gross features like a changing mean, variance, or obvious relationship between lagged variables.
- Calculate summary statistics. Check the mean and variance of the whole series against the mean and variance of meaningful contiguous blocks of values in the series (e.g. days, months, or years).
- Create an autocorrelation plot. Check for gross correlation between lagged variables.
Example of White Noise Time Series
In this section, we will create a Gaussian white noise series in Python and perform some checks.
It is helpful to create and review a white noise time series in practice. It will provide the frame of reference and example plots and statistical tests to use and compare on your own time series projects to check if they are white noise.
Firstly, we can create a list of 1,000 random Gaussian variables using the gauss() function from the random module.
We will draw variables from a Gaussian distribution with a mean (mu) of 0.0 and a standard deviation (sigma) of 1.0.
Once created, we can wrap the list in a Pandas Series for convenience.
|
1 2 3 4 5 6 7 8 9 |
from random import gauss from random import seed from pandas import Series from pandas.plotting import autocorrelation_plot # seed random number generator seed(1) # create white noise series series = [gauss(0.0, 1.0) for i in range(1000)] series = Series(series) |
Next, we can calculate and print some summary statistics, including the mean and standard deviation of the series.
|
1 2 |
# summary stats print(series.describe()) |
Given that we defined the mean and standard deviation when drawing the random numbers, there should be no surprises.
|
1 2 3 4 5 6 7 8 |
count 1000.000000 mean -0.013222 std 1.003685 min -2.961214 25% -0.684192 50% -0.010934 75% 0.703915 max 2.737260 |
We can see that the mean is nearly 0.0 and the standard deviation is nearly 1.0. Some variance is expected given the small size of the sample.
If we had more data, it might be more interesting to split the series in half and calculate and compare the summary statistics for each half. We would expect to see a similar mean and standard deviation for each sub-series.
Now we can create some plots, starting with a line plot of the series.
|
1 2 3 |
# line plot series.plot() pyplot.show() |
We can see that it does appear that the series is random.
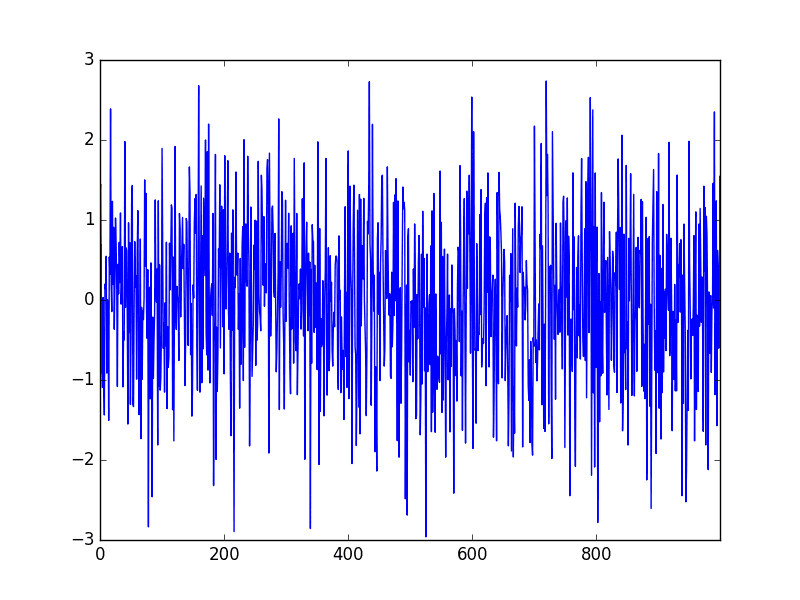
White Noise Series Line Plot
We can also create a histogram and confirm the distribution is Gaussian.
|
1 2 3 |
# histogram plot series.hist() pyplot.show() |
Indeed, the histogram shows the tell-tale bell-curve shape.
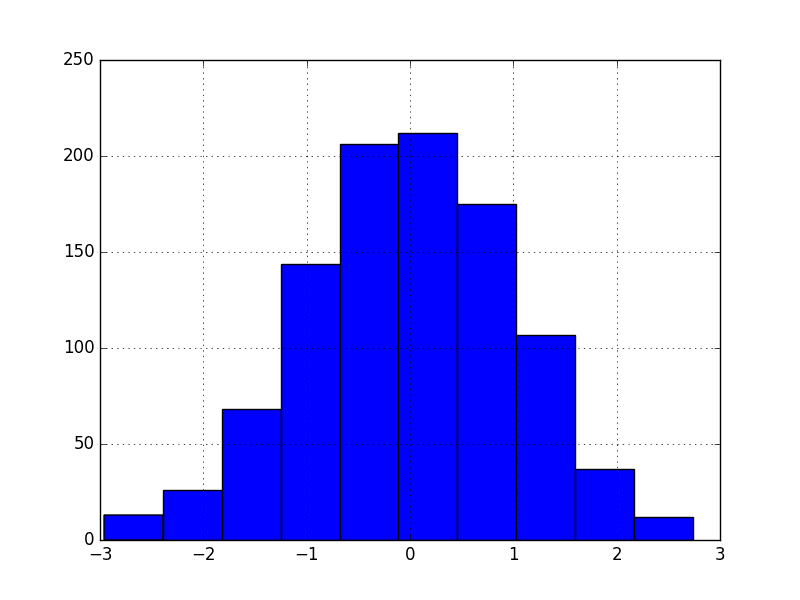
White Noise Series Histogram Plot
Finally, we can create a correlogram and check for any autocorrelation with lag variables.
|
1 2 3 |
# autocorrelation autocorrelation_plot(series) pyplot.show() |
The correlogram does not show any obvious autocorrelation pattern.
There are some spikes above the 95% and 99% confidence level, but these are a statistical fluke.
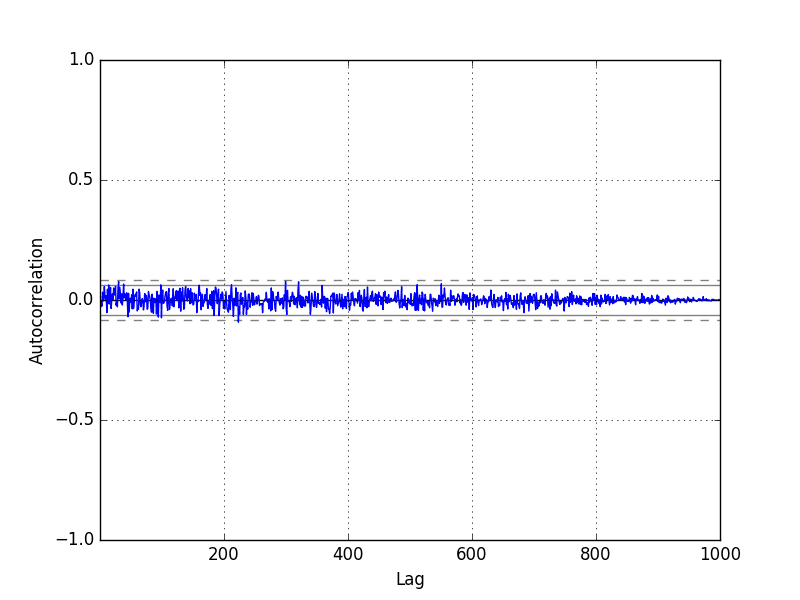
White Noise Series Correlogram Plot
For completeness, the complete code listing is provided below.
|
1 2 3 4 5 6 7 8 9 10 11 12 13 14 15 16 17 18 19 20 21 |
from random import gauss from random import seed from pandas import Series from pandas.plotting import autocorrelation_plot from matplotlib import pyplot # seed random number generator seed(1) # create white noise series series = [gauss(0.0, 1.0) for i in range(1000)] series = Series(series) # summary stats print(series.describe()) # line plot series.plot() pyplot.show() # histogram plot series.hist() pyplot.show() # autocorrelation autocorrelation_plot(series) pyplot.show() |
Further Reading
This section lists some resources for further reading on white noise and white noise time series.
- White Noise Process, Page 28, Time Series Analysis: Forecasting and Control.
- Section 4.2 White Noise, Introductory Time Series with R.
- White Noise on Wikipedia
- Gaussian noise on Wikipedia
Summary
In this tutorial, you discovered white noise time series in Python.
Specifically, you learned:
- White noise time series is defined by a zero mean, constant variance, and zero correlation.
- If your time series is white noise, it cannot be predicted, and if your forecast residuals are not white noise, you may be able to improve your model.
- The statistics and diagnostic plots you can use on your time series to check if it is white noise.
Do you have any questions about this tutorial? Ask your questions in the comments below and I will do my best to answer.





Do I need to remove the trend of data before we check for white noise ? Thanks
Yes, great question!
zero mean is the requirement of white noise series.But the above article says the opposite.Please clarify.
I mention that white noise has a zero mean in the article.
Hello,
I have a doubt on how do we calculate the error term in the moving average model,. in most of the sites it was mentioned that it is the difference between the yactual-yhat , however If i am trying to use the error term to find the yhat , how do I have the value of yhat, until I predict it.
Please give reference on how to calculate the error term in Moving average time series.
Thanks in advance,
Jagadish V.
Fellow at Gradvalley.in.
In ARIMA, MA refers to modeling the series of residual errors. Learn more here:
https://machinelearningmastery.com/model-residual-errors-correct-time-series-forecasts-python/
Hello! In the section of “Is your Time Series White Noise?”,you list three question for us to check if our series is White Noise and the first question is “Does your series have a zero mean?”.According to the meaning of this part, if our data mean is 0, then it is not white noise.I think there is some contradiction here because you mention that the mean value of White Noise is 0 as well.
Sorry, I don’t follow. Can you please elaborate?
Dear Jason,
From your article, Could I conclude your time series is not White Noise? because mean is non-zero just close to zero (mean =-0.013222) and There are some spikes above the 95% and 99% confidence level.
Please help confirm is this correct.
Hi Laksmey…The following may be of interest:
https://towardsdatascience.com/how-to-detect-random-walk-and-white-noise-in-time-series-forecasting-bdb5bbd4ef81
Hello,
I’m working on a project, I have an Event log and I want to know if it’s possible to find out if it’s white noise or no. So I want to know if process activities are predictable or no. If yes, how can I do that?
Thanks in advance
Perhaps try some of the methods listed in the above tutorial?
which tutorial sir
Hi Jason,
I’m fairly new to econometrics and time series. I have a few questions about what you wrote.
You said “This means that all variables have the same variance (sigma^2) and each value has a zero correlation with all other values in the series.”
I thought that not being correlated with other independent variables was a good thing since it avoid multicollinearity.
Also, you said that “Does the variance change over time?” I thought for a time series analysis, you need to have a constant variance in order to have stationarity. Correct me if I’m wrong but I thought that before doing a time series, you must convert a non-stationary data into a stationary form ( perhaps by using differencing). But wouldn’t the “variance change over time” violate stationarity?
Thanks for the help! 🙂
No, in a time series, we want a correlation for a variable with prior time steps it tells us we have something linear we can learn.
Variance can change and we will have to power transform to make it stationary. But when we are looking at noise, we are checking if there is any pattern at all.
Hi Jason,
Thanks for the post which is very helpful.
I understand that stationarity in data is required for forecasting. That is why we need to take the differences of the data which contains trends or seasonalities to make it stationary (constant mean, constant variance when we look at the graph). Now, the data becomes white noise (constant mean, constant variance)? But then, you said that we could not forecast a white noise series.
So it makes me so confused. Please correct me if I misunderstood something.
Thanks a lot for your help!
The idea is that there is some signal left after the trend and seasonality is removed. If there is not, then your job is done – you can model your series with a linear trend and seasonality.
So we can conclude that we need to put effort to improve our model if our error series after modelling is not a white noise .
If its white noise than we have extracted essential information from the data set and our model contains those information.
Correct, if there is some signal remaining, then we can model it.
Hi Jason,
Let’s say that we want to classify a time series data set.
Do we have a similar way (comparing forecast residuals with white noise) to know that our model can be improved ?
Because for classification, we don’t have forecast residuals…
Thanks !
For time series classification? No. You would use a confusion matrix:
https://machinelearningmastery.com/confusion-matrix-machine-learning/
Thanks for the help !
You’re welcome.
You wrote: “Your time series is NOT white noise if any of the following conditions are TRUE:
– Does your series HAVE a zero mean?”
This is right?
Thanks!
I have made it clearer, thanks for pointing this out!
Hi Jason,
Thanks for the post.Very naive question: I wonder if there is a way to evaluate the ‘important variables’ of ML models, adding white noise and testing variables robustness (if they are noise or not). If yes, any idea of R package (with a Monte Carlo simulation)?
You’re welcome.
Great thinking!
Yes, this almost the basis of permutation importance calculation:
https://scikit-learn.org/stable/modules/permutation_importance.html
I think I like your approach better, code it up!
Can you give some insight into increasing the frequency of data, for example, I have GDP which is yearly and I want to increase its frequency to daily. Any idea on how can I do it using noise?
Perhaps you can use interpolation:
https://machinelearningmastery.com/resample-interpolate-time-series-data-python/
Thank you for the explanation. i have been reading quite some time about Time Series forecasting in which majority of the papers emphasize that the forecast errors have to be normally distributed.
Speaking of forecast errors what about the white noise error term, guess white noise wouldn’t be fitting into the normal distribution of errors.
Most importantly the idea for any time series forecast model is to have the error term that should be completely white noise? so that we covered all factors/relationships in predicting a variable and the only error left is white noise.
Forecast function= signal + white noise
Signal contains residuals (reducible errors) and white noise are irreducible errors?
So the normality of errors they are mentioning is only for the residual errors(reducible errors)
and does not include White noise?
Can you please confirm on the above
Good question, white noise is not modelled, it is referred to as “irreducible error”.
Is it possible to you to give a real life example of white noise? It will be helpful for me.
Static on the tv screen is white noise.
hello
thank you sir, i would like to know the importance of white noise in an industry
Generally, it is an important concept to be aware of.
What are the impacts of this white noise sir to an industry like Textile industry
All time series will have white noise.
Not sure the question makes sense, sorry.
very nice article Jason Brownlee,
I check white noise in my SARIMA model/ time series analysis with the help of the Model Diagnostics test and it has properties like mean close to zero, no correlation, constant variance, and normally distributed.
its simply mean my data have white noise and is this fitted model is acceptable?
Thanks.
Yes, that’s a good check and may be another piece of evidence that you have a good fit.
‘A sign that model predictions are not white noise is an indication that further improvements to the forecast model may be possible.’ Should this be predictions error and not predictions?
Yes.
hello,
do you have any idea about continuous white noise generation from approximation of gaussian signal? please elaborate.
Yes, gaussian random numbers:
https://machinelearningmastery.com/how-to-generate-random-numbers-in-python/
Dear Jason,
I have a time series data that is white noise. If I cannot do forecasting, can you please recommend me any other technique to properly analyze and present my data? Thank you so much.
White noise has nothing to analyze. It is just noise. But the techniques on this post help you identify whether your time series is a white noise.
wonderful tutorial!
Thank you!
Thank you for the feedback and kind words Chen!
Regards,
“If the mean of segments varies a lot with the global mean, the series is not white noise”. right?
What if only 1 or 2 segments(out of 10-15) show a large difference in means?
Hi Ayush…Very good question! In this case, it would be beneficial to determine outliers that may skew results.
https://machinelearningmastery.com/model-based-outlier-detection-and-removal-in-python/
The terms do not have to be i.i.d., but they do have to be uncorrelated. (Note that zero correlation does not imply independence, but independence does imply zero correlation.)
Thank you for the feedback Daan de Jong!
Hi Jason,
First of all: congratulate for your very interesting and useful articles.
My challenge:
You have mentioned that there is no sense to analyze white noise tseries. But as I know it can be useful to examine correlation/linear regression/cross-correlation between two or more tseries in the past, moreover it is a must for it, because any component including autocorrelation can mislead the analysis.
What is your opinion/experience on it?
Thank You in advance.
Nandor
Hi Nandor…You are correct. White noise must be identified and understood. Once identified and isolated from the desired time series data, it is not generally considered a useful practice to make predictions with this portion of the data.
Dear Jason,
From your article, Could I conclude your time series is not White Noise? because mean is non-zero just close to zero (mean =-0.013222) and There are some spikes above the 95% and 99% confidence level.
Please help confirm is this correct.