Weka is the perfect platform for learning machine learning.
It provides a graphical user interface for exploring and experimenting with machine learning algorithms on datasets, without you having to worry about the mathematics or the programming.
In a previous post we looked at how to design and run an experiment with 3 algorithms on a dataset and how to analyse and report the results.

Manhattan Skyline, because we are going to be looking at using Manhattan distance with the k-nearest neighbours algorithm.
Photo by Tim Pearce, Los Gatos, some rights reserved.
In this post you will discover how to use Weka Experimenter to improve your results and get the most out of a machine learning algorithm. If you follow along the step-by-step instructions, you will design and run your an algorithm tuning machine learning experiment in under five minutes.
Kick-start your project with my new book Machine Learning Mastery With Weka, including step-by-step tutorials and clear screenshots for all examples.
1. Download Weka and Install
Visit the Weka Download page and locate a version of Weka suitable for your computer (Windows, Mac or Linux).
Weka requires Java. You may already have Java installed and if not, there are versions of Weka listed on the download page (for Windows) that include Java and will install it for you. I’m on a Mac myself, and like everything else on Mac, Weka just works out of the box.
If you are interested in machine learning, then I know you can figure out how to download and install software into your own computer.
2. Start Weka
Start Weka. This may involve finding it in program launcher or double clicking on the weka.jar file. This will start the Weka GUI Chooser.

Weka GUI Chooser
The Weka GUI Chooser lets you choose one of the Explorer, Experimenter, KnowledgeExplorer and the Simple CLI (command line interface).
Click the “Experimenter” button to launch the Weka Experimenter.
The Weka Experimenter allows you to design your own experiments of running algorithms on datasets, run the experiments and analyze the results. It’s a powerful tool.
Need more help with Weka for Machine Learning?
Take my free 14-day email course and discover how to use the platform step-by-step.
Click to sign-up and also get a free PDF Ebook version of the course.
3. Design Experiment
Click the “New” button to create a new experiment configuration.
Test Options
The experimenter configures the test options for you with sensible defaults. The experiment is configured to use Cross Validation with 10 folds. It is a “Classification” type problem and each algorithm + dataset combination is run 10 times (iteration control).
Ionosphere Dataset
Let’s start out by selecting the dataset.
- In the “Datasets” select click the “Add new…” button.
- Open the “data“directory and choose the “ionosphere.arff” dataset.
The Ionosphere Dataset is a classic machine learning dataset. The problem is to predict the presence (or not) of free electron structure in the ionosphere given radar signals. It is comprised of 16 pairs of real-valued radar signals (34 attributes) and a single class attribute with two values: good and bad radar returns.
You can read more about this problem on the UCI Machine Learning Repository page for the Ionosphere dataset.
Tuning k-Nearest Neighbour
In this experiment we are interested in tuning the k-nearest neighbor algorithm (kNN) on the dataset. In Weka this algorithm is called IBk (Instance Based Learner).
The IBk algorithm does not build a model, instead it generates a prediction for a test instance just-in-time. The IBk algorithm uses a distance measure to locate k “close” instances in the training data for each test instance and uses those selected instances to make a prediction.
In this experiment, we are interested to locate which distance measure to use in the IBk algorithm on the Ionosphere dataset. We will add 3 versions of this algorithm to our experiment:
Euclidean Distance
- Click “Add new…” in the “Algorithms” section.
- Click the “Choose” button.
- Click “IBk” under the “lazy” selection.
- Click the “OK” button on the “IBk” configuration.
This will add the IBk algorithm with Euclidean distance, the default distance measure.
Manhattan Distance
- Click “Add new…” in the “Algorithms” section.
- Click the “Choose” button.
- Click “IBk” under the “lazy” selection.
- Click on the name of the “nearestNeighborSearchAlgorithm” in the configuration for IBk.
- Click the “Choose” button for the “distanceFunction” and select “ManhattanDistance“.
- Click the “OK” button on the “nearestNeighborSearchAlgorithm” configuration.
- Click the “OK” button on the “IBk” configuration.
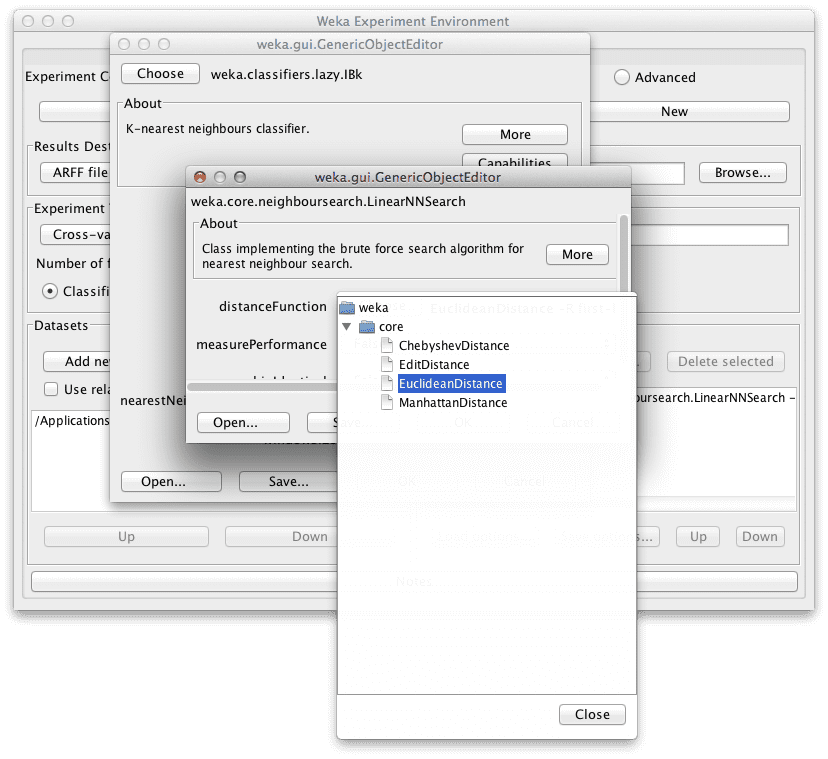
Select a distance measures for IBk
This will add the IBk algorithm with Manhattan Distance, also known as city block distance.
Chebyshev Distance
- Click “Add new…” in the “Algorithms” section.
- Click the “Choose” button.
- Click “IBk” under the “lazy” selection.
- Click on the name of the “nearestNeighborSearchAlgorithm” in the configuration for IBk.
- Click the “Choose” button for the “distanceFunction” and select “ChebyshevDistance“.
- Click the “OK” button on the “nearestNeighborSearchAlgorithm” configuration.
- Click the “OK” button on the “IBk” configuration.
This will add the IBk algorithm with Chebyshev Distance, also known as city chessboard distance.
4. Run Experiment
Click the “Run” tab at the top of the screen.
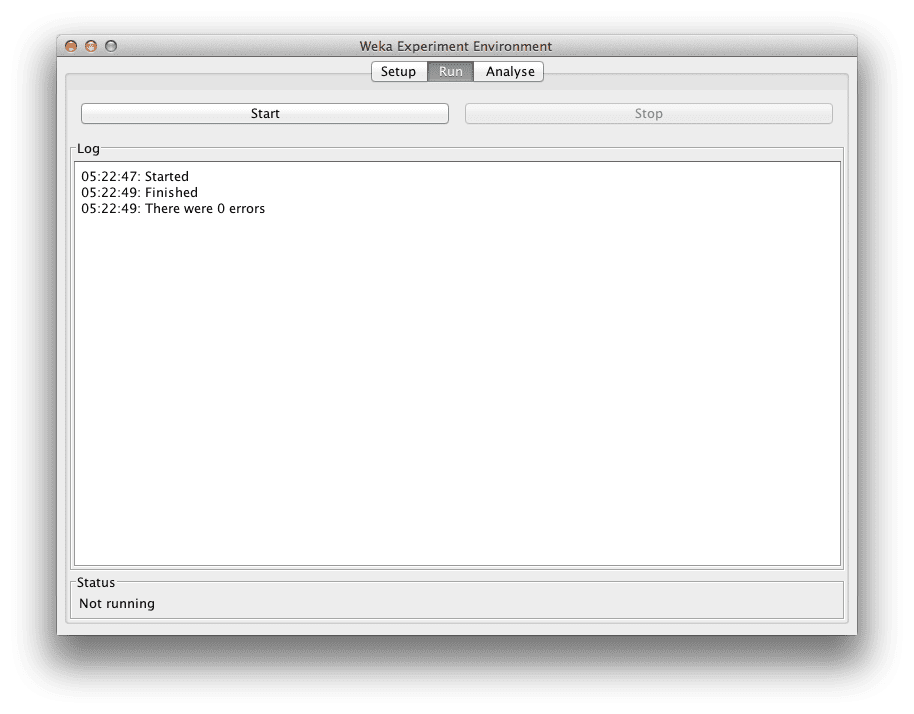
This tab is the control panel for running the currently configured experiment.
Click the big “Start” button to start the experiment and watch the “Log” and “Status” sections to keep an eye on how it is doing.
5. Review Results
Click the “Analyse” tab at the top of the screen.
This will open up the experiment results analysis panel.
Algorithm Rank
The first thing we want to know is which algorithm was the best. We can do that by ranking the algorithms by the number of times a given algorithm beat the other algorithms.
- Click the “Select” button for the “Test base” and choose “Ranking“.
- Now Click the “Perform test” button.
The ranking table shows the number of statistically significant wins each algorithm has had against all other algorithms on the dataset. A win, means an accuracy that is better than the accuracy of another algorithm and that the difference was statistically significant.
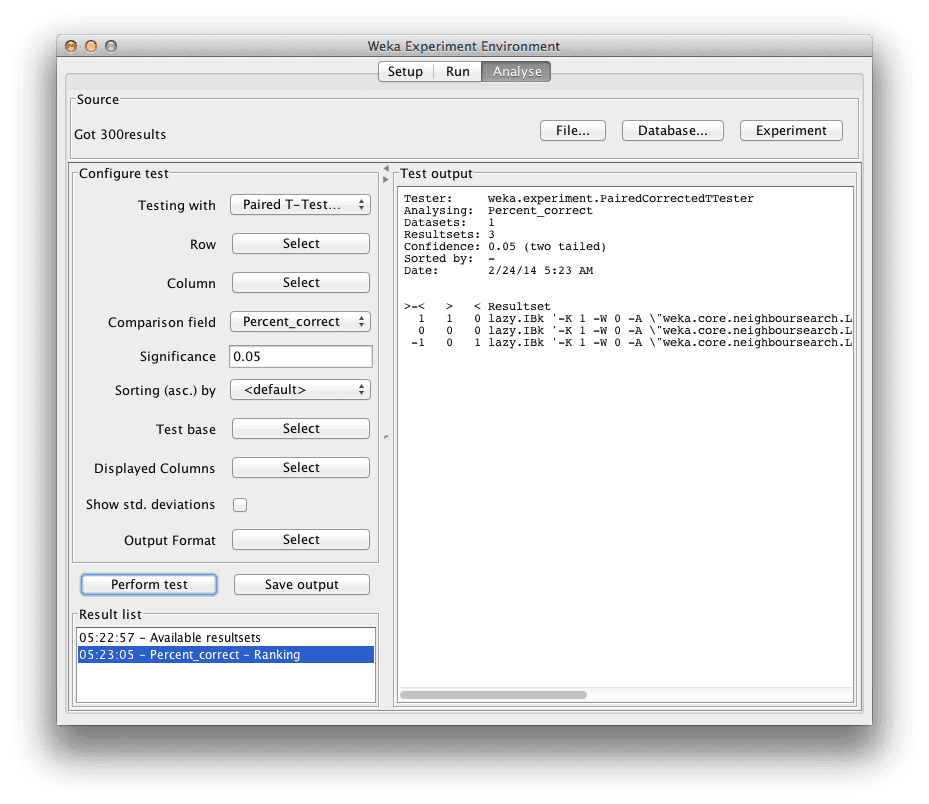
Algorithm ranking in the Weka explorer for the Ionosphere dataset
We can see the Manhattan Distance variation is ranked at the top and that the Euclidean Distance variation is ranked down the bottom. This is encouraging, it looks like we have found a configuration that is better than the algorithm default for this problem.
Algorithm Accuracy
Next we want to know what scores the algorithms achieved.
- Click the “Select” button for the “Test base” and choose the “IBk” algorithm with “Manhattan Distance” in the list and click the “Select” button.
- Click the check-box next to “Show std. deviations“.
- Now click the “Perform test” button.
In the “Test output” we can see a table with the results for 3 variations of the IBk algorithm. Each algorithm was run 10 times on the dataset and the accuracy reported is the mean and the standard deviation in rackets of those 10 runs.

Table of algorithm classification accuracy on the Ionosphere dataset in the Weka Explorer
We can see that IBk with Manhattan Distance achieved an accuracy of 90.74% (+/- 4.57%) which was better than the default of Euclidean Distance that had an accuracy of 87.10% (+/- 5.12%).
The little *” next to the result for IBk with Euclidean Distance tells us that the accuracy results for the Manhattan Distance and Euclidean Distance variations of IBk were drawn from different populations, that the difference in the results is statistically significant.
We can also see that there is no “*” for the results of IBk with Chebyshev Distance indicating that the difference in the results between the Manhattan Distance and Chebyshev Distance variations of IBk was not statistically significant.
Summary
In this post you discovered how to configure a machine learning experiment with one dataset and three variations of an algorithm in Weka. You discovered how you can use the Weka experimenter to tune the parameters of machine learning algorithm on a dataset and analyze the results.
If you made it this far, why not:
- See if you can further tune IBk and get a better result (and leave a comment to tell us)
- Design and run an experiment to tune the k parameter of IBk.
Discover Machine Learning Without The Code!
Develop Your Own Models in Minutes
...with just a few a few clicks
Discover how in my new Ebook:
Machine Learning Mastery With Weka
Covers self-study tutorials and end-to-end projects like:
Loading data, visualization, build models, tuning, and much more...
Finally Bring The Machine Learning To Your Own Projects
Skip the Academics. Just Results.


")


Un intense remerciement au créateur duu site
You’re very welcome.
Hi, I tried with multiple option K=1 (as mentioed)), 3, 5, 10. Even also with weighted distance, difficult to find better accuracy than Manhattan distance.
Thanks for tutorial on tuning of ML algorithm in weka, really gave complete insight how to modify parameters and compare test options.
I’m glad you found it useful Jayesh.
Now I tried to compare with SMO function (i.e. SVM algorithm) with RBF kernel and gamma as 1, it giving better result with 94.53% accuracy.
Is it valid to compare/rank these two algorithms (KNN and SVM)?
Yes, Rank everything and see what works best on a problem. Results/Performance level all algorithms.
How does the ranking work internally? How to compare the performance of algorithms when you have N subjects and you have m models for every subject. Is there a way I can program the ranking part in Python/MATLAB if I have access to the confusion matrix of each model.
What do you mean by subjects? Datasets?
Nice tutorial. It’s surprising that a good selection of similarity or distance function can have such an impact on the outcome.
A good reminder to tune the model.
Hi,
It does not show plot of KNN in this dataset? Can we achieve using Weka?
Yes, I believe there is a decision boundary plot.