What algorithm should you use on your dataset?
This is the most common question in applied machine learning. It’s a question that can only be answered by trial and error, or what I call: spot-checking algorithms.
In this post you will discover how to spot check algorithms on a dataset using R. Including the selection of test options, evaluation metrics, and algorithms.
You can use the code in this post as a template for spot checking machine learning algorithms on your own problems.
Kick-start your project with my new book Machine Learning Mastery With R, including step-by-step tutorials and the R source code files for all examples.
Let’s get started.

Evaluate Machine Learning Algorithms with R
Photo by Brian Townsley, some rights reserved.
Best Algorithm For a Problem
You want the most accurate model for your dataset. That is the goal of predictive modeling.
No one can tell you what algorithm to use on your dataset to get the best results. If you or anyone knew what algorithm gave the best results for a specific dataset, then you probably would not need to use machine learning in the first place because of your deep knowledge of the problem.
We cannot know beforehand the best algorithm representation or learning algorithm for that representation to use. We don’t even know the best parameters to use for algorithms that we could try.
We need a strategy to find the best algorithm for our dataset.
Use Past Experience To Choose An Algorithm
One way that you could choose an algorithm for a problem is to reply on experience.
This could be your experience with working on similar problems in the past. It could also be the collective experience of the field where you refer to papers, books and other resources for similar problems to get an idea of what algorithms have worked well in the past.
This is a good start, but this should not be where you stop.
Use Trial And Error To Choose An Algorithm
The most robust way to discover good or even best algorithms for your dataset is by trial and error. Evaluate a diverse set of algorithms on your dataset and see what works and drop what doesn’t.
I call this process spot-checking algorithms.
Once you have a short list of algorithms that you know are good at picking out the structure of your problem, you can focus your efforts on those algorithms.
You can improve the results of candidate algorithms by either tuning the algorithm parameters or by combining the predictions of multiple models using ensemble methods.
Next, let’s take a look at how we can evaluate multiple machine algorithms on a dataset in R.
Need more Help with R for Machine Learning?
Take my free 14-day email course and discover how to use R on your project (with sample code).
Click to sign-up and also get a free PDF Ebook version of the course.
Spot Check Algorithms in R
In this section you will work through a case study of evaluating a suite of algorithms for a test problem in R.
The test problem used in this example is a binary classification dataset called the Pima Indians dataset. The data describes medical details for female patients and boolean output variable as to whether they had an onset of diabetes within five years of their medical evaluation.
You can learn more about this dataset here: Pima Indians Diabetes Data Set.
You can learn more about this dataset here:
This case study is broken down into 3 sections:
- Defining a test harness.
- Building multiple predictive models from the data.
- Comparing models and selecting a short list.
We will be using the caret package in R as it provides an excellent interface into hundreds of different machine learning algorithms and useful tools for evaluating and comparing models.
For more information on caret, see the post:
Let’s define the test harness
1. Test Harness
The test harness is comprised of three key elements:
- The dataset we will use to train models.
- The test options used to evaluate a model (e.g. resampling method).
- The metric we are interested in measuring and comparing.
Test Dataset
The dataset we use to spot check algorithms should be representative of our problem, but it does not have to be all of our data.
Spot checking algorithms must be fast. If we have a large dataset, it could cause some of the more computationally intensive algorithms we want to check to take a long time to train.
When spot checking a good rule of thumb I use is that each algorithm should train within 1-to-2 minutes.(ideally within 30 seconds). I find that a less than 10,000 instances (rows) is often a good size, but this will vary from dataset to dataset.
If you have a large dataset, take some different random samples and one simple model (glm) and see how long it takes to train. Select a sample size that falls within the sweet spot.
We can investigate the effect that sample size has on our short list of well performing algorithms later.
Also, you can repeat this experiment later with a larger dataset, once you have a smaller subset of algorithms that look promising.
Let’s load libraries and our diabetes dataset. It is distributed with the mlbench package, so we can just load it up.
|
1 2 3 4 5 6 7 8 |
# load libraries library(mlbench) library(caret) # load data data(PimaIndiansDiabetes) # rename dataset to keep code below generic dataset <- PimaIndiansDiabetes |
There are only 768 instances, so in this case study we will use all of this data to spot check our algorithms.
Note, that on a full end-to-end project I would recommend holding back a validation dataset to get an objective final evaluation of the very best performing model.
Test Options
Test options refers to the technique used to evaluate the accuracy of a model on unseen data. They are often referred to as resampling methods in statistics.
Test options I’d generally recommend are:
- Train/Test split: if you have a lot of data and determine you need a lot of data to build accurate models
- Cross Validation: 5 folds or 10 folds provide a commonly used tradeoff of speed of compute time and generalize error estimate.
- Repeated Cross Validation: 5- or 10-fold cross validation and 3 or more repeats to give a more robust estimate, only if you have a small dataset and can afford the time.
In this case study we will use 10-fold cross validation with 3 repeats.
|
1 2 |
control <- trainControl(method="repeatedcv", number=10, repeats=3) seed <- 7 |
Note that we assigning a random number seed to a variable, so that we can re-set the random number generator before we train each algorithm.
This is important to ensure that each algorithm is evaluated on exactly the same splits of data, allow for true apples to apples comparisons later.
For more on test options, see the post:
For examples of using all three recommended test options and more in caret, see the post:
Test Metric
There are many possible evaluation metrics to chose from. Caret provides a good selection and you can use your own if needed.
Some good test metrics to use for different problem types include:
Classification:
- Accuracy: x correct divided by y total instances. Easy to understand and widely used.
- Kappa: easily understood as accuracy that takes the base distribution of classes into account.
Regression:
- RMSE: root mean squared error. Again, easy to understand and widely used.
- Rsquared: the goodness of fit or coefficient of determination.
Other popular measures include ROC and LogLoss.
The evaluation metric is specified the call to the train() function for a given model, so we will define the metric now for use with all of the model training later.
|
1 |
metric <- "Accuracy" |
Learn more about test metrics in the post:
2. Model Building
There are three concerns when selecting models to spot check:
- What models to actually choose.
- How to configure their arguments.
- Preprocessing of the data for the algorithm.
Algorithms
It is important to have a good mix of algorithm representations (lines, trees, instances, etc.) as well as algorithms for learning those representations.
A good rule of thumb I use is “a few of each”, for example in the case of binary classification:
- Linear methods: Linear Discriminant Analysis and Logistic Regression.
- Non-Linear methods: Neural Network, SVM, kNN and Naive Bayes
- Trees and Rules: CART, J48 and PART
- Ensembles of Trees: C5.0, Bagged CART, Random Forest and Stochastic Gradient Boosting
You want some low complexity easy to interpret methods in there (like LDA and kNN) in case they do well, you can adopt them. You also want some sophisticated methods in there (like random forest) to see if the problem can even be learned and to start building up expectations of accuracy.
How many algorithms? At least 10-to-20 different algorithms.
Algorithm Configuration
Almost all machine learning algorithms are parameterized, requiring that you specify their arguments.
The good thing is, most algorithm parameters have heuristics that you can use to provide a first past configuration of the algorithm to get the ball rolling.
When we are spot checking, we do not want to be trying many variations of algorithm parameters, that comes later when improving results. We also want to give each algorithm a chance to show its stuff.
One aspect of the caret package in R is that it helps with tuning algorithm parameters. It can also estimate good defaults (via the automatic tuning functionality and the tunelength argument to the train() function).
I recommend using the defaults for most if not all algorithms when spot checking, unless you look up some sensible defaults or have some experience with a given algorithm.
Data Preprocessing
Some algorithms perform a whole lot better with some basic data preprocessing.
You want to give each algorithm a good fair chance of shining, so it is important to include any required preprocessing in with the training of those algorithms that do require it.
For example, many instance based algorithms work a lot better if all input variables have the same scale.
Fortunately, the train() function in caret lets you specify preprocessing of the data to perform prior to training. The transforms you need are provided to the preProcess argument as a list and are executed on the data sequentially
The most useful transform is to scale and center the data via. For example:
|
1 |
preProcess=c("center", "scale") |
Algorithm Spot Check
Below are the models that we will spot check for this diabetes case study.
|
1 2 3 4 5 6 7 8 9 10 11 12 13 14 15 16 17 18 19 20 21 22 23 24 25 26 27 28 29 30 31 32 33 |
# Linear Discriminant Analysis set.seed(seed) fit.lda <- train(diabetes~., data=dataset, method="lda", metric=metric, preProc=c("center", "scale"), trControl=control) # Logistic Regression set.seed(seed) fit.glm <- train(diabetes~., data=dataset, method="glm", metric=metric, trControl=control) # GLMNET set.seed(seed) fit.glmnet <- train(diabetes~., data=dataset, method="glmnet", metric=metric, preProc=c("center", "scale"), trControl=control) # SVM Radial set.seed(seed) fit.svmRadial <- train(diabetes~., data=dataset, method="svmRadial", metric=metric, preProc=c("center", "scale"), trControl=control, fit=FALSE) # kNN set.seed(seed) fit.knn <- train(diabetes~., data=dataset, method="knn", metric=metric, preProc=c("center", "scale"), trControl=control) # Naive Bayes set.seed(seed) fit.nb <- train(diabetes~., data=dataset, method="nb", metric=metric, trControl=control) # CART set.seed(seed) fit.cart <- train(diabetes~., data=dataset, method="rpart", metric=metric, trControl=control) # C5.0 set.seed(seed) fit.c50 <- train(diabetes~., data=dataset, method="C5.0", metric=metric, trControl=control) # Bagged CART set.seed(seed) fit.treebag <- train(diabetes~., data=dataset, method="treebag", metric=metric, trControl=control) # Random Forest set.seed(seed) fit.rf <- train(diabetes~., data=dataset, method="rf", metric=metric, trControl=control) # Stochastic Gradient Boosting (Generalized Boosted Modeling) set.seed(seed) fit.gbm <- train(diabetes~., data=dataset, method="gbm", metric=metric, trControl=control, verbose=FALSE) |
You can see a good mixture of algorithm types.
You can see that all algorithms use the default (automatically estimated) algorithm parameters, there are no tune grids (how caret tunes algorithms).
You can also see that those algorithms that benefit from rescaled data have the preProcess argument set.
For more information on spot checking algorithms see the post:
3. Model Selection
Now that we have trained a large and diverse list of models, we need to evaluate and compare them.
We are not looking for a best model at this stage. The algorithms have not been tuned and can all likely do a lot better than the results you currently see.
The goal now is to select a handful, perhaps 2-to-5 diverse and well performing algorithms to investigate further.
|
1 2 3 4 5 |
results <- resamples(list(lda=fit.lda, logistic=fit.glm, glmnet=fit.glmnet, svm=fit.svmRadial, knn=fit.knn, nb=fit.nb, cart=fit.cart, c50=fit.c50, bagging=fit.treebag, rf=fit.rf, gbm=fit.gbm)) # Table comparison summary(results) |
You can see that we have summarized the results of the algorithms as a table.
|
1 2 3 4 5 6 7 8 9 10 11 12 13 14 15 16 |
Models: lda, logistic, glmnet, svm, knn, nb, cart, c50, bagging, rf, gbm Number of resamples: 30 Accuracy Min. 1st Qu. Median Mean 3rd Qu. Max. NA's lda 0.6711 0.7532 0.7662 0.7759 0.8052 0.8701 0 logistic 0.6842 0.7639 0.7713 0.7781 0.8019 0.8701 0 glmnet 0.6842 0.7557 0.7662 0.7773 0.8019 0.8701 0 svm 0.6711 0.7403 0.7582 0.7651 0.7890 0.8961 0 knn 0.6753 0.7115 0.7386 0.7465 0.7785 0.8961 0 nb 0.6316 0.7305 0.7597 0.7569 0.7869 0.8571 0 cart 0.6234 0.7115 0.7403 0.7382 0.7760 0.8442 0 c50 0.6711 0.7273 0.7468 0.7586 0.7785 0.8831 0 bagging 0.6883 0.7246 0.7451 0.7530 0.7792 0.8571 0 rf 0.6711 0.7273 0.7516 0.7617 0.7890 0.8571 0 gbm 0.6974 0.7273 0.7727 0.7708 0.8052 0.8831 0 |
It is also useful to review the results using a few different visualization techniques to get an idea of the mean and spread of accuracies.
|
1 2 3 4 |
# boxplot comparison bwplot(results) # Dot-plot comparison dotplot(results) |
From these results, it looks like linear methods do well on this problem. I would probably investigate logistic, lda, glmnet, and gbm further.
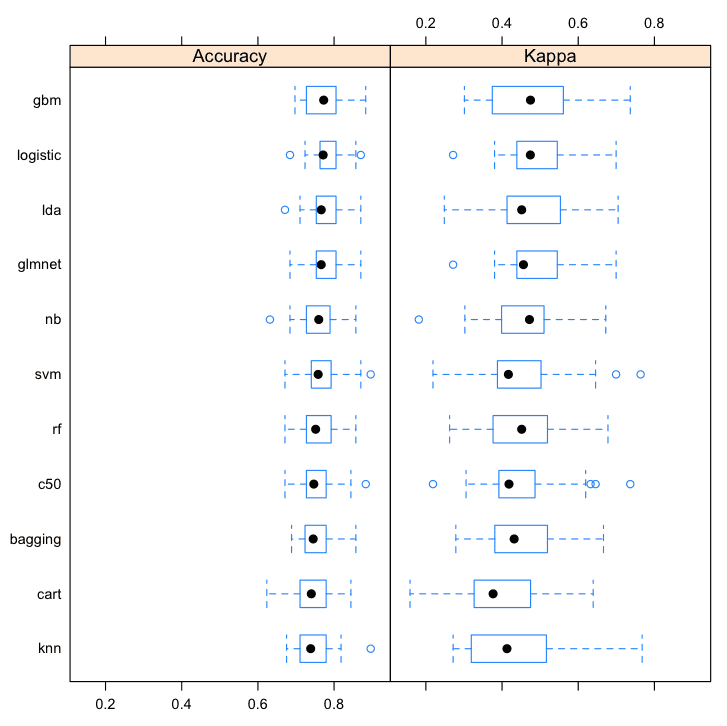
Compare Machine Learining Algorithms in R Box and Whisker Plots
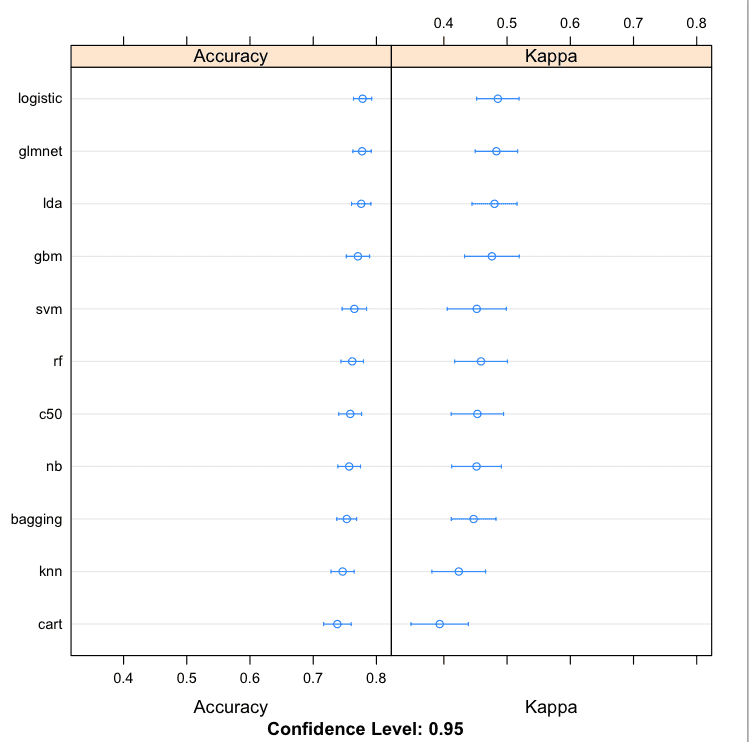
Compare Machine Learining Algorithms in R Dot Plots
If I had more data, I would probably repeat the experiment with a large sample and see if the large dataset improve the performance of any of the tree methods (it often does).
Tips For Good Algorithm Spot Checking
Below are some tips that you can use to get good at evaluating machine learning algorithms in R.
- Speed. Get results fast. Use small samples of your data and simple estimates for algorithm parameters. Turn around should be minutes to an hour.
- Diversity. Use a diverse selection of algorithms including representations and different learning algorithms for the same type of representation.
- Scale-up. Don’t be afraid to schedule follow-up spot-check experiments with larger data samples. These can be run overnight or on larger computers and can be good to flush out those algorithms that only do well with larger samples (e.g. trees).
- Short-list. Your goal is to create a shortlist of algorithms to investigate further, not optimize accuracy (not yet).
- Heuristics. Best practice algorithm configurations and algorithms known to be suited to problems like your are an excellent place to start. Use them to seed your spot-check experiments. Some algorithms only start to show that they are accurate with specific parameter configurations.
You Can Spot Check Algorithms in R
You do not need to be a machine learning expert. You can get started by running the case study above and reviewing the results. You can dive deeper by reading up on the R functions and machine learning algorithms used in the case study.
You do not need to be an R programmer. The case study in this post is complete and will produce a result. You can copy it, run it on your workstation and use it as a template on your current or next project.
You do not need to know how to configure algorithms. The train() function in R can automatically estimate reasonable defaults as a starting point. You do not need to specify algorithm parameters yet. You may need to later during tuning and the help for specific machine learning functions in R often also provide example parameters that you can use, as well as research papers on the algorithms themselves.
You do not need to collect your own data. There are many R packages that provide, small standard, in-memory datasets that you can use to practice classification and regression machine learning problems. In this example we used the mlbench package.
You do not need a lot of data. Small samples of your data are good for spot checking algorithms. You want a result quickly and small data samples are the best way to achieve that.
Summary
In this post you discovered the importance of spot checking machine learning algorithms on your problem.
You discovered that spot checking is the best way to find the good and even best machine learning algorithms for a given dataset.
You worked through a case study in R using the caret package and evaluated more than 10 different algorithms on a binary classification problem.
You now have a template for spot checking algorithms that you can use on your current or next machine learning project.
Next Step
Did you work through the case study?
- Start your R interactive environment.
- Type or copy-paste each code snippet.
- Take your time to understand what is going on and read up on the functions used.
Do you have any questions? Ask in the comments and I will do my best to answer.
Discover Faster Machine Learning in R!

Develop Your Own Models in Minutes
...with just a few lines of R code
Discover how in my new Ebook:
Machine Learning Mastery With R
Covers self-study tutorials and end-to-end projects like:
Loading data, visualization, build models, tuning, and much more...
Finally Bring Machine Learning To Your Own Projects
Skip the Academics. Just Results.


")

Hi Jason,
Thank you for the very detailed explanation. I have been following a very similar method to compare algorithms using Caret, but I found a few tweaks I need to make to my method based on your article. I have a couple of questions:
1. I know that certain algorithms (SVM, neural network models etc.) do not have in-built feature selection, as many other algorithms (like random forests) do. I’m worried that by not including the feature selection step in the algorithm selection process, I’m not giving a fair chance to algorithms that work better with a smaller set of variables. What would be the best way to integrate feature selection (based on variable importance) into the algorithm selection process?
2. What 10 algorithms would you suggest be tried for regression? My datasets usually have 3000-5000 instances of 20-40 variables.
Thanks,
Jai
Hi Jai, really great questions!
I like to create many “presentations” or “views” of my training data and and then run a suite of 10-20 algorithms on each view. Some views will be transforms, others will have had feature selection applied, and so on.
Spot-checking algorithms becomes m views * n algorithms * o CV folds * p repeats.
As for regression algorithms, here are my go-to methods: linear regression, penalized linear regression (e.g. lasso and elasticnet), CART, SVM, neural net, MARS, KNN, Random Forest, boosted trees and more recently Cubist.
I hope that helps.
Thank you, Jason! That’s really helpful!
Hi Jason, thanks for sharing all this valuable information!
At the moment I am working on a data file with numerical and categorical inputs and a numerical target variable. About 50,000 lines and 50 variables. Please tell me, what kind of methods would you use in this case? Did you already wrote an article about a similar case? Thanks! Sharon
This may help:
https://machinelearningmastery.com/faq/single-faq/what-algorithm-config-should-i-use
I’m trying to reproduce your code. Could you provide the line used to load the data set and name the columns?
I loaded the csv from https://archive.ics.uci.edu/ml/datasets/Pima+Indians+Diabetes
I guess the dependent variable in your model diabete is in column 7. Diabetes pedigree function ?
Hi Paul,
The line to load the dataset is in the very first code block:
# load data
data(PimaIndiansDiabetes)
The “PimaIndiansDiabetes” dataset is part of the mlbench package which wasn’t installed on my system. I installed it and now I can indeed load the data with:
data(PimaIndiansDiabetes)
Thanks.
Hi again,
Most function called in the “Algorithm Spot Check” section return the message:
“Error in train.default(x, y, weights = w, …) :
Metric Accuracy not applicable for regression models”
Hi,
I had similar problem, but the solution is quite easy:
dataset$diabetes= factor(dataset$diabetes, levels = c(0, 1))
(from dataset it is actually $Outcome I think)
Great post! Very very useful. Thank you.
what is diabetes~. ?
The “diabetes~.” is an example of the formula interface to data frames in R.
It is an equation that describes a model to predict the “diabetes” outcome variable given “~” all of the other attributes “.”.
I will write a post on the formula interface soon. Until then, here is some more info:
https://stat.ethz.ch/R-manual/R-devel/library/stats/html/formula.html
Hi, I really appreciate this article. Very well written and explained. I have a couple of technical questions though..
Q1. On what features are you fitting the model?(Using the full subset of features may no be fair, since some models may not perform very well on the full subset but may give much better results after feature selection)
Q2. What next? 😛 (I mean to ask, that after you’ve chosen 2-5 models that you can work with, how do you select the best model among those?)
I use the full set of features, but you should perform feature selection in practice.
Select models by performance (maximize) and complexity (minimize).
Tune top performing models, ensemble results, then present model/predictions.
Here comes the paradox. Applying feature selection using a hybrid filter-wrapper model, includes using the classifier to find the best features. Hence the best feature subset will be different for each machine learning algorithm. For example Random Forest may have the best feature subset as {f1,f9,f17,f23} but random forest may have {f1,f9,f28,f46,f55}. Running a wrapper is pretty expensive and slow, and hence i need to decide which algos to apply it on. So basically to apply feature selection i need to decide an algo and to decide the algo i need to apply feature selection. What are your thoughts on this? My task is basically to decide 2 out of 10 algorithms on which i want to apply feature selection. Using the full subset will not indicate which algorithm will perform better after feature selection. For example in your example, logistic, gbm, lda have given good results on the full subset, But after selecting the best feature subset for each model, it may be c50 or knn which gives the highest accuracy. Please let me know how to go about this. I really am grateful to you for taking time out and helping me. Thanks. 🙂
Hi Raag,
Generally the wrapper feature selection methods will arrive at similar if not the same subsets. Consider taking a smaller subset of your data for speed and try a few wrappers, to end up with a few different “views” of your problem. Then try a suite of algorithms on those views to discover which view+algorithm result in good performance on your problem.
Hi jason! It is good information. But i have a question.
In Algorithm spot check that models that we will spot check for this diabetes case study.
You use 11 algorithms. But in your code, you didn’t use preProc parameter in some algorithm code.
Why you didn’t use preProc in some algorithms?
Have a nice day
Whim. Some algorithms benefit from scaling and some do not.
Hi Jason. I have one more question.
In chapter 3. Model Selection, you said “We are not looking for a best model at this stage. The algorithms have not been tuned and can all likely do a lot better than the results you currently see”.
You mean that purpose of “spot checking algorithms” is looking proper some algorithms, not best one algorithm. right??
Then, the purpose of spot checking algorithms is looking for some proper algorithms. After, Should i tune that proper algorithms??
Have a nice day!
Yes. The idea is to quickly find some algorithms that do well that you can tune and get the most out of.
Is here an accuracy of 0.80 = 80% performance?
Correct.
Is there a hint available to get the example code ready for regressions?
> fit.lda # Logistic Regression
> set.seed(seed)
> fit.glm # GLMNET
> set.seed(seed)
> fit.glmnet # SVM Radial
> set.seed(seed)
> fit.svmRadial # kNN
> set.seed(seed)
> fit.knn # Naive Bayes
> set.seed(seed)
> fit.nb # CART
> set.seed(seed)
> fit.cart # C5.0
> set.seed(seed)
> fit.c50 # Bagged CART
> set.seed(seed)
> fit.treebag # Random Forest
> set.seed(seed)
> fit.rf # Stochastic Gradient Boosting (Generalized Boosted Modeling)
> set.seed(seed)
> fit.gbm results # Table comparison
> summary(results)
Sorry the text was stripped out…
I get for the models the following messages using an own data set Columns: date=date,n2=numbers:
fit.lda
Error: wrong model type for regression
fit.glm
Error: Metric Accuracy not applicable for regression models
fit.glmnet
Error: Metric Accuracy not applicable for regression models
fit.svmRadial
Error: Metric Accuracy not applicable for regression models
fit.knn
Error: Metric Accuracy not applicable for regression models
fit.nb
Error: wrong model type for regression
fit.cart
Error: Metric Accuracy not applicable for regression models
fit.c50
Error: wrong model type for regression
fit.treebag
Error: Metric Accuracy not applicable for regression models
fit.rf
Error: Metric Accuracy not applicable for regression models
fit.gbm
Error: Metric Accuracy not applicable for regression models
How could this be?
What are the predictors in this experiment?
Are they automatically chosen from the dataset?
You mean the output variable? It is the last column. All other columns are taken as input variables.
Obviously this seems to be a classification experiment.
Maybe ‘predictors’ is the wrong term in a non regression context.
Would you call the input variables ‘predictors’ or ‘features’?
Could one row of the data set seen as: ‘x1,x2,x3,x4,x5,x6,x7,x8,y’ ?
I call them features. Predictors is fine. Columns if we are in excel.
Would class ‘diabetes’ represent a column header in a csv-only-version?
Let’s say we found a good performing model. How would it looks like to predict unseen data with that fitted model?
I found a bunch of examples, but nothing really helpful.
https://www.rdocumentation.org/packages/glmnet/versions/2.0-5/topics/predict.glmnet
How would we define a so called ‘newx’ in context of the diabetes example?
predict(fit3,newx=x[1:3,],type=”response”,s=0.01)
See this post on how to finalize a model and make predictions on new data:
https://machinelearningmastery.com/finalize-machine-learning-models-in-r/
Hi Jason, In this post, it seems that you used all of the data in the dataset? Should we not divide it to Train/Test split before we run the train models and then we can validate that the summary of results we receive holds up with the new data?
Maybe I am missing something
We are using k-fold cross validation which is a less biased way for estimating model skill on unseen data.
Hi Jason,
fit.rf <- train(diabetes~., data=dataset, method="rf", metric=metric, trControl=control)
what algorithm is needed so that I can find out the details of the number of trees generated in that process ?
It will use the default number of trees, which might be 100 from memory. You can check with the rf package.
Hi Jason,
I’m split my imbalanced data to training and testing, then I use the training data with kfold validation to optimize my model for imbalanced class besides Im using kfold validation to optimize my balanced class (after handling imbalanced class). my question is, why my accuracy in final model imbalanced class has low accuracy than the balanced class ( I use data testing with those final model to evaluate) ?
thankyou
I would recommend not using accuracy as a measure for imbalanced data as it will not meaningfully report the skill of the model.
Perhaps you can use AUC, logloss, kappa or F1?
Hi Jason,
if I measure the evaluation result using F1 for final model and test data I do not need to see the proportion of the test data? why ?
Sorry, I don’t follow. Perhaps you can restate your question?
Hi Jason,
Can you please have any idea in machine learning classification with multi series? thanks
Neural nets might be a good place to start for multiple time series as input and/or output.
Hello sir
How could i estimate running time of different classifier??
To make predictions? Why would you want to time predictions?
Most classifiers make predictions very efficiently.
You could time training, but training is a one-off activity in general.
Hi Jason,
when I perform rf algorithm, why displayed this error message
Error: Metric Kappa not applicable for regression models
Kappa is for classification and you are trying it for a regression problem.
This is incredibly helpful, thank you.
This may be a silly question, and I apologize if it is, but: if I use repeated cross validation, do I need to run my model on only the training subset of my data and then use the model to predict the test data, or can I just run the model with the entire data set? In other worse, does repeated cv ‘take care’ of the resampling such that I don’t need to partition my data? And then I’d evaluate predictive accuracy with a function like confusionMatrix?
Also, if my outcome variable has 3 levels, one of which only corresponds to ~ 10% of my observations, that’s a problem, right?
Thank you again!!
CV is used with the entire dataset.
Model skill will be an average score across folds and repeats such as accuracy.
Hi Jason ,
I have one question . how to check accuracy indepedently for each model . Please let me know .
for example:
fit.lda <- train(diabetes~., data=dataset, method="lm", metric=metric, preProc=c("center", "scale"), trControl=control)
linear egression
As you list.
Greetings. Thank you for the tutorial. I have two questions.
In train, we use all dataset? like this:
fit <- train(alldata[,-38], alldata[,38],method = "rpart",trControl = trainControl(method = "LOOCV"),parms = list(split = "information"))
The other problem is: how to evaluate accuracy?
Way 1: Print fit, one accuracy can be seen.
Way 2:
pred <- predict(fit,newdata=alldata[,-38])
confusionMatrix(fit2pred,x$Abandonou) #get accuracy from here?
What is the right form to get accuracy, kappa, confusion matrix from trained models in R?
Yes.
The mean accuracy is reported.
You can use other metrics, the documentation explains more:
http://topepo.github.io/caret/index.html
Thank you… I learn a lot from this website ….I have a question do you tell me how to use 2 machine learning algorithm together for training a model
In what way exactly? An ensemble?
Hi Jason,
Thanks for the above.
How do you suggest to determine the accuracy of your model once using test data?
I know how to calculate rsquared for the fit model but I’m finding it difficult to work out for the test data once values are predicted.
My model is continuous (regression)
Thanks
It shows error as i use it for a classification problem