Machine learning can be applied to time series datasets.
These are problems where a numeric or categorical value must be predicted, but the rows of data are ordered by time.
A problem when getting started in time series forecasting with machine learning is finding good quality standard datasets on which to practice.
In this post, you will discover 8 standard time series datasets that you can use to get started and practice time series forecasting with machine learning.
After reading this post, you will know:
4 univariate time series datasets.
3 multivariate time series datasets.
Websites that you can use to search and download more datasets.
Kick-start your project with my new book Time Series Forecasting With Python, including step-by-step tutorials and the Python source code files for all examples.
Let’s get started.
Updated Apr/2019: Updated the links to the datasets.
Univariate Time Series Datasets
Time series datasets that only have one variable are called univariate datasets.
These datasets are a great place to get started because:
They are so simple and easy to understand.
You can plot them easily in excel or your favorite plotting tool.
You can easily plot the predictions compared to the expected results.
You can quickly try and evaluate a suite of traditional and newer methods.
There are many sources of time series dataset, such as the “Time Series Data Library” created by Rob Hyndman, Professor of Statistics at Monash University, Australia
Below are 4 univariate time series datasets that you can download from a range of fields such as Sales, Meteorology, Physics and Demography.
Stop learning Time Series Forecasting the slow way!
Take my free 7-day email course and discover how to get started (with sample code).
Click to sign-up and also get a free PDF Ebook version of the course.
Shampoo Sales Dataset
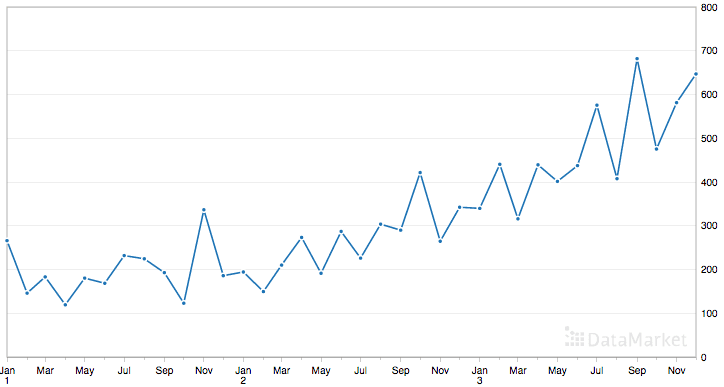
This dataset describes the monthly number of sales of shampoo over a 3 year period.
The units are a sales count and there are 36 observations. The original dataset is credited to Makridakis, Wheelwright and Hyndman (1998).
Below is a sample of the first 5 rows of data including the header row.
1
2
3
4
5
6
"Month","Sales of shampoo over a three year period"
"1-01",266.0
"1-02",145.9
"1-03",183.1
"1-04",119.3
"1-05",180.3
Below is a plot of the entire dataset.
Shampoo Sales Dataset
The dataset shows an increasing trend and possibly some seasonal component.
At the time of writing, there are 63 time series datasets that you can download for free and work with.
Below is a selection of 3 recommended multivariate time series datasets from Meteorology, Medicine and Monitoring domains.
EEG Eye State Dataset
This dataset describes EEG data for an individual and whether their eyes were open or closed. The objective of the problem is to predict whether eyes are open or closed given EEG data alone.
The objective of the problem is to predict whether eyes are open or closed given EEG data alone.
This is a classification predictive modeling problems and there are a total of 14,980 observations and 15 input variables. The class value of ‘1’ indicates the eye-closed and ‘0’ the eye-open state. Data is ordered by time and observations were recorded over a period of 117 seconds.
Data is ordered by time and observations were recorded over a period of 117 seconds.
Below is a sample of the first 5 rows with no header row.
This dataset describes measurements of a room and the objective is to predict whether or not the room is occupied.
There are 20,560 one-minute observations taken over the period of a few weeks. This is a classification prediction problem. There are 7 attributes including various light and climate properties of the room.
The source for the data is credited to Luis Candanedo from UMONS.
Below is a sample of the first 5 rows of data including the header row.
This dataset describes 6 years of ground ozone concentration observations and the objective is to predict whether it is an “ozone day” or not.
The dataset contains 2,536 observations and 73 attributes. This is a classification prediction problem and the final attribute indicates the class value as “1” for an ozone day and “0” for a normal day.
Two versions of the data are provided, eight-hour peak set and one-hour peak set. I would suggest using the one hour peak set for now.
Below is a sample of the first 5 rows with no header row.
In this post, you discovered a suite of standard time series forecast datasets that you can use to get started and practice time series forecasting with machine learning methods.
Specifically, you learned about:
4 univariate time series forecasting datasets.
3 multivariate time series forecasting datasets.
Two websites where you can download many more datasets.
Did you use one of the above datasets in your own project?
Share your findings in the comments below.
Want to Develop Time Series Forecasts with Python?
Hey there, great tutorial! I need your help:
I have to make a weather forecasting project for my college. It has to be based on a time series dataset I guess. But I’m having a difficult time trying to get a suitable multivariate dataset, also I would like to ask you for an ML model to use in this kind of problem. I will appreciate any resource you could provide me.
I my work on weather dataset there are 4 classes clear, partially cloud , overcast,rain .
And I use lstm model . Which lstm model I use for multi classes classification.
I recommend trying a few different model architectures and compare results to classical ML models in order to discover what works well for your specific dataset.
Hi Jason,
many thanks for your article, I found usefull datset.
I did not find any dataset on UCI about temperature and energy consumption inside a building, I was wondering if you could help me in some way.
I hope to hear from you soon
I have a multivariate-dataset with observations from day 1 to 49 for each of the almost 30 patients. The end result is whether the patient has PTSD (1) or not ( 0 ). Please suggest how am I supposed to approach this problem in terms of data pre-processing.
any sample code in python or C for time series ie preparing data via pandas(separating needed columns),analysing same for training,preparing model,training the model,applying same on test data…..
Please excuse me incase I have requesting anything wrong.
Hi, I am trying to create a model that uses past data (sales volume + weather condition for example) to predict the 5 next day of sales volume but I would like to use weather prediction of the next 5 days also to forecast the volumes.
Can you tell me about the model to use (I guess RNN) and how to build my dataset.
Hi Jason,
My question may come to you a bit weird so that i beg your pardon in advance. I am working on short term load forecasting. As i know AEMO opens data about electricity. I can access the half-hourly load demand of past years(from 2006 through 2018) however i cannot access the half-hourly weather data(temperature and bulb) of Australian regions(QSL,VIC,NSW etc). I will make comparative analysis with journal papers so that i am looking for these data and authors of some papers did not shared their AEMO data yet. How can i get or find these data?Can you direct me on this issue?
I have a data set of shipping cost per day (in on year), however, not every day has a shipping cost. What’s the best we to deal with missing daily cost in order to make a Time Series analysis?
Do you think multivariate time series can take advantage of CNNs?
Can you combine CNNs with LSTMs?
How would you build a time series autoencoder for where each instant has 30 variables?
Multivariate datasets are generally more challenging as you said. How to apply neural network algorithm on these datasets in WEKA? I am doing something wrong as I am getting the same result for yearly/monthly/weekly datasets. Please guide.
Yes, I found a way. We can use the Overlay for training and test data using the advance configuration in time series package. We can set the single or multiple dependent parameters in overlay. While using overlay, data set is separated automatically in training and test data as per the values we have set in Evaluation tab.
Is it mandatory to convert the text file into a csv file and then into a pandas dataframe for further work? Or does it provide conflict if it is not done?
Thank you for the wonderful post. I have a dataset, similar to Occupancy Detection Dataset, which you have described above.
1. Can we apply LSTMs, CNNs on these data?
2. Are these kind of data count under multivariate time series data? What I have understood till now, in time-series data there is a sequence in the rows and columns i.e. we can’t move any columns and any rows since time-series data have a sequence.
3. What kind of models can we apply to such a problem?
I deal with system and application monitoring data a lot. I am looking for production ready software that would help me store data in Timeseries Database and apply predictive analytics (RNN, S/ARIMA) continuously. I see there are couple of cool libraries like TICK stack, LoudML and Facebook prophet.
Any tutorial would be great demonstrating the deployment of such continuous predictive system.
Is there is any solution to handle 3d data with a “traditional” ML solution?
For example, if I have a time series generated with 1000 users. In this scenario, we have 1000x time series. How can I make a generalized Varmax or Arimax model for every user, if I don’t want to use LSTM ?
I have a dataset with columns as follows “Account Jan Feb Mar Q1 Apr May Jun Q2 Jul Aug Sep Q3 Oct Nov Dec Q4 YearTotal Year”
How am i suppose to consume this data for forecasting model as my month columns dont have any dates to them instead they have the sales figures for each account. Eg.
Account jan feb march Q1 Year
Revision 267829.5 279052.45 260298.54 807180.49 2019
My aim is to predict the Q3 and Q4 for the year 2020.
I saw to your persistence model which you have used on shampoo and monthly car sales data. They both are univariate datasets in my case i have multivariate, can you please suggest how to approach mulivariate.
How to do time series by considering 3 to 5 columns and predict. If there is a way i can share some sample with you, if so do suggest.
What I would like to ask is this, I have a time series historical data. It is daily sales data however, I have different product id’s. For example, I have 3 different dates for product 1, but I have 8 different dates for product 2.
I am expected to build an algorithm to forecast the sales of any product for next day.
How should I proceed?
Hi! you may want to ctrl+f “At the time of writing, there are” and find that you left this sentence twice in a row. Thanks for the article! it helped me find a dataset I needed.
Jason, can you help us to understand FourierFeaturizer and how interpret it from pmdarima python package. I wanted to use it to forecast seasonal data with long seasonal periods.
Hey Jason, the examples in this article look great! I’m actually looking for a signal processing dataset to apply time series modelling for a project. Could you suggest any open source datasets in this context?
I have satellite time series (multivariate-dataset) with images from day 1 to 10 with almost 7 classes . Please suggest how am I supposed to approach this problem in terms of data augmentation
I have a GPS dataset (latitude, longitude, timestamp) as a dataset. Each track (series of GPS points) of a participant is compared with another participant who walks on the same track. I want to do time series classification on this data, which kind of data can this be?
i am working with time series about education in my AI thesis project. the values are by year from 2013 to 2021, so i have nine records. i think it is a small dataset for a PHD, what do you think ?? Any suggestions ??
Hello!
Thanks for your post.
Can I get the reference about where datasets on the post came from?
I want to get more about each dataset.
Are they from ““Time Series Data Library” created by Rob Hyndman, Professor of Statistics at Monash University, Australia” as you said in the first part on the post as below?
“There are many sources of time series dataset, such as the “Time Series Data Library” created by Rob Hyndman, Professor of Statistics at Monash University, Australia”
Hi Hanson…each dataset contains a link that you can follow as the source. Also, in some cases the author’s name is provided so that you can perform a search on the author and the datasets they have published.
Hi Hanson…each dataset contains a link that you can follow as the source. Also, in some cases the author’s name is provided so that you can perform a search on the author and the datasets they have published.
Hi Hanson…each dataset contains a link that you can follow as the source. Also, in some cases the author’s name is provided so that you can perform a search on the author and the datasets they have published.

")


Hey there, great tutorial! I need your help:
I have to make a weather forecasting project for my college. It has to be based on a time series dataset I guess. But I’m having a difficult time trying to get a suitable multivariate dataset, also I would like to ask you for an ML model to use in this kind of problem. I will appreciate any resource you could provide me.
Consider your government’s meteorological organization. Most give data freely.
Hi, I am looking for industrial time series datasets. Any suggestions.. Thanks.
What is wrong with the examples in this post?
I my work on weather dataset there are 4 classes clear, partially cloud , overcast,rain .
And I use lstm model . Which lstm model I use for multi classes classification.
I recommend trying a few different model architectures and compare results to classical ML models in order to discover what works well for your specific dataset.
Hi Jason,
many thanks for your article, I found usefull datset.
I did not find any dataset on UCI about temperature and energy consumption inside a building, I was wondering if you could help me in some way.
I hope to hear from you soon
Sorry, I’m not aware of such a dataset off-the-cuff.
I have a multivariate-dataset with observations from day 1 to 49 for each of the almost 30 patients. The end result is whether the patient has PTSD (1) or not ( 0 ). Please suggest how am I supposed to approach this problem in terms of data pre-processing.
Sounds like a sequence classification problem.
This post might give you some ideas:
https://machinelearningmastery.com/sequence-prediction/
LSTMs might be a good fit:
https://machinelearningmastery.com/start-here/#lstm
any sample code in python or C for time series ie preparing data via pandas(separating needed columns),analysing same for training,preparing model,training the model,applying same on test data…..
Please excuse me incase I have requesting anything wrong.
I have many examples, try searching on the blog.
Hi, I am trying to create a model that uses past data (sales volume + weather condition for example) to predict the 5 next day of sales volume but I would like to use weather prediction of the next 5 days also to forecast the volumes.
Can you tell me about the model to use (I guess RNN) and how to build my dataset.
Regards
I recommend following this process:
https://machinelearningmastery.com/how-to-develop-a-skilful-time-series-forecasting-model/
You can get code examples for multivariate input and multi-step output here:
https://machinelearningmastery.com/start-here/#deep_learning_time_series
Hi Jason,
My question may come to you a bit weird so that i beg your pardon in advance. I am working on short term load forecasting. As i know AEMO opens data about electricity. I can access the half-hourly load demand of past years(from 2006 through 2018) however i cannot access the half-hourly weather data(temperature and bulb) of Australian regions(QSL,VIC,NSW etc). I will make comparative analysis with journal papers so that i am looking for these data and authors of some papers did not shared their AEMO data yet. How can i get or find these data?Can you direct me on this issue?
My best advice is to contact the authors directly, and perhaps their advisors/colleagues?
I have a data set of shipping cost per day (in on year), however, not every day has a shipping cost. What’s the best we to deal with missing daily cost in order to make a Time Series analysis?
Perhaps start by filling the missing values with the mean/average values of the series?
I need to find data set and decompose for BTS for fault prediction from fault history
total donw time and 3 cell/ sector how it coud possible
Perhaps check on Kaggle?
Hi one. May I get your email address please? i’m also working on similar project
Do you think multivariate time series can take advantage of CNNs?
Can you combine CNNs with LSTMs?
How would you build a time series autoencoder for where each instant has 30 variables?
Yes and yes.
I have examples, perhaps start here:
https://machinelearningmastery.com/how-to-develop-convolutional-neural-network-models-for-time-series-forecasting/
And here:
https://machinelearningmastery.com/how-to-develop-lstm-models-for-time-series-forecasting/
Multivariate datasets are generally more challenging as you said. How to apply neural network algorithm on these datasets in WEKA? I am doing something wrong as I am getting the same result for yearly/monthly/weekly datasets. Please guide.
Good question.
There may be a way, I don’t have an example sorry.
Yes, I found a way. We can use the Overlay for training and test data using the advance configuration in time series package. We can set the single or multiple dependent parameters in overlay. While using overlay, data set is separated automatically in training and test data as per the values we have set in Evaluation tab.
Ohhhk… Thanks for your prompt reply Jason. I am rendering around it.
You’re welcome.
Hi jason,
Can you help me on how to convert a txt file to csv file?
Perhaps change the file extension from .txt to .csv?
Is it mandatory to convert the text file into a csv file and then into a pandas dataframe for further work? Or does it provide conflict if it is not done?
No, Pandas does not care about file extensions, only the content.
do anyone have a discreet dataset?
For time series, yes, there are some exampels of time series classification here:
https://machinelearningmastery.com/how-to-model-human-activity-from-smartphone-data/
Dear Jason,
Thank you for the wonderful post. I have a dataset, similar to Occupancy Detection Dataset, which you have described above.
1. Can we apply LSTMs, CNNs on these data?
2. Are these kind of data count under multivariate time series data? What I have understood till now, in time-series data there is a sequence in the rows and columns i.e. we can’t move any columns and any rows since time-series data have a sequence.
3. What kind of models can we apply to such a problem?
Regards,
Aashish
Perhaps try a suite of algorithms and compare results.
Yes, multivariate inputs. More on the types of time series problems here:
https://machinelearningmastery.com/taxonomy-of-time-series-forecasting-problems/
Hey Jason, Great Post.
I deal with system and application monitoring data a lot. I am looking for production ready software that would help me store data in Timeseries Database and apply predictive analytics (RNN, S/ARIMA) continuously. I see there are couple of cool libraries like TICK stack, LoudML and Facebook prophet.
Any tutorial would be great demonstrating the deployment of such continuous predictive system.
Best Regards,
Rajesh
Thanks.
Great suggestion!
Hi Jason,
Where can I get information about RNN or LSTM time series prediction datasets that need improvements, for example in terms of accuracy?
We minimize error for time series, not accuracy.
What do you mean by “need improvement”?
If you want to solve real problems where people care about the outcome, perhaps start with kaggle or take on some consulting work?
Hi there,
Is there is any solution to handle 3d data with a “traditional” ML solution?
For example, if I have a time series generated with 1000 users. In this scenario, we have 1000x time series. How can I make a generalized Varmax or Arimax model for every user, if I don’t want to use LSTM ?
You can transform the dataset into a supervised learning problem and test a suite of standard ml algorithms:
https://machinelearningmastery.com/time-series-forecasting-supervised-learning/
And here:
https://machinelearningmastery.com/convert-time-series-supervised-learning-problem-python/
Thank you!
You’re welcome.
Hi there.
Do we categorize GPS trajectories as Univariate Time Series?
Perhaps start by assigning categories to your sequences first, then explore modeling it as a time series classification task.
The tutorials here will help:
https://machinelearningmastery.com/start-here/#deep_learning_time_series
can u post some thing like “How to prepare time series dataset for machine learning” that are implemented using sklearn
I have many such tutorials, perhaps start here:
https://machinelearningmastery.com/machine-learning-data-transforms-for-time-series-forecasting/
Hi,
My data is in the format timestamp, no of customers. I want to convert it into an hourly time series. How should I do that?
It really depends on your data, sorry, I cannot give better advice than that.
Hi Jason,
I have a dataset with columns as follows “Account Jan Feb Mar Q1 Apr May Jun Q2 Jul Aug Sep Q3 Oct Nov Dec Q4 YearTotal Year”
How am i suppose to consume this data for forecasting model as my month columns dont have any dates to them instead they have the sales figures for each account. Eg.
Account jan feb march Q1 Year
Revision 267829.5 279052.45 260298.54 807180.49 2019
My aim is to predict the Q3 and Q4 for the year 2020.
Please give your thoughts.
Perhaps start with a persistence model, then move on to evaluate a suite of models in order to discover what works well or best for your dataset.
I saw to your persistence model which you have used on shampoo and monthly car sales data. They both are univariate datasets in my case i have multivariate, can you please suggest how to approach mulivariate.
How to do time series by considering 3 to 5 columns and predict. If there is a way i can share some sample with you, if so do suggest.
Yes, the tutorials here will get you started with multivariate time series forecasting:
https://machinelearningmastery.com/start-here/#deep_learning_time_series
Hi Jason,
What I would like to ask is this, I have a time series historical data. It is daily sales data however, I have different product id’s. For example, I have 3 different dates for product 1, but I have 8 different dates for product 2.
I am expected to build an algorithm to forecast the sales of any product for next day.
How should I proceed?
e.g.
productid date soldquantity
1 23.11.2018 0
21 30.11.2018 0
21 27.12.2018 0
21 9.01.2019 0
21 18.12.2018 0
21 5.01.2019 0
21 7.01.2019 0
21 31.12.2018 0
21 26.12.2018 0
21 25.12.2018 0
21 10.01.2019 0
31 1.12.2018 0
31 19.11.2018 0
31 11.11.2018 0
31 27.11.2018 0
31 22.11.2018 0
I would expect each product id is a separate series.
You can use a machine learning or deep learning model to learn per product or across products.
Hi again. Thanks for the quick answer.
I considered taking all products as a seperate series, however I have more than 10 thousand products.
Which machine learning method could be used? I am very new at this.
I recommend starting with linear models like linear regression or SARIMA then move on to more advanced methods and see if they offer a benefit.
This framework will help:
https://machinelearningmastery.com/how-to-develop-a-skilful-time-series-forecasting-model/
Hi! you may want to ctrl+f “At the time of writing, there are” and find that you left this sentence twice in a row. Thanks for the article! it helped me find a dataset I needed.
Thanks, fixed!
Jason, can you help us to understand FourierFeaturizer and how interpret it from pmdarima python package. I wanted to use it to forecast seasonal data with long seasonal periods.
Regular approach is taking good amount of time . so based https://robjhyndman.com/hyndsight/longseasonality/ exploring the usage of FourierFeaturizer.
Thank you for the suggestion.
Hey Jason, the examples in this article look great! I’m actually looking for a signal processing dataset to apply time series modelling for a project. Could you suggest any open source datasets in this context?
Thanks.
This may help:
https://machinelearningmastery.com/faq/single-faq/where-can-i-get-a-dataset-on-___/
I have satellite time series (multivariate-dataset) with images from day 1 to 10 with almost 7 classes . Please suggest how am I supposed to approach this problem in terms of data augmentation
Perhaps you can use a pre-trained model with a custom CNN-LSTM type architecture.
Hello Jason,
I have a GPS dataset (latitude, longitude, timestamp) as a dataset. Each track (series of GPS points) of a participant is compared with another participant who walks on the same track. I want to do time series classification on this data, which kind of data can this be?
Thank you
That sounds like a great project. It is time series classification, try a suite of models and discover what works well or best for your data.
i am working with time series about education in my AI thesis project. the values are by year from 2013 to 2021, so i have nine records. i think it is a small dataset for a PHD, what do you think ?? Any suggestions ??
9 records probably can’t help you go too far, but it should be a good start.
Hello !
Brother can you provide Supply chain multi mode(Air, Truck, ocean etc) travel time prediction dataset.
Hello !
Brother can you provide Supply chain multi mode(Air, Truck, ocean etc) travel time prediction dataset.
I will be very thankful !
Hi Sham…I do not have such a dataset. You may want to check Kaggle or StackOverflow.
Hello!
Thanks for your post.
Can I get the reference about where datasets on the post came from?
I want to get more about each dataset.
Are they from ““Time Series Data Library” created by Rob Hyndman, Professor of Statistics at Monash University, Australia” as you said in the first part on the post as below?
“There are many sources of time series dataset, such as the “Time Series Data Library” created by Rob Hyndman, Professor of Statistics at Monash University, Australia”
Hi Hanson…each dataset contains a link that you can follow as the source. Also, in some cases the author’s name is provided so that you can perform a search on the author and the datasets they have published.
Additional comment:
I read there is some description about the source, such as
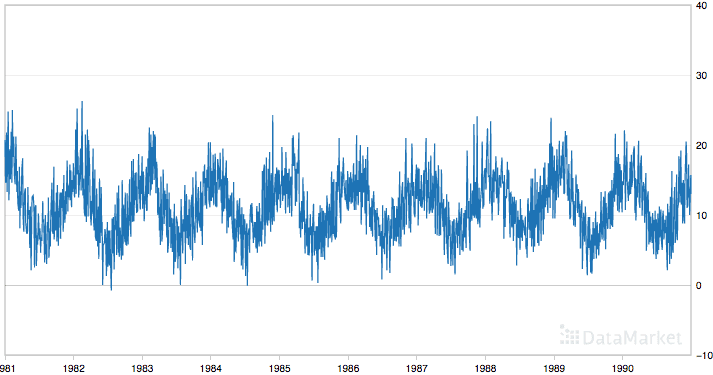
“The source of the data is credited as the Australian Bureau of Meteorology.” for Minimum Daily Temperatures Dataset.
But could you let me know how to get the source of the data in detail?
Thank you!
Hi Hanson…each dataset contains a link that you can follow as the source. Also, in some cases the author’s name is provided so that you can perform a search on the author and the datasets they have published.
Additional comment:
I read the part about where the source data was such as
“The source of the data is credited as the Australian Bureau of Meteorology.” for Minimum Daily Temperatures Dataset.
But could you let me know how I can get the data through Australian Bureau of Meteorology in detail?
Thank you!
Hi Hanson…each dataset contains a link that you can follow as the source. Also, in some cases the author’s name is provided so that you can perform a search on the author and the datasets they have published.