Reducing the number of input variables for a predictive model is referred to as dimensionality reduction.
Fewer input variables can result in a simpler predictive model that may have better performance when making predictions on new data.
Perhaps the most popular technique for dimensionality reduction in machine learning is Principal Component Analysis, or PCA for short. This is a technique that comes from the field of linear algebra and can be used as a data preparation technique to create a projection of a dataset prior to fitting a model.
In this tutorial, you will discover how to use PCA for dimensionality reduction when developing predictive models.
After completing this tutorial, you will know:
- Dimensionality reduction involves reducing the number of input variables or columns in modeling data.
- PCA is a technique from linear algebra that can be used to automatically perform dimensionality reduction.
- How to evaluate predictive models that use a PCA projection as input and make predictions with new raw data.
Kick-start your project with my new book Data Preparation for Machine Learning, including step-by-step tutorials and the Python source code files for all examples.
Let’s get started.
- Update May/2020: Improved code commenting.

Principal Components Analysis for Dimensionality Reduction in Python
Photo by Forest Service, USDA, some rights reserved.
Tutorial Overview
This tutorial is divided into three parts; they are:
- Dimensionality Reduction and PCA
- PCA Scikit-Learn API
- Worked Example of PCA for Dimensionality Reduction
Dimensionality Reduction and PCA
Dimensionality reduction refers to reducing the number of input variables for a dataset.
If your data is represented using rows and columns, such as in a spreadsheet, then the input variables are the columns that are fed as input to a model to predict the target variable. Input variables are also called features.
We can consider the columns of data representing dimensions on an n-dimensional feature space and the rows of data as points in that space. This is a useful geometric interpretation of a dataset.
In a dataset with k numeric attributes, you can visualize the data as a cloud of points in k-dimensional space …
— Page 305, Data Mining: Practical Machine Learning Tools and Techniques, 4th edition, 2016.
Having a large number of dimensions in the feature space can mean that the volume of that space is very large, and in turn, the points that we have in that space (rows of data) often represent a small and non-representative sample.
This can dramatically impact the performance of machine learning algorithms fit on data with many input features, generally referred to as the “curse of dimensionality.”
Therefore, it is often desirable to reduce the number of input features. This reduces the number of dimensions of the feature space, hence the name “dimensionality reduction.”
A popular approach to dimensionality reduction is to use techniques from the field of linear algebra. This is often called “feature projection” and the algorithms used are referred to as “projection methods.”
Projection methods seek to reduce the number of dimensions in the feature space whilst also preserving the most important structure or relationships between the variables observed in the data.
When dealing with high dimensional data, it is often useful to reduce the dimensionality by projecting the data to a lower dimensional subspace which captures the “essence” of the data. This is called dimensionality reduction.
— Page 11, Machine Learning: A Probabilistic Perspective, 2012.
The resulting dataset, the projection, can then be used as input to train a machine learning model.
In essence, the original features no longer exist and new features are constructed from the available data that are not directly comparable to the original data, e.g. don’t have column names.
Any new data that is fed to the model in the future when making predictions, such as test dataset and new datasets, must also be projected using the same technique.
Principal Component Analysis, or PCA, might be the most popular technique for dimensionality reduction.
The most common approach to dimensionality reduction is called principal components analysis or PCA.
— Page 11, Machine Learning: A Probabilistic Perspective, 2012.
It can be thought of as a projection method where data with m-columns (features) is projected into a subspace with m or fewer columns, whilst retaining the essence of the original data.
The PCA method can be described and implemented using the tools of linear algebra, specifically a matrix decomposition like an Eigendecomposition or SVD.
PCA can be defined as the orthogonal projection of the data onto a lower dimensional linear space, known as the principal subspace, such that the variance of the projected data is maximized
— Page 561, Pattern Recognition and Machine Learning, 2006.
For more information on how PCA is calculated in detail, see the tutorial:
Now that we are familiar with PCA for dimensionality reduction, let’s look at how we can use this approach with the scikit-learn library.
Want to Get Started With Data Preparation?
Take my free 7-day email crash course now (with sample code).
Click to sign-up and also get a free PDF Ebook version of the course.
PCA Scikit-Learn API
We can use PCA to calculate a projection of a dataset and select a number of dimensions or principal components of the projection to use as input to a model.
The scikit-learn library provides the PCA class that can be fit on a dataset and used to transform a training dataset and any additional dataset in the future.
For example:
|
1 2 3 4 5 6 7 8 |
... data = ... # define transform pca = PCA() # prepare transform on dataset pca.fit(data) # apply transform to dataset transformed = pca.transform(data) |
The outputs of the PCA can be used as input to train a model.
Perhaps the best approach is to use a Pipeline where the first step is the PCA transform and the next step is the learning algorithm that takes the transformed data as input.
|
1 2 3 4 |
... # define the pipeline steps = [('pca', PCA()), ('m', LogisticRegression())] model = Pipeline(steps=steps) |
It can also be a good idea to normalize data prior to performing the PCA transform if the input variables have differing units or scales; for example:
|
1 2 3 4 |
... # define the pipeline steps = [('norm', MinMaxScaler()), ('pca', PCA()), ('m', LogisticRegression())] model = Pipeline(steps=steps) |
Now that we are familiar with the API, let’s look at a worked example.
Worked Example of PCA for Dimensionality Reduction
First, we can use the make_classification() function to create a synthetic binary classification problem with 1,000 examples and 20 input features, 15 inputs of which are meaningful.
The complete example is listed below.
|
1 2 3 4 5 6 |
# test classification dataset from sklearn.datasets import make_classification # define dataset X, y = make_classification(n_samples=1000, n_features=20, n_informative=15, n_redundant=5, random_state=7) # summarize the dataset print(X.shape, y.shape) |
Running the example creates the dataset and summarizes the shape of the input and output components.
|
1 |
(1000, 20) (1000,) |
Next, we can use dimensionality reduction on this dataset while fitting a logistic regression model.
We will use a Pipeline where the first step performs the PCA transform and selects the 10 most important dimensions or components, then fits a logistic regression model on these features. We don’t need to normalize the variables on this dataset, as all variables have the same scale by design.
The pipeline will be evaluated using repeated stratified cross-validation with three repeats and 10 folds per repeat. Performance is presented as the mean classification accuracy.
The complete example is listed below.
|
1 2 3 4 5 6 7 8 9 10 11 12 13 14 15 16 17 18 19 |
# evaluate pca with logistic regression algorithm for classification from numpy import mean from numpy import std from sklearn.datasets import make_classification from sklearn.model_selection import cross_val_score from sklearn.model_selection import RepeatedStratifiedKFold from sklearn.pipeline import Pipeline from sklearn.decomposition import PCA from sklearn.linear_model import LogisticRegression # define dataset X, y = make_classification(n_samples=1000, n_features=20, n_informative=15, n_redundant=5, random_state=7) # define the pipeline steps = [('pca', PCA(n_components=10)), ('m', LogisticRegression())] model = Pipeline(steps=steps) # evaluate model cv = RepeatedStratifiedKFold(n_splits=10, n_repeats=3, random_state=1) n_scores = cross_val_score(model, X, y, scoring='accuracy', cv=cv, n_jobs=-1, error_score='raise') # report performance print('Accuracy: %.3f (%.3f)' % (mean(n_scores), std(n_scores))) |
Running the example evaluates the model and reports the classification accuracy.
Note: Your results may vary given the stochastic nature of the algorithm or evaluation procedure, or differences in numerical precision. Consider running the example a few times and compare the average outcome.
In this case, we can see that the PCA transform with logistic regression achieved a performance of about 81.8 percent.
|
1 |
Accuracy: 0.816 (0.034) |
How do we know that reducing 20 dimensions of input down to 10 is good or the best we can do?
We don’t; 10 was an arbitrary choice.
A better approach is to evaluate the same transform and model with different numbers of input features and choose the number of features (amount of dimensionality reduction) that results in the best average performance.
The example below performs this experiment and summarizes the mean classification accuracy for each configuration.
|
1 2 3 4 5 6 7 8 9 10 11 12 13 14 15 16 17 18 19 20 21 22 23 24 25 26 27 28 29 30 31 32 33 34 35 36 37 38 39 40 41 42 43 44 45 |
# compare pca number of components with logistic regression algorithm for classification from numpy import mean from numpy import std from sklearn.datasets import make_classification from sklearn.model_selection import cross_val_score from sklearn.model_selection import RepeatedStratifiedKFold from sklearn.pipeline import Pipeline from sklearn.decomposition import PCA from sklearn.linear_model import LogisticRegression from matplotlib import pyplot # get the dataset def get_dataset(): X, y = make_classification(n_samples=1000, n_features=20, n_informative=15, n_redundant=5, random_state=7) return X, y # get a list of models to evaluate def get_models(): models = dict() for i in range(1,21): steps = [('pca', PCA(n_components=i)), ('m', LogisticRegression())] models[str(i)] = Pipeline(steps=steps) return models # evaluate a given model using cross-validation def evaluate_model(model, X, y): cv = RepeatedStratifiedKFold(n_splits=10, n_repeats=3, random_state=1) scores = cross_val_score(model, X, y, scoring='accuracy', cv=cv, n_jobs=-1, error_score='raise') return scores # define dataset X, y = get_dataset() # get the models to evaluate models = get_models() # evaluate the models and store results results, names = list(), list() for name, model in models.items(): scores = evaluate_model(model, X, y) results.append(scores) names.append(name) print('>%s %.3f (%.3f)' % (name, mean(scores), std(scores))) # plot model performance for comparison pyplot.boxplot(results, labels=names, showmeans=True) pyplot.xticks(rotation=45) pyplot.show() |
Running the example first reports the classification accuracy for each number of components or features selected.
Note: Your results may vary given the stochastic nature of the algorithm or evaluation procedure, or differences in numerical precision. Consider running the example a few times and compare the average outcome.
We see a general trend of increased performance as the number of dimensions is increased. On this dataset, the results suggest a trade-off in the number of dimensions vs. the classification accuracy of the model.
Interestingly, we don’t see any improvement beyond 15 components. This matches our definition of the problem where only the first 15 components contain information about the class and the remaining five are redundant.
|
1 2 3 4 5 6 7 8 9 10 11 12 13 14 15 16 17 18 19 20 |
>1 0.542 (0.048) >2 0.713 (0.048) >3 0.720 (0.053) >4 0.723 (0.051) >5 0.725 (0.052) >6 0.730 (0.046) >7 0.805 (0.036) >8 0.800 (0.037) >9 0.814 (0.036) >10 0.816 (0.034) >11 0.819 (0.035) >12 0.819 (0.038) >13 0.819 (0.035) >14 0.853 (0.029) >15 0.865 (0.027) >16 0.865 (0.027) >17 0.865 (0.027) >18 0.865 (0.027) >19 0.865 (0.027) >20 0.865 (0.027) |
A box and whisker plot is created for the distribution of accuracy scores for each configured number of dimensions.
We can see the trend of increasing classification accuracy with the number of components, with a limit at 15.
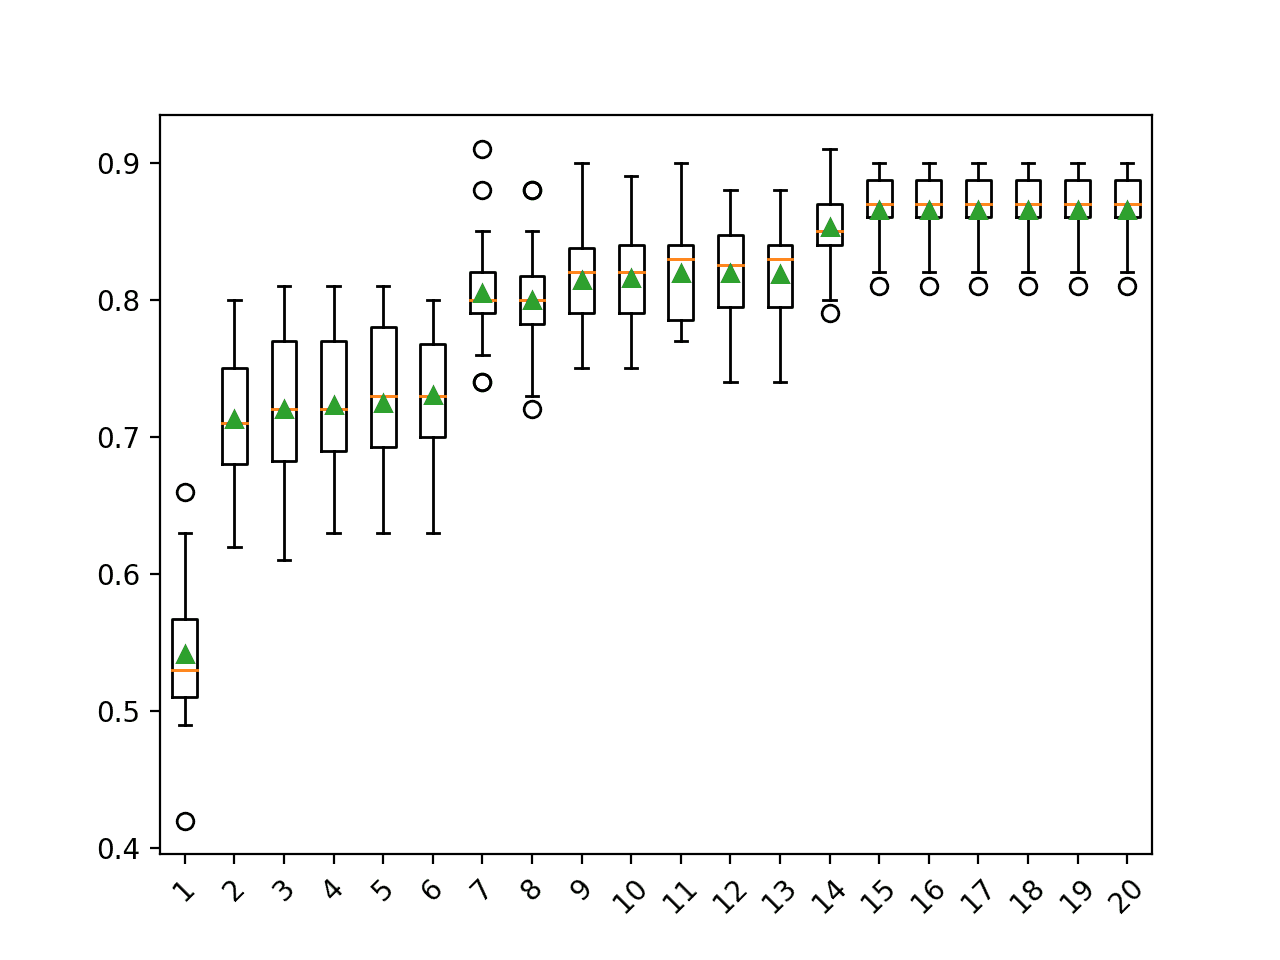
Box Plot of PCA Number of Components vs. Classification Accuracy
We may choose to use a PCA transform and logistic regression model combination as our final model.
This involves fitting the Pipeline on all available data and using the pipeline to make predictions on new data. Importantly, the same transform must be performed on this new data, which is handled automatically via the Pipeline.
The example below provides an example of fitting and using a final model with PCA transforms on new data.
|
1 2 3 4 5 6 7 8 9 10 11 12 13 14 15 16 |
# make predictions using pca with logistic regression from sklearn.datasets import make_classification from sklearn.pipeline import Pipeline from sklearn.decomposition import PCA from sklearn.linear_model import LogisticRegression # define dataset X, y = make_classification(n_samples=1000, n_features=20, n_informative=15, n_redundant=5, random_state=7) # define the model steps = [('pca', PCA(n_components=15)), ('m', LogisticRegression())] model = Pipeline(steps=steps) # fit the model on the whole dataset model.fit(X, y) # make a single prediction row = [[0.2929949,-4.21223056,-1.288332,-2.17849815,-0.64527665,2.58097719,0.28422388,-7.1827928,-1.91211104,2.73729512,0.81395695,3.96973717,-2.66939799,3.34692332,4.19791821,0.99990998,-0.30201875,-4.43170633,-2.82646737,0.44916808]] yhat = model.predict(row) print('Predicted Class: %d' % yhat[0]) |
Running the example fits the Pipeline on all available data and makes a prediction on new data.
Here, the transform uses the 15 most important components from the PCA transform, as we found from testing above.
A new row of data with 20 columns is provided and is automatically transformed to 15 components and fed to the logistic regression model in order to predict the class label.
|
1 |
Predicted Class: 1 |
Further Reading
This section provides more resources on the topic if you are looking to go deeper.
Tutorials
Books
- Machine Learning: A Probabilistic Perspective, 2012.
- Data Mining: Practical Machine Learning Tools and Techniques, 4th edition, 2016.
- Pattern Recognition and Machine Learning, 2006.
APIs
- Decomposing signals in components (matrix factorization problems), scikit-learn.
- sklearn.decomposition.PCA API.
- sklearn.pipeline.Pipeline API.
Articles
- Dimensionality reduction, Wikipedia.
- Curse of dimensionality, Wikipedia.
- Principal component analysis, Wikipeida.
Summary
In this tutorial, you discovered how to use PCA for dimensionality reduction when developing predictive models.
Specifically, you learned:
- Dimensionality reduction involves reducing the number of input variables or columns in modeling data.
- PCA is a technique from linear algebra that can be used to automatically perform dimensionality reduction.
- How to evaluate predictive models that use a PCA projection as input and make predictions with new raw data.
Do you have any questions?
Ask your questions in the comments below and I will do my best to answer.
Get a Handle on Modern Data Preparation!

Prepare Your Machine Learning Data in Minutes
...with just a few lines of python code
Discover how in my new Ebook:
Data Preparation for Machine Learning
It provides self-study tutorials with full working code on:
Feature Selection, RFE, Data Cleaning, Data Transforms, Scaling, Dimensionality Reduction,
and much more...
 from Scratch in Python")


Hello
Can we call PCA a feature selection method.
I wouldn’t call it “selection” because, instead of selecting from the original set of features, PCA transforms the original features into new feature space such that new features possess a bit of information from ALL of the original features. So “feature transformation” is the exact term.
Agreed.
It is more accurate to refer to it as dimensionality reduction. It does not select features, it selects a projection.
I would say “sometimes”. If you look at the how much of the variability is explained by the top principal components and that is surprising based on what you thought about the feature space, it can be a prompt to go back and examine your feature space. I’ve certainly had PCA results that were surprising and caused me to go back and look at the features.
One of my go-to tools for feature selection is Recursive Feature Elimination (RFE) and the sklearn implementation of RFE is great for python tool users.
Would love to hear what others thing on the “PCA for feature selection” question.
PCA is a projection of the raw data, not a feature selection method – in my head at least.
I’m a massive fan of RFE.
I assume little/nothing on a project and enumerate all the methods that I can think of to create different “views” or perspectives on the raw data, throw it at models and see what comes out. Helps me learn a lot very quickly about how to best expose the structure of the problem to the learning algorithms. Not PCA specific, but it might help…
Agreed. If the number of indep vars isn’t too big, I almost always start with scatter plots, some kind of clustering to see what relationships might show up, PCA and look at what the transformed space looks like, how much variability is in the top 4-6 principle components.
If you have a really big dimensionality reduction challenge, one of my colleagues has had some interesting success with t-SNE.
Nice!
I used to love sammons mapping about 20 years ago, and kononen som for, back then, what used to be considered high-dimensionality. Projections get really fun 🙂
How can we compare the final principal component that we get after dimensional reduction to the initial data set.
We don’t, they are like new features derived from old features.
I think, we can not. PCA generates new features or we can say projections from the available set of features. It reduces the number of features, but the reduced feature set is not the subset of the original feature set.
Agreed.
Hi, Jason: Thanks for the tutorials, Always appreciate your work. Just wondering, using the same data set, is there any way we can compare the performance of dimensionality reduction between neural network-based deep Auto Encoder and the PCA. So, is it possible to do it here, or probably in another lesson next time? Thanks
Yes, prepare different inputs, fit models on them, the input that results in a model with the best performance is the most useful.
Hi Jason, Kindly do an example on PLS(Partial Least Square) in R or Python for Dimension Reduction.
Great suggestion, thanks!
A complementary resource for Principal Components Analysis, with a step-by-step explanation of the process:
https://www.neuraldesigner.com/blog/principal-components-analysis
Thanks for sharing.
And another one:
https://learnche.org/pid/latent-variable-modelling/principal-component-analysis/geometric-explanation-of-pca
Thanks for sharing.
Hi Jason,
I was taught about PCA with R and my understanding of PCA is that it helps finding about the correlation between input variables. There are libraries is R that helps at visually render the correlation between input variables. Example below:
But here in your post you don’t talk about the correlation of input variables and the possibility of representing the correlation of input variables in Python. Do you have a link or post about PCA and correlation of input variables in Python?
Thanks for all your knowledge you are sharing.
Dominique
PCA removes the linear dependence between input variables.
Yes, this may help:
https://machinelearningmastery.com/calculate-principal-component-analysis-scratch-python/
One of the main interest of filtering methods (like PCA) is to act without any further classification.
Instead of this greedy method, (1) compute cumulative variance other PCs, (2) choose a threshold to keep 80/90/95% of this and (3) select the corresponding PCs.
Then transform your data and check accuracy.
It’s much fastest and less consuming!
Great tip!
Dear Dr Jason,
Will you be covering Independent Component Analysis (‘ICA’) in a future blog. ICA can be used to separate signals for example separating many voice signals into separate components. ICA is even used in image processing to separate annoyances such as reflections from a picture – eg, you have a window reflecting light as opposed to the image behind the window.
Thank you,
Anthony of Sydney
Thanks for the suggestion. No plans yet, but I will add it to the growing list.
Sir when i run the above code it gives me error as
cross_val_score() got an unexpected keyword argument ‘error_score’
Sorry to hear that, perhaps update your libraries like scikit-learn.
Sir which algorithm for feature selection is best among PCA LDA AND RFE
This is a common question that I answer here:
https://machinelearningmastery.com/faq/single-faq/what-feature-selection-method-should-i-use
a great article so far!
I am from Bangladesh, follow your blog-post from last year.
Can you share any idea about how can I apply Segmented-PCA(SPCA) or Folded(FPCA) in python
Thanks for the suggestion, I may write about these topics in the future.
Sir please can you provide example in which feature selection or augmentation technique is applied after optimized prediction model.,
What do you mean exactly? Perhaps you can elaborate?
Dear Dr Jason,
In feature reduction methods there are methods which inform us which features were selected.
Sometimes it is an array of True and False values
I’ve tried to find a similar method for PCA to determien which ‘subset’ of all the features of X have been selected.
Is there a method to determine which features of all the features of X have been determined to be significant from X?
Thank you,
Anthony of Sydney
I give you a clear example with RFE
In other words for PCA, is there a method/methods to determine which features are significant and their ranking in the same way for RFE.
Why? If you have a several features but a parsimonious model can be explained by fewer features, how to you determine which features were selected in PCA?
Thank you,
Anthony of Sydney
PCA does not output the same features, it projects the data into a lower dimensional space. E.g. they are not the same features any more and don’t have names.
Perhaps see this tutorial:
https://machinelearningmastery.com/calculate-principal-component-analysis-scratch-python/
PCA does not select a subset, it creates a projection of the data into a new lower dimensional space.
The output cannot be related back to the input directly.
Dear Dr Jason,
I’m still not clear.
Yes I know that PCA is a projection from a higher dimension to a lower dimension.
In your latest ebook “Data Preparation For Machine Learning”, listing 29.6 uses PCA
Suppose that the model was determined using these steps.
How do we know which of the subset features of X were used, even if graphical techniques are used when PCA is used .
Thank you,
Anthony of Sydney
PCA does not select a subset of features.
It creates “new” features from the input data. This is called a projection.
Dear Dr Jason,
I used the article inspired by https://towardsdatascience.com/pca-clearly-explained-how-when-why-to-use-it-and-feature-importance-a-guide-in-python-7c274582c37e .
Using the “iris” data, I wanted to see the number of components explaining most of the variance in y.
From the above, 96% of the variation of y is explained by the first two components at 73% and 23%.
Question: how do the “new” features, that is the new components help me decide which original features of X to choose.
Thank you,
Anthony of Sydney
Dear Dr Jason,
The answer to my question is found in the first answer part 1 at https://stackoverflow.com/questions/50796024/feature-variable-importance-after-a-pca-analysis
Each row of the following matrix represents a component. For example the 0th row is the 1st PC, 1st row is the 2nd PC.
Recall that the first two PCA components explain 96% of the variation.
The 0th row = 1st PC, the 1st (0th column), 3rd and 4th features could be used
The 1st row = 2nd PC, the 2nd feature could be used (0.923).
Recall there are four features in the dataset.
On balance, ‘sepal length’, ‘petal length’ and ‘petal width’ explain most of the variation in the dataset. It appears that the ‘petal length’ does not contribute to explaining that the specimen belongs to ‘setosa’, ‘versicolor’ or ‘virginica’.
Conclusion to select which features to use:
* get the absolute value of the pca components matrix.
* knowing that the first two rows of the matrix are the first two components which explain the variation, determine which features contribute the most to the 1st component and 2nd component.
* because the 2nd component is not that significant 22% and that the 2nd feature explains the 2nd component but not the first component, don’t use it.
Thank you,
Anthony of Sydney
Dear Dr Jason,
Apologies.
Where I said
“On balance, ‘sepal length’, ‘petal length’ and ‘petal width’ explain most of the variation in the dataset. It appears that the ‘petal length’ does not contribute to explaining that the specimen belongs to ‘setosa’, ‘versicolor’ or ‘virginica’.”
I meant
“On balance, ‘sepal length’, ‘petal length’ and ‘petal width’ explain most of the variation in the dataset. It appears that the ‘se[al width’ does not contribute to explaining that the specimen belongs to ‘setosa’, ‘versicolor’ or ‘virginica’.”
Thank you,
Anthony of Sydney
The math is also explained here:
https://machinelearningmastery.com/calculate-principal-component-analysis-scratch-python/
PCA does not help you choose features in the dataset.
It reduces the dimensionality of your data by projecting the data into a lower dimensional space.
Dear Dr Jason,
Thank you for your reply.
*Yes I understand that the PCA reduces the dimensionality of your data by projecting the data into the lower dimensional space.
*Yes I have tried the calculation of PCAs from scratch on your blog.
*Yes I can see that P = vectors.T.dot(C.T) the projection/dot product of the transpose of the eigenvectors with the centred columns, we only need the first eigenvector to explain most of the variation.
*Yes the projected matrix does not tell us about which features to use. FULLY AGREE.
Maybe I should have been clearer. on pca.components_
* You can relate the principle components to the features using pca.components_
* The pca.components_ RELATES THE C
The pca.components_ is a matrix with shape n_components by n_features. That is the rows are the Principle Components and the columns are the features.
THAT IS YOU CAN FIND THE CONTRIBUTIONS OF EACH FEATURE FOR EACH PRINCIPLE COMPONENT
Conclusions:
While you cannot determine which features from PCA because it is a projection, YOU CAN RELATE THE PARTICULAR PRINCIPAL COMPONENT TO THE FEATURES!!!!
From the program: Since the first principle component, PC1 explains 76% of the variations we can conclude that features 1, 3, 4 are the most important. That is ‘sepal length (cm)’, ‘sepal width (cm)’, ‘petal width (cm)’. The ‘petal length (cm)’ is not so important.
Source/inspiration: First answer part 1 at https://stackoverflow.com/questions/50796024/feature-variable-importance-after-a-pca-analysis
Thank you,
Anthony of Sydney
Nice summary, thanks for sharing.
Dear Dr Jason,
If I have dataset with 800 samples. Each sample have 65536 features and I want to reduce these features to 1024 only. When I use PCA I have this error
ValueError: n_components=1024 must be between 0 and min(n_samples, n_features)=4 with svd_solver=’full’
Please, are you have any suggestion to help me
Thanks,
It might be too few features for PCA.
Perhaps try an alternate method?
Dear Dr Jason,
Sorry, the error message is
ValueError: n_components=1024 must be between 0 and min(n_samples, n_features)=800 with svd_solver=’full’
What can I do if the number of n_components is greater than min(n_samples, n_features)?
Thanks for help
Perhaps you can try an alternative method, such as those described here:
https://machinelearningmastery.com/dimensionality-reduction-algorithms-with-python/
Dear Dr Jason,
I have a question for the dateset in which for every feature we have 3 numeric values. For examples every feature is a point coordinates contains values of x,y,z .
In this case can we also apply PCA?
For example: I have a 100 samples with 400 features each of which contains [[[1, 8, 9]]….] or [ [[1],[8],[9]] … [[3],[5],[4]]].
Thanks in advance
Perhaps, but each axis of the coordinate would be a new “feature” to any data prep or model.
how to use pca for satellite images having 100s of images in it?
Sorry, I don’t have an example of using PCA on images.
how to do dimentionality reduction for the hyperspectral images which contains >200 bands in it?
Sorry, I don’t have experience with that use case. I cannot give you good off the cuff advice.
Hi Jason,
thanks again for always replying! I really admire you for doing all this. I ve worked through you preprocessing posts and I have a question concerning PCA: You just tune the hyperparameter concerning the components. Is it cause there is no need to tune the other ones?
Cheers for always taking care
Yes, it is a good idea to tune everything.
We focus on tuning PCA in this tutorial as the tutorial is about PCA.
Hey Jason, its me again! What I meant is if you would tune all hyperparameters (e.g iterated_power or svd_solver) of PCA or is it just important to take care of the number of components?
When focused on dimensionality reduction, we tune the number of components.
Hi Dr. Jason,
Thank you very much for your useful website. I learned a lot from you.
Does it use PCA- feature selection as a dataset(train and test reshaped data) to input in ANN neural network to predict (AC)?
I use the Lasso regression for feature selection the result is acceptable. However, I would like to use the PCA model as an alternative.
I did it, but my error has significantly increased. considering the PCA is concentrating in STD and Var, but lasso is working on coefficient.
Please let me know, the PCA feature selection could use in the supervised model such as the regression model or not?
Thanks,
Mehdi
You’re welcome.
PCA is a transform, not feature selection.
You can apply it to numerical data and use it with any model you like.
Perhaps try standardizing your data before using the transform?
Great article; thanks a lot for sharing the practical approach. I have shared my thoughts on PCA in the following article. Please feel free to take a look.
https://medium.com/analytics-vidhya/principal-component-analysis-pca-part-1-fundamentals-and-applications-8a9fd9de7596
Thanks for sharing.
Nice article! I have a question though, how important would you say the percentage of explained variance is? Let’s say we have an unsupervised task, i.e. CV is not possible. Is it generally better to keep dimensions low or explained variance high?
Luka
If you’re interested in analysis, explained variance can be a helpful tool.
If you’re focused on predictive skill only, I’m not so sure.
Hello, I have 2 questions:
1- When should we do PCA? I did the initial preprocessing on the 48 main variables and now I have 126 variables ready for modelling. Can PCA be done on these 126 variables? Or must it be run on 48 main variables?
2- Should the assumption of linearity between variables in PCA be checked? Because I did not check the assumption, but I have good accuracy. Is my model valid?
Thanks
https://stats.stackexchange.com/questions/332297/linear-relationship-between-variables-using-principal-component-analysis-pca
https://datascience.stackexchange.com/questions/93734/can-someone-clarify-what-the-linear-assumption-of-pca-is
If you’re focused on model performance (most of us are), then use PCA when it results in better performance for your dataset.
Hello Jason,
Thanks for such detailed explanation.
However I would like to know more about pca with regards to its usage for sorting the target.
What I mean to say is: if we have target like car names .. so if the dataset is of details containing the facts about cars how can we utilise pca to rank the cars?
Not sure that PCA can help in that regard.
Hello,
thank you for your intuitive article!
Is it possible to perform PCA only on some of the features?
e.g. only on 2 highly correlated features?
Thank you
Yes, you can create a submatrix from the full dataset and pass it on to PCA.
Dear Adrian,
thank you for your reply. However, if we apply PCA to only some of the features, then will they be comparable to the rest of the features?
In other words, will it be meaningful to feed into an ML algorithm some PCA transformed and some non-transformed features?
Thank you
If you apply PCA to some of the *samples*, likely it is comparable to the rest of the samples. If you apply to some of the *features*, surely cannot because we assumed the features input to PCA are mapped in some linear combination to produce the principal components. For unseen features, we have no knowledge and hence we cannot say anything from the PCA.
thank you so much
Sir for the article.
this is one of the very few sites where ML concepts we get clear explanation with an elaborate example.
Thank you Sir
You are very welcome tagore! We appreciate your feedback and support!
As PCA is called a dimensionality reduction, how would we come to know which features are important and others are not? So we can remove those features from the dataset?
Hi gul khan…The following resource should add clarity:
https://www.keboola.com/blog/pca-machine-learning
As PCA is dimensionality reduction method, How would we know about the importance of the features, e.g which features to drop and which to use?
I’ve read that PCA should be fit onto the training set, then applied to the test set using the sample components rather than applying PCA to the whole dataset to avoid data leaking. Is there any validity to this?
Option 1:
pca = PCA(n_components = 2)
pca.fit_transform(X_train)
pca.transform(X_test)
rather than
Option:
pca = PCA(n_components = 2)
pca.fit_transform(X)
Hi Johnny…The following may be of interest to you:
https://medium.com/data-science-365/how-to-avoid-data-leakage-in-data-preprocessing-f2d0357979eb
Is there a way to reduce dimensionality reduction for categorical variables?
Thanks !