The Weka machine learning workbench is so easy to use that working through a machine learning project can be a lot of fun.
In this post you will complete your first machine learning project using Weka, end-to-end. This gentle introduction to working through a project will tie together the key steps you need to complete when working through machine learning project in Weka.
After completing this project, you will know:
How to analyze a dataset and hypothesize data preparation and modeling algorithms that could be used.
How to spot check a suite of standard machine learning algorithms on a problem
How to present final results.
Kick-start your project with my new book Machine Learning Mastery With Weka, including step-by-step tutorials and clear screenshots for all examples.
Let’s get started.
Multi-Class Classification Tutorial in Weka Photo by Johan Neven, some rights reserved.
Tutorial Overview
This tutorial will gently walk you through the key steps required to complete a machine learning project.
We will work through the following process:
Load the dataset.
Analyze the dataset.
Evaluate algorithms.
Present results.
You can use this as a template for the minimum steps in the process to work through your own machine learning project using Weka.
Need more help with Weka for Machine Learning?
Take my free 14-day email course and discover how to use the platform step-by-step.
Click to sign-up and also get a free PDF Ebook version of the course.
1. Load Dataset
In this tutorial, we will use the Iris Flowers Classification dataset.
Each instance in the iris dataset describes measurements of iris flowers and the task is to predict which species of 3 iris flower the observation belongs. There are 4 numerical input variables with the same units and generally the same scale. You can learn more about the datasets in the UCI Machine Learning Repository. Top results are in the order of 96% accuracy.
1. Open the Weka GUI Chooser.
Weka GUI Chooser
2. Click the “Explorer” button to open the Weka Explorer.
3. Click the “Open file…” button, navigate to the data/ directory and select iris.arff. Click the “Open button”.
The dataset is now loaded into Weka.
Weka Load Iris Flowers Dataset
2. Analyze the Dataset
It is important to review your data before you start modeling.
Reviewing the distribution of each attribute and the interactions between attributes may shed light on specific data transforms and specific modeling techniques that we could use.
Summary Statistics
Review the details about the dataset in the “Current relation” pane. We can notice a few things:
The dataset is called iris.
There are 150 instances. If we use 10-fold cross validation later to evaluate the algorithms, then each fold will be comprised of 15 instances, which is quite small. We may want to think about using 5-folds of 30 instances instead.
There are 5 attributes, 4 inputs and 1 output variable.
There are a small number of attributes and we could investigate further using feature selection methods.
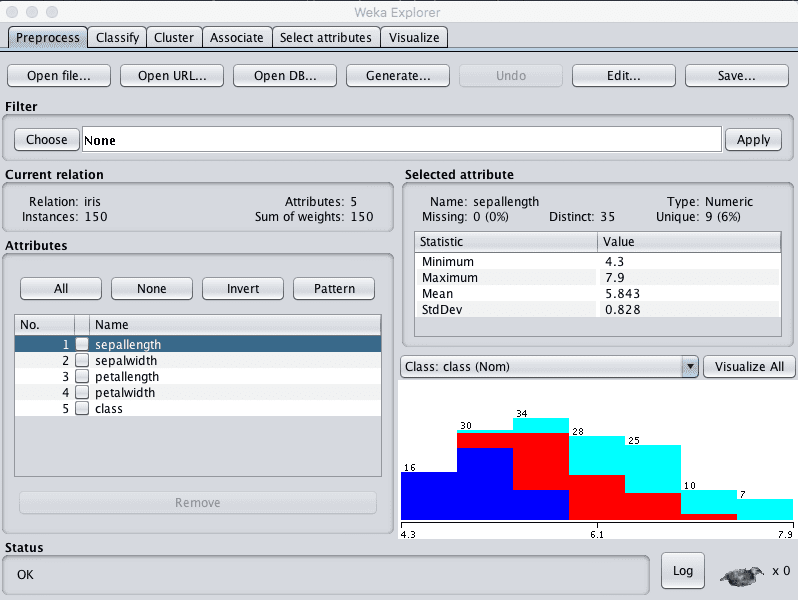
Click on each attribute in the “Attributes” pane and review the summary statistics in the “Selected attribute” pane.
We can notice a few facts about our data:
There are no missing values for any of the attributes.
All inputs are numeric and have values in the same range between about 0 and about 8.
The last attribute is the output variable called class, it is nominal and has three values.
The classes are balanced, meaning that there is an equal number of instances in each class. If they were not balanced we may want to think about balancing them.
We may see some benefit from either normalizing or standardizing the data.
Attribute Distributions
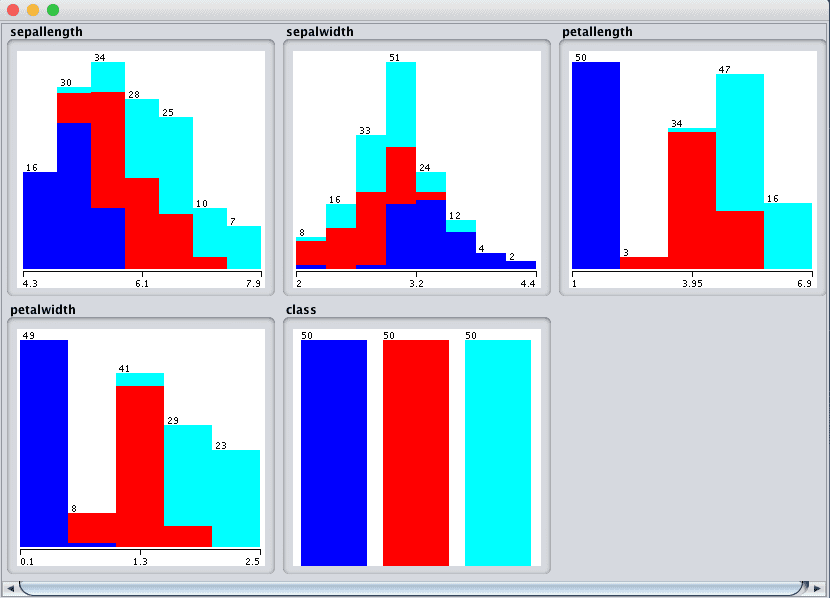
Click the “Visualize All” button and lets review the graphical distribution of each attribute.
Weka Univariate Attribute Distribution Plots
We can notice a few things about the shape of the data:
We can see overlap but differing distributions for each of the class values on each of the attributes. This is a good sign as we can probably separate the classes.
It looks like sepalwidth has a Gaussian-like distribution. If we had a lot more data, perhaps it would be even more Gaussian.
It looks like the other 3 input attributes have nearly-Gaussian distributions with a skew or a large number of observations at the low end of the distribution. Again, it makes me think that the data may be Gaussian if we had an order of magnitude more examples.
We also get a visual indication that the classes are balanced.
Attribute Interactions
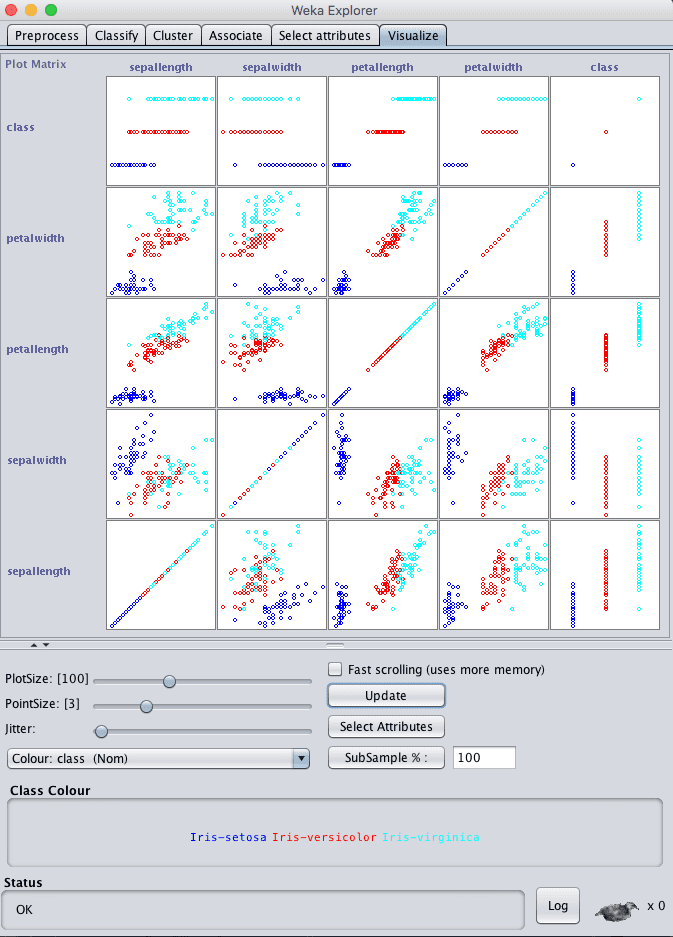
Click the “Visualize” tab and lets review some interactions between the attributes.
Increase the window size so all plots are visible.
Increase the “PointSize” to 3 to make the dots easier to see.
Click the “Update” button to apply the changes.
Weka Attribute Scatterplot Matrix
Looking across the graphs for the input variables, we can see good separation between the classes on the scatter plots. For example, petalwidth versus sepallength and petal width versus sepalwidth are good examples.
This suggest that linear methods and maybe decision trees and instance based methods may do well on this problem. It also suggest that we probably do not need to spend too much time tuning or using advanced modeling techniques and ensembles. It may be a straightforward modeling problem.
3. Evaluate Algorithms
Let’s design a small experiment to evaluate a suite of standard classification algorithms on the problem.
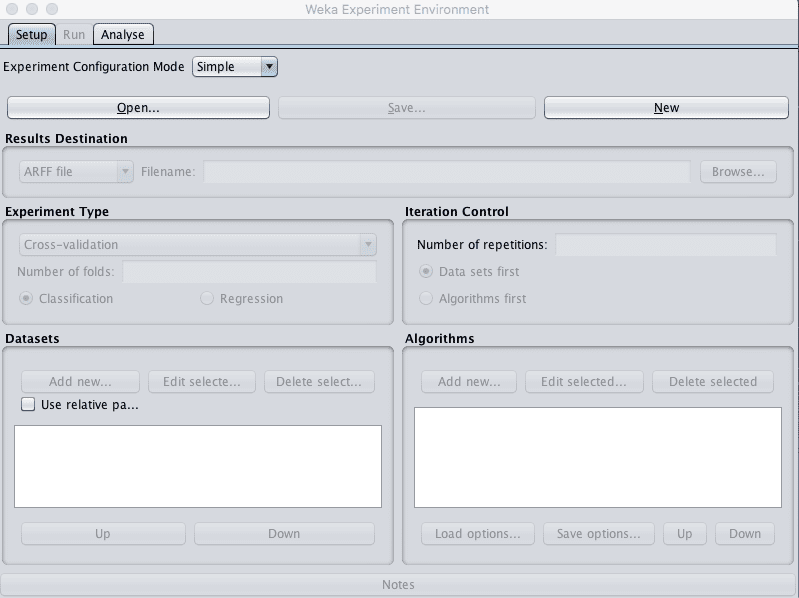
1. Close the Weka Explorer.
2. Click the “Experimenter” button on the Weka GUI Chooser to launch the Weka Experiment Environment.
Weka Experiment Environment
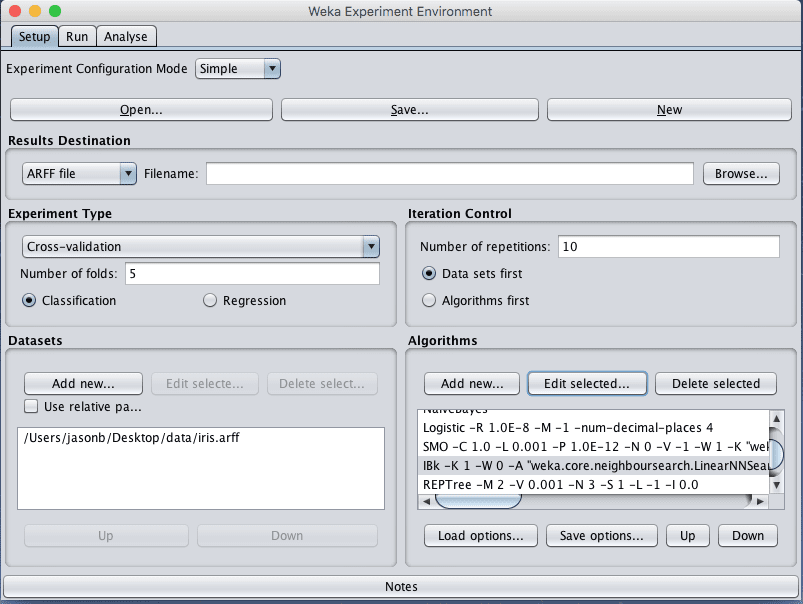
3. Click “New” to start a new experiment.
4. In the “Experiment Type” pane change the “Number of folds” from “10” to “5”.
5. In the “Datasets” pane click “Add new…” and select data/iris.arff in your Weka installation directory.
6. In the “Algorithms” pane click “Add new…” and add the following 8 multi-class classification algorithms:
rules.ZeroR
bayes.NaiveBayes
functions.Logistic
functions.SMO
lazy.IBk
rules.PART
trees.REPTree
trees.J48
7. Select IBK in the list of algorithms and click the “Edit selected…” button.
8. Change “KNN” from “1” to “3” and click the “OK” button to save the settings.
Weka Designed Algorithm Comparison Experiment
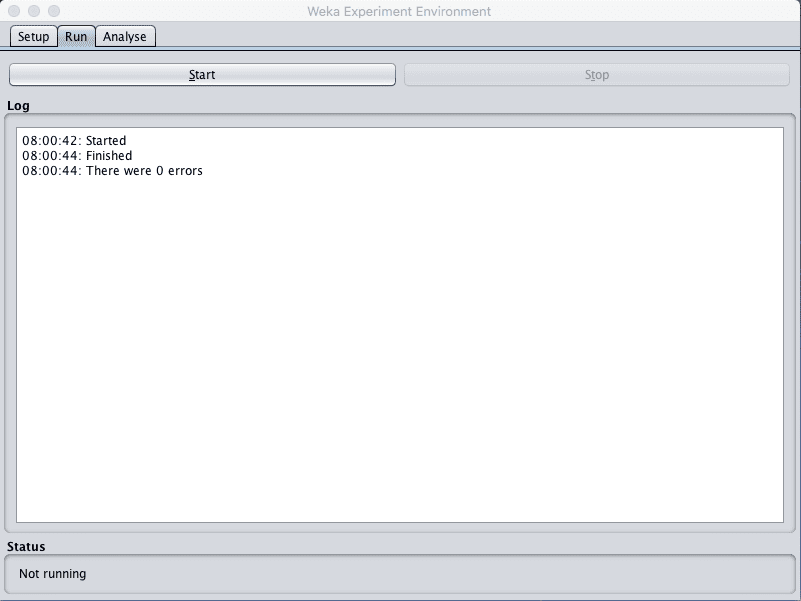
9. Click on “Run” to open the Run tab and click the “Start” button to run the experiment. The experiment should complete in just a few seconds.
Weka Execute Weka Algorithm Comparison Experiment
10. Click on “Analyse” to open the Analyse tab. Click the “Experiment” button to load the results from the experiment.
Weka Load Algorithm Comparison Experiment Results
11. Click the “Perform test” button to perform a pairwise test comparing all of the results to the results for ZeroR.
We can see that all of the models have skill. Each model has a score that is better than ZeroR and the difference is statistically significant.
The results suggest both Logistic Regression and SVM achieved the highest accuracy. If we were to pick between the two, we would choose Logistic Regression if for no other reason that it is a much simpler model. Let’s compare all of the results to the Logistic Regression results as the test base.
12. Click “Select” for the “Test base”, select “functions.Logistic” and click the “Select” button to choose the new test base. Click the “Perform test” button again to perform the new analysis.
We now see a very different story. Although the results for Logistic look better, the analysis suggests that the difference between these results and the results from all of the other algorithms are not statistically significant.
From here we could choose an algorithm based on other criteria, like understandability or complexity. From this perspective Logistic Regression and Naive Bayes are good candidates.
We could also seek to further improve the results of one or more of these algorithms and see if we can achieve a significant improvement. If we change the “Significance” to less constraining values of 0.50, we can see that the tree and KNN algorithms start to drop away. This suggests we could spend more time on the remaining methods. Change “significance” back to “0.05”.
Let’s choose to stick with Logistic Regression. We can collect some numbers we can use to describe the performance of the model on unseen data.
13. Check “Show std. deviations” to show standard deviations of accuracy scores.
14. Click the “Select” button for “Displayed Columns” and choose “functions.Logistic”, click “Select” to accept the selection. This will only show the results for the Logistic Regression algorithm.
15. Click “Perform test” to rerun the analysis.
We now have a final result we can use to describe our model.
We can see that the estimated accuracy of the model on unseen data is 96.33% with a standard deviation of 3.38%.
4. Finalize Model and Present Results
We can create a final version of our model trained on all of the training data and save it to file.
1. Close the Weka Experiment Environment.
2. Open the Weka Explorer and load the data/iris.arff dataset.
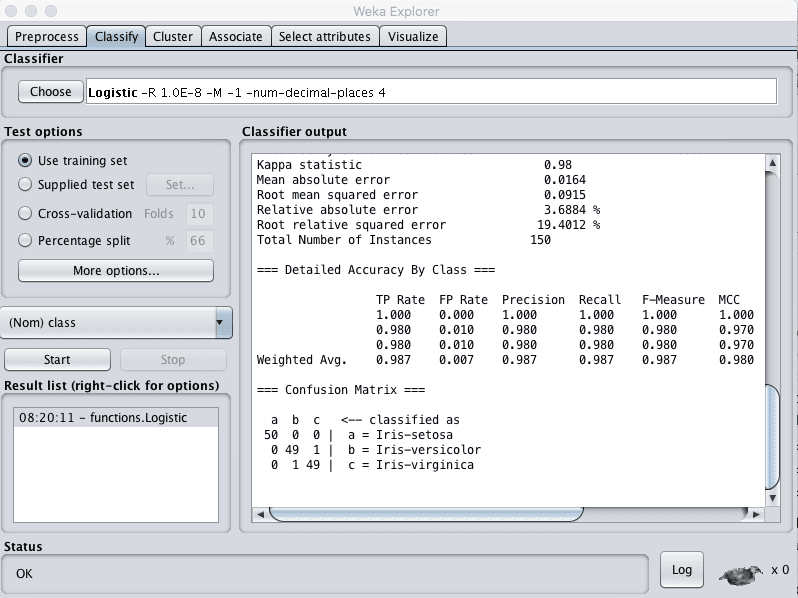
3. Click on the Classify tab.
4. Select the functions.Logistic algorithm.
5. Change the “Test options” from “Cross Validation” to “Use training set”.
6. Click the “Start” button to create the final model.
Weka Train Finalized Model on Entire Training Dataset
7. Right click on the result item in the “Result list” and select “Save model”. Select a suitable location and type in a suitable name, such as “iris-logistic” for your model.
This model can then be loaded at a later time and used to make predictions on new flower measurements.
We can use the mean and standard deviation of the model accuracy collected in the last section to help quantify the expected variability in the estimated accuracy of the model on unseen data.
For example, we know that 95% of model accuracies will fall within two standard deviations of the mean model accuracy. Or, restated in a way we can explain to other people, we can generally expect that the performance of the model on unseen data will be 96.33% plus or minus 2 * 3.38 or 6.76, or between 87.57% and 100% accurate.
You can learn more about using the mean and standard deviation of a Gaussian distribution in the Wikipedia page titled 68–95–99.7 rule.
Summary
In this post you completed your first machine learning project end-to-end using the Weka machine learning workbench.
Specifically, you learned:
How to analyze your dataset and suggest at specific data transform and modeling techniques that may be useful.
How to spot check a suite of algorithms on the problem and analyze their results.
How to finalize the model for making predictions on new data and presenting the estimated accuracy of the model on unseen data.
Do you have any questions about running a machine learning project in Weka or about this post? Ask your questions in the comments and I will do my best to answer them.
Thank you very much for the post. i learned a great deal from it.
Could you please tell me if I can use Weka for Multi class classification of EEG signals? I have three datasets that contain brain-signals of a healthy person, and the rest are of patient’s signals with seizure and without seizure.
I did binary classification for the above mentioned analysis and used classes, ‘normal’ and ‘seizure’. Now I want to take it further by multi class classification. Which of the algorithms should I consider as I’m don’t have nay background for data mining and machine learning. Being a novice I would appreciate any suggestion or help.
Weka does support multi-class classification. I’m not sure about the specific of your problem, you may need to prepare data to make it a suitable supervised learning problem and organize the data into CSV or ARFF files.
thanks for this helpful article. Your Blog is great to get into Machine Learning.
The only thing in this article which i don’t understand is step 3.12 respectively the conclusion you draw from this. Could you explain this a bit more?
“We now see a very different story. Although the results for Logistic look better, the analysis suggests that the difference between these results and the results from all of the other algorithms are not statistically significant.”
How do i see that it is a complete different story? For me it looks very similar. Where do i see the statistical significance?
Sir,
I am new in machine learning techniques. I used Weka 3.9.0 for multi class classification and I got the result.I saved the trained model. But I actually need to use the trained model in my project (using Visual Studio C++). I have some images,each image is divided into different blocks.What I need to do is to select the first block and find out the class it belongs using the trained model, then select the next block and do the same and so on.
Sir, could you plz suggest a solution for this? I m totally stuck in this step. I searched a lot but didn’t get a solution.
Some ideas:
– perhaps use the Java API for Weka and integrate that into your Cpp project.
– perhaps use a cpp machine learning API instead.
– perhaps implement the model you want to use from scratch in your Cpp project.
Thank you for your consideration and reply. Sir, now I m trying to do machine learning using some other packages for c++.
Hope it will works.
Once again thanks…
I’m working on a project that rank resumes.I have used weka for machine learning i.e training of Resumes.
I made a model of 100 resumes initially for a single job type.
My class variable is suitablity that rank Resumes either good average or poor.
Now if I want to make a single model for different job types I will need multi class classification.??
How can I define more than one class label in Weka??
Weldone Dr. Jason. I found you post helpful to me as new to Machine Language. My problem is I tried to save the the result model but I can’t. Always it used to show me command java.io.FileNotFoundException: C:\Program File ………… (Access is denied). Sir, I am in need of your help for what to do.
Hi Jason, well explained article.
I wanted to ask whether it is possible to build a model from a dataset having only 1instance of every class (it is multi class classification problem) in weka?
Secondly, can we have a dataset with an instance having n attributes and another instance having less than or more than n attributes and build model from it?
And can you suggest a site where I can get a dataset mapping a set of symptoms with its associated disease? I’ve checked UCI ML Repository, kaggle but no luck.
Thanks in advance.
hi
i have a multiclass(3 classes) imbalanced data set and i want to use Weka to balance it. how can i do that? is it suitable for me to use one versus one or one versus all algorithm? or should i use smote or random undersampling algorithms. i am beginner in machine learning and weka. i will be so happy if you help me. thanks in advance
I want to ask if is it possible to convert a binary classifier label (y) by applying some condition on column1 to get a third situation.
I.e. Instead of having just 2 cases “Easy” and “Difficult” as output, I need to apply a condition on an additional feature in order to get as output “Easy”, “Normal”, “Difficult”.
I found that the multi-class is generally applied in supervised learning. Is it possible to perform a multi-class in the framework of unsupervised learning (clustering).
I need to classify my data in multi-class.
Can you direct me to a scientific article or to an example.
I have a multi-class problem. I want to solve this problem using the LCPN (Local Classifier per Parent Node) method of heirachical classification. Therefore, I have manually divided the original dataset into a hierarchy of 2 levels. Level 1 has, 4 parent classes & each of the parent classes have child classes.
I built the model for level 1 classification & received quite good results. Based on the predictions of level 1, now I want to send the instances that were classified as class 1, to a second classifier that distinguishes between the child labels of class 1. Likewise, I want to repeat this process for the other parent classes as well. I’m mainly doing this to avoid, inconsistency problem associated with LCPN.
This is what I have mainly done so far.
X = data_frame.drop([‘region’], axis = 1) # Features
y = data_frame[‘region’] # Labels
X_train, X_test, y_train, y_test = train_test_split(X, y, test_size=0.3, random_state=42)
sm = SMOTE()
X_resampled, y_resampled = sm.fit_sample(X_train, y_train)
model = DecisionTreeClassifier().fit(X_resampled, y_resampled)
print(classification_report_imbalanced(y_test, predictions))
I’m bit struggling finding a way how to proceed further with the second level of classification, based on the predictions of level 1. Can you suggest me a way to do this.
In this case, under the parent classifier there are 4 sub classifiers. The features & labels for each sub classifier would be different. Also the labels for the sub classifiers are imbalanced.
At the parent classifier stage I already performed train test split and oversampled the X_train & y_train. My problem is for each of the sub classifiers:
1. do I have to perform train test split again?
2. or whether without performing train test split do i have to use the previously resampled
dataset at the parent classifier stage
3. how to define the features, labels & the test set for each sub classifier?
4. do I have to oversample the labels again because they are imbalanced?
What I want to do is to send the instances that were classified as class 1 by the parent classifier, to sub classifier 1 and so on.
Thanks. Actually what I want to solve a hierarchical classification. My approach is to:
1. Train a classifier for children of each node in the hierarchy tree. for example classifier
number 1 classify items between parent category 1 and parent category 2.
2. Then train a classifier with items of parent category 1 that classify between items between
subcategory1, subcategory2 and suncategory3. and so on.
In the 2nd step, in order to train a classifier with items of parent category 1, from where do I have to get the instances that belong to parent category 1? Is it from the previously resampled dataset or from or the original X_train?
1. divide the entire dataset into train set(70%) and test set(30%)
2. oversample the training set (since it’s imbalanced)
3. train the parent classifier using the resampled training set & test it on the entire test set
for each of the 4 sub classifiers under the parent classifier,
4. take the resampled training set (the dataset obtained after resampling, at step 2. )
5. filter the instances that belong only to the particular sub classifier. Because the resampled
dataset has instances that belong to all the 4 sub classifiers.
6. create a dataset using those instances. Including features & labels.
7. split the created dataset, into sub-training(70%) and sub-test set(30%)
8. oversample the sub-training set (because the classes are imbalanced)
9. train the model with the oversampled sub-training set at step 8., & test it using the sub-test set


Thank you very much for the post. i learned a great deal from it.
Could you please tell me if I can use Weka for Multi class classification of EEG signals? I have three datasets that contain brain-signals of a healthy person, and the rest are of patient’s signals with seizure and without seizure.
I did binary classification for the above mentioned analysis and used classes, ‘normal’ and ‘seizure’. Now I want to take it further by multi class classification. Which of the algorithms should I consider as I’m don’t have nay background for data mining and machine learning. Being a novice I would appreciate any suggestion or help.
I’m glad to hear that Pragya.
Weka does support multi-class classification. I’m not sure about the specific of your problem, you may need to prepare data to make it a suitable supervised learning problem and organize the data into CSV or ARFF files.
We cannot know which algorithms will work best on a problem, we must use trial and error to discover what works best. See this post for more information:
https://machinelearningmastery.com/a-data-driven-approach-to-machine-learning/
Hi Jason,
thanks for this helpful article. Your Blog is great to get into Machine Learning.
The only thing in this article which i don’t understand is step 3.12 respectively the conclusion you draw from this. Could you explain this a bit more?
What questions do you have exactly Matt?
“We now see a very different story. Although the results for Logistic look better, the analysis suggests that the difference between these results and the results from all of the other algorithms are not statistically significant.”
How do i see that it is a complete different story? For me it looks very similar. Where do i see the statistical significance?
Hi Matt, this post might help you better understand the Experiment and the statistical significance reported in the results:
https://machinelearningmastery.com/compare-performance-machine-learning-algorithms-weka/
Sir,
I am new in machine learning techniques. I used Weka 3.9.0 for multi class classification and I got the result.I saved the trained model. But I actually need to use the trained model in my project (using Visual Studio C++). I have some images,each image is divided into different blocks.What I need to do is to select the first block and find out the class it belongs using the trained model, then select the next block and do the same and so on.
Sir, could you plz suggest a solution for this? I m totally stuck in this step. I searched a lot but didn’t get a solution.
Hi Preethi,
Some ideas:
– perhaps use the Java API for Weka and integrate that into your Cpp project.
– perhaps use a cpp machine learning API instead.
– perhaps implement the model you want to use from scratch in your Cpp project.
I hope that helps as a start.
Thank you for your consideration and reply. Sir, now I m trying to do machine learning using some other packages for c++.
Hope it will works.
Once again thanks…
I’d love to hear how you go Preethi, and what packages you choose.
Hai Sir..
I just googled and I got some information about the packages such as dlib, shogun and shark. But now I am doing ml using opencv.
I’m working on a project that rank resumes.I have used weka for machine learning i.e training of Resumes.
I made a model of 100 resumes initially for a single job type.
My class variable is suitablity that rank Resumes either good average or poor.
Now if I want to make a single model for different job types I will need multi class classification.??
How can I define more than one class label in Weka??
Sorry, I don’t think weka suppoer multi-label classification.
Weldone Dr. Jason. I found you post helpful to me as new to Machine Language. My problem is I tried to save the the result model but I can’t. Always it used to show me command java.io.FileNotFoundException: C:\Program File ………… (Access is denied). Sir, I am in need of your help for what to do.
I’m sorry to hear that, perhaps you can try re-installing Weka?
Hi Jason, well explained article.
I wanted to ask whether it is possible to build a model from a dataset having only 1instance of every class (it is multi class classification problem) in weka?
Secondly, can we have a dataset with an instance having n attributes and another instance having less than or more than n attributes and build model from it?
And can you suggest a site where I can get a dataset mapping a set of symptoms with its associated disease? I’ve checked UCI ML Repository, kaggle but no luck.
Thanks in advance.
No, I don’t think that would not be enough data.
No, instances need to be normalized to have the same and types of features in the same order.
I hope that helps.
Thank you.
Could you suggest how to go about normalizing my instances..?
See this post:
https://machinelearningmastery.com/normalize-standardize-machine-learning-data-weka/
Thanks
I’m glad it helped.
hi
i have a multiclass(3 classes) imbalanced data set and i want to use Weka to balance it. how can i do that? is it suitable for me to use one versus one or one versus all algorithm? or should i use smote or random undersampling algorithms. i am beginner in machine learning and weka. i will be so happy if you help me. thanks in advance
I have some ideas in this post that might help:
https://machinelearningmastery.com/tactics-to-combat-imbalanced-classes-in-your-machine-learning-dataset/
Hi Jason,
I want to ask if is it possible to convert a binary classifier label (y) by applying some condition on column1 to get a third situation.
I.e. Instead of having just 2 cases “Easy” and “Difficult” as output, I need to apply a condition on an additional feature in order to get as output “Easy”, “Normal”, “Difficult”.
Yes, this is called a multi-class classification problem.
You can see an example of working through a multi-class classification problem here:
https://machinelearningmastery.com/how-to-run-your-first-classifier-in-weka/
Hello
I found that the multi-class is generally applied in supervised learning. Is it possible to perform a multi-class in the framework of unsupervised learning (clustering).
I need to classify my data in multi-class.
Can you direct me to a scientific article or to an example.
Thank you
Not really.
is there a way to visualize the classes assigned to the samples.
(This only provides clustering evaluations)
Can we generate java code from GUI?
Yes, you can create a scatter plot of two variables at a time and color the points by class.
You can also project the features using PCA and color the points by class.
Have you please a scientific article an example gor multi class clustering
I do not, sorry, perhaps try searching on google scholar?
Hi
I have a multi-class problem. I want to solve this problem using the LCPN (Local Classifier per Parent Node) method of heirachical classification. Therefore, I have manually divided the original dataset into a hierarchy of 2 levels. Level 1 has, 4 parent classes & each of the parent classes have child classes.
I built the model for level 1 classification & received quite good results. Based on the predictions of level 1, now I want to send the instances that were classified as class 1, to a second classifier that distinguishes between the child labels of class 1. Likewise, I want to repeat this process for the other parent classes as well. I’m mainly doing this to avoid, inconsistency problem associated with LCPN.
This is what I have mainly done so far.
X = data_frame.drop([‘region’], axis = 1) # Features
y = data_frame[‘region’] # Labels
X_train, X_test, y_train, y_test = train_test_split(X, y, test_size=0.3, random_state=42)
sm = SMOTE()
X_resampled, y_resampled = sm.fit_sample(X_train, y_train)
model = DecisionTreeClassifier().fit(X_resampled, y_resampled)
print(classification_report_imbalanced(y_test, predictions))
I’m bit struggling finding a way how to proceed further with the second level of classification, based on the predictions of level 1. Can you suggest me a way to do this.
Thanks
San
Sorry, I don’t have an example of multi-level classification.
In this case, under the parent classifier there are 4 sub classifiers. The features & labels for each sub classifier would be different. Also the labels for the sub classifiers are imbalanced.
At the parent classifier stage I already performed train test split and oversampled the X_train & y_train. My problem is for each of the sub classifiers:
1. do I have to perform train test split again?
2. or whether without performing train test split do i have to use the previously resampled
dataset at the parent classifier stage
3. how to define the features, labels & the test set for each sub classifier?
4. do I have to oversample the labels again because they are imbalanced?
What I want to do is to send the instances that were classified as class 1 by the parent classifier, to sub classifier 1 and so on.
Thanks
San
I think you’re describing an ensemble of models.
No, train/test split occurs at the highest level, as does feature selection and any other transforms of the data.
Thanks. Actually what I want to solve a hierarchical classification. My approach is to:
1. Train a classifier for children of each node in the hierarchy tree. for example classifier
number 1 classify items between parent category 1 and parent category 2.
2. Then train a classifier with items of parent category 1 that classify between items between
subcategory1, subcategory2 and suncategory3. and so on.
In the 2nd step, in order to train a classifier with items of parent category 1, from where do I have to get the instances that belong to parent category 1? Is it from the previously resampled dataset or from or the original X_train?
Thanks
San
I’m not sure if Weka if flexible enough for this type of problem. Perhaps post to the weka user group?
Thanks. I want to do with python. Do you know anyway to do it with python?
Yes, I believe you could code something like this in Python.
Is it okay to solve the above problem like this?
1. divide the entire dataset into train set(70%) and test set(30%)
2. oversample the training set (since it’s imbalanced)
3. train the parent classifier using the resampled training set & test it on the entire test set
for each of the 4 sub classifiers under the parent classifier,
4. take the resampled training set (the dataset obtained after resampling, at step 2. )
5. filter the instances that belong only to the particular sub classifier. Because the resampled
dataset has instances that belong to all the 4 sub classifiers.
6. create a dataset using those instances. Including features & labels.
7. split the created dataset, into sub-training(70%) and sub-test set(30%)
8. oversample the sub-training set (because the classes are imbalanced)
9. train the model with the oversampled sub-training set at step 8., & test it using the sub-test set
I cannot debug your process. Perhaps try it and see?