Naive Bayes is a simple and powerful technique that you should be testing and using on your classification problems.
It is simple to understand, gives good results and is fast to build a model and make predictions. For these reasons alone you should take a closer look at the algorithm.
In a recent blog post, you learned how to implement the Naive Bayes algorithm from scratch in python.
In this post you will learn tips and tricks to get the most from the Naive Bayes algorithm.
Kick-start your project with my new book Master Machine Learning Algorithms, including step-by-step tutorials and the Excel Spreadsheet files for all examples.

Better Naive Bayes
Photo by Duncan Hull, some rights reserved
1. Missing Data
Naive Bayes can handle missing data.
Attributes are handled separately by the algorithm at both model construction time and prediction time.
As such, if a data instance has a missing value for an attribute, it can be ignored while preparing the model, and ignored when a probability is calculated for a class value.
2. Use Log Probabilities
Probabilities are often small numbers. To calculate joint probabilities, you need to multiply probabilities together. When you multiply one small number by another small number, you get a very small number.
It is possible to get into difficulty with the precision of your floating point values, such as under-runs. To avoid this problem, work in the log probability space (take the logarithm of your probabilities).
This works because to make a prediction in Naive Bayes we need to know which class has the larger probability (rank) rather than what the specific probability was.
Get your FREE Algorithms Mind Map
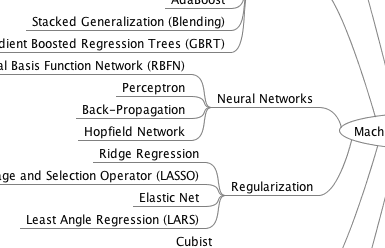
Sample of the handy machine learning algorithms mind map.
I've created a handy mind map of 60+ algorithms organized by type.
Download it, print it and use it.
Also get exclusive access to the machine learning algorithms email mini-course.
3. Use Other Distributions
To use Naive Bayes with categorical attributes, you calculate a frequency for each observation.
To use Naive Bayes with real-valued attributes, you can summarize the density of the attribute using a Gaussian distribution. Alternatively you can use another functional form that better describes the distribution of the data, such as an exponential.
Don’t constrain yourself to the distributions used in examples of the Naive Bayes algorithm. Choose distributions that best characterize your data and prediction problem.
4. Use Probabilities For Feature Selection
Feature selection is the selection of those data attributes that best characterize a predicted variable.
In Naive Bayes, the probabilities for each attribute are calculated independently from the training dataset. You can use a search algorithm to explore the combination of the probabilities of different attributes together and evaluate their performance at predicting the output variable.
5. Segment The Data
Is their a well-defined subset of your data that responds well to the the Naive Bayes probabilistic approach?
Identifying and separating out segments that are easily handled by a simple probabilistic approach like Naive Bayes can give you increase performance and focus on the elements of the problem that are more difficult to model.
Explore different subsets, such as as the average or popular cases that are very likely handled well by Naive Bayes.
6. Re-compute Probabilities
Calculate the probabilities for each attribute is very fast.
This benefit of Naive Bayes means that you can re-calculate the probabilities as the data changes. This may be monthly, daily, even hourly.
This is something that may be unthinkable for other algorithms, but should be tested when using Naive Bayes if there is some temporal drift in the problem being modeled.
7. Use as a Generative Model
The Naive Bayes method characterizes the problem, which in turn can be used for making predictions about unseen data.
This probabilistic characterization can also be used to generate instances of the problem.
In the case of a numeric vector, the probability distributions can be sampled to create new fictitious vectors.
In the case of text (a very popular application of Naive Bayes), the model can be used to create fictitious input documents.
How might this be useful in your problem?
At the very least you can use the generative approach to help provide context for what the model has characterized.
8. Remove Redundant Features
The performance of Naive Bayes can degrade if the data contains highly correlated features.
This is because the highly correlated features are voted for twice in the model, over inflating their importance.
Evaluate the correlation of attributes pairwise with each other using a correlation matrix and remove those features that are the most highly correlated.
Nevertheless, always test your problem before and after such a change and stick with the form of the problem that leads to the better results.
9. Parallelize Probability Calculation
The probabilities for each attribute are calculated independently. This is the independence assumption in the approach and the reason why it has it’s name “naive”.
You can exploit this assumption to further speed up the execution of the algorithm by calculating attribute probabilities in parallel.
Depending on the size of the dataset and your resources, you could do this using different CPUs, different machines or different clusters.
10. Less Data Than You Think
Naive Bayes does not need a lot of data to perform well.
It needs enough data to understand the probabilistic relationship of each attribute in isolation with the output variable.
Given that interactions between attributes are ignored in the model, we do not need examples of these interactions and therefore generally less data than other algorithms, such as logistic regression.
Further, it is less likely to overfit the training data with a smaller sample size.
Try Naive Bayes if you do not have much training data.
11. Zero Observations Problem
Naive Bayes will not be reliable if there are significant differences in the attribute distributions compared to the training dataset.
An important example of this is the case where a categorical attribute has a value that was not observed in training. In this case, the model will assign a 0 probability and be unable to make a prediction.
These cases should be checked for and handled differently. After such cases have been resolved (an answer is known), the probabilities should be recalculated and the model updated.
12. It Works Anyway
An interesting point about Naive Bayes is that even when the independence assumption is violated and there are clear known relationships between attributes, it works anyway.
Importantly, this is one of the reasons why you need to spot check a variety of algorithms on a given problem, because the results can very likely surprise you.
Summary
In this post you learned a lot about how to use and get more out of the Naive Bayes algorithm.
Do you have some tricks and tips for using Naive Bayes not covered in this post Leave a comment.
Discover How Machine Learning Algorithms Work!
See How Algorithms Work in Minutes
...with just arithmetic and simple examples
Discover how in my new Ebook:
Master Machine Learning Algorithms
It covers explanations and examples of 10 top algorithms, like:
Linear Regression, k-Nearest Neighbors, Support Vector Machines and much more...
Finally, Pull Back the Curtain on
Machine Learning Algorithms
Skip the Academics. Just Results.


Great post! Very informative. Thanks a lot. 🙂
Fantastic! Thank you
Do you have any suggestions to handle the zero-observation problem? Currently I am using Laplacian correction
Small thing. I think you meant “join[t]” probabilities in section 2.
Thanks Matt, fixed.
Hello Dr. Jason,
Thank you very much for your contribution for computing environment,
I’m following your information every day.
I have one unclear idea concerning naive Bayes, I used to train and test the algorithm with the same data-set but the accuracy is not 100%. why it doesn’t so?
The algorithm is implemented with python with help of your posts, and I used to train the algorithm with SEER cancer data after careful preparation; again I used for the testing the same file with the separate calling, the accuracy yet not 100%.
Thank you!
Great question, I answer it here:
https://machinelearningmastery.com/faq/single-faq/why-cant-i-get-100-accuracy-or-zero-error-with-my-model
Oh! I almost miss this, Thank God, found it now 🙂
I’m glad ou found the post useful Matthew.
Thanks for the explanation on how to improve on Naive Bayes Jason. I read through your posts on Naive Bayes, but I’m not entirely sure on the disadvantages of using the algorithm. I searched around on possible disadvantages, such as poor estimator, works poorly with highly correlated features, etc., but is it possible that features with similar means and standard deviations could cause the algorithm to perform poorly?
Hi Joseph,
The main limitation is that the algorithm does not capture the joint distributions of input variables. That is, any interesting and useful interactions between input features and their contribution to the output variable. The so-called independence assumption of naive bayes.
You could contrive a dataset where the joint distribution of two contrived variables is needed to make accurate predictions and show when naive bayes falls down.
I hope that helps.
I apologize for the late reply. Thank you for the explanation. That did help.
I’m glad to hear it Joseph.
Hi Jason:
I get stuck with a problem when doing text classifications using native bayes:
There are more than 3000 samples in trainset and more than 750 samples in testset.
And the samples should be classified into 95 categories. And i got 39% accuracy finally.
How can i improve the accuracy. Increase trainning samples? or decrease categories?
Thanks!
With so many categories, I expect accuracy does not mean anything any more johnson.
Consider log loss or AUC instead?
Thanks for your reply.
I searched google, someone suggests that use so called “one-against-many” scheme.
I tried, but when categories grows, the accurary declines very quickly.
Can you give an example of log loss or AUC?
Thanks!
one-against-many: you begin with a two-class classifier (Class A and ‘all else’) then the results in the ‘all else’ class are returned to the algorithm for classification into Class B and ‘all else’, etc.
A one-vs-all or similar is the structure of the model, not the performance measure.
If you are using Python, then sklearn offers implementations of a suite of metrics:
http://scikit-learn.org/stable/modules/classes.html#sklearn-metrics-metrics
Thanks.
I use python, and i tried metrics. I changed the number of category to 30, and got
this:
precision recall f1-score support
25 0.48 1.00 0.65 372
26 0.00 0.00 0.00 22
27 0.00 0.00 0.00 1
20 0.00 0.00 0.00 4
21 0.00 0.00 0.00 4
22 0.00 0.00 0.00 13
23 0.00 0.00 0.00 60
28 0.00 0.00 0.00 21
29 0.00 0.00 0.00 39
1 0.00 0.00 0.00 7
0 0.00 0.00 0.00 17
3 0.00 0.00 0.00 25
2 0.00 0.00 0.00 15
5 0.00 0.00 0.00 7
4 0.00 0.00 0.00 13
7 0.00 0.00 0.00 2
6 0.00 0.00 0.00 6
9 0.00 0.00 0.00 2
8 0.00 0.00 0.00 31
11 0.00 0.00 0.00 29
10 0.00 0.00 0.00 20
13 0.60 0.60 0.60 5
12 0.00 0.00 0.00 4
15 0.00 0.00 0.00 7
14 0.00 0.00 0.00 11
17 0.00 0.00 0.00 24
16 0.00 0.00 0.00 9
19 0.00 0.00 0.00 15
18 0.00 0.00 0.00 1
avg / total 0.23 0.48 0.31 786
Hang in there!
why my comment always gets lost?
Thanks jason.
use log loss or AUC in native bayes?
Could you give me an example for it?
Thanks a lot!
I moderate comments, I do it every 24 hours.
Awesome, to make the result more accurate. Thanks for putting all the loophole of Naive Bayes at a single place.
I’m glad it helped.
It was tough initially. Now I got a clear pic of Navie Bayes . Can you give some practical example of Remove redundant feature.
Thank you .
See this post:
https://machinelearningmastery.com/an-introduction-to-feature-selection/
Hello Mr.Jason
If I remove one feature that has the same value of another feature should I retrain the model ?
Yes.
Great , It helped a lot.
Thanks, glad to hear that.
Hi,
what could be the alpha value range in Naive Bayes algorithm for smoothing? Why can’t we apply Naive Bayes on negative values?
Hello Dr. Jason,
Can I apply log-loss metric on naive bayes model performance while using log-probabilities because if we use log-probabilities then it gives real values but log-loss expects values from [0,1].
I don’t follow, what is the problem you are having exactly?
Hi,
The model has feature vectors with both label 0 and 1. I want to use Naive Bayes to predict a feature given positive labels, say 0. How to do that?
I would recommend using sklearn:
http://scikit-learn.org/stable/modules/classes.html#module-sklearn.naive_bayes
Hello, thank you for your great post.
I have an unrelated question about Naive Bayes: How can I predict unknown class with Naive Bayes? For example, only class A, B and C are trained. The data to be predicted has a class different than A, B and C. How can we calculate the probability to identify such case?
Thanks in advance
Once your model is fit, you can use model.predict()
Perhaps this will help:
https://machinelearningmastery.com/make-predictions-scikit-learn/
I was intrigued by the comment about numerical underflow, so I generated a series of non-zero pseudo-random numbers averaging 1% (range 0% to 2%) and compared the product to the exponential of the sum of the natural logarithms. When reaching about 133 of these values the product underflows using 64-bit (double-precision) floating point numbers, whilst the sum of the logarithms is fine.
The smallest non-zero 64-bit float is approx 2e-308, my random values had an average ln of -5.3, ln(2e-308)/5.3 = 133 and indeed the product then becomes at the count.
So this helps us quantify when this problem might occur and when the CPU overhead of using logarithms only becomes worthwhile (say over 100+ input variables for 64-bit floats, and only 16 inputs for 32-bit floats).
Nice one!
It’s almost a golden rule to work with log probs when modeling, and to add an epsilon when logging a probability.
thx a lot, I have a question and hope for your help.
I collected data with multiple features and multiclass some features are redundant in class and different from others, e.g. features value [2,2,2] for class A, [3,3,3] for class B, and so on.
so the variance should be 0 so how Gaussian naive Bayes algorithm work
I tried to run my program and it gave me a good performance but I don’t know how?
You can learn how gaussian naive bayes works here:
https://machinelearningmastery.com/classification-as-conditional-probability-and-the-naive-bayes-algorithm/
thank you so much. I read it and it is so useful but still don’t have a solution to my problem.
when I checked my program I found the default standard deviation given if it is 0 value but don’t know how right am i.. please help me if you have any idea..
If the standard deviation is zero it suggests the column has a single value and can probably be removed.
no, the column with different values but static with a class and really it gave high accuracy.. please I have other questions 1- can I plot ROC with Gaussian naive Bayes multiclass ..2- can I change theta and epsilon of Gaussian Naive Bayes ..
I appreciated your help thanks a lot.
No, ROC is for binary (2 class) classification problems.
The mean and stdev for a variable used in naive bayes is only for real-valued variables and is estimated from the training dataset.
ok Mr, Jason thank you so much
You’re welcome.
how to find most contributing attribute of a naive bayes model in python.
As always, by testing! Try varying some parameters in the model with the same input, and see how its performance metric varies.
Can we use Naive bays for a problem where we are getting input features values one by one and we want to update the prediction as we get more information?
It sounds possible!
Thank you Jason for this fantastic write up. I have a challenge .what if Each feature has a different distribution exponential, guassian etc how do I handle that in Naive Bayes?
Hi Peter…It may be beneficial to consider deep learning and neural networks in that case.
https://machinelearningmastery.com/binary-classification-tutorial-with-the-keras-deep-learning-library/